Hydrated lithium intercalation into the Kitaev spin liquid candidate material RuCl3
Abstract
We study on transport and magnetic properties of hydrated and lithium-intercalated -RuCl3, LixRuClH2O, for investigating the effect on mobile-carrier doping into candidate materials for a realization of a Kitaev model. From thermogravitometoric and one-dimensional electron map analyses, we find two crystal structures of this system, that is, mono-layer hydrated LixRuClH2O and bi-layer hydrated LixRuClH2O . The temperature dependence of the electrical resistivity shows a temperature hysteresis at 200-270 K, which is considered to relate with a formation of a charge order. The antiferromagnetic order at 7-13 K in pristine -RuCl3 is successfully suppressed down to 2 K in bi-layer hydrated LixRuClH2O, which is sensitive to not only an electronic state of Ru but also an interlayer distance between Ru-Cl planes.
| composition | form | solvent | post process | (Å) | (Å) | (Å) | (Å) | (deg.) | (K) | |
|---|---|---|---|---|---|---|---|---|---|---|
| sample A | RuCl3 | polycrystal | - | - | 5.72 | 5.98 | 10.36 | 6.04 | 108.9 | 13.2 K |
| sample B | BLH-LixRuClH2O | polycrystal | ethanol | - | 11.12 | 6.04 | 10.43 | 11.16 | 90.1 | K |
| sample C | BLH-LixRuClH2O | polycrystal | 2-propanol | - | 10.95 | 6.04 | 10.48 | 11.02 | 90.1 | K |
| sample D | MLH-LixRuClH2O | polycrystal | ethanol | method1 | 8.17 | 6.03 | 10.35 | 8.25 | 98.3 | 3.6 K |
| sample E | BLH-LixRuClH2O | polycrystal | ethanol | method2 | 11.22 | 6.03 | 10.42 | 11.27 | 90.0 | K |
| sample F | RuCl3 | single crystal | - | - | 5.73 | - | - | - | - | K, K |
| sample G | MLH-LixRuClH2O | single crystal | ethanol | method1 | 8.23 | - | - | - | - | K |
| sample H | BLH-LixRuClH2O | single crystal | ethanol | method2 | 10.98 | - | - | - | - | K |
I Introduction
Triggered by a proposal of new quantum model called the Kitaev model Kitaev (2006), the tremendous numbers of studies have been performed on a quantum spin liquid, especially a Kitaev quantum spin liquid Winter et al. (2017); Hermanns et al. (2018); Takagi et al. (2019); Knolle and Moessner (2019). The Kitaev model is a very simple model where spins are placed on a honeycomb lattice and are coupled with a nearest-neighbor bond-dependent interactions. The most remarkable feature of the Kitaev model is that this is an exactly solvable model, which shows that the ground state is the Kitaev quantum spin liquid and that Majorana fermions emerge as excitations Knolle et al. (2014a, b); Nasu et al. (2015). Since bond-dependent interactions naturally exist in materials with strong spin-orbit couplings Khaliullin (2005); Jackeli and Khaliullin (2009), some compounds with an unfilled orbitals have been attracting intensively Takagi et al. (2019). Especially, -RuCl3 is the most probable candidate material for the Kitaev quantum spin liquid, since spins are coupled with each other through the Kitaev-type ferromagnetic interactions Plumb et al. (2014).
The space group of RuCl3 is Johnson et al. (2015), and honeycomb lattices of octahedrally coordinated Ru3+ ions are stacked via a van der Waals interaction. The Ru3+ ions have low-spin configuration of , bearing effective spins. Contrary to expectations from the Kitaev model, RuCl3 shows an antiferromagnetic (AF) transition around an AF transition temperature, K, which is considered to be due to non-Kitaev interactions, such as direct exchange interactions and next-nearest neighbor superexchange interactions. Recent investigations assigned the phase with K to an stacking order and that with K to an stacking fault Johnson et al. (2015); Cao et al. (2016). However, upon the application of in-plane magnetic fields, an antiferromagnetic order is fully suppressed down to the lowest temperature, and the half-integer quantization is observed in the thermal Hall conductance measurement, which provides a direct evidence for capturing Majorana fermions Kasahara et al. (2018).
The study on the substitution effect for RuCl3 is intriguing to reveal the role of impurities for a realization of Kitaev model, and earlier studies on (Ru1-xIrx)Cl3 clarified that the spin liquid like state appears in the wide range of an electronic phase diagram Lampen-Kelley et al. (2017); Do et al. (2018). Introduction of not localized impurities but rather mobile charge carriers into RuCl3 is a more challenging issue Lampen-Kelley et al. (2017); Do et al. (2018); Koitzsch et al. (2017); Wang et al. (2000); Weber et al. (2016), because some theoretical studies predict an emergence of novel superconductivity in the carrier-doped Kitaev material Hyart et al. (2012); You et al. (2012); Mei (2012); Okamoto (2013a, b); Trousselet et al. (2014); Kimme et al. (2015); Schmidt et al. (2018). In an electron-doped material K0.5RuCl3 (a formal valence is Ru2.5+ with the electron configuration), which are prepared by K-coating on a RuCl3 single crystal cleaved in a vacuum chamber, a charge order of and states is proposed at low temperatures Koitzsch et al. (2017). Li-intercalated material LixRuCl3 prepared by using LiBH4 reveals that the antiferromagnetic order is suppressed below 2 K, and that the electrical resistivity still remains an insulating behavior Wang et al. (2000); Weber et al. (2016). In the study, the Li content, , is as low as , which is smaller than the honeycomb-lattice percolation threshold, . Therefore, the studies over a wide carrier concentration range are highly expected for understanding the doping effect on Kitaev materials.
Here, we report on the successful preparation of hydrated and Li-intercalated RuCl3, in which electron carriers are doped into RuCl3 by using a soft-chemical method, and the investigation of their electronic properties. In LixRuClH2O, there are two kinds of crystal structures, , mono-layer hydrate (MLH) and bi-layer hydrate (BLH). The AF state is completely suppressed down to 2 K in BLH-LixRuClH2O. It turned out that depends on an electronic state of Ru as well as the distance between Ru-Cl layers.
II Experimental
We prepare 8 samples of -RuCl3, and hydrated and Li-intercalated RuCl3, whose detailed specifications are summarized in Table 1. Commercially available -RuCl3 polycrystalline powders (3N, Mitsuwa Chemicals) were used as a pristine sample in this study, which is represented as sample A in Table 1. Hydrated Li-intercalated samples are prepared as follows. RuCl3 powders of 0.3 g were soaked in 1.5 mol LiI solution of ethanol (2-propanol), which contain a few percents of water, at their boiling point for 2 hours. This reaction can be described by the following chemical reaction formula, Then, the samples are washed by the same liquid as a solvent, and dried at room temperature, which are “sample B” (“sample C”). For clarifying whether H2O is actually intercalated into samples, we tried two kinds of post process for sample B. At first, powders of sample B are kept with silica gel in a sealed vessel for 1 day; this process is called as “method 1”. The obtained sample is named as “sample D” in Table 1. Next, we store sample D with a wet cotton in a sealed vessel for 1 day; this process is called “method 2”. The product is named as “sample E” in Table 1. RuCl3 single crystals (Sample F) were prepared by the chemical vapor transport method as described elsewhere Hasegawa et al. (2017); Aoyama et al. (2017). Some pieces of RuCl3 single crystals (typical size: mm3) were soaked in 1.5 mol LiI solution of ethanol at room temperature for 24 hours, and then washed by ethanol before drying at room temperature. After then, intercalated crystals were kept in a sealed vessel with silica gel or a wet cotton for 1 day, which are “sample G” and “sample H” in Table 1, respectively.
All the products were characterized by the powder X-ray diffraction (XRD) using the Cu radiation at room temperature. The chemical composition was determined by the inductively coupled plasma atomic emission spectroscopy (ICP-AES) and thermogravimetry (TG) analysis. The electrical resistivity, , was measured by the four-terminal method over the temperature range of 77 to 300 K. The current direction is along the -plane. Magnetic susceptibility measurements were performed using a superconducting quantum interference device (SQUID) magnetometer.
III Results
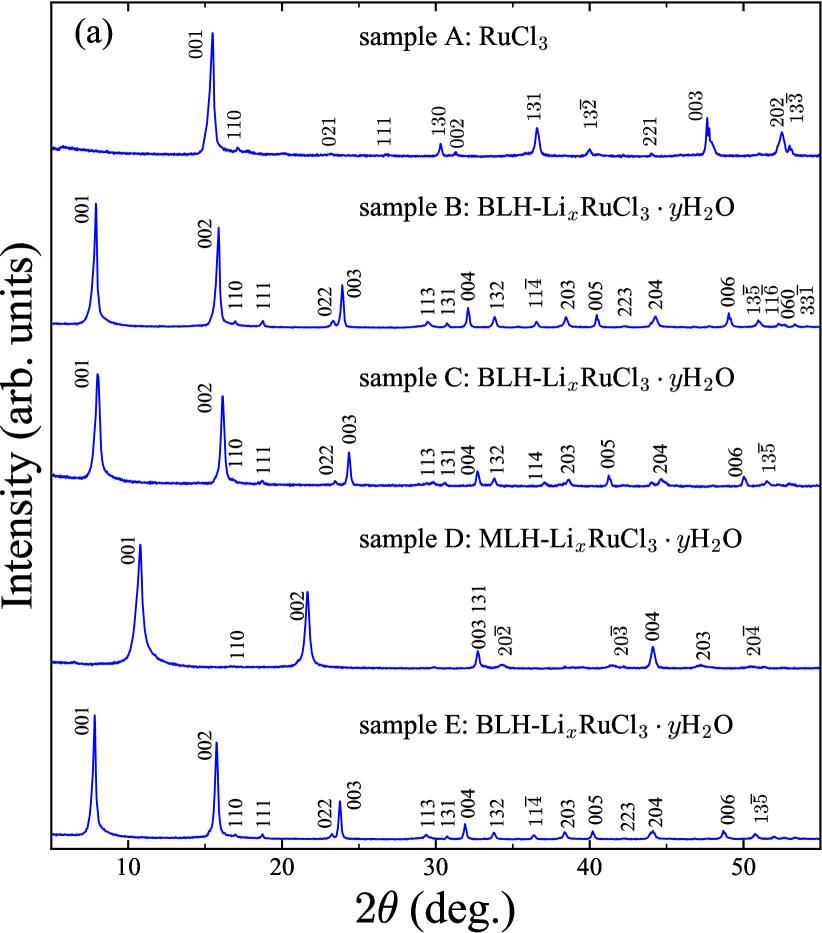
Figure 1(a) shows XRD patterns for polycrystalline samples A-E. All peaks can be indexed on the basis of a monoclinic space group (No. 12, ) Johnson et al. (2015), and calculated lattice parameters are summarized in Table 1. The peak positions of peaks for intercalated samples shift toward smaller values than those for a pristine sample (sample A), indicating the successful intercalation. It is highly unlikely that this considerable increase in the interlayer distance, , between Ru-Cl layers results from the intercalation of only Li ions, because in the other Li-intercalated materials such as LixTaS2 and LixNbS2, the increase of interlayer distance is known to be as small as 1 Å Lerf and Schöllhorn (1977); Lerf et al. (1979). Thus, it is quite reasonable that some kinds of molecules are co-intercalated with Li ions. Here, it should be noted that the peak positions of samples B and C, which are respectively synthesized in the ethanol and 2-propanol as solvents, are almost the same, indicating that the intercalated molecule is the same one in samples B and C. The most probable candidate of the intercalated molecule in both sample B and sample C is H2O, which is included in both of ethanol and 2-propanol. For clarifying whether H2O molecule is actually co-intercalated with Li ions in samples B and C, we tried two kinds of post process described above for sample B. In XRD patterns of sample D, which had been kept with silica gel through the post process of method 1, the positions of peaks shift towards larger values; the value decreases by Å from of sample B. Interestingly, when sample D is kept under high humidity for 1 day through the post process of method 2, the positions of shift towards smaller values again, and the resultant XRD pattern of sample E is the same as that of sample B. This shows that the intercalated molecules exist not only in the solvent but also in air, which indicates that the co-intercalated molecule is H2O. We can then conclude that there are two types of structure forms with the chemical formula LixRuClH2O with the same value and the distinct values. The crystal structure with a larger (smaller) value has a longer (shorter) interlayer distance. Comparing the lattice constants between pristine and intercalated samples, the interesting changes are observed in the parameter of . The angle of becomes close to the value of 90 degrees with increasing , which indicates that the monoclinic distortion is relaxed by the intercalation of Li and H2O. Therefore, it is expected that the ideal honeycomb lattice with smaller distortion is realized in the intercalated samples compared to a pristine RuCl3.
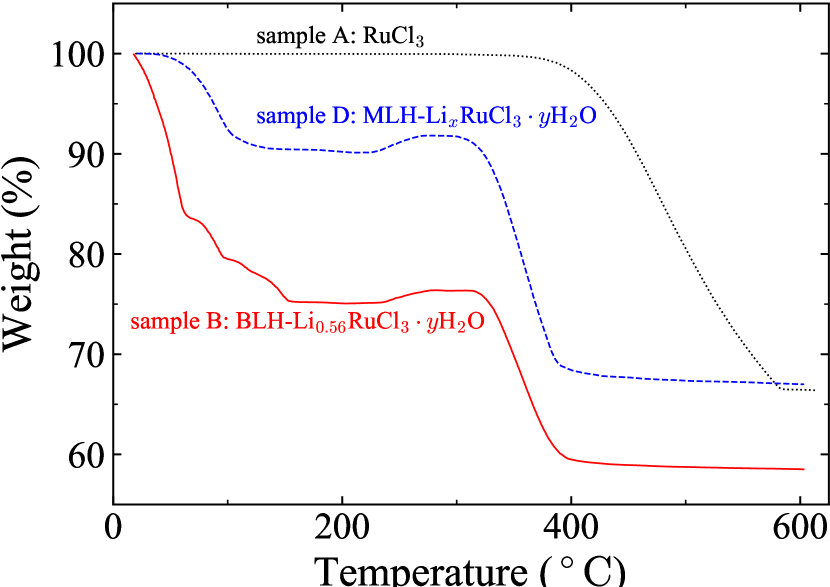
In order to determine the chemical compositions and for two structural forms, we first performed the ICP analysis for sample B with a longer interlayer distance . This reveals that the ratio of Li and Ru is . Since it is likely that there is no difference in Li concentration, , between two crystal forms, we can postulate for sample D with a smaller value. We then perform thermogravimetric analysis for samples A, B, and D on heating at C/min in air, as shown in Fig. 2. The weight of samples B and D decreases from room temperature to C, while sample A remains unchanged up to C. The observed decrease in weight of samples B and D likely corresponds to a reaction of LixRuClH2O LixRuCl3, and one can estimate H2O content, for sample B and for sample D. The weight loss at temperatures higher than C observed in samples A, B, and D is resulting from the decomposition and oxidization of RuCl3 into Ru oxides and Cl2. We consider that the intercalated single crystals (sample G, and H) take the same compositions. Here, it should be noted that the pristine RuCl3 itself is stable in air. The recent Raman spectroscopy measurements for exfoliated RuCl3 single crystals revealed that the Raman spectra for mono-layer single crystals of RuCl3 was reproducible after months of exposure to air, and that H2O molecule was not intercalated into RuCl3Zhou et al. (2019). In addition, we confirm that soaking RuCl3 in ethanol does not change the lattice constant. This is in sharp contrast to the hydrated and Li-intercalated LixRuClH2O which changes its water content in response to changes in humidity even at room temperature. The moisture-sensitive behavior, which is similar to the cobalt oxyhydrate superconductor, NaxCoOH2OTakada et al. (2003, 2004), is observed only in LixRuClH2O.
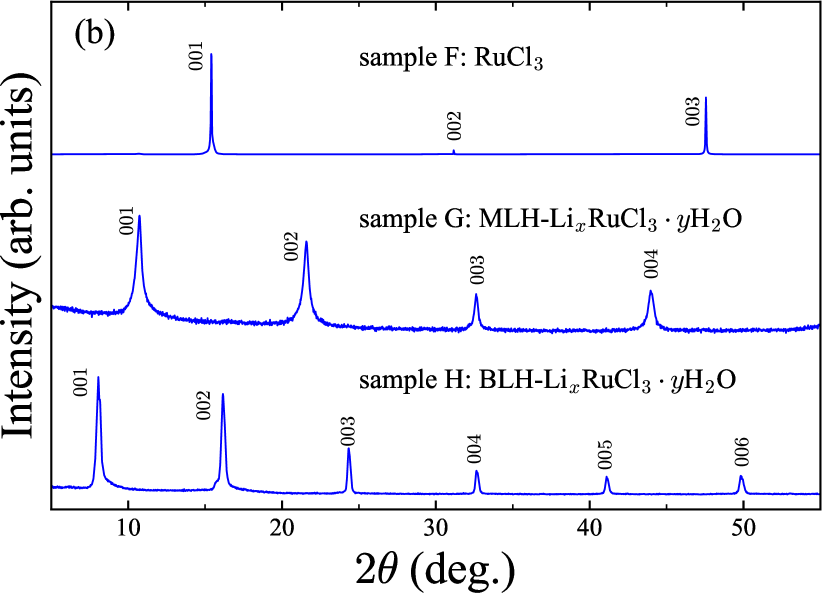
For obtaining information on the location of Li and H2O, we perform a detailed analysis of XRD patterns for single crystalline samples (Fig. 1 (b)), where only peaks are observed. We obtain one-dimensional electron density (1D ED) map profiles projected along the stacking axis (defined as the -axis). The methodology for a calculation of 1D ED map in this study is described in details elsewhere Wang et al. (2000); Leung et al. (1981). When one considers reflections only, the distribution of scattering density projected on the -axis, , is calculated by the Fourier summation
| (1) |
in which is the structure factor for peaks. For calculating , the phase of is necessary, while the absolute value of can be estimated from the integrated intensity of peak, , in the XRD patterns. The phases are constrained to one of two values, that is, 0 or , because of the centrosymmetric projection in this study, and these values are determined based on the phases of structural factors for RuCl3Johnson et al. (2015); Momma and Izumi (2011). This estimation is reasonable under the assumption that the contribution for the scattering from the intercalated ions or molecules is smaller than that from the RuCl3 component. After the estimation of the structural model from 1D ED map, the sign of is checked by recalculating the structural factors from the scattering of all components including intercalated atoms and molecules Momma and Izumi (2011).
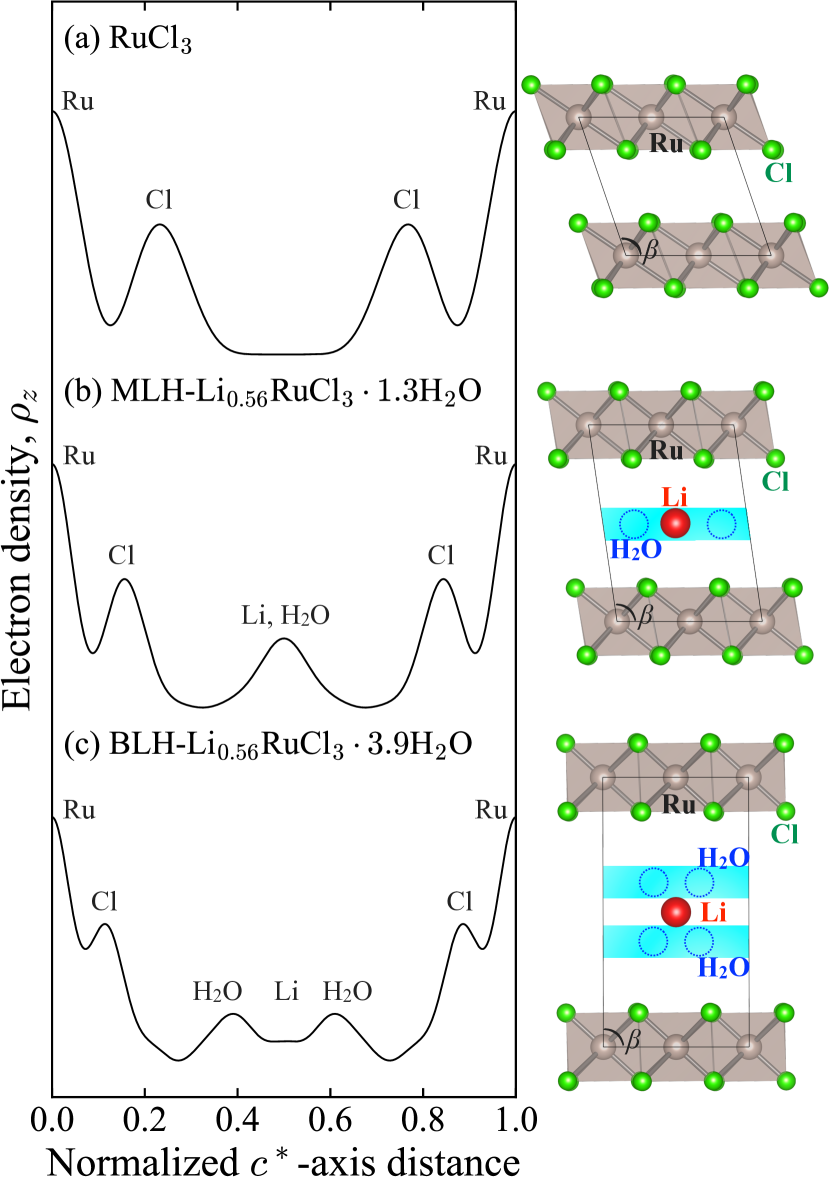
Figure 3 shows the 1D ED map of RuCl3 (sample F), LixRuClH2O with (sample G) and (sample H). In spite of constraint on values of phases for , 1D ED map profile of RuCl3 (Fig. 3(a)) is consistent with the atomic position of RuCl3, which indicates that the calculation method is reliable. The 1D ED map profile for LixRuClH2O with (sample G) shows that the electron density due to guest atoms and molecules forms a single peak around the center of the gallery. On the other hand, for LixRuClH2O with (sample H), the contributions of the intercalated atoms and molecules are observed as a small hump at the center part and two broad peaks placed 1.2 Å below and above the center of the gallery. Here, we recall that there are many layered hydrates with the general formula H2O (Alkali metal, transition metals, and O, S). These layered hydrates generally have two kinds of crystal structures, , mono- and bi- layer hydrates (MLH and BLH), where a single cation and H2O layer or a sequence of H2O-cation-H2O layers separates the electron-doped two-dimensional layers by distances of Å or Å, respectively. NaxCoOH2O with a triangular Co sublattice is a typical material in above series: BLH-NaxCoOH2O shows superconductivity with a superconducting temperature of K Takada et al. (2003), while a superconductivity is not observed in MHL-NaxCoOH2O Takada et al. (2004). We note that 1D ED maps for samples G and H in Fig.3 are similar to the electron density for MLH- and BLH- NaxCoOH2O. In addition, the variations in for samples F-H shown in Table 1 are similar to those in the anhydrous NaxCoO2, MLH- and BLH- NaxCoOH2O whose interlayer distances are 5.5, 6.9, and 9.8 Å, respectively Takada et al. (2003, 2004). Therefore, we conclude that sample G is MLH-Li0.56RuClH2O where Ru-Cl layers are separated by a single layer of Li and H2O, and that sample H is BLH-Li0.56RuClH2O where Ru-Cl layers are separated by layers of H2O-Li-H2O. Schematic pictures of crystal structures for these materials are shown in Fig. 3.
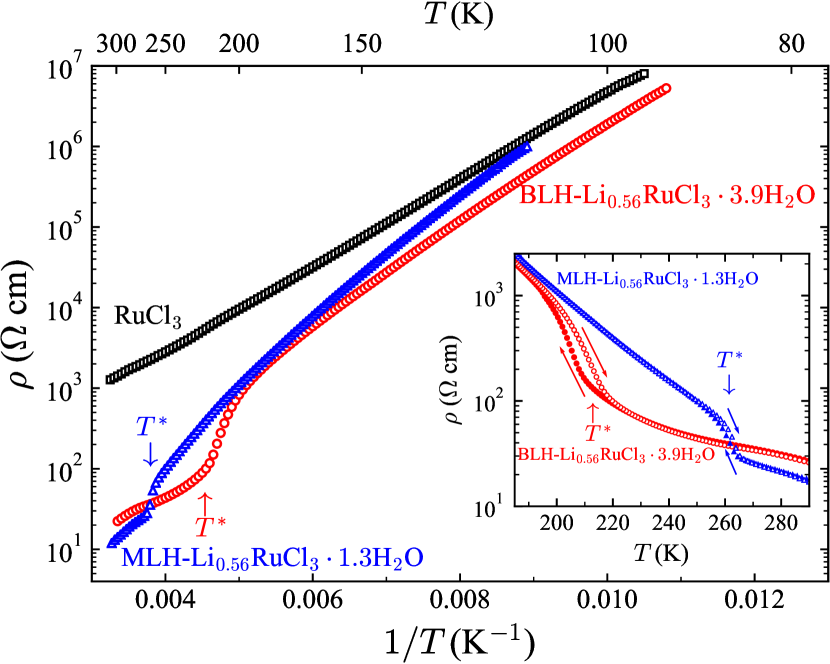
Figure 4 shows the temperature dependence of resistivity, , for single crystals of RuCl3, MLH- and BLH- LixRuClH2O (samples F-H). Pristine RuCl3 single crystal, which is a strongly spin-orbital coupled Mott insulator, shows a thermally-activated-type temperature dependence and the activation energy is eV. This value is lower than that reported in polycrystalline RuCl3Wang et al. (2000). The resistivity for MLH- and BLH- LixRuClH2O at room temperature is orders of magnitude smaller than that of pristine RuCl3. The intercalation of lithium ions makes the formal valence of Ru ions smaller than , so that the electron carriers are introduced into the material. These electron carriers are the origin for the decrease in around room temperature. The activation energy around room temperature is eV for MHL- and eV for BLH- LixRuClH2O, which are comparable with or slightly larger than that of pristine RuCl3. On cooling intercalated materials, the electrical resistivity shows an anomalous hysteresis at K for MHL-LixRuClH2O and K for BLH-LixRuClH2O, indicating the presence of the first-order transitions. On further cooling below , the resistivity rapidly increases and the activation energy increases up to eV, which is larger than of RuCl3.
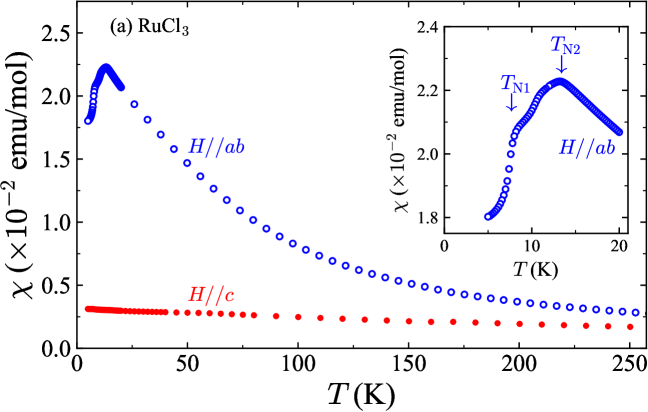
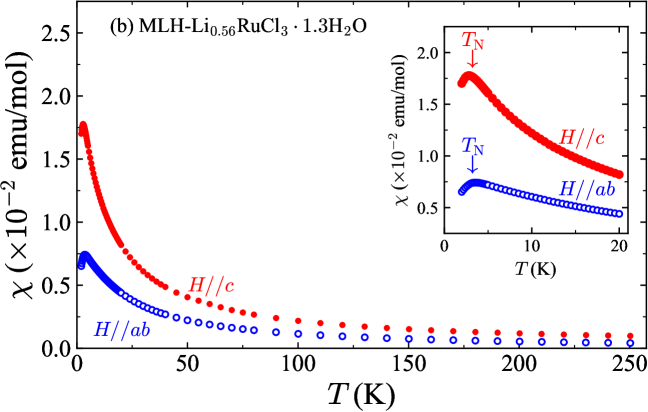
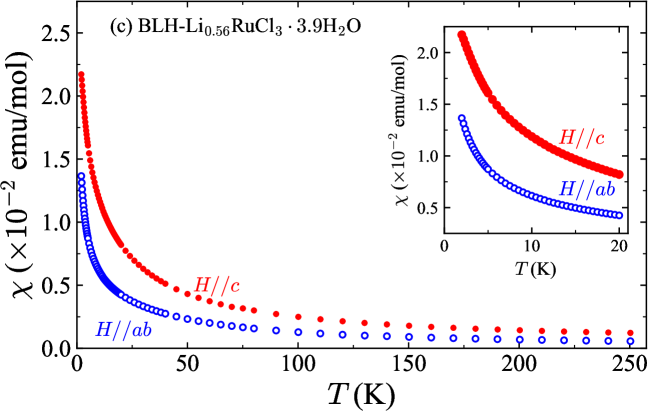
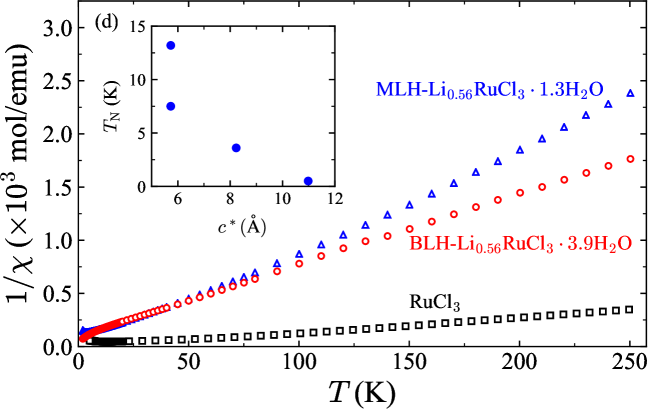
Figure 5 shows the temperature dependence of magnetic susceptibility, , for single crystals of RuCl3, and MLH- and BLH- LixRuClH2O (samples F-H) under the magnetic field of T parallel to the -plane and the -axis. As reported previously Sears et al. (2015), in RuCl3 single crystals, for is much larger than that for , which emerges the so-called term of the spin-orbital coupling origin Winter et al. (2017). One can also find two magnetic transitions at K and K in the in-plane measurement. Recent investigations reveal that is characteristics of an stacking ordered system, while is induced by the stacking faults Johnson et al. (2015); Cao et al. (2016). For of RuCl3 under , we perform a Curie-Weiss fit with a fitting function of with where , , , , and are the Weiss temperature, the Weiss constant, the effective magnetic moment, the Avogadro constant, and the Boltzmann constant, respectively. They are estimated to be K and , which are consistent with previous report Sears et al. (2015). The intercalation of Li ions and H2O molecules results in a drastic change in magnetic properties. The anisotropy of in RuCl3 is greatly reduced by the intercalation. The magnitude relationship of is reversed, and for is slightly larger than for . In MLH-LixRuClH2O, a magnetic susceptibility shows a broad peak around K, which is considered to be an AF transition. Surprisingly, an AF transition is fully suppressed at least down to 2 K in BLH-LixRuClH2O. From a Curie-Weiss fit for intercalated samples with a function of , the and values are K and for MLH-LixRuClH2O and K and for BLH-LixRuClH2O, respectively, which indicates that the ferromagnetic interaction in RuCl3 is changed to a weak AF interaction owing to the intercalation.
IV Discussion
We now discuss electronic states realized in the Li- and H2O- intercalated RuCl3. The formal valence of Ru in MLH- and BLH- LixRuClH2O is +2.44, so that there are roughly equal number of Ru3+ ions with the electron configuration and Ru2+ ions with the electron configuration . In terms of the band picture, this correspond to the quarter-filled bands, which is in stark contrast to the half-filled bands in RuCl3. The doped electron carriers are expected to conduct smoothly in the system; however, this is not the case. The reasons why MLH- and BLH- LixRuClH2O does not show a metallic behavior is likely related to the first-order transition at . Taking into account that the number of populated Ru2+ and Ru3+ ions is almost equal on the bipartite honeycomb lattice, we consider that a charge order with the alternate arrangement of Ru2+ and Ru3+ ions occurs below . The rapid increase of below is consistent with a formation of a charge order. If there are relevant fluctuations far above , a non-metallic behavior of intercalated samples at room temperature is also well accounted for. We note that the similar scenario is also proposed for K-coated RuCl3, where photoemission spectra exhibit a gap-like feature at low temperatures Koitzsch et al. (2017). In the charge ordered state, one set of Ru2+ and Ru3+ ions forms a triangular lattice, and the inversion symmetry is broken. Comparing to for MLH- and BLH- LixRuClH2O, the former is K higher than the latter. That is, the temperature where a charge order occurs is greatly different between MLH- and BLH- LixRuClH2O in spite of the fact that these two samples have the same electron configuration. In BLH-system, Li ions are sandwiched between neutral H2O layers, which results in the shielding of Coulomb potential of Li ions. This may relate with the lower in BLH-LixRuClH2O than that in MLH-LixRuClH2O.
We next discuss the mechanism of the suppressed AF order in the intercalated RuCl3. Because Ru2+ ions with electron configurations are nonmagnetic, and the doping level exceeds a percolation limit of a honeycomb lattice 0.303, it is quite reasonable to expect the suppression of the AF order. More importantly, in the charge-ordered state, magnetic interactions across the nearest-neighbor Ru sites does not work, since one of two adjacent Ru sites is occupied by a nonmagnetic Ru2+ ion. As a consequence, not only Kitaev-type ferromegneic interaction but also the so-called term as a source of magnetic anisotropy does not work effectively, leading to an isotropic spins. Instead, the next-nearest-neighbor interactions are expected to be dominant in the charge ordered state. Therefore, the AF transition at low temperatures in MLH-LixRuClH2O is originating from exchange interactions on a Ru3+ triangular lattice. One plausible candidate of the AF structure in MLH-LixRuClH2O is the structure, which hosts the left-handed and right-handed chirality. It should be noted that for BLH-LixRuClH2O is lower than that for MLH-LixRuClH2O, while the Li contents are the same in these two samples. This indicates that depends on not only electronic states among honeycomb layer of Ru ions but also interlayer distances. As shown in the inset of Fig. 5(d), the longer the interlayer distance is, the lower magnetic transition temperature is; this suggests that the interaction between Ru-Cl layers is a origin of the AF transition in MLH-LixRuClH2O, and well explains the absence of the magnetic order in BLH-LixRuClH2O. For realizing the electron-doped Kitaev spin liquid, it is important to control the Li content precisely and clarify whether the Kitaev-like correlations remain or not in such a system.
V Summary
In summary, we successfully prepare hydrated and Li-intercalated -RuCl3, LixRuClH2O, by using a soft chemical technique. We found two kinds of crystal structures; one is MLH-LixRuClH2O, the other is BLH-LixRuClH2O. The interlayer distance between Ru-Cl layers for MLH- and BLH-LixRuCl3 is 1.4-1.9 times larger than that for pristine RuCl3. MLH- and BLH- LixRuClH2O do not show a metallic behavior in the resistivity curves, while a roughly half of Ru sites changes from Ru3+ to Ru2+. We consider that this is due to a formation of a charge order at where a temperature hysteresis in resistivity curves and a rapid increase of the resistivity are observed. The magnetic susceptibility measurements reveal that MLH-LixRuClH2O shows an antiferromagnetic transition at K and that an antiferromagnetic order is suppressed at least down to 2 K in BLH-LixRuClH2O, which suggests that the antiferromagnetic transition is sensitive for an electronic state of Ru and an interlayer distance.
References
- Kitaev (2006) A. Kitaev, Ann. Phys. 321, 2 (2006).
- Winter et al. (2017) S. M. Winter, A. A. Tsirlin, M. Daghofer, J. van den Brink, Y. Singh, P. Gegenwart, and R. Valentí, J. Phys.: Cond. Matt. 29, 493002 (2017).
- Hermanns et al. (2018) M. Hermanns, I. Kimchi, and J. Knolle, Annu. Rev. Condens. Matter Phys. 9, 17 (2018).
- Takagi et al. (2019) H. Takagi, T. Takayama, G. Jackeli, G. Khaliullin, and S. E. Nagler, Nat. Rev. Phys. 1, 264 (2019).
- Knolle and Moessner (2019) J. Knolle and R. Moessner, Annu. Rev. Condens. Matter Phys. 10, 451 (2019).
- Knolle et al. (2014a) J. Knolle, D. L. Kovrizhin, J. T. Chalker, and R. Moessner, Phys. Rev. Lett. 112, 207203 (2014a).
- Knolle et al. (2014b) J. Knolle, G.-W. Chern, D. L. Kovrizhin, R. Moessner, and N. B. Perkins, Phys. Rev. Lett. 113, 187201 (2014b).
- Nasu et al. (2015) J. Nasu, M. Udagawa, and Y. Motome, Phys. Rev. B 92, 115122 (2015).
- Khaliullin (2005) G. Khaliullin, Prog. Theor. Phys. Suppl. 160, 155 (2005).
- Jackeli and Khaliullin (2009) G. Jackeli and G. Khaliullin, Phys. Rev. Lett. 102, 017205 (2009).
- Plumb et al. (2014) K. W. Plumb, J. P. Clancy, L. J. Sandilands, V. V. Shankar, Y. F. Hu, K. S. Burch, H.-Y. Kee, and Y.-J. Kim, Phys. Rev. B 90, 041112 (2014).
- Johnson et al. (2015) R. D. Johnson, S. C. Williams, A. A. Haghighirad, J. Singleton, V. Zapf, P. Manuel, I. I. Mazin, Y. Li, H. O. Jeschke, R. Valentí, and R. Coldea, Phys. Rev. B 92, 235119 (2015).
- Cao et al. (2016) H. B. Cao, A. Banerjee, J.-Q. Yan, C. A. Bridges, M. D. Lumsden, D. G. Mandrus, D. A. Tennant, B. C. Chakoumakos, and S. E. Nagler, Phys. Rev. B 93, 134423 (2016).
- Kasahara et al. (2018) Y. Kasahara, T. Ohnishi, Y. Mizukami, O. Tanaka, S. Ma, K. Sugii, N. Kurita, H. Tanaka, J. Nasu, Y. Motome, T. Shibauchi, and Y. Matsuda, Nature 559, 227 (2018).
- Lampen-Kelley et al. (2017) P. Lampen-Kelley, A. Banerjee, A. A. Aczel, H. B. Cao, M. B. Stone, C. A. Bridges, J.-Q. Yan, S. E. Nagler, and D. Mandrus, Phys. Rev. Lett. 119, 237203 (2017).
- Do et al. (2018) S.-H. Do, W.-J. Lee, S. Lee, Y. S. Choi, K.-J. Lee, D. I. Gorbunov, J. Wosnitza, B. J. Suh, and K.-Y. Choi, Phys. Rev. B 98, 014407 (2018).
- Koitzsch et al. (2017) A. Koitzsch, C. Habenicht, E. Müller, M. Knupfer, B. Büchner, S. Kretschmer, M. Richter, J. van den Brink, F. Börrnert, D. Nowak, A. Isaeva, and T. Doert, Phys. Rev. Materials 1, 052001 (2017).
- Wang et al. (2000) L. Wang, M. Rocci-Lane, P. Brazis, C. R. Kannewurf, Y.-I. Kim, W. Lee, J.-H. Choy, and M. G. Kanatzidis, J. Am. Chem. Soc. 122, 6629 (2000).
- Weber et al. (2016) D. Weber, L. M. Schoop, V. Duppel, J. M. Lippmann, J. Nuss, and B. V. Lotsch, Nano Lett. 16, 3578 (2016).
- Hyart et al. (2012) T. Hyart, A. R. Wright, G. Khaliullin, and B. Rosenow, Phys. Rev. B 85, 140510 (2012).
- You et al. (2012) Y.-Z. You, I. Kimchi, and A. Vishwanath, Phys. Rev. B 86, 085145 (2012).
- Mei (2012) J.-W. Mei, Phys. Rev. Lett. 108, 227207 (2012).
- Okamoto (2013a) S. Okamoto, Phys. Rev. Lett. 110, 066403 (2013a).
- Okamoto (2013b) S. Okamoto, Phys. Rev. B 87, 064508 (2013b).
- Trousselet et al. (2014) F. Trousselet, P. Horsch, A. M. Oleś, and W.-L. You, Phys. Rev. B 90, 024404 (2014).
- Kimme et al. (2015) L. Kimme, T. Hyart, and B. Rosenow, Phys. Rev. B 91, 220501 (2015).
- Schmidt et al. (2018) J. Schmidt, D. D. Scherer, and A. M. Black-Schaffer, Phys. Rev. B 97, 014504 (2018).
- Hasegawa et al. (2017) Y. Hasegawa, T. Aoyama, K. Sasaki, Y. Ikemoto, T. Moriwaki, T. Shirakura, R. Saito, Y. Imai, and K. Ohgushi, J. Phys. Soc. Jpn. 86, 123709 (2017).
- Aoyama et al. (2017) T. Aoyama, Y. Hasegawa, S. Kimura, T. Kimura, and K. Ohgushi, Phys. Rev. B 95, 245104 (2017).
- Lerf and Schöllhorn (1977) A. Lerf and R. Schöllhorn, Inorg. Chem. 16, 2950 (1977).
- Lerf et al. (1979) A. Lerf, F. Sernetz, W. Biberacher, and R. Schöllhorn, Mater. Res. Bull. 14, 797 (1979).
- Zhou et al. (2019) B. Zhou, Y. Wang, G. B. Osterhoudt, P. Lampen-Kelley, D. Mandrus, R. He, K. S. Burch, and E. A. Henriksen, J. Phys. Chem. Solids 128, 291 (2019).
- Takada et al. (2003) K. Takada, H. Sakurai, E. Takayama-Muromachi, F. Izumi, R. A. Dilanian, and T. Sasaki, Nature 422, 53 (2003).
- Takada et al. (2004) K. Takada, H. Sakurai, E. Takayama-Muromachi, F. Izumi, R. A. Dilanian, and T. Sasaki, J. Solid State Chem. 177, 372 (2004).
- Leung et al. (1981) S. Y. Leung, M. S. Dresselhaus, C. Underhill, T. Krapchev, G. Dresselhaus, and B. J. Wuensch, Phys. Rev. B 24, 3505 (1981).
- Momma and Izumi (2011) K. Momma and F. Izumi, J. Appl. Cryst. 44, 1272 (2011).
- Sears et al. (2015) J. A. Sears, M. Songvilay, K. W. Plumb, J. P. Clancy, Y. Qiu, Y. Zhao, D. Parshall, and Y.-J. Kim, Phys. Rev. B 91, 144420 (2015).
Acknowledgements
We would like to thank Fuyuki Sakamoto at Tohoku University for his help in the ICP analysis, and Yukitoshi Motome at the University of Tokyo and Joji Nasu at Yokohama National University for fruitful discussions.
This work was supported by JSPS KAKENHI Grant Numbers 16K17732, 17H05474, 18H01159, 18H04302, 18K03531, and 19H04685.