- CAT
- Channel-aware Transmission
- CoPoMo
- Context-aware Power Consumption Model
- CPS
- Cyber Physical System
- IoT
- Internet of Things
- pCAT
- predictive CAT
- ML-CAT
- Machine Learning CAT
- ML-pCAT
- Machine Learning pCAT
- MTC
- Machine-type Communication
- SDR
- Software-defined Radio
- MANET
- Mobile Ad-hoc Network
- V2V
- Vehicle-to-vehicle
- V2X
- Vehicle-to-everything
- UAV
- Unmanned Aerial Vehicle
- RSU
- Roadside Unit
- CR
- Cognitive Radio
- REM
- Radio Environment Map
- LTE
- Long Term Evolution
- mmWave
- millimeter wave
- M2M
- Machine-to-machine
- H2H
- Human-to-human
- ITS
- Intelligent Transportation System
- SCATS
- Sydney Coordinated Adaptive Traffic System
- KPI
- Key Performance Indicator
- UE
- User Equipment
- PRB
- Physical Resource Block
- FPC
- Fractional Path Loss Compensation
- MCS
- Modulation and Coding Scheme
- ARIMA
- AutoRegressive Integrated and Moving Average
- MAE
- Mean Absolute Error
- RMSE
- Root Mean Square Error
- AoI
- Age of Information
- RSSI
- Received Signal Strength Indicator
- RSSNR
- Reference Signal SNR
- RB
- Resource Block
- KPI
- Key Performance Indicator
- MAC
- Medium Access Control
- PFR
- Prediction Failure Ratio
- ANN
- Artificial Neural Network
- M5T
- M5 Decision Tree
- SVM
- Support Vector Machine
- LR
- Linear Regression
- RR
- Ridge Regression
- RF
- Random Forest
- DL
- Deep Learning
- CQI
- Channel Quality Indicator
- RSRP
- Reference Signal Received Power
- RSRQ
- Reference Signal Received Quality
- SNR
- Signal-to-noise Ratio
- SINR
- Signal-to-interference-plus-noise Ratio
- RS-SINR
- Reference Signal Signal to Interference and Noise Ratio
- HTTP
- Hypertext Transfer Protocol
- TCP
- Transmission Control Protocol
- GPS
- Global Positioning System
- WGS84
- World Geodetic System 1984
Boosting Vehicle-to-cloud Communication by Machine Learning-enabled Context Prediction
Abstract
The exploitation of vehicles as mobile sensors acts as a catalyst for novel crowdsensing-based applications such as intelligent traffic control and distributed weather forecast. However, the massive increases in Machine-type Communication (MTC) highly stress the capacities of the network infrastructure. With the system-immanent limitation of resources in cellular networks and the resource competition between human cell users and MTC, more resource-efficient channel access methods are required in order to improve the coexistence of the different communicating entities. In this paper, we present a machine learning-enabled transmission scheme for client-side opportunistic data transmission. By considering the measured channel state as well as the predicted future channel behavior, delay-tolerant MTC is performed with respect to the anticipated resource-efficiency. The proposed mechanism is evaluated in comprehensive field evaluations in public Long Term Evolution (LTE) networks, where it is able to increase the mean data rate by 194% while simultaneously reducing the average power consumption by up to 54%.
Index Terms:
Context-predictive Communication, Machine Learning, Crowdsensing, Intelligent Transportation Systems, Mobile SensorsI Introduction
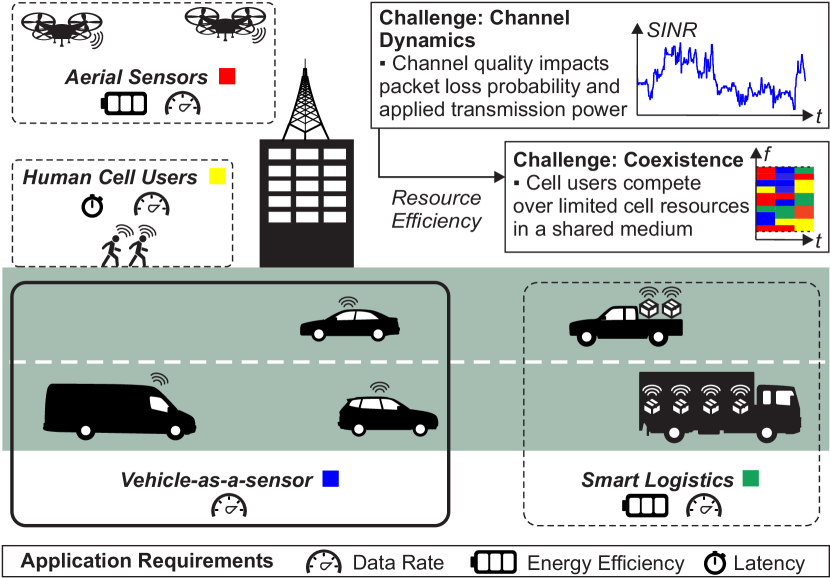
While cars were only seen as means for personal transportation in the past, they are currently transcending to mobile sensor nodes that provide crowdsensing-based services with highly up-to-date information [1]. Applications range from predictive maintenance and intelligent traffic control to road-roughness detection [2] and distributed weather forecast [3]. In addition, small-scale autonomous robots such as Unmanned Aerial Vehicles are expected to become native parts of Intelligent Transportation Systems [4]. Since the operation time of these vehicles is highly determined by the available energy resources, energy-efficient communication has become one of the major research fields in mobile robotics [5]. Different communication technologies with characteristic system properties and intended use-cases are currently being investigated for interconnecting vehicles and infrastructure. Among others, the framework for the deployment of ITSs of the European Parliament [6] proposes the usage IEEE 802.11p-based ad-hoc communication for safety-related Vehicle-to-vehicle (V2V) data transfer with low latencies and small data packets. However, this technology is not able to provide internet-based vehicle-to-cloud connectivity, as there are practically no deployments of Roadside Units, which offer the required gateway functionalities. Therefore, delay-tolerant and data-intense messaging is intended to be carried out based on existing cellular communication technologies (e.g., LTE and upcoming 5G networks), which already offer large-scale coverage. With the expected massive increase in vehicular MTC [7] and the general growth of cellular data traffic [8], the network infrastructure is facing the challenge of resource-competition between human cell users and Internet of Things (IoT)-related data transmissions [9]. Fig. 1 gives an overview about the requirements of different vehicular and IoT-based communication systems and the resulting challenges that arise from the channel dynamics and the limited cell resources.
A promising approach to address these issues is the application of context-aware communication [10] that exploits the dynamics of the communication channel to schedule delay-tolerant transmissions in an opportunistic way for increasing the transmission efficiency with regard to data rate, packet loss probability and energy consumption. As a consequence, communication resources are occupied for shorter time intervals and can early be used by other cell users, which enables a better coexistence and overall system performance [11].
In this paper, we extend and bring together the methods, results and insights of previous work [12, 13, 14, 15, 16] on context-aware car-to-cloud communication and propose a client-side opportunistic transmission scheme that applies machine learning-based data rate prediction for scheduling the transmission times of sensor data transmissions with respect to the expected resource-efficiency. Moreover, mobility prediction and connectivity maps are exploited to integrate the anticipated future channel behavior into the transmission process. The analysis focuses on resource-aware machine learning models that allow the online-prediction on off-the-shelf smartphones and embedded systems without causing significant additional computation overheads themselves.
The analysis in this work focuses on exploiting vehicles as moving sensor nodes that transmit measured data to cloud-based services through a cellular network. It is assumed that the actual data-driven crowdsensing applications specify soft deadlines, which allow the opportunistic and delay-tolerant approach of the proposed transmission scheme. Examples for existing real-world systems with similar requirements are Sydney Coordinated Adaptive Traffic System (SCATS)-based ramp metering in ITSs (traffic flow is communicated every six minutes), real-time traffic optimization [17, 18] (sensors provide their information once per minute) and air pollution monitoring [19], which is performed every five minutes.
The key contributions of this paper are the following:
-
•
A highly configurable probabilistic model for opportunistic vehicle-to-cloud data transfer with respect to the channel properties.
-
•
Machine learning-based uplink data rate prediction based on measured passive downlink indicators, which is applied as a metric to schedule data transmissions.
-
•
Mobility prediction using navigation system knowledge to forecast the future vehicle position and allow exploitation of a priori information about the transmission channel by using multi-layer connectivity maps.
-
•
A closed process for post-processing uplink power consumption analysis exploiting machine learning-based transmission power prediction from passive downlink indicators and device-specific laboratory measurements.
-
•
The developed measurement applications and the raw measurement results are provided as Open Source.
The remainder of the manuscript is structured as follows. After discussing relevant state-of-the-art approaches in Sec. II, the proposed transmission scheme and its individual components are presented in Sec. III. Afterwards, a machine learning-empowered process to assess the uplink power consumption of embedded devices is presented in Sec. V. Sec. IV gives an overview about the methodological setup for the field evaluation and finally, the achieved results of the different models are evaluated and discussed in Sec. VI.
II Related Work
A detailed evaluation about the complex interdependencies of Machine-to-machine (M2M) and Human-to-human (H2H) data traffic as well as their coexistence in the same cellular network is performed in [11]. The optimization of the coexistence of these data traffic types is often addressed on the network infrastructure side, e.g., by cognitive and channel-dependent scheduling mechanisms [20] that consider different traffic types and priorities. In [21], the authors propose a biology-inspired approach that considers M2M and H2H as populations of predators and prey in order to achieve a stable equilibrium for both traffic types. Although these optimizations might have an impact on the design of future networks, they can often not be applied within existing networks as the involved changes could lead to incompatibilities. Moreover, the scientific evaluation of infrastructure-side optimizations is often limited to simulation scenarios due to lacking access to the required hardware equipment and the inherent complexity of real-world scenarios.
Especially for platooning, one way to reduce the crowdsensing-related cell load is to pre-aggregate the sensor data in a gateway vehicle [22] before it is actually transmitted in order to avoid the transfer of redundant information. Alternative approaches are provided by social-based forwarding [23] and offloading techniques [24]. Within this paper, we focus on optimizing the transmission behavior of individual non-coordinated vehicles.
Anticipatory mobile networking aims to raise the situation-awareness of the communicating entities by integrating additional information into the decision processes in order to optimize different individual Key Performance Indicators or the overall system performance [25]. The anticipatory communication paradigm is closely related to the application of machine learning, which can be exploited for the prediction of future behaviors and the consideration of hidden parameters that are not directly accessible within the complex system [26]. In [27], the authors propose a data-driven framework for optimizing the resource-efficiency of the network infrastructure by centralized and distributed predictions using control channel analysis. Within the case-study, about 95% of the overall traffic value was precisely predicted, which enabled the network operators to more than double the offered data rate using the optimization framework. While theoretically, the resulting data rate of a transmission is the result of a deterministic process, predicting those values proactively within a live-system is a challenging task due to the large number of involved hidden influences (e.g., scheduling, packet loss, channel stability, spectrum sharing and cross-layer interdependencies) [28]. Different authors have investigated the impact of the channel quality to the resulting data rate of cellular data transmissions [15, 29, 30, 31, 32] in different environments that range from highway to inner city scenarios. The studies agree that passively measurable network quality indicators such as Reference Signal Received Power (RSRP), Reference Signal Received Quality (RSRQ), Signal-to-interference-plus-noise Ratio (SINR), and Channel Quality Indicator (CQI) provide meaningful information, which can be leveraged to estimate the resulting data rate based on machine learning methods even in challenging environments. In comparison to time series-based active data rate prediction (e.g., based on Kalman filters), passive approaches do not monitor the data rates of ongoing transmissions and can therefore be applied without introducing additional traffic themselves. As resource efficiency is one of the optimization goals of this work, we focus on passive data rate prediction.
For mobile wireless networks, the dynamics of the communication channel are highly affected by the mobility characteristics of the moving vehicle [33]. Therefore, mobility-awareness allows the explicit consideration of these impact factors e.g., for handover optimization [34] and improved routing in vehicular ad-hoc networks [35].
While crowdsensing forms the considered application scenario for this work and provides the reason for the actual vehicle-to-cloud data transfer, the technique itself can be exploited in order to optimize the environmental awareness of the vehicles. In this context, the usage of connectivity maps for anticipatory communication [36, 37] allows to exploit a priori information about the channel quality based on previous measurements in the same geographical area. Radio Environment Maps implement a similar concept, which enables opportunistic data transfer with Cognitive Radio (CR) methods [38]. However, those purely spectrum-aware approaches do not consider the cross-layer interdependencies within the protocol stack. Moreover, as the resource allocation in LTE is performed by the scheduling mechanisms of the evolved NodeB (eNB), those methods have to be implemented by the mobile network operator. In contrast to that, the proposed machine learning-based approach can easily be implemented on the client side without requiring modifications to the network infrastructure.
III Machine Learning-enabled Transmission of Vehicular Sensor Data
In this section, the machine learning-based sensor data transmission schemes and their corresponding components are presented. In the first step, the legacy Channel-aware Transmission (CAT) scheme [11] is generalized and augmented using machine learning-based data rate prediction. Afterwards, we transit from context-aware to context-predictive communication with the extended predictive CAT (pCAT) that exploits multi-layer connectivity maps and mobility prediction to consider the anticipated future network state in the transmission process. Finally, the main contributions of this paper — the transmission schemes Machine Learning CAT (ML-CAT) and Machine Learning pCAT (ML-pCAT) — are derived by bringing the key insights together.
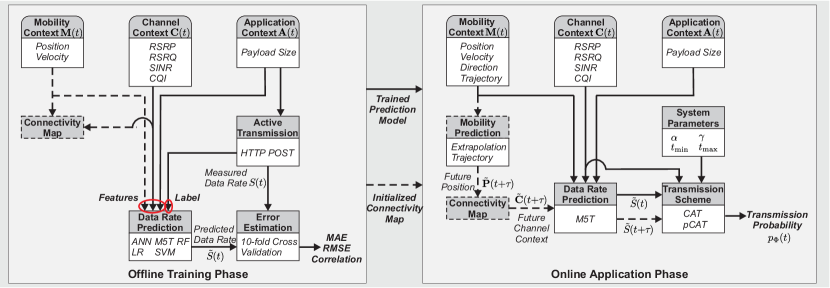
The overall system architecture model of the proposed approach that operates on the application layer is shown in Fig. 2. Transmissions are performed probabilistically with respect to the network quality by exploiting connectivity hotspots that allow fast and reliable data delivery and avoiding connectivity valleys that implicate high packet loss probabilities. The acquired sensor data is stored in a local buffer until a transmission decision has been made for the whole data buffer.
The training phase consists of passive probing of the LTE downlink indicators — which form the channel context — as well as of active data transmission with variable payload sizes using Hypertext Transfer Protocol (HTTP) POST.
The feature set of the data rate prediction is composed of the network quality indicators, the velocity and the payload size of the data packet. The resulting data rate of the active transmission is used as the label for the prediction process, which is performed with the models Artificial Neural Network (ANN), Linear Regression (LR), Random Forest (RF), M5 Decision Tree (M5T) and Support Vector Machine (SVM). Finally, the prediction performance of the different models is evaluated using 10-fold cross validation.
Additionally, the measured channel context parameters and the position information of the vehicle are utilized to create a multi-layer connectivity map that stores the cell-wise average of each indicator from multiple visits of the same geographical area.
During the application phase, the context information is leveraged to calculate the channel-aware transmission probability . The channel is only probed passively and the most accurate previously trained prediction model uses measurements for the channel context , the mobility context and the application context to predict the currently achievable data rate .
The latter forms the metric for the transmission scheme that is configured with multiple system parameters (see Sec. III-A). Alternatively, the channel quality indicators can be used directly to serve as a transmission metric.
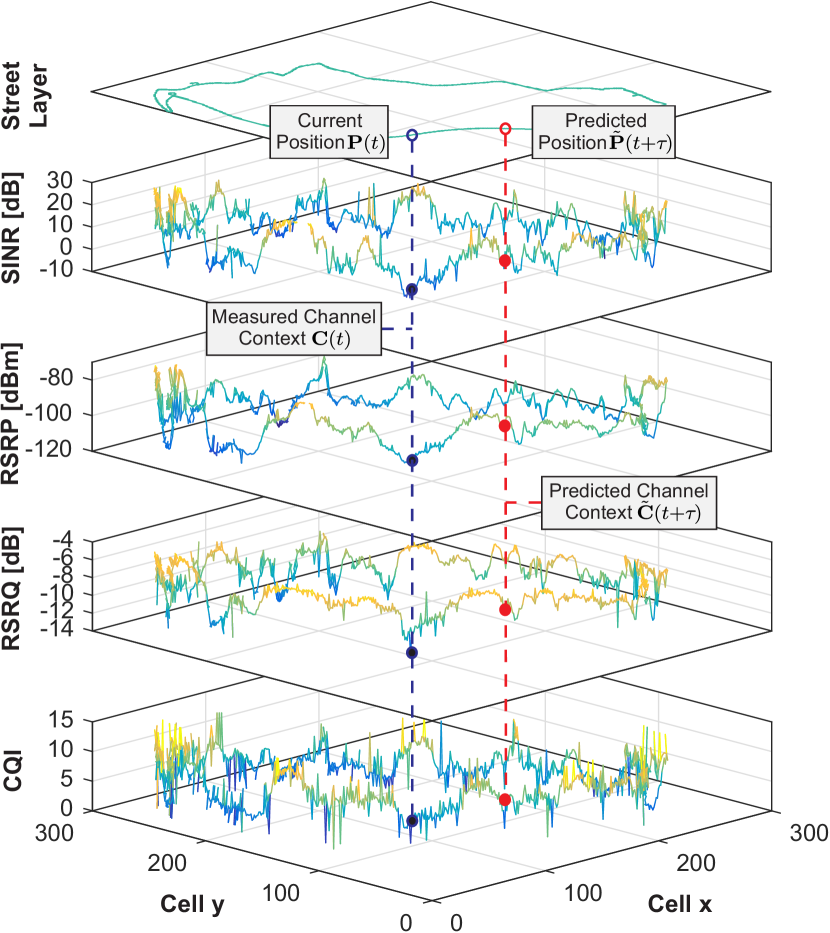
For the context-predictive pCAT transmission scheme (see Sec. III-B2), mobility prediction is applied to estimate the future position for a defined prediction horizon . is then used to access the corresponding cell entry in the connectivity map in order to obtain an estimation for the future channel context . This knowledge about the anticipated channel behavior enables the calculation of the forecasted data rate that is integrated into the transmission process of the proposed pCAT.
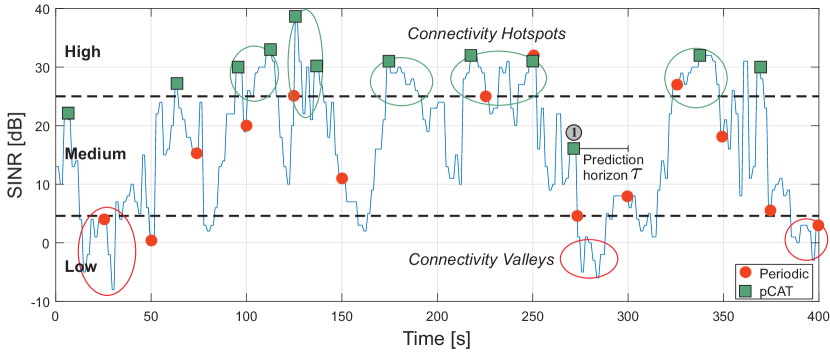
An example comparison of the temporal behavior of context-predictive data transmission using SINR-based pCAT and straightforward fixed-interval data transfer is shown in Fig. 3. Since the periodic approach does not consider the network quality within the transmission decision, the SINR at the begin of the transmission is uniformly distributed over the whole value range of the SINR and multiple transmissions are performed during low network quality periods. Contrastingly, the proposed context-predictive approach is able to avoid those resource-inefficient transmissions by exploiting connectivity hotspots.
III-A Context-aware Data Transmission with CAT
The proposed model is based on a probabilistic process with the aim to calculate the transmission probability with a fixed channel assessment interval based on the measured network quality indicators. While the groundwork for this idea that is presented in [11] was purely focused on the SINR for assessing the channel quality, current off-the-shelf LTE modems and smartphones provide additional indicators, that allow a finer-grained analysis of the current connectivity situation. Therefore, an abstract metric is introduced, which is described by its assumed minimum value and its maximum value that implicitly define the operation range . Each indicator contained in the channel context can be mapped to a corresponding metric . In order to allow the comparison of multiple metrics that are related to different value ranges (e.g., RSRP and RSRQ), the measured metric value is transformed into the normed current metric value with Eq. 1. This approach also enables the joint consideration of multiple different metrics [15].
| (1) |
The resulting transmission probability is then computed with Eq. 5. With being the elapsed time since the last performed transmission, is computed based on the measured channel quality, if the time interval condition is fulfilled. guarantees a minimum packet size and specifies a maximum buffering delay that corresponds to the actual application requirements.
| (5) |
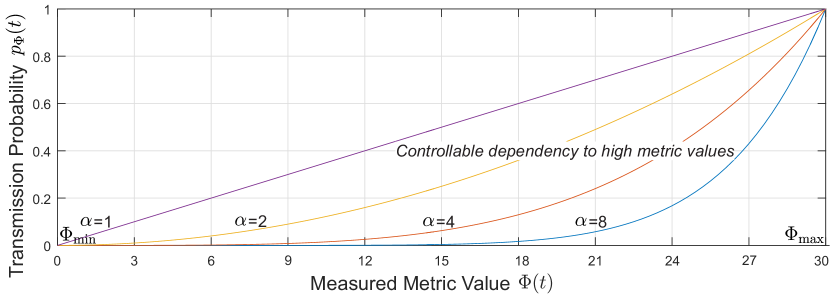
The formula allows to control to which extend a metric should prefer values that are close to by the weighting exponent . Fig. 4 shows the resulting analytical temporal behavior for different values of . If the time interval condition is fulfilled and exceeds , the transmission probability is and the transmission is performed in any case.
III-B Context-predictive Data Transmission Exploiting Multi-layer Connectivity Maps with pCAT
In the following, the previously presented CAT scheme is extended to the context-predictive pCAT that leverages a priori information about the channel quality along the anticipated trajectory. The aim is to optimize the data transmission scheduling further by integrating knowledge about the future network state into the transmission process. As the basic requirement to predict the future channel context is the availability of a position forecast for a defined prediction horizon , pCAT is divided into a mobility prediction component and the actual transmission process.
III-B1 Mobility Prediction
In the following, multiple prediction approaches, that exploit different sensors and information types and differ in the implementation complexity are discussed. Since Global Positioning System (GPS) coordinates and the World Geodetic System 1984 (WGS84) reference frame are used in the live-system, all calculations have to be performed in the orthodromic domain [39]. Nevertheless, the formulas are presented in a cartesian coordinate system for better understanding here. The proposed scheme focuses on the use of generic approaches that can be efficiently used in a live-system without involving a high computation overhead. More complicated approaches based on maneuver detection [40] have been proposed in literature and will be considered for future extensions.
GPS-based Extrapolation
The most straightforward approach is to extrapolate the future position by using the location, direction and velocity information provided by the GPS receiver. With the north-aligned angular direction and the current vehicle velocity , the future position is estimated with Eq. 6.
| (6) |
The advantage of using extrapolation is that it can be implemented in a very simple manner by using only the currently measured GPS information. However, it assumes the direction and the velocity to be constant for the duration of . Therefore, the resulting prediction accuracy is highly reduced — especially for larger values of — if the vehicle turns, encounters stop-and-go traffic or is influenced by traffic signals and other traffic participants.
Leveraging Trajectory-knowledge from the Navigation System
For overcoming the limitations of the previous approach, mobility prediction based on trajectory information is now discussed. While planned trajectories might be accessible through a direct interface to the navigation system — which will likely be the case for upcoming automated vehicles — this type of information could also be derived by exploiting the regularities in human behavior itself. In fact, the analysis in [41] points out that 95% of human mobility can be predicted by exploiting people’s regular movement on the same paths (e.g., the way to work or to grocery stores).
With the assumption of having data for the same track from multiple trips available, the segment-wise mean trajectory is calculated in a preprocessing step with the approach presented in [42].
During the online mobility prediction, the current trip is detected by the highest matching of the measured position and direction values to all locally stored trips.
is then derived by virtually moving the vehicle along the anticipated path for a duration of in an iterative process. For each prediction, the movement potential is computed and the traveled distance is initialized with . In each iteration , is incremented by the distance between the consecutive waypoints and . When exceeds , the final position is obtained from interpolation using Eq. 7.
| (7) |
Lightweight Trajectory-aware Approach - Prediction based on a Reference Trace
A lightweight alternative, that requires less data than the previous approach is to utilize the last measurements of the same track as a reference trace. The mobility prediction process itself is then equal to the one presented in Sec. III-B1, but the preprocessing stage is omitted as only a single track is utilized for the computation of the future position. Analogously, the connectivity map only contains the values of a single measurement drive per distinct track. The price to pay for the increased resource efficiency is the loss of the aggregation gain that is obtained by cell-wise averaging, which reduces the impact of outlier measurements, especially for highly dynamic metrics as the SINR. In Sec. VI-C, the resulting error for the network quality prediction is discussed for the considered mobility prediction methods.
III-B2 Context-predictive Transmission Process
With the predicted position being available after the mobility prediction step, the future channel context is looked up from the connectivity map as illustrated in Fig. 5. The cell index for the corresponding entry is obtained with Eq. 8 for a defined cell size .
| (8) |
The predicted metric value is extracted from and the anticipated gain is computed using Eq. 9.
| (9) |
Analogously to CAT, the transmission probability is then computed with respect to the defined timeouts using Eq. 13. For the consideration of the channel quality development, the pCAT-specific exponent is introduced, which controls the impact of the context prediction within Eq. 16.
| (13) |
| (16) |
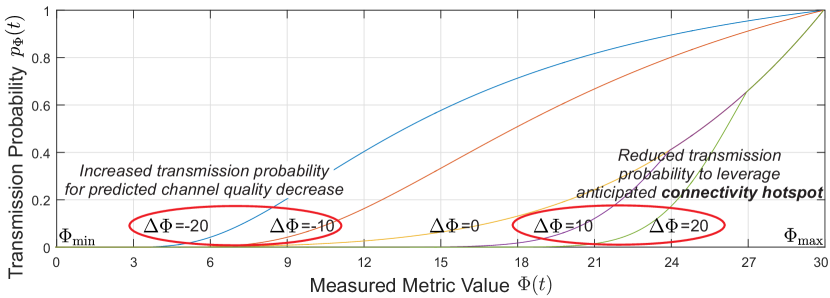
Fig. 6 shows the resulting analytical behavior of the transmission probability for different values of . While the scheme behaves equal to CAT for , pCAT sends earlier if it expects the channel quality to decrease in the future () and schedules the transmission to a later point of time if it anticipates an improvement for the network quality ().
Although pCAT only considers two discrete points of time and for its decision, it in fact behaves like a moving window as the vehicle moves forward on the track and the transmission decision is calculated frequently with respect to the channel assessment interval .
If any of the prediction steps fails (e.g., due to missing GPS signal or if the map does not contain data for the predicted cell), pCAT performs a context-aware fallback by switching to the purely probabilistic CAT model.
Although the necessary data collection highly benefits from the mutual synergies of a crowdsensing-based approach, the whole proposed scheme can also be implemented in a local sandbox for dealing with any privacy-related concerns.
III-C Machine Learning-based Data Rate Prediction
Predicting the data rate is a supervised learning task. Given the features of the measurements, a prediction model that predicts the data rate is applied. Different model classes are possible, each representing a different function class and pertaining a different list of parameters . Due to the supervised learning task, , labeled data is available as ground truth for the data rate. The error of a particular model function may thus be assessed by comparison of the predicted data rate to the known data rate. Possible loss functions are the Mean Absolute Error (MAE), which is a measure for the absolute distance among prediction and the true label, and the Root Mean Square Error (RMSE) measuring the Euclidean error.
| (17) | |||
| (18) |
Several model classes are possible. In order to decide on a model class, not only the performance on training instances is important but also the validation of novel, yet unseen, examples. Otherwise it could possibly happen that a model learns all examples ‘by heart’ and has perfect prediction performance on training instances but does not generalize at all - this phenomenon is defined as overfitting. Possible countermeasures against overfitting exist, e.g., recording a larger more diverse data set or choosing a model with less capacity, or including the capacity of the model in the objective function via a regularization term. The details on regularization are beyond the scope of this paper and can be found in [43]. The model selection is performed with the tool WEKA [44] and different model classes are tested. In this paper, the applied models are regression tree (in particular, the M5T [45]), RF [46], LR, ANN, and SVM [47]. All methods are discussed in [43], thus a brief overview of selected methods is provided here.
The simplest model is LR which fits a linear combination of the input features to the output label . A more sophisticated way is the split of the data set into regions and application of different linear models within different regions. The regression tree performs exactly these splits using axis parallel hyperplanes by comparison of each feature with a threshold. This distinction of feature vectors based on thresholds of its features is captured in a tree structure. In its leafs, different linear models are applied. The RF trains not one regression tree but multiple and learns a linear combination of their predictions. The theoretical aspects of artificial neural networks and support vector machines are out of scope of this paper, additional information can be found in [43].
| Model | Correlation | MAE [MBit/s] | RMSE [MBit/s] |
|---|---|---|---|
| ANN | 0.83 | 1.62 | 2.07 |
| LR | 0.57 | 2.19 | 2.92 |
| M5T | 0.86 | 1.33 | 1.81 |
| RF | 0.86 | 1.3 | 1.79 |
| SVM | 0.80 | 1.161 | 2.13 |
The evaluation of the prediction methods is performed based on more than 2500 real-world measurements of periodic and CAT-based transmissions that were performed in the context of earlier work in [15] on two different tracks (details about the measurement setup are provided in Sec. IV). The feature set is formed by RSRP, RSRQ, SINR, CQI and velocity measurements in combination with the payload size of the data packets. The label is defined as the measured data rate of the active transmissions.
Tab. I shows the resulting prediction performance for the considered models and evaluation metrics. Although the absolute highest accuracy is achieved with the RF model, it only performs slightly better than the M5T approach.
| Model | S | SH | H | HS |
|---|---|---|---|---|
| ANN | 0.842 | 0.839 | 0.829 | 0.819 |
| LR | 0.511 | 0.727 | 0.725 | 0.514 |
| M5T | 0.855 | 0.829 | 0.858 | 0.798 |
| RF | 0.872 | 0.844 | 0.868 | 0.862 |
| SVM | 0.799 | 0.572 | 0.813 | 0.699 |
In order to evaluate the generalizability of the learned relationship between context parameters and data rate which mirrors the dependency of the models of the tracks themselves, a cross-check with separated data sets — suburban (S) and highway (H) — is performed. Tab. II shows the resulting correlation between predicted and measured data rate for the different models. S and H show the 10-fold cross validation for each of the tracks. For SH and HS, the trained model is tested on the measurement data of the other track. It can be seen that the behaviors differ significantly for the different models. While ANN, M5T and RF show a similar behavior for all of the variants, the SVM accuracy is significantly reduced for SH and HS. The LR model does not work well on the suburban data set.
Based on the prediction results, the M5T model is chosen as the applied prediction model within the application phase. It achieves a good overall performance, allows a very lightweight implementation and can be used for online data rate prediction without causing significant computation overhead. For simplicity, in the following, the usage of the metric for sensor data transmissions will be referred to as ML-CAT, respectively ML-pCAT.
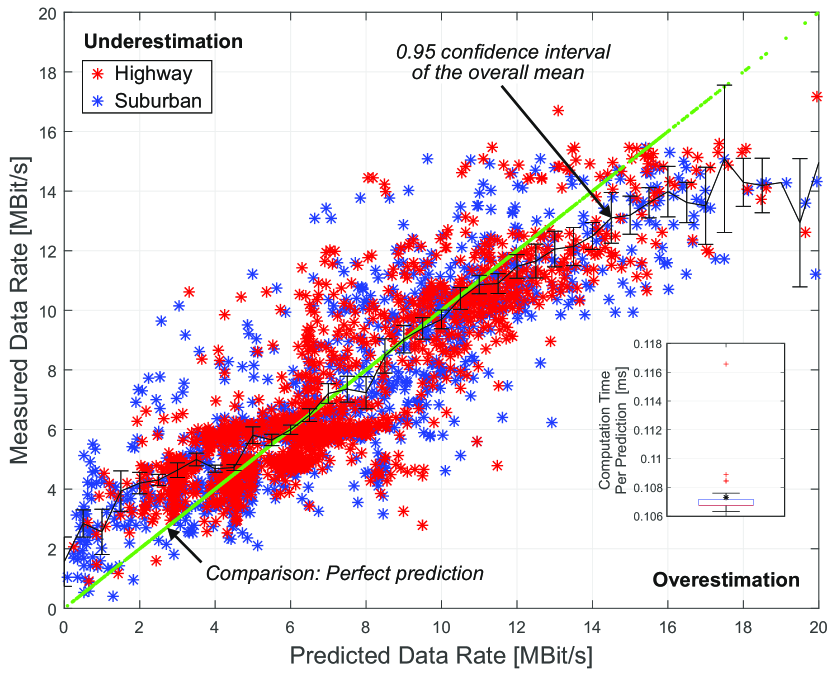
Fig. 7 shows the resulting prediction accuracy using M5T. The left upper triangle shows the underestimation area and the lower right triangle represents the overestimation area. From the application-centric perspective, underestimations are not considered harmful, as the transmission even achieves a higher data rate than expected.
IV Methodological Setup of the Empirical Performance Evaluation
In this section, the methodological aspects of the real world evaluation and the considered KPIs for the performance evaluation are introduced.
IV-A Real World Evaluation Scenario
In order to evaluate the properties of the proposed transmission schemes in a realistic scenario, a comprehensive empirical performance evaluation is performed in the public cellular LTE network and within a vehicular context. Tab. III provides a summary of the application-related key parameters.
| Parameter | Value |
|---|---|
| Sensor frequency | 1 Hz |
| Sensor payload size | 50 kByte |
| Channel assessment interval | 1 s |
| Minimum delay between two transmissions | 10 s |
| Maximum buffering time | 120 s |
| Prediction horizon | s |
| Connectivity map cell width | 25 m |
Channel sensing and data transmission are handled by an Android-based application (executed on a Samsung Galaxy S5 Neo - Model SM-G903F), which is provided in an Open Source way111Available at https://github.com/BenSliwa/MTCApp. Sensor packets of size are generated by a virtual sensor application with a sensor frequency and stored in a local buffer until a transmission decision is made for the whole data buffer. For each , the channel is sensed and the transmission probability is computed. All data transmissions are performed in the LTE uplink to a cloud server using HTTP POST. The different considered metrics and their respective parameterizations are shown in Tab. IV. CAT with the metric is equal to the legacy version presented in [11], analogously, pCAT with has the same behavior as [12]. The values for the weighting factor have to be chosen with respect to the metric’s value range and its granularity. In order to allow a fair comparison among the different metrics, is chosen with respect to the definition of metric and its respective value range with Eq. 19.
| min | -120 dBm | -11 dB | 0 dB | 2 | 0 MBit/s |
| max | -70 dBm | -4 dB | 30 dB | 16 | 18 MBit/s |
| 8 | 8 | 8 | 8 | 8 | |
| 0.3 | 2.14 | 0.5 | 1.07 | 1 |
| (19) |
For the context-predictive pCAT, the connectivity map and the trajectory prediction utilize the acquired data of the CAT evaluation phase.
The raw data of the experimental evaluation of the different transmission schemes is provided at [48] and the measurement software as well as the obtained data samples for the transmission power estimation can be accessed via [49].
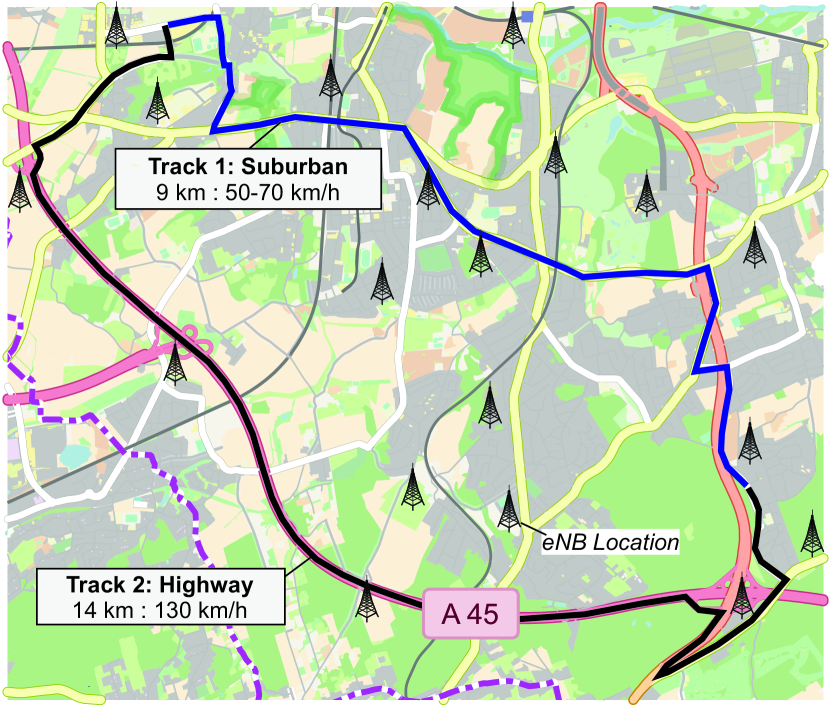
Fig. 8 shows the street map with the different tracks used for the experimental performance evaluation.
-
•
Track 1: Suburban roads with upper speed limits in the range of 50-70 ()
-
•
Track 2: Highway traffic with upper speed limits of ()
Each parameterization of the transmission schemes has been evaluated five times on each of the tracks. Overall, more than 7500 data transmissions were performed within a total driven distance of more than . On the application layer, all data transmissions were performed successfully.
IV-B Key Performance Indicators
In the result section of this paper, the performance of different transmission schemes is compared in three dimensions.
End-to-end Data Rate: The data rate evaluations are performed on the application level and are considered as a measurement for the transmission-efficiency of data packets. Moreover, since high data rates indicate short transmission durations, data rate optimization is also related to early release of occupied spectrum resources. The potentials for improving the coexistence of different resource-consuming cell users are further investigated in [11].
Age of Information (AoI): AoI is a metric for the freshness of information of delay-tolerant applications such as crowdsensing and data analytics. Therefore, it provides a better match with the considered crowdsensing use-case than delay measurements. In the considered definition , it covers the time from the data generation (e.g., the actual measurement report of a physical sensor) to the reception time of the information by the processing application and also includes the delays caused by buffering and transmission. From an application point of view, information is considered useless if a certain AoI value is exceeded. For the proposed transmission scheme, the resulting AoI is mainly impacted by the buffering delay and can be controlled with the timeouts and . Since all transmitted data packets contain multiple measurement values that have individual times of generation, the AoI of a data packet is defined as the mean age of all contained sensor measurements.
Energy-efficiency: Although the real world evaluations are carried out with a ground-based vehicular setup, where the energy consumption of the communication system is negligible, the achieved results and methods are relevant to related research fields. The integration of small-scale UAVs into upcoming ITSs – e.g., for near field delivery and aerial sensing – is currently receiving great attention within the scientific community [4]. As these vehicles are severely constrained by the available energy resources, the improvement of the overall power consumption is of great importance for optimizing the total operation time [5]. In the context of IoT-enabled logistics [9], smart containers, which are equipped with battery powered communication systems, report status information and sensor measurements (e.g., temperature values) to enable continuous tracking and monitoring. In addition, autonomous systems within the car itself are powered by dedicated batteries (e.g., anti-theft systems). The results in Sec. VI show that the proposed transmission scheme has a severe impact on the overall power consumption of the mobile device. Therefore, we consider the energy-efficiency as one of the KPIs, as it allows us to point out improvement potentials for the related application fields, which typically implement periodic data transmission mechanisms.
The uplink power consumption is mainly depending on the actual transmission power of the User Equipment (UE) and related to the different amplification states of the power amplifiers [50]. Since is usually not reported by embedded devices and smartphones, a mechanism for accessing this hidden parameter using machine learning and direct modem interfacing is presented in Sec. V.
V Machine Learning-enabled Post-processing Uplink Power Consumption Analysis
Performing communication-related power consumption measurements of an embedded device is a non-trivial task that requires precise isolation of physical components and involved software. As numerous components of the system, such as modem and processor, are highly integrated into a single System on a Chip (SoC), it is not possible to measure the modem’s power consumption isolatedly. On the other hand, measurements of the whole system’s power consumption are superimposed by any other system activities, e.g. GPS, IO operations, and background services. Consequently, such measurements are rather performed within a laboratory setup and not with a highly integrated mobile system. In order to allow the evaluation of the energy-efficiency of CAT on (mobile) embedded platforms, a closed process for isolated uplink power consumption analysis is derived in the following that combines existing models and approaches [51, 52, 16]. Fig. 9 shows the overall architecture model. Accurate laboratory measurements are used to obtain the device-specific behavior characteristics of power consumption with regard to the applied transmission power.
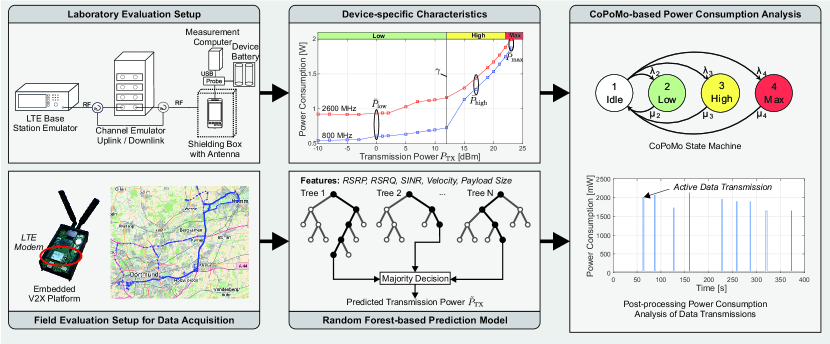
The Context-aware Power Consumption Model (CoPoMo) [51] is a validated model, which uses device-specific characteristics obtained from laboratory evaluations to estimate the power consumption for uplink transmissions as a function of the transmission power within a state machine. Fig. 9 includes the characteristic curve of the Galaxy S5 Neo smartphone operating in two different frequency bands for a transmission power range of to [52]. For a single frequency band, e.g., the blue curve, the characteristics can be approximated by two linear functions of different slope, which are separated by a device-specific break point . This behavior is caused by switching between two different internal power amplifiers. CoPoMo further reduces the characteristics to a probabilistic four-state power model with negligible loss of accuracy. Depending on the radio conditions, a UE uploads its data with Low, High, or Max power and enters Idle mode afterwards. The state transitions are modeled by the transition probabilities and that are obtained from the corresponding data set. Calculating the equilibrium state of the Markovian chain finally provides an estimate for the UE power consumption in the given scenario.
Unfortunately, in the context of this paper, the model cannot directly be applied as embedded operating systems (e.g., Android) do not provide information about the currently used transmission power and therefore circumvent the determination of the current power state. As a consequence, this paper applies a novel machine learning-based approach for power estimation [16], which is based on the available LTE downlink indicators. According to the LTE standard [53], UEs choose their transmission power based on Eq. 22:
| (22) |
is broadcasted by the eNB and depicts the target SINR per Physical Resource Block (PRB) of the received signal at the eNB. Thus, the UE at least has to compensate the estimated path loss , which is derived from RSRP and the actual transmission power of the eNB. It is weighed by a Fractional Path Loss Compensation (FPC) , which is also configured by the base station. An additional offset ensures a sufficient SINR for the selected Modulation and Coding Scheme (MCS). Finally, the transmission power needs to be increased according to the number of emitted PRBs in order to keep the received SINR constant regardless of the number of allocated resources.
The closed-loop component is an absolute or accumulated offset, which is transmitted in Transmission Power Control (TPC) commands by the base station in Physical Downlink Control Channel (PDCCH) together with the resource allocations. By this approach, the eNB can increase or turn down the output power of the UE in a feedback loop. However, the eNB never transmits an absolute value to the UE.
Since , , and can be seen as network constants and should average to for a well-configured network, only , , and have to be obtained in order to estimate the transmission power at application layer. Although these remaining variables are not accessible as well, they are tightly related to observable indicators. The path loss is internally calculated from the RSRP. However, the eNB’s reference signal transmit power still remains unknown to the application layer. The number of allocated PRBs corresponds to the resulting data rate at a given MCS. Unfortunately, in case of a prediction, the data rate is not available as an indicator. However, assuming a non-congested network, the data rate follows the Transmission Control Protocol (TCP) slow start mechanism during the transmission, which depends on the upload size and the maximum achievable rate. The latter is related to , since and are capped by for large . For , the lookup table provides MCS-dependent power offsets to ensure a proper SINR for a correct demodulation and decoding at the base station. Interference and mobility (fast fading) adversely affect the MCS, which can be indicated by RSRQ and the UE’s velocity. According to the UE’s power headroom, the eNB may select the highest possible MCS to maximize throughput and spectral efficiency. Hence, this value is also related to and .
However, the exact relationship of these variables is blurred by case differentiation and operator-specific configurations of their base stations, which makes analytical approaches complex and impractical. Therefore, a data-driven approach leverages machine learning to obtain a prediction model for , which is presented in [16]. The work analyzes the usage of different indicators and machine learning techniques for the estimation of in detail. It also provides different prediction models for simulations, practical applications and detailed analysis, which differ in the number of available indicators for this task. The data is obtained in excessive field measurements of drive tests in public cellular networks. An overview of the covered trajectory is shown in Fig. 9 and covers urban, suburban, and rural environments. The measurements were performed using an embedded Vehicle-to-everything (V2X) platform with a direct modem interface, which allows to access the current transmission power in order to obtain the ground truth label for the prediction. The device was placed in the rear trunk of a car and periodically uploaded files of to to a HTTP server. The integrated LTE modem provides 31 network indicators including the current transmission power. From the three considered machine learning models, Ridge Regression (RR), Deep Learning (DL), and RF, the latter achieved the lowest RMSE of to , depending on the feature set. In addition, the absolute sum of errors shrinks as the number of predictions grows and falls below after predictions. Hence, this approach is well-suited for long-term applications and post-processing analysis of large data sets.
In this paper, the RF-based approach for practical applications is applied to predict the for transmissions based on the indicators RSRP, RSRQ, SINR, upload size, and the vehicle’s velocity. Finally, the dwell times of CoPoMo’s four-state model are computed by mapping the predictions into the corresponding power states, which in turn enables an estimation of the average power consumption of the UE.
In conclusion, the presented process allows to analyze the energy-efficiency of the considered transmission schemes without the requirement for dedicated measurement equipment and explicitly without knowledge of the applied transmission power. Although this approach is utilized for offline result analysis in the next section, it can also be applied for online prediction directly on the embedded device.
VI Empirical Results of Vehicular Sensor Data Transfer
In this section, the results of the empirical performance evaluation are presented and discussed. At first, the impact of the different considered context information on the resulting uplink data rate is evaluated. Afterwards, results for data rate, age of information and uplink power consumption are presented for the context-aware transmission scheme using CAT with different single downlink indicators as transmission metrics. Then, the accuracy of the mobility prediction schemes and their impact on the predictability of the future context information is discussed and the results for the context-predictive scheme pCAT are presented. Finally, detailed measurements for the machine learning-enabled transmission methods ML-CAT and ML-pCAT are provided.
VI-A Correlation of Downlink Indicators and Data Rate
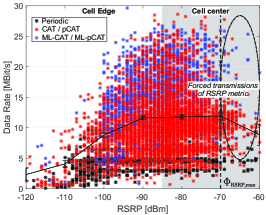
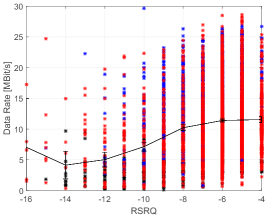
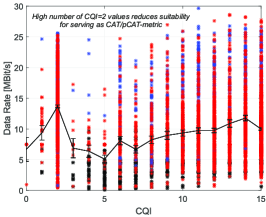
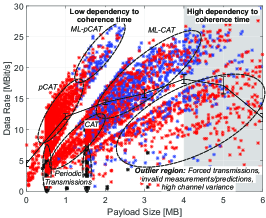
The correlation of RSRP, RSRQ, SINR, CQI, velocity and payload size with the resulting data rate is shown in Fig. 10. Since these indicators also are the features of the data rate prediction, the analysis gives an impression about the importance of the different features for the overall prediction behavior. The plots contain the individual transmissions of the whole data set, consisting of periodic, CAT and pCAT data transfer.

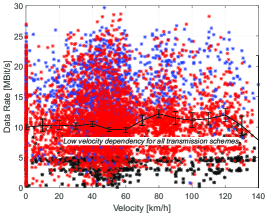
It should be denoted that the resulting value range of the data rate exceeds the limits given by the data rate prediction shown in Fig. 7. The reason for this behavior is that the pCAT-based and the machine learning-enabled schemes, which mainly achieve these high values, were not part of the used training set (see Sec. III-C). Furthermore, the plots contain multiple forced transmissions, which are triggered for all CAT-based approaches, if .
As expected, the data points for the periodic transmission scheme are uniformly distributed among the value ranges of the respective metrics as the transmissions are performed regardless of the channel quality.
The characteristics of the RSRP can be divided into two distinct areas that are divided by a breakpoint at , that allows a division into cell edge- and cell center-behavior. In the cell edge area, the RSRP is a dominant factor for the achievable data rate, which is increased with higher RSRP values. Within the cell center, the dependency is decoupled since other effects (e.g. interference) have a more dominant influence on the behavior.
The behavior of the CQI shows a peak for CQI=2. During the drive tests, those values occured frequently on both tracks and without any obvious correlation to the other indicators. For LTE, the actual calculation of this indicator is not standardized and depends on the modem manufacturer. It can be concluded that the reported CQI is limited for being used as a CAT-metric, which is also confirmed by the evaluations in the following sections.
Although the drive tests were performed within a velocity range of , the observed dependency of the data rate to the velocity is very low.
For the payload size, multiple lobes can be identified that separate periodic transmissions, CAT, pCAT, ML-CAT and ML-pCAT. Another region mainly consists of outliers that are related to forced transmissions either caused by or as well as inaccurate measurements and high channel variances.
It can be observed that the machine learning approaches are systematically able to achieve higher data rates for the same payload size. Especially the introduced look-ahead of ML-pCAT approaches is able to proactively avoid transmissions during low channel quality periods. This fact is underlined by the correlation analysis in [15], that is based on an earlier version of the data set and does not contain the pCAT- and ML-pCAT-specific lobes.
The value range for the payload size is limited to as is defined as and the sensor application generates of data per second.
The overall behavior can be characterized by two areas that have different grades of dependencies to the channel coherence time. Up to , the data rate highly benefits from increased payload sizes as the slow start of TCP is less dominant for the overall transmission duration and a better payload-overhead-ratio is achieved. After the breakpoint, the probability for low data rate transmissions is highly increased as the channel is more likely changing its characteristics during active transmissions due to the longer transmission duration.
The correlation analysis shows that no single indicator is able to provide a robust measurement for the channel quality in all considered situations.
VI-B Single-metric Context-aware Transmission
The results for the context-aware transmission are shown in Fig. 11. Multiple variants of CAT are configured with each of the passive downlink indicators as a metric according to Tab. IV. The results for periodic transmission with a fixed interval of are shown as reference.
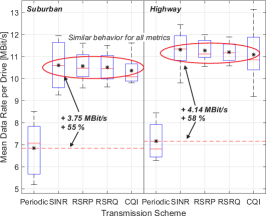
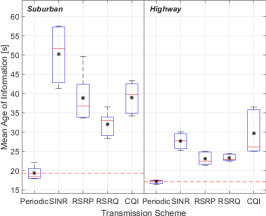
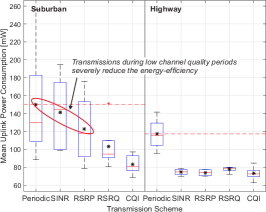
Using the context-aware approach, an average data rate gain of is achieved for CAT-based metrics with and having the highest variance during the different evaluation tests. Although the results for the data rate are similar for all CAT-based metrics, the AoI behavior shows significant differences, which are related to the dynamics of the corresponding network quality indicator during the drive tests. Here, high AoI values are an indicator for longer periods of low channel quality that prevent the vehicle from transmitting its data. In the suburban scenario, the SINR values are rarely close to and even multiple transmissions are forced by the maximum buffering delay , resulting in a very high AoI. All schemes highly exceed the baseline defined by the periodic transmission approach. Yet, the up-to-dateness of sensor measurements is still sufficient for the considered crowdsensing scenario (see Sec. I). On the highway track, the average AoI is reduced, as the measurement channel behavior is frequently changing due to the high velocity of the vehicle, resulting in a higher transmission frequency. These aspects are further confirmed by analyzing the uplink power consumption. It can be seen that transmissions during low quality periods — here most clearly illustrated by the -related forced transmissions for the SINR-metric — severely increase the average power consumption and reduce the energy-efficiency.
VI-C Impact of Mobility Prediction on the Network Quality Indicators
Before the measurement results of the context-predictive transmission schemes are presented, the accuracy of the mobility prediction mechanisms and the impact of prediction errors on the channel context estimation is discussed.
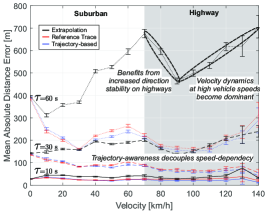
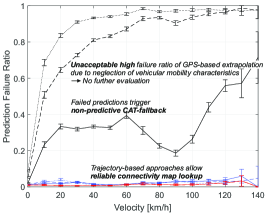

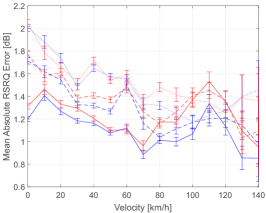
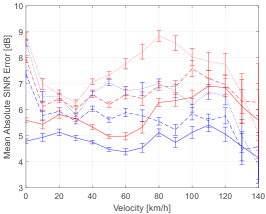
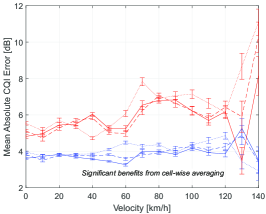
An evaluation of the velocity-dependent mobility prediction accuracy as well as the implications for error-effected forecasts on the network quality assessment is provided in Fig. 12. The accuracy of the GPS extrapolation approach is significantly influenced by the probability of direction changes during the prediction horizon . With regard to the speed-dependency of the prediction error, three characteristical regions can be identified. Up to (urban/suburban roads), the error dimension is proportional to the velocity. For higher velocities, the vehicle is more likely moving on a highway track with a low probability for direction changes. However, above the higher prediction distance becomes the dominant error source again. For the trajectory-aware approaches, the resulting distance error is much lower. Moreover, due to the consideration of the vehicle’s turn behavior, the dependency between prediction accuracy and velocity is decoupled, allowing robust predictions even for higher values of . The future position is used to look up the future channel context from the connectivity map. Therefore, inaccurate forecasts may lead to situations where the connectivity map does not contain data for the (falsely) predicted cell, which is statistically captured by the Prediction Failure Ratio (PFR) metric. For the pCAT-based schemes, prediction failures trigger the CAT-fallback, where the respective transmission scheme behaves equally to a pure probabilistic CAT scheme with the same metric properties. As a consequence, only the trajectory-based prediction methods are further considered in the following as the PFR is unacceptably low for the extrapolation approach. For assessing the added information by predicting the passive downlink indicators, the resulting error has to be set into relation to the value range of the corresponding metric and is severely influenced by the accuracy of the position prediction. While for RSRP and RSRQ only slight differences between the two prediction approaches can be observed, SINR and CQI achieve an aggregation gain by the cell-wise averaging within the connectivity maps. As both indicators are affected by short-term fading, the single reference trace is not able to provide an accurate estimation.
VI-D Single-metric Context-predictive Transmission
As a consequence of the prediction accuracy analysis, the context-predictive pCAT scheme uses the trajectory-based mobility prediction with connectivity maps.
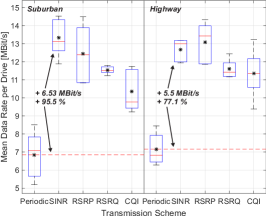
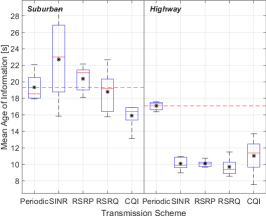
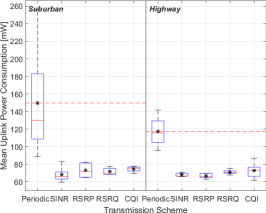
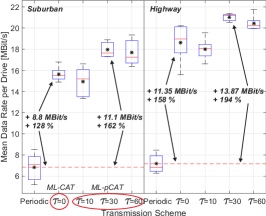
Fig. 13 shows the results for the considered KPIs with prediction horizon . By consideration of the future channel behavior, pCAT adds another dimension that is sensitive to the dynamics of the channel quality and significantly changes the transmission behavior. With the vehicle proceeding on its route, the channel context is considered with a moving window with the range . As a consequence, the transmission scheme is much more influenced by the probability of the vehicle encountering the anticipated context within the remaining time interval to than on having a perfect prediction for a discrete point in time.
Additionally, transmissions are performed more often, resulting in a reduced AoI, which is even falling below the baseline of the periodic approach on the highway track.
In contrast to CAT, the resulting data rate is significantly different for the considered metrics as it is now also depending on the predictability of the metrics themselves. The highest gains are achieved with the SINR- and the RSRP-metrics (up to on the suburban track and up to on the highway track).
Due to the doubled dependency to the channel dynamics by consideration of and and the proactive detection of connectivity valleys, transmissions are less likely forced by . As a consequence, the power consumption behavior of pCAT significantly outperforms the CAT-based approach.
VI-E Machine Learning-enabled Transmission
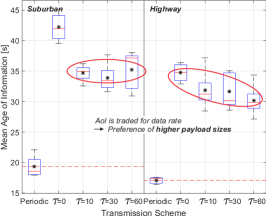
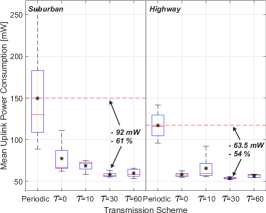
The machine learning-enabled schemes exploit the correlation of the individual features with the resulting data rate as shown in Fig. 10 with the aim of data rate optimization. Both variants are able to achieve massive boosts in the resulting data rate. The best overall performance is achieved for ML-pCAT with on the highway track, where it is able to achieve a data rate gain of while simultaneously reducing the average uplink power consumption by . In comparison to the previously discussed results for single-metric pCAT, the AoI is increased as ML-CAT and ML-pCAT highly exploit the correlation between payload size and data rate. Therefore, these approaches actively introduce additional buffering delays to achieve higher packet sizes.
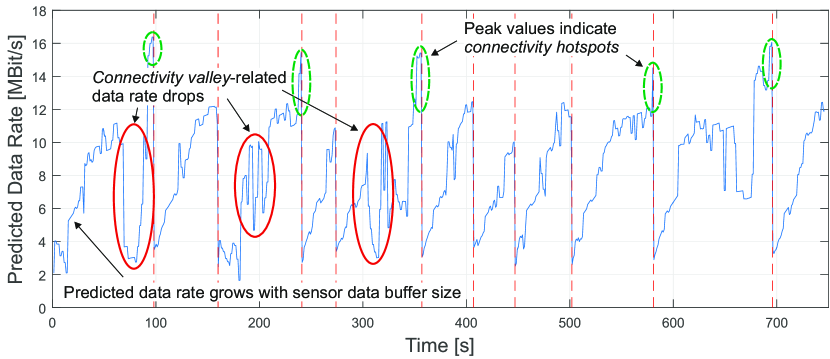
This relationship is also illustrated in Fig. 15, which shows an example trace of the temporal behavior of the M5T-based data rate prediction during a drive test. The dependency of the data rate to the payload size can be observed by the step-wise linear component of the curve that is caused by the payload increase due to the addition of further sensor data packets with respect to the increased time.
In comparison to the single-metric transmission schemes and with regard to the complex interdependencies of context parameters and data rate, it can be concluded that the data rate prediction provides a much better metric for channel quality assessment than the measured value of a single indicator. Machine learning enables the implicit consideration of hidden effects such as TCP slow start, channel coherence time and interdependencies between the downlink indicators into the transmission process itself.
VII Conclusion and Future Work
In this paper, we presented the machine learning-enabled transmission schemes ML-CAT and ML-pCAT for client-side context-aware transmission of vehicular sensor data. Machine learning-based data rate prediction is used as a meaningful metric for scheduling the transmission time of delay-tolerant sensor data transmissions. By implicit consideration of hidden effects such as interdependency of payload size and channel coherence time, the resulting data rate can highly be improved while simultaneously reducing the required uplink transmission power of the embedded device. The latter is a crucial factor for data sensing by energy-constraint vehicles (e.g., UAVs) and embedded systems. The trade-off between achieved benefits and introduced delay due to local packet buffering can be controlled by different parameters and variants of the proposed probabilistic transmission scheme. All measurement tools and raw results of the experiments are provided in an Open Access manner in order to achieve a high level of transparency and reproducibility. In future work, we will investigate the cross-layer interdependencies of the proposed transmission scheme. Furthermore, we aim to improve the data rate prediction by integrating knowledge about the active cell users obtained from control channel analysis. Moreover, the proposed approach will be brought together with methods for coordinated pre-aggregation of the data in vehicular crowds. Additionally, the mobility prediction algorithms will be evaluated in their potentials for predictive steering of millimeter wave (mmWave) pencil beams in a vehicular context.
Acknowledgment
Part of the work on this paper has been supported by Deutsche Forschungsgemeinschaft (DFG) within the Collaborative Research Center SFB 876 “Providing Information by Resource-Constrained Analysis”, projects A1, A4, and B4.
References
- [1] E. R. Cavalcanti, J. A. R. de Souza, M. A. Spohn, R. C. d. M. Gomes, and A. F. B. F. d. Costa, “VANETs’ research over the past decade: Overview, credibility, and trends,” SIGCOMM Comput. Commun. Rev., vol. 48, no. 2, pp. 31–39, May 2018.
- [2] S. Wang, S. Kodagoda, L. Shi, and H. Wang, “Road-terrain classification for land vehicles: Employing an acceleration-based approach,” IEEE Vehicular Technology Magazine, vol. 12, no. 3, pp. 34–41, Sept 2017.
- [3] C. T. Calafate, K. Cicenia, O. Alvear, J. C. Cano, and P. Manzoni, “Estimating rainfall intensity by using vehicles as sensors,” in 2017 Wireless Days, March 2017, pp. 21–26.
- [4] H. Menouar, I. Guvenc, K. Akkaya, A. S. Uluagac, A. Kadri, and A. Tuncer, “UAV-enabled intelligent transportation systems for the smart city: Applications and challenges,” IEEE Communications Magazine, vol. 55, no. 3, pp. 22–28, March 2017.
- [5] Y. Zeng and R. Zhang, “Energy-efficient UAV communication with trajectory optimization,” IEEE Transactions on Wireless Communications, vol. 16, no. 6, pp. 3747–3760, June 2017.
- [6] Directive 2010/40/EU, European Commission Technical Specification, Rev. Commission Delegated Regulation (EU) of 13.3.2019 supplementing Directive 2010/40/EU, Mar 2019.
- [7] S. Djahel, R. Doolan, G. M. Muntean, and J. Murphy, “A communications-oriented perspective on traffic management systems for smart cities: Challenges and innovative approaches,” IEEE Communications Surveys Tutorials, vol. 17, no. 1, pp. 125–151, Firstquarter 2015.
- [8] Y. Zhang and A. Arvidsson, “Understanding the characteristics of cellular data traffic,” in Proceedings of the 2012 ACM SIGCOMM Workshop on Cellular Networks: Operations, Challenges, and Future Design, ser. CellNet ’12. New York, NY, USA: ACM, 2012, pp. 13–18.
- [9] A. Zanella, N. Bui, A. Castellani, L. Vangelista, and M. Zorzi, “Internet of things for smart cities,” IEEE Internet of Things Journal, vol. 1, no. 1, pp. 22–32, Feb 2014.
- [10] N. Bui, M. Cesana, S. A. Hosseini, Q. Liao, I. Malanchini, and J. Widmer, “A survey of anticipatory mobile networking: Context-based classification, prediction methodologies, and optimization techniques,” IEEE Communications Surveys & Tutorials, 2017.
- [11] C. Ide, B. Dusza, and C. Wietfeld, “Client-based control of the interdependence between LTE MTC and human data traffic in vehicular environments,” IEEE Transactions on Vehicular Technology, vol. 64, no. 5, pp. 1856–1871, May 2015.
- [12] C. Wietfeld, C. Ide, and B. Dusza, “Resource-efficient wireless communication for mobile crowd sensing,” in 51st ACM/EDAC/IEEE Design Automation Conference (DAC). San Fransisco, USA: IEEE, June 2014.
- [13] J. Pillmann, B. Sliwa, C. Kastin, and C. Wietfeld, “Empirical evaluation of predictive channel-aware transmission for resource efficient car-to-cloud communication,” in IEEE Vehicular Networking Conference (VNC), Torino, Italy, Nov 2017.
- [14] B. Sliwa, T. Liebig, R. Falkenberg, J. Pillmann, and C. Wietfeld, “Machine learning based context-predictive car-to-cloud communication using multi-layer connectivity maps for upcoming 5G networks,” in 2018 IEEE 88th IEEE Vehicular Technology Conference (VTC-Fall), Chicago, USA, Aug 2018.
- [15] ——, “Efficient machine-type communication using multi-metric context-awareness for cars used as mobile sensors in upcoming 5G networks,” in 2018 IEEE 87th IEEE Vehicular Technology Conference (VTC-Spring), Porto, Portugal, Jun 2018, Best Student Paper Award.
- [16] R. Falkenberg, B. Sliwa, N. Piatkowski, and C. Wietfeld, “Machine learning based uplink transmission power prediction for LTE and upcoming 5G networks using passive downlink indicators,” in 2018 IEEE 88th IEEE Vehicular Technology Conference (VTC-Fall), Chicago, USA, Aug 2018.
- [17] Q. Shi and M. Abdel-Aty, “Big data applications in real-time traffic operation and safety monitoring and improvement on urban expressways,” Transportation Research Part C: Emerging Technologies, vol. 58, pp. 380 – 394, 2015, big Data in Transportation and Traffic Engineering.
- [18] W. Vandenberghe, E. Vanhauwaert, S. Verbrugge, I. Moerman, and P. Demeester, “Feasibility of expanding traffic monitoring systems with floating car data technology,” IET Intelligent Transport Systems, vol. 6, no. 4, pp. 347–354, Dec 2012.
- [19] L. J. Chen, Y. H. Ho, H. H. Hsieh, S. T. Huang, H. C. Lee, and S. Mahajan, “ADF: An anomaly detection framework for large-scale PM2.5 sensing systems,” IEEE Internet of Things Journal, vol. 5, no. 2, pp. 559–570, April 2018.
- [20] M. K. Giluka, T. V. Pasca, N. Rajoria, and B. R. Tamma, “On efficient scheduling of H2H traffic and reducing signaling overhead due to uplink small data M2M traffic in LTE-A networks,” Wireless Personal Communications, Jul 2018.
- [21] Z. Feng, Z. Feng, and T. A. Gulliver, “Biologically inspired two-stage resource management for machine-type communications in cellular networks,” IEEE Transactions on Wireless Communications, vol. 16, no. 9, pp. 5897–5910, Sept 2017.
- [22] H. Hu, R. Lu, C. Huang, and Z. Zhang, “TripSense: A trust-based vehicular platoon crowdsensing scheme with privacy preservation in VANETs,” Sensors, vol. 16, no. 6, 2016.
- [23] P. Hui, J. Crowcroft, and E. Yoneki, “BUBBLE Rap: Social-based forwarding in delay-tolerant networks,” IEEE Transactions on Mobile Computing, vol. 10, no. 11, pp. 1576–1589, Nov 2011.
- [24] Y. Li, M. Qian, D. Jin, P. Hui, Z. Wang, and S. Chen, “Multiple mobile data offloading through disruption tolerant networks,” IEEE Transactions on Mobile Computing, vol. 13, no. 7, pp. 1579–1596, July 2014.
- [25] J. Wan, D. Zhang, S. Zhao, L. T. Yang, and J. Lloret, “Context-aware vehicular cyber-physical systems with cloud support: Architecture, challenges, and solutions,” IEEE Communications Magazine, vol. 52, no. 8, pp. 106–113, Aug 2014.
- [26] C. Jiang, H. Zhang, Y. Ren, Z. Han, K. C. Chen, and L. Hanzo, “Machine learning paradigms for next-generation wireless networks,” IEEE Wireless Communications, vol. 24, no. 2, pp. 98–105, April 2017.
- [27] N. Bui and J. Widmer, “Data-driven evaluation of anticipatory networking in LTE networks,” IEEE Transactions on Mobile Computing, vol. PP, no. 99, pp. 1–1, 2018.
- [28] R. Falkenberg, K. Heimann, and C. Wietfeld, “Discover your competition in LTE: Client-based passive data rate prediction by machine learning,” in IEEE Globecom, Singapore, Dec 2017.
- [29] F. Jomrich, A. Herzberger, T. Meuser, B. Richerzhagen, R. Steinmetz, and C. Wille, “Cellular bandwidth prediction for highly automated driving - Evaluation of machine learning approaches based on real-world data,” in Proceedings of the 4th International Conference on Vehicle Technology and Intelligent Transport Systems 2018, no. 4. SCITEPRESS, Mar 2018, pp. 121–131.
- [30] A. Samba, Y. Busnel, A. Blanc, P. Dooze, and G. Simon, “Instantaneous throughput prediction in cellular networks: Which information is needed?” in 2017 IFIP/IEEE Symposium on Integrated Network and Service Management (IM), May 2017, pp. 624–627.
- [31] B. Sliwa and C. Wietfeld, “Empirical analysis of client-based network quality prediction in vehicular multi-MNO networks,” arXiv e-prints, p. arXiv:1904.10177, Apr 2019, Submitted for publication.
- [32] M. Akselrod, N. Becker, M. Fidler, and R. Luebben, “4G LTE on the road - what impacts download speeds most?” in 2017 IEEE 86th Vehicular Technology Conference (VTC-Fall), Sep. 2017, pp. 1–6.
- [33] C. Chen, T. H. Luan, X. Guan, N. Lu, and Y. Liu, “Connected vehicular transportation: Data analytics and traffic-dependent networking,” IEEE Vehicular Technology Magazine, vol. 12, no. 3, pp. 42–54, Sept 2017.
- [34] M. D. Cia, F. Mason, D. Peron, F. Chiariotti, M. Polese, T. Mahmoodi, M. Zorzi, and A. Zanella, “Mobility-aware handover strategies in smart cities,” in 2017 International Symposium on Wireless Communication Systems (ISWCS), Aug 2017, pp. 438–443.
- [35] B. Sliwa, D. Behnke, C. Ide, and C. Wietfeld, “B.A.T.Mobile: Leveraging mobility control knowledge for efficient routing in mobile robotic networks,” in IEEE GLOBECOM 2016 Workshop on Wireless Networking, Control and Positioning of Unmanned Autonomous Vehicles (Wi-UAV), Washington D.C., USA, Dec 2016.
- [36] M. Kasparick, R. L. G. Cavalcante, S. Valentin, S. Stańczak, and M. Yukawa, “Kernel-based adaptive online reconstruction of coverage maps with side information,” IEEE Transactions on Vehicular Technology, vol. 65, no. 7, pp. 5461–5473, July 2016.
- [37] T. Pögel and L. Wolf, “Optimization of vehicular applications and communication properties with connectivity maps,” in 2015 IEEE 40th Local Computer Networks Conference Workshops (LCN Workshops), Oct 2015, pp. 870–877.
- [38] S. Haykin, “Cognitive radio: Brain-empowered wireless communications,” IEEE Journal on Selected Areas in Communications, vol. 23, no. 2, pp. 201–220, Feb 2005.
- [39] A. Weintrit and P. Kopacz, “Computational algorithms implemented in marine navigation electronic systems,” in Telematics in the Transport Environment, J. Mikulski, Ed. Berlin, Heidelberg: Springer Berlin Heidelberg, 2012, pp. 148–158.
- [40] A. Houenou, P. Bonnifait, V. Cherfaoui, and W. Yao, “Vehicle trajectory prediction based on motion model and maneuver recognition,” in 2013 IEEE/RSJ International Conference on Intelligent Robots and Systems, Nov 2013, pp. 4363–4369.
- [41] C. Song, Z. Qu, N. Blumm, and A.-L. Barabási, “Limits of predictability in human mobility,” Science, vol. 327, no. 5968, pp. 1018–1021, 2010.
- [42] B. Niehöfer, R. Burda, C. Wietfeld, F. Bauer, and O. Lueert, “GPS community map generation for enhanced routing methods based on trace-collection by mobile phones,” in 2009 First International Conference on Advances in Satellite and Space Communications, July 2009, pp. 156–161.
- [43] H. Trevor, T. Robert, and F. JH, “The elements of statistical learning: data mining, inference, and prediction,” 2009.
- [44] M. Hall, E. Frank, G. Holmes, B. Pfahringer, P. Reutemann, and I. H. Witten, “The WEKA data mining software: An update,” SIGKDD Explorations, vol. 11, no. 1, pp. 10–18, 2009.
- [45] J. R. Quinlan, “Learning with continuous classes.” World Scientific, 1992, pp. 343–348.
- [46] L. Breiman, “Random forests,” Machine Learning, vol. 45, no. 1, pp. 5–32, Oct 2001.
- [47] B. Scholkopf and A. J. Smola, Learning with kernels: support vector machines, regularization, optimization, and beyond. MIT press, 2001.
- [48] B. Sliwa, “Raw experimental cellular network quality data,” Mar 2018. [Online]. Available: http://doi.org/10.5281/zenodo.1205778
- [49] R. Falkenberg, “Machine learning based transmission power prediction: Capturing software, raw data, and exported models,” Mar 2018. [Online]. Available: https://doi.org/10.5281/zenodo.1208603
- [50] A. R. Jensen, M. Lauridsen, P. Mogensen, T. B. Sørensen, and P. Jensen, “LTE UE power consumption model: For system level energy and performance optimization,” in 2012 IEEE Vehicular Technology Conference (VTC Fall), Sept 2012, pp. 1–5.
- [51] B. Dusza, C. Ide, L. Cheng, and C. Wietfeld, “CoPoMo: A context-aware power consumption model for LTE user equipment,” Transactions on Emerging Telecommunications Technologies (ETT), Wiley, vol. 24, no. 6, pp. 615–632, Oct 2013.
- [52] R. Falkenberg, B. Sliwa, and C. Wietfeld, “Rushing full speed with LTE-advanced is economical - A power consumption analysis,” in IEEE Vehicular Technology Conference (VTC-Spring), Sydney, Australia, Jun 2017.
- [53] 3GPP TS 36.213 - Physical layer procedures (Release 13), 3rd Generation Partnership Project Technical Specification, Rev. V13.0.1, Jan 2016.
![[Uncaptioned image]](/html/1904.10186/assets/fig/photo/sliwa.png) |
Benjamin Sliwa (S’16) received the M.Sc. degree from TU Dortmund University, Dortmund, Germany, in 2016. He is currently a Research Assistant with the Communication Networks Institute, Faculty of Electrical Engineering and Information Technology, TU Dortmund University. He is working on the Project ”Analysis and Communication for Dynamic Traffic Prognosis” of the Collaborative Research Center SFB 876. His research interests include predictive and context-aware optimizations for decision processes in vehicular communication systems. Benjamin Sliwa has been recognized with a Best Student Paper Award at IEEE VTC Spring 2018 and the 2018 IEEE Transportation Electronics Student Fellowship ”For Outstanding Student Research Contributions to Machine Learning in Vehicular Communications and Intelligent Transportation Systems”. |
![[Uncaptioned image]](/html/1904.10186/assets/fig/photo/falkenberg.jpg) |
Robert Falkenberg (S’15) received his M.Sc. degree from TU Dortmund University, Dortmund, Germany in 2014. He joined the Communication Network Institute, Faculty of Electrical Engineering and Information Technology, TU Dortmund University, as a Research Assistant in December 2014. Prior to that he studied applied computer science at TU Dortmund University. His research interests cover resource-efficient wireless communications in cellular 4G/5G and IoT networks for deeply embedded an industrial systems. He contributes to the project “Resource efficient and distributed platforms for integrative data analysis” A4 of the Collaborative Research Center SFB 876. |
![[Uncaptioned image]](/html/1904.10186/assets/fig/photo/liebig_2.png) |
Thomas Liebig is a post-doctoral researcher at the artificial intelligence group at TU Dortmund. He works in the European H2020 project VaVeL (Variety, Veracity, VaLue: Handling the Multiplicity of Urban Sensors http://www.vavel-project.eu) on probabilistic modeling of spatio-temporal data, on multi-modal trip calculations and on privacy for distributed location aware applications. He obtained his PhD from the university of Bonn in 2013, where he studied probabilistic pedestrian modeling from incomplete data. He has published papers in International Conferences and Scientific Journals related to his area of expertise (ECML/PKDD, IEEE Big Data, IEEE IE, AGILE, JAOR, JUT). He evaluated articles for numerous journals and conferences (ICLR, ICML, NIPS, VAST, IEEE ICDE, NEUCOM, KDD, IV, KAIS, NCAA) and serves in the program committee of international workshops on computational transportation sciences. |
![[Uncaptioned image]](/html/1904.10186/assets/fig/photo/piatkowski.jpg) |
Nico Piatkowski studied computer science and economics at TU Dortmund in Germany where he received his PhD (Dr. rer. nat.) with summa cum laude for his work on ”Exponential Families on Resource-Constrained Systems”. Since 2011, Nico is a research associate at the Artificial Intelligence Unit at TU Dortmund. Nico’s research is focused on machine learning, especially undirected graphical models, for resource-constrained systems. His results cover theoretical error bounds and performance guarantees for regularization, reparametrization, and numerical approximation in the context of probabilistic inference. |
![[Uncaptioned image]](/html/1904.10186/assets/fig/photo/wietfeld.jpg) |
Christian Wietfeld (M’05–SM’12) received the Dipl.-Ing. and Dr.-Ing. degrees from RWTH Aachen University, Aachen, Germany. He is currently a Full Professor of communication networks and the Head of the Communication Networks Institute, TU Dortmund University, Dortmund, Germany. For more than 20 years, he has been a coordinator of and a contributor to large-scale research projects on Internet-based mobile communication systems in academia (RWTH Aachen ‘92-’97, TU Dortmund since ‘05) and industry (Siemens AG ’97-’05). His current research interests include the design and performance evaluation of communication networks for cyber–physical systems in energy, transport, robotics, and emergency response. He is the author of over 200 peer-reviewed papers and holds several patents. Dr. Wietfeld is a Co-Founder of the IEEE Global Communications Conference Workshop on Wireless Networking for Unmanned Autonomous Vehicles and member of the Technical Editor Board of the IEEE Wireless Communication Magazine. In addition to several best paper awards, he received an Outstanding Contribution award of ITU-T for his work on the standardization of next-generation mobile network architectures. |