The diverse dark matter density at sub-kiloparsec scales in Milky Way satellites: implications for the nature of dark matter
Abstract
Milky Way (MW) satellites reside within dark matter (DM) subhalos with a broad distribution of circular velocity profiles. This diversity is enhanced with the inclusion of ultra-faint satellites, which seemingly have very high DM densities, albeit with large systematic uncertainties. We argue that if confirmed, this large diversity in the MW satellite population poses a serious test for the structure formation theory with possible implications for the DM nature. For the Cold Dark Matter model, the diversity might be a signature of the combined effects of subhalo tidal disruption by the MW disk and strong supernova feedback. For models with a dwarf-scale cutoff in the power spectrum, the diversity is a consequence of the lower abundance of dwarf-scale halos. This diversity is most challenging for Self-Interacting Dark Matter (SIDM) models with cross sections cm2g-1 where subhalos have too low densities to explain the ultra-faint galaxies. We propose a novel solution to explain the diversity of MW satellites based on the gravothermal collapse of SIDM haloes. This solution requires a velocity-dependent cross section that predicts a bimodal distribution of cuspy dense (collapsed) subhaloes consistent with the ultra-faint satellites, and cored lower density subhaloes consistent with the brighter satellites.
I Introduction
The cold and collisionless nature of dark matter (DM) is a central hypothesis of the standard CDM model of structure formation, which is largely consistent with the large scale structure of the Universe Springel et al. (2005), and is the cornerstone of current state-of-the-art simulations that model the complexity of galaxy formation and evolution Dubois et al. (2014); Vogelsberger et al. (2014); Schaye et al. (2015). However, the validation of these hypotheses remains elusive since the predictions that make CDM a distinct model occur at (sub)galactic scales, where gas/stellar (baryonic) physics and possible new DM physics are entangled. It is in fact at these scales that CDM has been challenged over recent decades by its apparent inconsistency with observations, particularly by seemingly overpredicting the abundance and inner DM content of dwarf galaxies Moore (1994); Klypin et al. (1999); Moore et al. (1999); Zavala et al. (2009); Walker and Peñarrubia (2011); Boylan-Kolchin et al. (2011); Klypin et al. (2014); Papastergis et al. (2015); Oman et al. (2015). Whether this indicates the need for new DM physics or the lack of an accurate account of baryonic physics remains controversial. Supernova feedback and gas heating during the reionization era suppress the formation of dwarf galaxies and reduce their inner DM densities (e.g. Pontzen and Governato (2012); Dutton et al. (2016); Sawala et al. (2016)), but there is no firm evidence of the high efficiency required from these processes to be viable solutions to all CDM challenges (see Bullock and Boylan-Kolchin (2017) for a review).
Among the range of allowed DM physics that can impact the physics of galaxies, there are two mechanisms that encompass a large set of possible DM particle models: (i) a dwarf-scale cutoff in the linear matter power spectrum, either caused by free streaming as in Warm Dark Matter (WDM) Colín et al. (2000); Bode et al. (2001), or by interactions between DM and relativistic particles in the early Universe Bœhm et al. (2002); Buckley et al. (2014); (ii) a reduction of the central density of halos if DM is self-interacting (SIDM, Spergel and Steinhardt (2000)). Although these two mechanisms naturally alleviate the CDM challenges (e.g. Lovell et al. (2012); Vogelsberger et al. (2012); Zavala et al. (2013); Vogelsberger et al. (2016); Schneider et al. (2017); Kamada et al. (2017)), verifying/falsifying them remains a challenge due to their interplay/degeneracies with baryonic physics (although see Burger and Zavala (2019)).
In this work we revisit the challenge of matching the abundance and kinematic properties of the Milky Way (MW) satellites by looking at the so-called too-big-to-fail (TBTF) problem, which states that the most massive subhaloes predicted by CDM -body simulations are too centrally dense to host the brightest MW satellites Boylan-Kolchin et al. (2011, 2012a). We take a different perspective of the TBTF challenge in light of recent observations of ultra-faint galaxies, which indicate a strikingly diverse distribution of the internal kinematics of this dispersion-supported satellite population Fattahi et al. (2018); Errani et al. (2018). Such diversity is akin to the diversity of rotation curves reported in higher mass, rotationally-supported dwarf galaxies Oman et al. (2015). Our goal is to show how this diversity in MW satellites poses a serious test for structure formation models and focus particularly on its implications for the DM nature.
The paper is organized as follows. In Section II we describe the DM models we study and their corresponding cosmological simulations. In Section III we present our results on the distribution of circular velocity profiles in the simulated subhalo population and its comparison with observations from the MW satellites. In Section IV we discuss a number of factors that impact our results as well as discuss the crucial role that the gravothermal collapse of SIDM halos could have for the SIDM model. Finally, our Conclusions are given in Section V.
II DM models and Simulations
| Name | Cosmology | Reference | Aquarius IC | |||||
|---|---|---|---|---|---|---|---|---|
| [cm2g-1] | [keV] | Springel et al. (2008) | ||||||
| CDM | WMAP-7 | 1.94 | 1.55 | 68.1 | Lovell et al. (2014) | Aq-A-2 | ||
| SIDM | WMAP-1 | 1.80 | 4.9 | 120.5 | Zavala et al. (2013) | Aq-A-3 | ||
| WDM | WMAP-7 | 1.87 | 1.55 | 68.1 | Lovell et al. (2014) | Aq-A-2 | ||
| ETHOS | Planck2015 | 0.3 (v km/s) | 3.4 | 1.64 | 2.76 | 72.4 | Vogelsberger et al. (2016) | |
| vdSIDM | WMAP-1 | 125 (v km/s) | 1.84 | 4.9 | 120.5 | this work | Aq-A-3 |
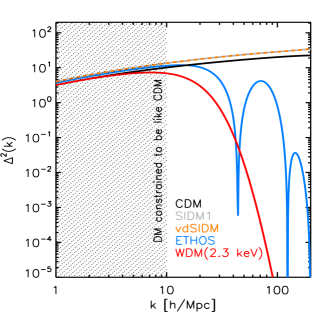
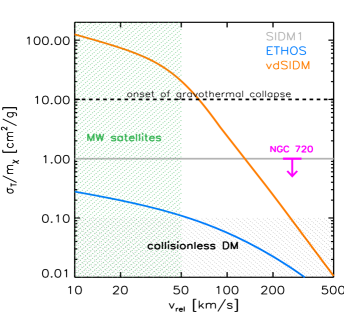
We analyse a sample of DM-only cosmological simulations of MW-size halos, four of which have been used in the past to study subhalo abundance and their inner structure (see Table 1). Fig. 1 shows the linear power spectra (left) and self-interaction cross sections (right) for the different DM models used in these simulations. The motivation for using this particular set of simulations is to have a sample with sufficient and roughly similar resolution of (100 pc) to probe the inner region of MW satellites in different DM models: CDM Lovell et al. (2014), WDM ( keV; Lovell et al. (2014)), SIDM ( cm2g-1; Zavala et al. (2013)), and a model within the ETHOS framework of structure formation Cyr-Racine et al. (2016). The latter is a benchmark case fine-tuned in Vogelsberger et al. (2016) to alleviate the TBTF and abundance problems. It contains both self-interactions ( cm2g-1 at the characteristic velocities of MW satellites) and a primordial cutoff in the power spectrum (nearly equivalent to a keV WDM model; Lovell et al. (2018a)) due to DMdark radiation interactions in the early Universe.
We notice that the 2.3 keV thermal WDM model we use is disfavored at C.L. from observations of the Lyman forest flux power spectra Viel et al. (2013); Iršič et al. (2017). Although it has been pointed out that uncertain factors in the high redshift Universe, most notably the thermal history of the intergalactic medium, could greatly relax the constraint on the WDM particle mass (e.g Garzilli et al. (2017)), very recent inferences on this thermal history Walther et al. (2018) reduce this possibility and seemingly validate the constraints in Viel et al. (2013); Iršič et al. (2017). In the ETHOS model we consider however, the power spectrum cutoff occurs at smaller scales (roughly analogue to a 3.4 keV thermal WDM model; Lovell et al. (2018a)), and thus it is in considerable less tension with Ly- forest data (see Bose et al. (2018)).
On the other hand, most limits on the self-interacting transfer cross section are in place for systems with characteristic velocities larger than those in the MW satellites and are of the order of cm2g-1 (for a review of the constraints see Table 1 of Tulin and Yu (2018)). A recent study reports a constraint of cm2g-1 ( C.L.) at precisely the velocity scales of MW satellites through measurements of the inner DM density in the Draco satellite (Read et al. (2018); see also Valli and Yu (2018)). Although this is potentially a relevant constraint on SIDM, Draco has a stellar mass of M⊙ and it cannot be ruled out that baryonic physics could impact the inner profile of low-mass SIDM halos. In fact, for galaxies with M⊙ in stellar mass, it has been shown that the profiles of SIDM halos are cuspier than their DM-only counterparts (see Fig. 5 of Robles et al. (2017)).
To this simulation suite we add a new one (vdSIDM) with the same initial conditions as the SIDM simulation but with a strong velocity dependent cross section (orange line in the right panel of Fig. 1). In the particular model we use, DM self-scattering is mediated by a massive force carrier () through an attractive Yukawa potential with coupling strength . In this case, the transfer cross section in the classical regime can be approximated by a fitting function used in plasma physics (see e.g. Feng et al. (2010); Loeb and Weiner (2011); Vogelsberger et al. (2012)):
| (1) |
where and , and is the relative velocity of the DM particles. Here is the velocity at which peaks at a transfer cross section equal to . We choose the particle physics parameters so that km/s and cm2g-1. With this choice of parameters, self-interactions are frequent enough in the center of dwarf-scale SIDM (sub)halos to trigger the gravothermal catastrophe phase, which is a well-known mechanism in globular clusters Lynden-Bell and Wood (1968), and that in the SIDM case results in the collapse of the core into a central cusp Balberg et al. (2002); Colín et al. (2002); Koda and Shapiro (2011); Pollack et al. (2015); Nishikawa et al. (2019).
III Results
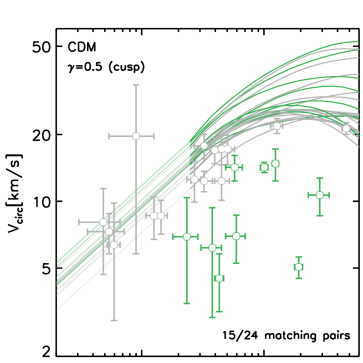
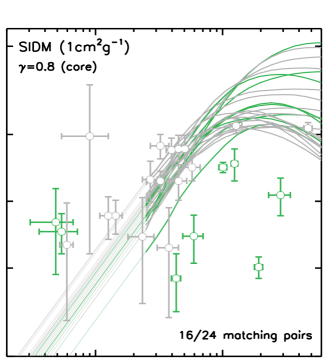
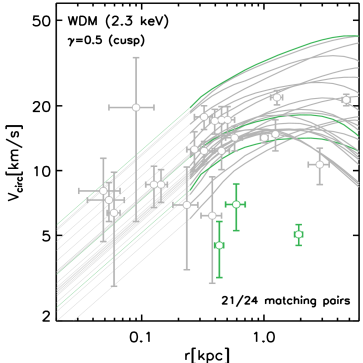
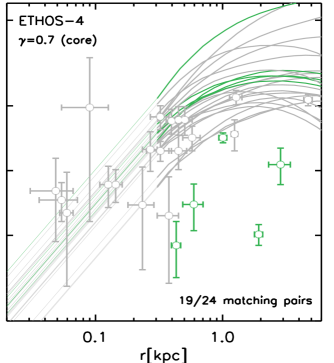
In Fig. 2 we compare the distribution of the circular velocity profiles, , of the massive subhalo population in the different DM models with the observed distribution of circular velocities at the half light radius for the MW satellite population. We have taken the observed values of and from Errani et al. (2018), where a new mass estimator to infer the dark matter content in pressure-supported systems was employed that the authors claim provides unbiased mass estimates with a accuracy. Using this estimator we have:
| (2) |
where and are the observed projected half-light radius and luminosity-averaged squared line-of-sight velocity dispersion of the stars (given in Table 2 of Errani et al. (2018)). We also include the newly discovered Antlia 2 satellite (Torrealba et al., 2018) with values computed with the same estimator as in Errani et al. (2018).
We only consider satellites (subhalos) within 300 kpc from the center of the observed (simulated) MW system. This leaves us with 24 confirmed MW satellites (after excluding Leo T), which we compare against the 24 subhalos in each simulation with the largest maximum circular velocity , excluding the two subhalos with the highest ranking, which are deemed to be Magellanic Cloud analogs. The simulation data in Fig. 2 extend down to a radius where convergence is reasonable (solid lines): for the CDM, WDM and ETHOS models, and for the SIDM case. The latter is smaller than in the other cases because SIDM halos are much better converged in the central regions due to the thermalization of the core (e.g. Vogelsberger et al., 2012; Elbert et al., 2015).
The gravitational softening lengths of the simulations are of (100 pc), which is around the scale of the half-light radii of the ultra-faint galaxies. In order to extrapolate the simulation results to this unresolved regime we proceed as follows. For the CDM and WDM cases, we note that the simulations are sufficiently resolved down to pc to approach the expected asymptotic value of the NFW profile: Lovell et al. (2014). In fact, we have verified that power law fits to the last 4 resolved radial bins in the CDM and WDM cases result in a median slope that is very close to . Because of this, we extrapolate the profiles for these simulations (left panels of Fig. 2) with power laws of fixed NFW slope and a normalization given by the last resolved radial bin. For the SIDM and ETHOS simulations (right panels of Fig. 2) we proceed in a similar way, fixing the slopes of the power laws to the median slope of the last 4 resolved radial bins of the profiles. In this case, we find that at pc the profiles have not yet reached the asymptotic value for a profile with a flat central core: . Instead, the SIDM case has while the ETHOS case has . The reason for this is that the thermalization of the core is neither perfect nor complete, particularly for the ETHOS case where the cross section for the typical velocities of the considered subhalo population at these scales ( km/s) is cm2g-1 (see right panel of Fig. 1), resulting in an isothermal region that is much smaller than the maximum it can attain. Finally, for the vdSIDM simulation (Fig. 3 in Section IV.2), we separate the subhalo population into two distinct subpopulations according to the behavior of their circular velocity profiles in the last resolved radial range: . If , then subhalos are cored-like, otherwise they are cusp-like. We then proceed as in previous cases and assign to each subclass an asymptotic behavior given by the median value of computed for each subclass. Notice that although the specific value of used to divide the population is somewhat arbitrary, it serves the purpose of characterizing the bimodal distribution of profiles that is apparent in the vdSIDM case.
Although the spread and normalization of the distributions give an idea of how discrepant/similar the simulations are to the data, we can proceed further and establish a consistency between the simulations and the data by defining matching pairs, a circular velocity profile and a (,) observational point, and finding the largest set of subhalos that is consistent with the largest number of data points in the following way. In order to be conservative in our assessment of the consistency between the simulations and the data, our goal is to find the maximum number of possible matching simulated subhaloobserved satellite pairs. To accomplish this we use the following procedure. For each data point, we find all subhalos with a circular velocity profile that lie within a square defined by the error bars of that data point. Once this list of possible matches is built, we then randomly choose matching pairs by first selecting at random a data point and then at random a matching subhalo. Both of these random choices are sampled from uniform distributions (without replacement) and the process is repeated 1000 times, which is sufficient to ensure that the maximum possible number of matches is achieved. A random realisation that achieves the maximum number of matches is chosen as the example shown in Figs. 2 and 3 for each DM model.
The matching pairs (mismatches) are shown in Fig. 2 in gray (green). The upper panels of Fig. 2 show the cases that are more discrepant with the data: CDM (left) and SIDM (right). CDM has the well-known TBTF problem, having too many dense subhalos to explain the satellite distribution. On the other hand, SIDM with 1 cm2g-1 predicts subhalos with too low densities to match the ultra-faint galaxies. In both the CDM and the SIDM models, the spread of the profile distribution is a problem: the subhalo population is too narrow to account for the large spread in the data. This problem is alleviated without appealing to baryonic physics if the subhalo abundance is suppressed due to a primordial power spectrum cutoff, regardless of whether subhalos are cored or cuspy. This is shown in the bottom panels of Fig. 2, where both the WDM and ETHOS models show a more reasonable match to observations.
IV Discussion
In the following we discuss a number of limitations/circumstances of the simulations we use, which impact the results shown in Fig. 2: choice of cosmological parameters, MW halo mass and halo-to-halo environmental scatter, choice of subhalo ranking, as well as the most relevant (baryonic) physical processes not present in our simulations: adiabatic contraction, supernova feedback and tidal disruption by the MW disk.
-
a)
Cosmological parameters. The different parameters used in the simulations have an impact on the inner densities of (sub)halos. In particular, a larger value of , the rms amplitude of linear mass fluctuations in 8 Mpc/h spheres at redshift zero, results in satellites forming earlier and therefore being denser, which makes the too-big-to-fail problem more severe Polisensky and Ricotti (2014). Qualitatively, this is only relevant for the SIDM and vdSIDM simulations, which have an overly high value of . Because of this, we would expect SIDM to be even more discrepant with the ultra-faint galaxies if the simulation were repeated with a lower more consistent value.
-
b)
MW halo mass and halo-to-halo scatter. All of the simulations in our sample have a MW halo at the extreme high mass end of current estimates Wang et al. (2015); Patel et al. (2018). On the other hand, since we are looking at a single realization of a MW-size halo, we are not considering the possible variations in the subhalo populations at a fixed halo mass. We remark however, that except for the ETHOS case, the particular halo we are considering is part of the haloes belonging to the Aquarius simulation suite (Aq-A; (Springel et al., 2008)), which have been found to be fairly representative of the MW-like halo population in the CDM cosmology (Boylan-Kolchin et al., 2010), particularly with a subhalo abundance that is similar or larger than the cosmological median (Cautun et al., 2014). Taking this into consideration and acknowledging that a less massive halo would result in an overall less dense subhalo population, we expect Fig. 2 to be shifted downwards for all models. The consequences would be more striking for the SIDM case, as it would amplify its discrepancy with the data. For our conclusions to change significantly, the actual MW halo would likely need to deviate significantly from the median expectations with a larger abundance of dense subhalos than expected.
-
c)
Subhalo ranking. For simplicity, we have chosen to rank subhalos, but given the environmental effects (e.g. tidal and ram pressure stripping) that affect a subhalo once it is accreted into a larger host, , with being the infall time into the MW, would be a more appropriate choice theoretically due to its stronger correlation with satellite luminosity (see e.g. Fig. 6 of Guo et al. (2015)). Unfortunately, we do not have the subhalo assembly histories for all the simulations to compute , but we note that the expectation in this case is that a few of the subhalos towards the lower end of the distribution of profiles would be replaced by subhalos that have suffered from more severe tidal stripping and that, at , have profiles that are lower than those shown in Fig. 2. The distribution towards the massive (higher) end would remain essentially unchanged since, in general, subhalos that are massive at were also massive in the past (e.g. see Fig. 2 of Boylan-Kolchin et al. (2012b)). We have explicitly verified this expectation for those simulations where we have the values of (CDM and WDM). Thus, the net result is that ranking subhalos at infall would result in a slightly more diverse distribution in Fig. 2, resulting in an overall better match to observations for all models. It would not however, alleviate the discrepancy of the SIDM model with the ultra-faint galaxies.
-
d)
Adiabatic contraction within subhalos. The assembly of the galaxy leads to an adiabatic contraction of the DM halo, which makes its density profile steeper towards the center Barnes and White (1984); Blumenthal et al. (1986). The relevance of this effect depends on the total mass of the galaxy and its concentration relative to those of the host halo. This mechanism could enhance the diversity of profiles only if the subhalo hosts of the ultra-faint galaxies were to become denser as a result. However, looking at Fig. 2 these galaxies are most likely hosted by the most massive MW subhalos, which are too massive ( M⊙ at ) to be affected by adiabatic contraction since the ultra-faint galaxies have stellar masses M⊙. The effect could be more relevant for the cored SIDM subhalos, and thus we explicitly simulated this effect with a higher resolution, controlled simulation of an isolated SIDM halo. This halo has similar properties to the most massive SIDM subhalos, with a “galaxy” that is dynamically modeled with an external Plummer potential, and has a total stellar mass and half light radius characteristic of the ultra-faint galaxies. We found no significant impact on down to the resolved scales pc.
-
e)
Supernova feedback and tidal disruption by the MW disk. The (gravitational) transfer of energy to the DM particle orbits by supernovae lowers the density of DM halos with a strength that strongly depends on the stellar-to-halo mass ratio (e.g. Di Cintio et al. (2014)), being largely inefficient for systems such as the ultra-faint galaxies (if they indeed live within massive subhalos). On the other hand, the presence of a MW disk can lower the densities of MW subhalos and even destroy them if the pericenter of their orbits gets too close to the disk (e.g. Zolotov et al. (2012)). A recent cosmological hydrodynamical simulation of the MW halo and its local environment shows that these mechanisms (with tidal disruption likely being the most relevant one) naturally create a more diverse subhalo population (relative to the CDM predictions without baryonic physics), and alleviate the too-big-to-fail problem Garrison-Kimmel et al. (2018) (see also Sawala et al. (2016); Garrison-Kimmel et al. (2017); Fattahi et al. (2018)).
We argue that all of these considerations are unlikely to modify the discrepancy of the 1 cm2g-1 SIDM model with the ultra-faint galaxies. Baryonic physics (particularly tidal disruption by the MW disk) would however, naturally enhance the diversity of profiles in the MW satellites Lovell et al. (2017). In the case of CDM this results in a galaxy population that is seemingly a good match to the distribution of the classical dwarf satellites in the MW (see Fig. 5 of Garrison-Kimmel et al. (2018)); the ultra-faint galaxies remain unresolved in full cosmological hydrodynamical simulations, so it remains unclear how well they are described in CDM. For non-CDM models, it remains to be studied in detail how tidal disruption by the MW disk combines with (i) a cutoff in the power spectrum at the scale of MW satellites (such as in the WDM and ETHOS models) and/or (ii) SIDM-induced (kpc) cores within MW satellites, to enhance the diversity in DM densities within sub-kiloparsec scales. If this combination overfixes the problem, it could put stringent constraints on non-CDM models.
In regards to point ii) in the paragraph above, Robles et al. (2019) recently performed MW-size CDM and SIDM ( cm2g-1) simulations, which model the tidal effect of the MW disk by adding an embedded time-dependent potential. This changes substantially the DM distribution of the host MW halo relative to the DM-only simulation without the effect of the disk (making it much more centrally dense than even the CDM counterpart). However, the sub-kpc distribution of DM densities of the most massive subhaloes is altered only in a minimal way, relative to the DM-only simulation (see Fig. 3 of Robles et al. (2019)). Overall the SIDM subhaloes are slightly more dense than in the case without the effects of the disk, but still clearly less dense than in the CDM case. Based on this result, our expectation for the SIDM case with cm2g-1 remains in regards to its discrepancy with the ultra-faint galaxies. It would nevertheless be interesting to analyze why the MW tidal effects would enhance the SIDM densities for that particular simulation, although this is perhaps due to gravothermal collapse, which is accelerated when tidal stripping occurs, as was proposed recently by Nishikawa et al. (2019) (see also Kahlhoefer et al. (2019); Sameie et al. (2019)).
IV.1 Systematic uncertainties in ultra-faint galaxies
We stress that it is the large central densities of the ultra-faint galaxies that make the diversity of the satellite population particularly challenging. If the uncertainties on the mass estimator used in Errani et al. (2018) for these galaxies have been underestimated, this would relax the discrepancy noted here for the cm2g-1 SIDM model. The four ultra-faints we show in Figs. 2 and 3 could have relevant systematic uncertainties: (i) the stellar kinematics data from Segue I is based on stars Simon et al. (2011), but not all of them are unambiguously identified as belonging to the satellite, which could affect the measurement of (see Fig. 5 of Bonnivard et al. (2016)); (ii) the data for Willman 1 is based on stars Martin et al. (2007) and a more detailed study with a larger sample Willman et al. (2011) suggested that Willman 1 might not be in dynamical equilibrium, and also found possible interlopers in the sample in Martin et al. (2007), which might have biased high the value of ; (iii) the cases of Segue II and Boötes II are even more uncertain with kinematics based only on a handful of stars Belokurov et al. (2009); Koch et al. (2009); a study by Kirby et al. (2013) with members of Segue II was not able to measure the velocity dispersion, and instead set an upper limit of km/s (95 confidence), which remains consistent but at the lower end of the error bars reported in Belokurov et al. (2009), while a study by Ji et al. (2016) on Boötes II indicates that the velocity dispersion reported in Koch et al. (2009) might be biased high due to the inclusion of a star that is likely part of a binary system.
IV.2 Gravothermal collapse in SIDM halos
The addition of baryonic physics points towards a subhalo population that should diversify and move systematically towards lower values relative to the one shown in Fig. 2 for all DM models. This would exacerbate the tension of the 1 cm2g-1 SIDM model with the ultra-faint galaxies. It is however, possible for DM self-interactions to provide a novel explanation to the diversity we highlight here if the cross section is velocity dependent in such a way that it satisfies two conditions: (i) it is large enough to be above but near the threshold for gravothermal catastrophe at the typical internal velocities of MW satellites and (ii) it has a strong velocity dependence putting it well below this threshold at the orbital velocities of MW satellites within the MW. The former is required to have a fraction of SIDM subhalos collapse into cuspy density profiles, while the latter is required to avoid subhalo evaporation due to particles inside subhalos scattering with particles in the host halo, and it also minimizes the impact of self-interaction in the MW halo and beyond where constraints on the cross section are tight (e.g. Vogelsberger et al. (2012)).
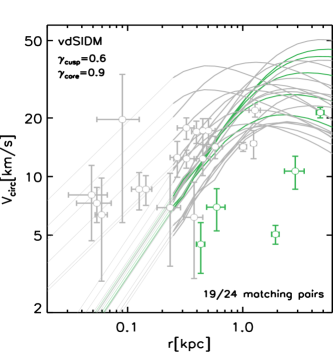
The vdSIDM model we have explored (see Fig. 1) satisfies these requirements and is shown in Fig. 3. We note that in this case we use the subhalo ranking according to the values in the SIDM simulation, which has the same initial conditions. We do this because for those subhalos that have collapsed, the value of changes substantially in the later epochs after accretion, and likely would not reflect the satellites’ luminosity. The effect of the gravothermal collapse in this model is clear: it distinctly diversifies the subhalo population by producing a bimodal distribution, with low-mass subhalos being cuspy and offering a better match to the dense ultra-faint galaxies, while more massive subhalos remain cored and are better matched to the lower density satellites with large half-light radii.
We can use the number of matching pairs as a way of ranking the five different (DM-only) models we have analysed in this work: 1) WDM (2.3 keV) with , 2) vdSIDM and ETHOS-4 both with , 3) SIDM ( cm2g-1) with and 4) CDM with . Another way of quantifying the difference between the models is the following. We compute the minimum chi-square of each model with all the satellites, i.e., for a given combination of 24 pairs (regardless of the number of matches), each being a subhalo circular velocity profile and a (,) observational point, we compute the chi-square of the combination111 where is the observational error for a given data point., and explore a large number of combinations to find the minimum chi-square. To compare the models we compute the (reduced) chi-square difference () relative to the WDM case, which provides the best fit to the data, and find for each model: vdSIDM, , ETHOS-4, , SIDM ( cm2g-1), , and CDM, . This comparison gives a similar ranking than the simple ordering based on the number of matching pairs, although in this case, the vdSIDM case fares better than the ETHOS-4 case. We emphasize that these rankings are merely indicative of the particular set of simulations we used and not a rigorous statistical test of the DM models given the limitations and circumstances of the simulations we have discussed in this section.
V Conclusions
The abundance and internal kinematics of MW satellites have been a challenge for the theory of structure formation. The discovery of ultra-faint galaxies coupled with the refinement of methods to estimate the DM mass within the half light radii is seemingly indicating that the MW satellites inhabit a subhalo population that has a strikingly diverse distribution of circular velocity profiles. In this work, we use DM-only simulations to highlight the potential implications of such diversity for the DM nature in models that deviate from the standard CDM model. Broadly we study classes of models having either a primordial power spectrum cutoff at galactic-scales (WDM) or strong DM self-interactions (SIDM) or a combination of both (as in the ETHOS framework Cyr-Racine et al. (2016); Vogelsberger et al. (2016)). Our main conclusions are the following:
-
(i)
a primordial cutoff in the power spectrum suppresses the abundance of massive subhalos relative to CDM and naturally creates a more diverse subhalo population. A 2.3 keV WDM thermal relic model is quite consistent with the distribution of MW satellites but it is in tension with Ly- forest constraints Iršič et al. (2017).
-
(ii)
DM self-interactions with cm2g-1 are effective at reducing the DM density of MW subhalos at sub-kiloparsec scales but preserve the lack of diversity seen in CDM (without baryonic physics). Contrary to CDM, the predicted densities within pc in SIDM are too low to be consistent with the ultra-faint galaxies. Although these galaxies have serious systematic uncertainties (see Section IV.1), if their currently inferred high densities are verified, this poses a serious challenge for SIDM models with cm2g-1 at the velocity scales of MW satellites.
-
(iii)
we identify a novel way to explain the diversity of MW satellites and match the high densities of the ultra-faint galaxies within the SIDM model. It is based on the gravothermal collapse of SIDM halos and requires a velocity dependence in the SIDM cross section having a value above the collapse threshold at km/s (the velocity scale of massive MW satellites) and quickly dropping at higher velocities to avoid having an impact in the MW halo and larger systems where constraints on the cross section are tight. These conditions create a bimodal distribution of cored lower density subhalos more consistent with brighter satellites, and of cuspy dense subhalos consistent with the ultra-faint galaxies.
-
(iv)
an allowed benchmark DM model within the ETHOS framework that has both a primordial power spectrum cutoff and DM self-interactions, and that has been shown to be a promising alternative to CDM Vogelsberger et al. (2016); Lovell et al. (2018b), is consistent with the ultra-faint galaxies and shows considerably more diversity than the CDM model (without baryonic physics).
We argue that including baryonic physics in the simulations would tend to increase the diversity of the subhalo population and likely lower the sub-kiloparsec DM densities (albeit see discussion at the end of section IV for the SIDM case). Although quantifying this impact is a necessary task to constrain non-CDM models, we remark that based on this expectation, the challenge of SIDM in matching the kinematics of the ultra-faint galaxies would remain without a mechanism like the gravothermal collapse. In dwarfs more massive than the MW satellites ( km/s), how cuspy or cored SIDM halos are depends on the concentration of the baryonic component Elbert et al. (2018). Indeed, the interplay between self-interactions and baryonic physics in this case has been invoked to address the observed large diversity of rotation curves for a constant cross section SIDM model with cm2g-1 Kamada et al. (2017); Ren et al. (2018). This interplay works because within the characteristic scale of these galaxies ( kpc), the DM content is comparable to the baryonic content. However, at the scale of the ultra-faint galaxies ( kpc), the massive SIDM subhalos of the MW have enclosed masses M⊙, which is times more mass than the stellar mass of an ultra-faint galaxy. Hence the impact of baryonic physics in these systems should be much reduced, and it is difficult to imagine how a population of dense ultra-faint galaxies can be accommodated within SIDM with cm2g-1.
Acknowledgements.
JZ, MRL and JDB acknowledge support by a Grant of Excellence from the Icelandic Research fund (grant number 173929051). MRL is supported by a COFUND/Durham Junior Research Fellowship under EU grant 609412. The new simulation used for this work was performed on the joint MIT-Harvard computing cluster supported by MKI and FAS.References
- Springel et al. (2005) V. Springel, S. D. M. White, A. Jenkins, C. S. Frenk, N. Yoshida, L. Gao, J. Navarro, R. Thacker, D. Croton, J. Helly, et al., Nature 435, 629 (2005), eprint astro-ph/0504097.
- Dubois et al. (2014) Y. Dubois, C. Pichon, C. Welker, D. Le Borgne, J. Devriendt, C. Laigle, S. Codis, D. Pogosyan, S. Arnouts, K. Benabed, et al., MNRAS 444, 1453 (2014), eprint 1402.1165.
- Vogelsberger et al. (2014) M. Vogelsberger, S. Genel, V. Springel, P. Torrey, D. Sijacki, D. Xu, G. Snyder, D. Nelson, and L. Hernquist, MNRAS 444, 1518 (2014), eprint 1405.2921.
- Schaye et al. (2015) J. Schaye, R. A. Crain, R. G. Bower, M. Furlong, M. Schaller, T. Theuns, C. Dalla Vecchia, C. S. Frenk, I. G. McCarthy, J. C. Helly, et al., MNRAS 446, 521 (2015), eprint 1407.7040.
- Moore (1994) B. Moore, Nature 370, 629 (1994).
- Klypin et al. (1999) A. Klypin, A. V. Kravtsov, O. Valenzuela, and F. Prada, ApJ 522, 82 (1999), eprint astro-ph/9901240.
- Moore et al. (1999) B. Moore, S. Ghigna, F. Governato, G. Lake, T. Quinn, J. Stadel, and P. Tozzi, ApJ 524, L19 (1999), eprint astro-ph/9907411.
- Zavala et al. (2009) J. Zavala, Y. P. Jing, A. Faltenbacher, G. Yepes, Y. Hoffman, S. Gottlöber, and B. Catinella, ApJ 700, 1779 (2009), eprint 0906.0585.
- Walker and Peñarrubia (2011) M. G. Walker and J. Peñarrubia, ApJ 742, 20 (2011), eprint 1108.2404.
- Boylan-Kolchin et al. (2011) M. Boylan-Kolchin, J. S. Bullock, and M. Kaplinghat, MNRAS 415, L40 (2011), eprint 1103.0007.
- Klypin et al. (2014) A. Klypin, I. Karachentsev, D. Makarov, and O. Nasonova, ArXiv e-prints (2014), eprint 1405.4523.
- Papastergis et al. (2015) E. Papastergis, R. Giovanelli, M. P. Haynes, and F. Shankar, A&A 574, A113 (2015), eprint 1407.4665.
- Oman et al. (2015) K. A. Oman, J. F. Navarro, A. Fattahi, C. S. Frenk, T. Sawala, S. D. M. White, R. Bower, R. A. Crain, M. Furlong, M. Schaller, et al., MNRAS 452, 3650 (2015), eprint 1504.01437.
- Pontzen and Governato (2012) A. Pontzen and F. Governato, MNRAS 421, 3464 (2012), eprint 1106.0499.
- Dutton et al. (2016) A. A. Dutton, A. V. Macciò, J. Frings, L. Wang, G. S. Stinson, C. Penzo, and X. Kang, MNRAS 457, L74 (2016), eprint 1512.00453.
- Sawala et al. (2016) T. Sawala, C. S. Frenk, A. Fattahi, J. F. Navarro, R. G. Bower, R. A. Crain, C. Dalla Vecchia, M. Furlong, J. C. Helly, A. Jenkins, et al., MNRAS 457, 1931 (2016), eprint 1511.01098.
- Bullock and Boylan-Kolchin (2017) J. S. Bullock and M. Boylan-Kolchin, ARA&A 55, 343 (2017), eprint 1707.04256.
- Colín et al. (2000) P. Colín, V. Avila-Reese, and O. Valenzuela, ApJ 542, 622 (2000), eprint astro-ph/0004115.
- Bode et al. (2001) P. Bode, J. P. Ostriker, and N. Turok, ApJ 556, 93 (2001), eprint astro-ph/0010389.
- Bœhm et al. (2002) C. Bœhm, A. Riazuelo, S. H. Hansen, and R. Schaeffer, Phys. Rev. D 66, 083505 (2002), eprint astro-ph/0112522.
- Buckley et al. (2014) M. R. Buckley, J. Zavala, F.-Y. Cyr-Racine, K. Sigurdson, and M. Vogelsberger, Phys. Rev. D 90, 043524 (2014), eprint 1405.2075.
- Spergel and Steinhardt (2000) D. N. Spergel and P. J. Steinhardt, Physical Review Letters 84, 3760 (2000), eprint astro-ph/9909386.
- Lovell et al. (2012) M. R. Lovell, V. Eke, C. S. Frenk, L. Gao, A. Jenkins, T. Theuns, J. Wang, S. D. M. White, A. Boyarsky, and O. Ruchayskiy, MNRAS 420, 2318 (2012), eprint 1104.2929.
- Vogelsberger et al. (2012) M. Vogelsberger, J. Zavala, and A. Loeb, MNRAS 423, 3740 (2012), eprint 1201.5892.
- Zavala et al. (2013) J. Zavala, M. Vogelsberger, and M. G. Walker, MNRAS 431, L20 (2013), eprint 1211.6426.
- Vogelsberger et al. (2016) M. Vogelsberger, J. Zavala, F.-Y. Cyr-Racine, C. Pfrommer, T. Bringmann, and K. Sigurdson, MNRAS 460, 1399 (2016), eprint 1512.05349.
- Schneider et al. (2017) A. Schneider, S. Trujillo-Gomez, E. Papastergis, D. S. Reed, and G. Lake, MNRAS 470, 1542 (2017), eprint 1611.09362.
- Kamada et al. (2017) A. Kamada, M. Kaplinghat, A. B. Pace, and H.-B. Yu, Physical Review Letters 119, 111102 (2017), eprint 1611.02716.
- Burger and Zavala (2019) J. D. Burger and J. Zavala, MNRAS 485, 1008 (2019), eprint 1810.10024.
- Boylan-Kolchin et al. (2012a) M. Boylan-Kolchin, J. S. Bullock, and M. Kaplinghat, MNRAS 422, 1203 (2012a), eprint 1111.2048.
- Fattahi et al. (2018) A. Fattahi, J. F. Navarro, C. S. Frenk, K. A. Oman, T. Sawala, and M. Schaller, MNRAS 476, 3816 (2018), eprint 1707.03898.
- Errani et al. (2018) R. Errani, J. Peñarrubia, and M. G. Walker, ArXiv e-prints (2018), eprint 1805.00484.
- Springel et al. (2008) V. Springel, J. Wang, M. Vogelsberger, A. Ludlow, A. Jenkins, A. Helmi, J. F. Navarro, C. S. Frenk, and S. D. M. White, MNRAS 391, 1685 (2008), eprint 0809.0898.
- Lovell et al. (2014) M. R. Lovell, C. S. Frenk, V. R. Eke, A. Jenkins, L. Gao, and T. Theuns, MNRAS 439, 300 (2014), eprint 1308.1399.
- Spergel et al. (2003) D. N. Spergel, L. Verde, H. V. Peiris, E. Komatsu, M. R. Nolta, C. L. Bennett, M. Halpern, G. Hinshaw, N. Jarosik, A. Kogut, et al., ApJS 148, 175 (2003), eprint astro-ph/0302209.
- Komatsu et al. (2011) E. Komatsu, K. M. Smith, J. Dunkley, C. L. Bennett, B. Gold, G. Hinshaw, N. Jarosik, D. Larson, M. R. Nolta, L. Page, et al., ApJS 192, 18 (2011), eprint 1001.4538.
- Planck Collaboration et al. (2016) Planck Collaboration, P. A. R. Ade, N. Aghanim, M. Arnaud, M. Ashdown, J. Aumont, C. Baccigalupi, A. J. Banday, R. B. Barreiro, J. G. Bartlett, et al., A&A 594, A13 (2016), eprint 1502.01589.
- Lovell et al. (2018a) M. R. Lovell, J. Zavala, and M. Vogelsberger, arXiv e-prints (2018a), eprint 1812.04627.
- Viel et al. (2013) M. Viel, G. D. Becker, J. S. Bolton, and M. G. Haehnelt, Phys. Rev. D 88, 043502 (2013), eprint 1306.2314.
- Peter et al. (2013) A. H. G. Peter, M. Rocha, J. S. Bullock, and M. Kaplinghat, MNRAS 430, 105 (2013), eprint 1208.3026.
- Cyr-Racine et al. (2016) F.-Y. Cyr-Racine, K. Sigurdson, J. Zavala, T. Bringmann, M. Vogelsberger, and C. Pfrommer, Phys. Rev. D 93, 123527 (2016), eprint 1512.05344.
- Iršič et al. (2017) V. Iršič, M. Viel, M. G. Haehnelt, J. S. Bolton, S. Cristiani, G. D. Becker, V. D’Odorico, G. Cupani, T.-S. Kim, T. A. M. Berg, et al., Phys. Rev. D 96, 023522 (2017), eprint 1702.01764.
- Garzilli et al. (2017) A. Garzilli, A. Boyarsky, and O. Ruchayskiy, Physics Letters B 773, 258 (2017), eprint 1510.07006.
- Walther et al. (2018) M. Walther, J. Oñorbe, J. F. Hennawi, and Z. Lukić, ArXiv e-prints (2018), eprint 1808.04367.
- Bose et al. (2018) S. Bose, M. Vogelsberger, J. Zavala, C. Pfrommer, F.-Y. Cyr-Racine, S. Bohr, and T. Bringmann, arXiv e-prints (2018), eprint 1811.10630.
- Tulin and Yu (2018) S. Tulin and H.-B. Yu, Phys. Rep. 730, 1 (2018), eprint 1705.02358.
- Read et al. (2018) J. I. Read, M. G. Walker, and P. Steger, ArXiv e-prints (2018), eprint 1805.06934.
- Valli and Yu (2018) M. Valli and H.-B. Yu, Nature Astronomy 2, 907 (2018), eprint 1711.03502.
- Robles et al. (2017) V. H. Robles, J. S. Bullock, O. D. Elbert, A. Fitts, A. González-Samaniego, M. Boylan-Kolchin, P. F. Hopkins, C.-A. Faucher-Giguère, D. Kereš, and C. C. Hayward, MNRAS 472, 2945 (2017), eprint 1706.07514.
- Feng et al. (2010) J. L. Feng, M. Kaplinghat, and H.-B. Yu, Physical Review Letters 104, 151301 (2010), eprint 0911.0422.
- Loeb and Weiner (2011) A. Loeb and N. Weiner, Physical Review Letters 106, 171302 (2011), eprint 1011.6374.
- Lynden-Bell and Wood (1968) D. Lynden-Bell and R. Wood, MNRAS 138, 495 (1968).
- Balberg et al. (2002) S. Balberg, S. L. Shapiro, and S. Inagaki, ApJ 568, 475 (2002), eprint astro-ph/0110561.
- Colín et al. (2002) P. Colín, V. Avila-Reese, O. Valenzuela, and C. Firmani, ApJ 581, 777 (2002), eprint astro-ph/0205322.
- Koda and Shapiro (2011) J. Koda and P. R. Shapiro, MNRAS 415, 1125 (2011), eprint 1101.3097.
- Pollack et al. (2015) J. Pollack, D. N. Spergel, and P. J. Steinhardt, ApJ 804, 131 (2015), eprint 1501.00017.
- Nishikawa et al. (2019) H. Nishikawa, K. K. Boddy, and M. Kaplinghat, arXiv e-prints (2019), eprint 1901.00499.
- Torrealba et al. (2018) G. Torrealba, V. Belokurov, S. E. Koposov, T. S. Li, M. G. Walker, J. L. Sanders, A. Geringer-Sameth, D. B. Zucker, K. Kuehn, N. W. Evans, et al., arXiv e-prints (2018), eprint 1811.04082.
- Elbert et al. (2015) O. D. Elbert, J. S. Bullock, S. Garrison-Kimmel, M. Rocha, J. Oñorbe, and A. H. G. Peter, MNRAS 453, 29 (2015), eprint 1412.1477.
- Polisensky and Ricotti (2014) E. Polisensky and M. Ricotti, MNRAS 437, 2922 (2014), eprint 1310.0430.
- Wang et al. (2015) W. Wang, J. Han, A. P. Cooper, S. Cole, C. Frenk, and B. Lowing, MNRAS 453, 377 (2015), eprint 1502.03477.
- Patel et al. (2018) E. Patel, G. Besla, K. Mandel, and S. T. Sohn, ApJ 857, 78 (2018), eprint 1803.01878.
- Boylan-Kolchin et al. (2010) M. Boylan-Kolchin, V. Springel, S. D. M. White, and A. Jenkins, MNRAS 406, 896 (2010), eprint 0911.4484.
- Cautun et al. (2014) M. Cautun, W. A. Hellwing, R. van de Weygaert, C. S. Frenk, B. J. T. Jones, and T. Sawala, MNRAS 445, 1820 (2014), eprint 1405.7700.
- Guo et al. (2015) Q. Guo, A. P. Cooper, C. Frenk, J. Helly, and W. A. Hellwing, MNRAS 454, 550 (2015), eprint 1503.08508.
- Boylan-Kolchin et al. (2012b) M. Boylan-Kolchin, J. S. Bullock, and M. Kaplinghat, MNRAS 422, 1203 (2012b), eprint 1111.2048.
- Barnes and White (1984) J. Barnes and S. D. M. White, MNRAS 211, 753 (1984).
- Blumenthal et al. (1986) G. R. Blumenthal, S. M. Faber, R. Flores, and J. R. Primack, ApJ 301, 27 (1986).
- Di Cintio et al. (2014) A. Di Cintio, C. B. Brook, A. V. Macciò, G. S. Stinson, A. Knebe, A. A. Dutton, and J. Wadsley, MNRAS 437, 415 (2014), eprint 1306.0898.
- Zolotov et al. (2012) A. Zolotov, A. M. Brooks, B. Willman, F. Governato, A. Pontzen, C. Christensen, A. Dekel, T. Quinn, S. Shen, and J. Wadsley, ApJ 761, 71 (2012), eprint 1207.0007.
- Garrison-Kimmel et al. (2018) S. Garrison-Kimmel, P. F. Hopkins, A. Wetzel, J. S. Bullock, M. Boylan-Kolchin, D. Keres, C.-A. Faucher-Giguere, K. El-Badry, A. Lamberts, E. Quataert, et al., ArXiv e-prints (2018), eprint 1806.04143.
- Garrison-Kimmel et al. (2017) S. Garrison-Kimmel, A. Wetzel, J. S. Bullock, P. F. Hopkins, M. Boylan-Kolchin, C.-A. Faucher-Giguère, D. Kereš, E. Quataert, R. E. Sanderson, A. S. Graus, et al., MNRAS 471, 1709 (2017), eprint 1701.03792.
- Lovell et al. (2017) M. R. Lovell, V. Gonzalez-Perez, S. Bose, A. Boyarsky, S. Cole, C. S. Frenk, and O. Ruchayskiy, MNRAS 468, 2836 (2017), eprint 1611.00005.
- Robles et al. (2019) V. H. Robles, T. Kelley, J. S. Bullock, and M. Kaplinghat, arXiv e-prints (2019), eprint 1903.01469.
- Kahlhoefer et al. (2019) F. Kahlhoefer, M. Kaplinghat, T. R. Slatyer, and C.-L. Wu, arXiv e-prints arXiv:1904.10539 (2019), eprint 1904.10539.
- Sameie et al. (2019) O. Sameie, H.-B. Yu, L. V. Sales, M. Vogelsberger, and J. Zavala, arXiv e-prints arXiv:1904.07872 (2019), eprint 1904.07872.
- Simon et al. (2011) J. D. Simon, M. Geha, Q. E. Minor, G. D. Martinez, E. N. Kirby, J. S. Bullock, M. Kaplinghat, L. E. Strigari, B. Willman, P. I. Choi, et al., ApJ 733, 46 (2011), eprint 1007.4198.
- Bonnivard et al. (2016) V. Bonnivard, D. Maurin, and M. G. Walker, MNRAS 462, 223 (2016), eprint 1506.08209.
- Martin et al. (2007) N. F. Martin, R. A. Ibata, S. C. Chapman, M. Irwin, and G. F. Lewis, MNRAS 380, 281 (2007), eprint 0705.4622.
- Willman et al. (2011) B. Willman, M. Geha, J. Strader, L. E. Strigari, J. D. Simon, E. Kirby, N. Ho, and A. Warres, AJ 142, 128 (2011), eprint 1007.3499.
- Belokurov et al. (2009) V. Belokurov, M. G. Walker, N. W. Evans, G. Gilmore, M. J. Irwin, M. Mateo, L. Mayer, E. Olszewski, J. Bechtold, and T. Pickering, MNRAS 397, 1748 (2009), eprint 0903.0818.
- Koch et al. (2009) A. Koch, M. I. Wilkinson, J. T. Kleyna, M. Irwin, D. B. Zucker, V. Belokurov, G. F. Gilmore, M. Fellhauer, and N. W. Evans, ApJ 690, 453 (2009), eprint 0809.0700.
- Kirby et al. (2013) E. N. Kirby, M. Boylan-Kolchin, J. G. Cohen, M. Geha, J. S. Bullock, and M. Kaplinghat, ApJ 770, 16 (2013), eprint 1304.6080.
- Ji et al. (2016) A. P. Ji, A. Frebel, J. D. Simon, and M. Geha, ApJ 817, 41 (2016), eprint 1510.07632.
- Lovell et al. (2018b) M. R. Lovell, J. Zavala, M. Vogelsberger, X. Shen, F.-Y. Cyr-Racine, C. Pfrommer, K. Sigurdson, M. Boylan-Kolchin, and A. Pillepich, MNRAS 477, 2886 (2018b), eprint 1711.10497.
- Elbert et al. (2018) O. D. Elbert, J. S. Bullock, M. Kaplinghat, S. Garrison-Kimmel, A. S. Graus, and M. Rocha, ApJ 853, 109 (2018), eprint 1609.08626.
- Ren et al. (2018) T. Ren, A. Kwa, M. Kaplinghat, and H.-B. Yu, ArXiv e-prints (2018), eprint 1808.05695.