Chandra, MDM, Swift, and NuSTAR observations confirming the SFXT nature of AX J1949.8+2534
Abstract
AX J1949.8+2534 is a candidate supergiant fast X-ray transient (SFXT) observed in outburst by INTEGRAL (IGR J19498+2534). We report on the results of six Neil Gehrels Swift-XRT, one Chandra, and one NuSTAR observation of the source. We find evidence of rapid X-ray variability on a few ks timescales. Fortunately, Chandra observed the source in a relatively bright state, allowing us to confidently identify the optical/NIR counterpart of the source. We also obtained an optical spectrum of this counterpart, which shows an H emission line and He I absorption features. The photometry and spectrum of the source allow us to constrain its distance, kpc, and reddening, . We find that the star is likely an early B-type Ia supergiant, confirming that AX J1949.8+2534 is indeed an SFXT.
1 Introduction
The International Gamma-ray Astrophysics Laboratory (INTEGRAL) mission (Winkler et al., 2003) has been observing the hard X-ray sky for more than 16 years. During this time it has uncovered a large number of new Be high-mass X-ray binaries (BeHMXBs), while also dramatically increasing the population of supergiant HMXBs (sgHMXBs; see e.g., Figure 4 in Walter et al. 2015). Additionally, INTEGRAL has unveiled new sub-classes of sgHMXBs: supergiant fast X-ray transients (SFXTs; Sguera et al. 2005; Negueruela et al. 2006b) and obscured supergiant HMXBs (e.g., IGR J16318-4848; Matt & Guainazzi 2003). There are also several sub-classes of SFXTs, which exhibit different dynamical ranges in their X-ray luminosities, from and different flare time scales (see e.g., Table 2 in Walter et al. 2015; Chaty 2011). Among all of these systems there are also a number of “intermediate” HMXBs, that do not entirely fit into these categories and have properties that lie in between the classes (see e.g., Sidoli & Paizis 2018). In order to understand the different physical processes responsible for producing the emission observed in these sub-classes and how they depend on the binary parameters (e.g., orbital period, eccentricity), it is important to increase the number of known members by identifying them through their X-ray and optical properties.
Prior the to launch of INTEGRAL, BeHMXBs dominated the population of known HMXBs (Walter et al., 2015). BeHMXBs consist of a compact object (CO), typically a neutron star (NS), and a non-supergiant Be spectral type companion, generally having longer orbital periods, days, than sgHMXBs (see Reig 2011 for a review). The Be companions are rapidly rotating, have H emission lines, and have an infrared (IR) excess compared to B stars (Porter & Rivinius, 2003). The H emission and IR excess come from a dense equatorial decretion disk rotating at or near Keplerian velocity, likely formed due to the fast rotation of the star (see Rivinius et al. 2013 for a review). These systems can be both persistent, with X-ray luminosities on the order of erg s-1, or transient (Reig, 2011). The transients become X-ray bright when the NS accretes material as it passes near (or through) the Be star’s decretion disk. These systems exhibit two types of X-ray flares. Type I flares occur periodically or quasi-periodically when the NS passes through periastron, increasing the X-ray flux by an order of magnitude, and lasting a fraction of the orbital period ( days; Reig 2011). Type II flares can occur at any orbital phase, reaching Eddington luminosity, and lasting a large fraction of an orbital period ( days; Reig 2011).
The sgHMXBs are composed of a CO and a supergiant O or B spectral type companion, typically with shorter orbital periods, days, than BeHMXBs (Reig, 2011; Walter et al., 2015). If the CO orbits close enough to the companion star it can accrete via Roche lobe overflow, reaching X-ray luminosities up to erg s-1 during an accretion episode (Chaty et al., 2008; Chaty, 2015). For longer period systems, the CO accretes from the fast ( km s-1) radiative wind of the supergiant companion, leading to persistent X-ray luminosities of erg s-1 (Chaty et al., 2008). These wind-fed systems are also often highly obscured ( cm-2) by the wind of the companion, and in some cases, by an envelope of gas and dust around the entire binary system (see e.g., IGR J16318-4848; Walter et al. 2003; Filliatre & Chaty 2004). The supergiant stars in these systems also exhibit an H emission line due to their winds, which is often variable in shape and intensity and can have a P-Cygni profile (see e.g., Vela X-1, IGR J11215-5952; Barziv et al. 2001; Lorenzo et al. 2010).
INTEGRAL’s wide field-of-view has enabled great progress in the study of HMXBs by discovering many SFXTs (see e.g., Negueruela et al. 2006b, or Sidoli 2013, 2017 for reviews). Unlike the typical sgHMXBs, SFXTs exhibit much lower quiescent X-ray luminosities (as low as erg s-1) with highly energetic ( erg s-1) X-ray flares lasting s (see e.g., in’t Zand 2005; Romano et al. 2014, 2015). INTEGRAL has also uncovered several systems, with flare to quiescent X-ray luminosity ratios of , lasting a few hours to days (see e.g., IGR J17354-3255; Sguera et al. 2011; Ducci et al. 2013). These systems have larger variability than seen in classic sgHMXB systems, but longer variability timescales than in SFXTs, and therefore have been called intermediate SFXTs (Sguera et al., 2011; Chaty, 2011).
Several models have been put forward to describe the flaring phenomenon observed in SFXTs. One possibility is that the flares are caused by the accretion of an inhomogeneous clumpy wind, produced by the high-mass stellar companion, onto the compact object (see e.g., in’t Zand 2005; Negueruela et al. 2006b; Walter & Zurita Heras 2007; Ducci et al. 2009; Bozzo et al. 2016). However, given the low-quiescent luminosities of some SFXTs, an additional mechanism for inhibiting the accretion onto the compact object is likely necessary (e.g., magnetic gating or sub-sonic accretion; Grebenev & Sunyaev 2007; Bozzo et al. 2008; Shakura et al. 2012).
The source AX J1949.8+2534 was discovered by the ASCA Galactic plane survey having an absorbed flux of 6 erg cm-2 s-1 in the 2-10 keV band (Sugizaki et al., 2001). AX J1949.8+2534 ( AX J1949 hereafter) was then detected by INTEGRAL for the first time in the hard X-ray band during two short flaring periods in 2015/2016 (Sguera et al., 2015)111 The source is also referred to as IGR J19498+2534 in the INTEGRAL catalog of Krivonos et al. (2017).. The first flaring episode lasted days and reached a peak flux erg cm-2 s-1 in the 22-60 keV band, while the second flaring episode lasted days with a similar peak flux erg cm-2 s-1 in the 22-60 keV band (Sguera et al., 2017). However, during the second flaring episode shorter time scale variability of 2-8 ks was detected, reaching a peak flux of 2 erg cm-2 s-1 in the 200 s binned light curve (Sguera et al., 2017). The dynamic range of the flare to quiescent X-ray luminosities in the 20-40 keV band is (Sguera et al., 2017).
In soft X-rays, Sguera et al. (2017) also reported on a Neil Gehrels Swift-XRT observation of the source, which was detected with an absorbed flux of 1.8 erg cm-2 s-1. This observation also provided a more accurate position for the source. However, there were two bright potential NIR counterparts within the 95% Swift positional uncertainty. Based on photometry, Sguera et al. (2017) classified these two bright NIR sources as B0V and B0.5Ia spectral type stars, respectively, leading to the conclusion that this source was either a BeHMXB or SFXT type source. The bright flares observed from AX J1949 disfavored the BeHXMB scenario, therefore, Sguera et al. (2017) favored the SFXT interpretation.
In this paper we report on Neil Gehrels Swift-XRT, Chandra, and NuSTAR legacy observations of the SFXT candidate AX J1949. These observations are part of an ongoing program to identify the nature of unidentified INTEGRAL sources by characterizing their broad-band (0.3-79.0 keV) X-ray spectrum. Additionally, we use the precise X-ray localization to identify the multi-wavelength counterpart for optical spectroscopic follow-up, which is also reported here.
2 Observations and Data Reduction
2.1 Neil Gehrels Swift X-ray Observatory
The Neil Gehrels Swift satellite’s (Gehrels et al., 2004) X-ray telescope (XRT; Burrows et al. 2005) has observed AX J1949 a total of six times, once in 2016 and five more times in a span of days in 2018. The 2016 observation was originally reported on by Sguera et al. 2017 (although for consistency we reanalyze it here), while the five observations from 2018 are reported on for the first time in this paper. The details of each Swift-XRT observation can be found in Table 1. We refer to each observation by the associated number shown in Table 1. The data were reduced using HEASOFT version 6.25 and the 2018 July version of the Swift-XRT Calibration Database (CALDB). The Swift-XRT instrument was operated in photon counting mode and the event lists were made using the xrtpipeline task. To estimate the count rates, source significances, and upper limits we used the uplimit and source statistics tool (sosta) in the XIMAGE package (version 4.5.1). The count rates and upper limits were also corrected for vignetting, dead time, the point-spread function (PSF), and bad pixels/columns that overlap with the source region.
We extracted the source spectrum for each Swift observation in which the source was detected with a signal-to-noise ratio (S/N) using XSELECT (version 2.4). A new ancillary response file was constructed using the xrtmkarf task using the exposure map created by the xrtpipeline task, and the corresponding response file was retrieved from the CALDB. The observed count rates (with no corrections applied) of the source in these observations were between cts s-1, so we used circular extraction regions with radii of 12 or 15 pixels depending on the observed count rate (see Table 1 in Evans et al. 2009). Background spectra were extracted from a source free annulus centered on AX J1949. The Swift spectra were grouped to have at least one count per bin and fit using Cash statistics (C-stat; Cash 1979).
In this paper, all spectra are fit using XSPEC (version 12.10.1; Arnaud 1996). We used the Tuebingen-Boulder ISM absorption model (tbabs) with the solar abundances of Wilms et al. (2000). All uncertainties reported in this paper (unless otherwise noted) are 1 .
| ObsID | offset | Start Time | Exp. | S/N | |
|---|---|---|---|---|---|
| arcmin | MJD | s | |||
| S0a | 00034497001 | 2.422 | 57503.446 | 2932 | 5.3 |
| S1 | 00010382001 | 2.997 | 58159.464 | 4910 | 5.5 |
| S2 | 00010382002 | 2.240 | 58166.446 | 3369 | 5.4 |
| S3 | 00010382003 | 2.441 | 58170.346 | 1568 | 2.2 |
| S4 | 00010382004 | 2.938 | 58173.336 | 4662 | 2.6 |
| S5 | 00010382005 | 0.424 | 58179.584 | 5482 | 4.5 |
2.2 Chandra X-ray Observatory
We observed AX J1949 using the Chandra Advanced CCD Imaging Spectrometer (ACIS; Garmire et al. 2003) on 2018 February 25 (MJD 58174.547; obsID 20197) for 4.81 ks. The source was observed by the front-illuminated ACIS-S3 chip in timed exposure mode and the data were telemetered using the “faint” format. A 1/4 sub-array was used to reduce the frame time to 0.8 s, ensuring that the pileup remained throughout the observation. All Chandra data analysis was performed using the Chandra Interactive Analysis of Observations (CIAO) software version 4.10 and CALDB version 4.8.1. The event file was reprocessed using the CIAO tool chandra_repro prior to analysis.
To locate all sources in the field of view, the CIAO tool wavdetect was run on the 0.5-8 keV band image222 We ran wavdetect using the exposure map and PSF map produced by the CIAO tools fluximage and mkpsfmap, respectively.. Only one source, the counterpart of AX J1949, was detected at the position R.A., Dec. with a statistical 95% confidence positional uncertainty of estimated using the empirical relationship (i.e., equation 12) from Kim et al. (2007). We were unable to correct for any systematic uncertainty in the absolute astrometry because only one X-ray source was detected. Therefore, we adopt the overall 90% Chandra systematic uncertainty of 08333http://cxc.harvard.edu/cal/ASPECT/celmon/ and convert it to the 95% uncertainty by multiplying by 2.0/1.7. The statistical and systematic errors were then added in quadrature, giving a 95% confidence positional uncertainty radius of for the source.
The Chandra energy spectrum of AX J1949 was extracted from a circular region centered on the source and having a radius of 2′′, enclosing of the PSF at 1.5 keV444See Chapter 4, Figure 4.6 at http://cxc.harvard.edu/proposer/POG/html/., and containing 260 net counts. The background spectrum was extracted from a source free annulus centered on the source. Given the small number of counts, we fit the Chandra spectrum using Cash statistics (C-stat; Cash 1979).
We have also extracted the Chandra light curves using a number of different binnings to search for spin and orbital periods in the data. Prior to extraction, the event times were corrected to the Solar system barycenter using the CIAO tool axbary.
2.3 NuSTAR
The Nuclear Spectroscopic Telescope Array (NuSTAR; Harrison et al. 2013) observed AX J1949 on 2018 February, 24 (MJD 58173.070; obsID 30401002002) for 45 ks. We reduced the data using the NuSTAR Data Analysis Software (NuSTARDAS) version 1.8.0 with CALDB version 20181022. Additionally, we filtered the data for background flares caused by NuSTAR’s passage through the South Atlantic Anomaly (SAA) using the options saacalc=2, saamode=optimized, and tentacle=yes, which reduced the total exposure time to 43 ks.
The source’s energy spectra from the FPMA and FPMB detectors were extracted from circular regions with radii of 45′′ centered on the source position. The background spectra were extracted from source-free regions away from AX J1949, but on the same detector chip. The NuSTAR spectra were grouped to have at least one count per bin. NuSTAR light curves were also extracted from both the FPMA and FPMB detectors in the 3-20 keV energy range using a number of different bin sizes (i.e., 100 s, 500 s, 1 ks, 5 ks). All NuSTAR light curves plotted in this paper show the averaged (over the FPMA and FPMB detectors) net count rate.
2.4 MDM Spectroscopy
The accurate position of the X-ray counterpart to AX J1949 provided by Chandra has allowed us to identify the optical/NIR counterpart to the source. The optical/NIR counterpart is the brightest source (see Table 3) considered by Sguera et al. (2017) as a potential counterpart (i.e., their source 5). This source has a Gaia position R.A. and Decl., which is away from the Chandra source position and within the 2 Chandra positional uncertainty.
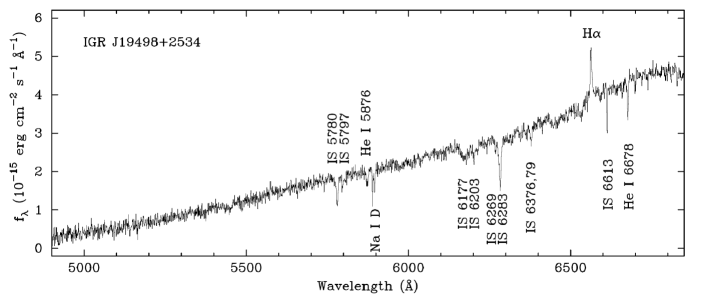
On 2018 October 18, a 600 s spectrum was obtained with the Ohio State Multi-Object Spectrograph on the 2.4 m Hiltner telescope of the MDM Observatory on Kitt Peak, Arizona. A wide slit and a volume-phase holographic grism provided a dispersion of 0.72 Å pixel-1 and a resolution of Å over the wavelength range 3965–6878 Å. The reduced spectrum is shown in Figure 1, where it can be seen that flux is not well detected below 4900 Å due to the large extinction to the star. Although a standard star was used for flux calibration, the narrow slit and partly cloudy conditions are not conducive to absolute spectrophotometry. Therefore, as a last step we have scaled the flux to match the magnitude from Table 3.
3 Results
3.1 X-ray spectroscopy
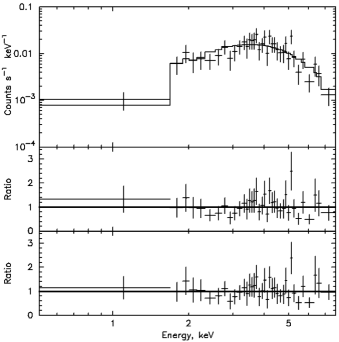
AX J1949 is a variable X-ray source (see Figure 2), but fortunately, Chandra observed it during a relatively bright state, allowing for the most constraining X-ray spectrum of all of the observations reported here. We fit the Chandra spectrum in the 0.5-8 keV range with two models, an absorbed power-law model and an absorbed blackbody model (see Figure 3). The best-fit power law model has a hydrogen absorption column density cm-2, photon index , and absorbed flux erg cm-2 s-1 (in the 0.3-10 keV band) with a C-stat of 121.5 for 182 d.o.f. On the other hand, the best-fit blackbody model has hydrogen absorption column density cm-2, temperature keV, radius m, and absorbed flux erg cm-2 s-1 (in the 0.3-10 keV band), where (7 kpc) is the assumed distance to the source (see Section 4.1), with a C-stat of 119.3 for 182 d.o.f. In either case, the photon-index, or the blackbody temperature and emitting radius, are consistent with those observed in SFXTs (see e.g., Table 4 in Romano et al. 2009). Therefore, since both models fit the data about equally well we cannot distinguish between them.
We extracted the Swift-XRT spectra for all observations where the source was detected with a S/N (i.e., S0, S1, S2, and S5). The source is not bright enough in any of these single observations to fit a constraining spectrum. Therefore, we jointly fit the Chandra spectrum with the four Swift-XRT spectra, tying together the hydrogen absorbing column, but leaving the photon index and normalization free to vary for each spectrum. The best-fit parameters can be seen in Table 2. There is marginal evidence () of spectral softening in the spectrum of S2, which could also be due to a variable hydrogen absorbing column as is often seen in SFXTs (see e.g., Sidoli et al. 2009; Bozzo et al. 2016; Goossens et al. 2018). We have also fit the spectra with an absorbed power-law model after tying together the and photon-index before fitting. When this is done, the best fitting spectrum has a hydrogen absorption column density cm-2 and photon-index with a C-stat of 275.0 for 295 d.o.f.
Unfortunately, AX J1949 was simultaneously observed with NuSTAR during the S4 Swift-XRT observation, when the source was at its faintest flux level (see Figure 4). Although the source was still jointly detected (i.e., FPMA+FPMB) with a significance of 5.3 and 5.7 (in the 3-79 keV and 3-20 keV energy bands, respectively), there were too few counts to constrain its spectrum. However, we extracted the 3 upper-limit flux in the 22-60 keV energy range for later comparison to INTEGRAL. To do this, we calculated the 3 upper-limit on the net count rate of the source in the 22-60 keV energy range (0.0011 cts s-1). SFXTs often show a cutoff in their spectra between keV (see e.g., Romano et al. 2011; Sidoli et al. 2017) so we use a power-law model with the best-fit absorption ( cm-2) and a softer photon index () that is typical for SFXTs detected in hard X-rays by INTEGRAL (see e.g., Sguera et al. 2008, 2011) to convert the count rate to flux. The 3 upper-limit on the flux in the 22-60 keV energy range is erg cm-2 s-1.
| Obs. | C-stat | d.o.f. | ||
|---|---|---|---|---|
| cm-2 | ||||
| CXO | 5.6 | 1.0 | 243.4 | 286 |
| S0 | 5.6aa This observation was originally reported on by Sguera et al. (2017). | 1.0 | – | – |
| S1 | 5.6aaThe hydrogen absorption column density () values were tied together for the fit reported in this table. | 1.5 | – | – |
| S2 | 5.6aaThe hydrogen absorption column density () values were tied together for the fit reported in this table. | 2.5 | – | – |
| S5 | 5.6aaThe hydrogen absorption column density () values were tied together for the fit reported in this table. | 2.2 | – | – |
3.2 X-ray variability and timing
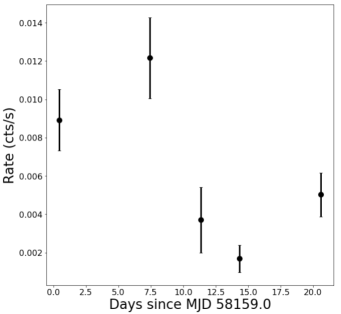
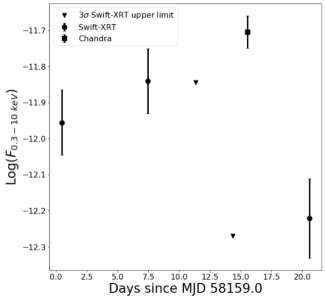
The fluxes of the source are not constrained if the photon-index is left free when jointly fitting the Chandra and Swift-XRT spectra. Therefore, to extract the fluxes from the Swift and Chandra observations we use the jointly fit model (i.e., and cm-2; see Section 3.1). The fluxes derived from these fits can be seen in Figure 4. Additionally, we assumed the same best-fit power-law model when converting the Swift 3 upper-limit count rates to fluxes. The flux from observation S0 is not shown in this figure but is erg cm-2 s-1, which is consistent within 2 of the value reported by Sguera et al. (2017).
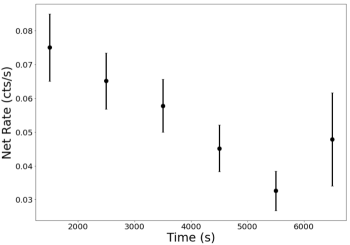
We have also searched for shorter timescale variability of AX J1949 in the individual Chandra and NuSTAR observations. The 1 ks binned net count rate light curve from the Chandra observation is shown in Figure 5. The light curve clearly shows that the source brightness decreased throughout the observation on a several ks timescale. No significant flaring behavior was found in the Chandra light curves with smaller binnings. We also searched for any periodic signal in the Chandra data using the Z (Buccheri et al., 1983), but no significant periodicity was found.
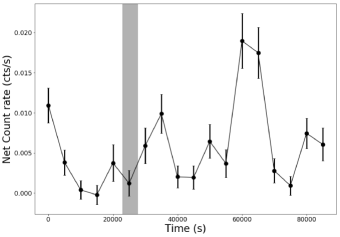
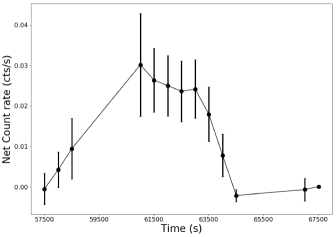
There are also indications of variability in the 3-20 keV NuSTAR light curve. Notably, the 5 ks binned net light curve (see Figure 6) shows evidence of a flux enhancement lasting 10 ks. To test the significance of this variability we have fit a constant value to the light curve. The best-fit constant has a value of 3.0 counts s-1 with a =93.6 for 17 degrees of freedom, implying that the source is variable at a level. The 500 s binned light curve of the period of flux enhancement (see Figure 7) shows the light curve reached a peak count rate of 0.03 cts s-1. This corresponds to a peak flux of erg cm-2 s-1, assuming the best-fit power law model (i.e., and cm-2). This flux is consistent with the flux observed during the Chandra observation, suggesting that the source’s light curve varies over timescales of ks.
3.3 Optical/NIR companion photometry
Using the accurate source position provided by Chandra we have confidently identified the multi-wavelength counterpart to this source. Only one Gaia source lies within the (2) positional uncertainty of AX J1949. The source is also detected in optical by Pan-STARRs (Flewelling et al., 2016), in NIR by 2MASS (Skrutskie et al., 2006), and in IR by WISE (Cutri et al., 2012). The counterparts multi-wavelength magnitudes can be found in Table 3.
| Obs. | R.A. | Decl. | Filter | Mag. |
|---|---|---|---|---|
| deg. | deg. | |||
| Gaia | 297.480949745(9) | 25.56659555(1) | G | 13.9860(8) |
| – | – | Bp | 16.299(6) | |
| – | – | Rp | 12.578(3) | |
| PSaaPan-Starrs | 297.480960(2) | 25.566612(7) | g | 17.516(8) |
| – | – | r | 14.981(4) | |
| – | – | i | 13.1990 | |
| – | – | z | 12.1140 | |
| – | – | y | 11.7220 | |
| NOMAD | 297.4809331 | 25.5666150 | B | 18.04 |
| – | – | V | 16.12 | |
| – | – | R | 14.62 | |
| 2MASS | 297.480989 | 25.566639 | J | 9.90(2) |
| – | – | H | 9.07(2) | |
| – | – | 8.63(2) | ||
| WISE | 297.4809572 | 25.5666135 | W1 | 8.32(2) |
| – | – | 8.17(2) | ||
| – | – | 8.30(3) |
Gaia has also measured the parallax, , and proper motion, , , of AX J1949’s counterpart (Gaia Collaboration et al., 2018). Unfortunately, the Gaia parallax has a large relative error () and, therefore, has a large uncertainty in the inferred distance, kpc (Bailer-Jones et al., 2018). We note that this source also has a poorly fit astrometric solution with excess noise, possibly due to its binary nature. Therefore, we do not rely on the Gaia parallax and simply take it as an indicator that the source is at least at a distance of a few kpc. The large extinction observed in the optical magnitudes of the source also support this claim (see Section 4.1).
3.4 Optical spectroscopy
The optical counterpart of AX J1949 shows H emission with EW Å and FWZI km s-1, and absorption lines of He I 5876 Å and 6678 Å (see Figure 1). The remaining absorption features are diffuse interstellar bands, whose strengths are consistent with the large extinction inferred from the colors of the star (see Section 4.1).
4 Discussion
4.1 Optical/NIR Companion Stellar Type
The optical spectrum of the companion star shows He I absorption lines, suggesting that the star is hot (i.e., 10,000 K) and, therefore, is likely to be of either O or B spectral class. Here we use the NOMAD -band photometry in combination with the 2MASS NIR photometry to assess the spectral type, extinction, and distance to this star. The NOMAD -band magnitude and the 2MASS NIR magnitudes can be found in Table 3. To estimate the extinction we use the intrinsic color relationships between the -band and NIR magnitudes provided by Table 2 in Wegner (2014). To recover the intrinsic color relationships of late O and early to late B type stars, we need to deredden the source by an , assuming the extinction law of Cardelli et al. (1989). The 3D extinction maps555We use the mwdust python package to examine the dust maps (Bovy et al., 2016). of Marshall et al. (2006) suggest a distance of 7-8 kpc for this range of .
The reddening and estimated distance to the source can be used to place constraints on its spectral type and luminosity class. In order for the star to have an observed -band magnitude of 16.12 at a distance of 7 kpc with a reddening of , it should have an absolute magnitude of . The lack of He II absorption features in the optical spectrum suggests that the star is more likely to be of B-type rather than O-type. By comparing the absolute magnitude to Table 7 in Wegner (2006) we find that the star is most likely to be of the Ia luminosity class. Further, the strong He I absorption lines indicate that the star is an early B-type star. However, we mention one caveat, which is that while the lower luminosity classes are not bright enough to be consistent with the distance/reddening to the source, there is a large uncertainty in some of the absolute magnitudes for different luminosity classes (e.g., luminosity class Ib, II; Wegner 2006).
Lastly, the optical spectrum of the star shows an H emission line, which is seen in both Be, and supergiant type stars. This line has been observed in a number of similar systems and is often variable in shape and intensity, sometimes showing a P-Cygni like profile (see e.g., Negueruela et al. 2006a, b; Pellizza et al. 2006). Unfortunately, we have only obtained a single spectrum and cannot assess the variability of the H line. Additionally, it does not appear to be P-Cygni like in this single spectrum.
In comparison, by using optical and NIR photometry, Sguera et al. (2017) found the stellar companion of AX J1949 to be consistent with a B0.5Ia type star at a distance, kpc, and having a reddening, . We have also found that the star is consistent with an early B-type type star of the Ia luminosity class. However, our estimates of the reddening and distance differ slightly from Sguera et al. (2017), in that we find a larger reddening and smaller distance.
4.2 SFXT Nature
At an assumed distance of kpc, AX J1949’s Chandra and Swift-XRT fluxes (when the source is significantly detected) correspond to luminosities of erg s-1 and erg s-1, respectively. Further, at harder X-ray energies, AX J1949 has a NuSTAR 3 upper-limit quiescent luminosity erg s-1 in the 22-60 keV band, while during its flaring X-ray activity detected by INTEGRAL, it reached a peak luminosity of erg s-1 in the 22-60 keV band (Sguera et al., 2017). This implies a lower-limit on the dynamical range of the system of . The large dynamical range and relatively low persistent X-ray luminosity are typical of SFXTs. Additionally, converting the absorbing column density, cm-2, derived from the spectral fits to the X-ray data to following the relationship provided by Bahramian et al. (2015), we find . This is a factor of 2-2.5 larger than the derived from the interstellar absorption to the companion star (see Section 4.1). This suggests that a large fraction of the absorption is intrinsic to the source, which has also been observed in other SFXTs (e.g., XTE J1739-302, AX J1845.0-0433; Negueruela et al. 2006a; Zurita Heras & Walter 2009). Lastly, the optical counterpart to AX J1949 appears to be an early supergiant B-type star, which have been found in of the SFXT systems (see Figure 2 in Sidoli 2017). NIR spectra and additional optical spectra should be undertaken to search for additional absorption features, as well as changes in the H line profile to solidify the spectral type.
5 Summary and Conclusion
A large number of unidentified INTEGRAL sources showing rapid hard X-ray variability have been classified as SFXTs. We have analyzed Neil Gehrels Swift-XRT, Chandra, and NuSTAR observations of the SFXT candidate AX J1949, which shows variability on ks timescales. The superb angular resolution of Chandra has allowed us to confirm the optical counterpart to AX J1949 and obtain its optical spectrum, which showed an H emission line, along with He I absorption features. The spectrum, coupled with multi-wavelength photometry allowed us to place constraints on the reddening, , and distance, kpc, to the source. We find that an early B-type Ia is the most likely spectral type and luminosity class of the star, making AX J1949 a new confirmed member of the SFXT class.
Acknowledgments: We thank Justin Rupert for obtaining the optical spectrum at MDM. We thank the anonymous referee for providing useful and constructive comments that helped to improve the paper. This work made use of observations obtained at the MDM Observatory, operated by Dartmouth College, Columbia University, Ohio State University, Ohio University, and the University of Michigan. This work made use of data from the NuSTAR mission, a project led by the California Institute of Technology, managed by the Jet Propulsion Laboratory, and funded by the National Aeronautics and Space Administration. We thank the NuSTAR Operations, Software and Calibration teams for support with the execution and analysis of these observations. This research has made use of the NuSTAR Data Analysis Software (NuSTARDAS) jointly developed by the ASI Science Data Center (ASDC, Italy) and the California Institute of Technology (USA). JH and JT acknowledge partial support from NASA through Caltech subcontract CIT-44a-1085101. JAT acknowledges partial support from Chandra grant GO8-19030X.
References
- Arnaud (1996) Arnaud, K. A. 1996, Astronomical Data Analysis Software and Systems V, 101, 17
- Bailer-Jones et al. (2018) Bailer-Jones, C. A. L., Rybizki, J., Fouesneau, M., Mantelet, G., & Andrae, R. 2018, AJ, 156, 58
- Bahramian et al. (2015) Bahramian, A., Heinke, C. O., Degenaar, N., et al. 2015, MNRAS, 452, 3475
- Barziv et al. (2001) Barziv, O., Kaper, L., Van Kerkwijk, M. H., et al. 2001, A&A, 377, 925.
- Bovy et al. (2016) Bovy, J., Rix, H.-W., Green, G. M., et al. 2016, ApJ, 818, 130.
- Bozzo et al. (2008) Bozzo, E., Falanga, M., & Stella, L. 2008, ApJ, 683, 1031
- Bozzo et al. (2016) Bozzo, E., Bhalerao, V., Pradhan, P., et al. 2016, A&A, 596, A16
- Bozzo et al. (2016) Bozzo, E., Oskinova, L., Feldmeier, A., & Falanga, M. 2016, A&A, 589, A102
- Buccheri et al. (1983) Buccheri, R., Bennett, K., Bignami, G. F., et al. 1983, A&A, 128, 245
- Burrows et al. (2005) Burrows, D. N., Hill, J. E., Nousek, J. A., et al. 2005, Space Sci. Rev., 120, 165
- Cardelli et al. (1989) Cardelli, J. A., Clayton, G. C., & Mathis, J. S. 1989, ApJ, 345, 245
- Cash (1979) Cash, W. 1979, ApJ, 228, 939
- Chaty et al. (2008) Chaty, S., Rahoui, F., Foellmi, C., et al. 2008, A&A, 484, 783
- Chaty (2011) Chaty, S. 2011, Evolution of Compact Binaries, 447, 29
- Chaty (2015) Chaty, S. 2015, arXiv:1510.07681
- Cutri et al. (2012) Cutri, R. M., Wright, E. L., Conrow, T., et al. 2012, Explanatory Supplement to the WISE All-Sky Data Release Products,
- Ducci et al. (2009) Ducci, L., Sidoli, L., Mereghetti, S., Paizis, A., & Romano, P. 2009, MNRAS, 398, 2152
- Ducci et al. (2013) Ducci, L., Romano, P., Esposito, P., et al. 2013, A&A, 556, A72
- Evans et al. (2009) Evans, P. A., Beardmore, A. P., Page, K. L., et al. 2009, MNRAS, 397, 1177
- Filliatre & Chaty (2004) Filliatre, P., & Chaty, S. 2004, ApJ, 616, 469
- Flewelling et al. (2016) Flewelling, H. A., Magnier, E. A., Chambers, K. C., et al. 2016, ArXiv e-prints , arXiv:1612.05243.
- Fruscione et al. (2006) Fruscione, A., McDowell, J. C., Allen, G. E., et al. 2006, Proc. SPIE, 6270, 62701V
- Gaia Collaboration et al. (2018) Gaia Collaboration, Brown, A. G. A., Vallenari, A., et al. 2018, A&A, 616, A1
- Garmire et al. (2003) Garmire, G. P., Bautz, M. W., Ford, P. G., Nousek, J. A., & Ricker, G. R., Jr. 2003, Proc. SPIE, 4851, 28
- Gehrels et al. (2004) Gehrels, N., Chincarini, G., Giommi, P., et al. 2004, ApJ, 611, 1005
- Goossens et al. (2018) Goossens, M. E., Bird, A. J., Hill, A. B., Sguera, V., & Drave, S. P. 2018, arXiv:1811.11882
- Grebenev & Sunyaev (2007) Grebenev, S. A., & Sunyaev, R. A. 2007, Astronomy Letters, 33, 149
- Harrison et al. (2013) Harrison, F. A., Craig, W. W., Christensen, F. E., et al. 2013, ApJ, 770, 103
- Hunter (2007) Hunter, J. D. 2007, Computing in Science and Engineering, 9, 90
- in’t Zand (2005) in’t Zand, J. J. M. 2005, A&A, 441, L1
- Kim et al. (2007) Kim, M., Kim, D.-W., Wilkes, B. J., et al. 2007, ApJS, 169, 401
- Krivonos et al. (2017) Krivonos, R. A., Tsygankov, S. S., Mereminskiy, I. A., et al. 2017, MNRAS, 470, 512
- Lorenzo et al. (2010) Lorenzo, J., Negueruela, I., & Norton, A. J. 2010, High Energy Phenomena in Massive Stars, 422, 259
- Marshall et al. (2006) Marshall, D. J., Robin, A. C., Reylé, C., Schultheis, M., & Picaud, S. 2006, A&A, 453, 635
- Matt & Guainazzi (2003) Matt, G., & Guainazzi, M. 2003, MNRAS, 341, L13
- Negueruela et al. (2006a) Negueruela, I., Smith, D. M., Harrison, T. E., & Torrejón, J. M. 2006, ApJ, 638, 982
- Negueruela et al. (2006b) Negueruela, I., Smith, D. M., Reig, P., Chaty, S., & Torrejón, J. M. 2006, The X-ray Universe 2005, 604, 165
- Pellizza et al. (2006) Pellizza, L. J., Chaty, S., & Negueruela, I. 2006, A&A, 455, 653
- Porter & Rivinius (2003) Porter, J. M., & Rivinius, T. 2003, PASP, 115, 1153
- Reig (2011) Reig, P. 2011, Ap&SS, 332, 1
- Rivinius et al. (2013) Rivinius, T., Carciofi, A. C., & Martayan, C. 2013, A&A Rev., 21, 69
- Romano et al. (2009) Romano, P., Sidoli, L., Cusumano, G., et al. 2009, MNRAS, 399, 2021
- Romano et al. (2011) Romano, P., Mangano, V., Cusumano, G., et al. 2011, MNRAS, 412, L30.
- Romano et al. (2014) Romano, P., Ducci, L., Mangano, V., et al. 2014, A&A, 568, A55
- Romano et al. (2015) Romano, P., Bozzo, E., Mangano, V., et al. 2015, A&A, 576, L4
- Sguera et al. (2005) Sguera, V., Barlow, E. J., Bird, A. J., et al. 2005, A&A, 444, 221
- Sguera et al. (2008) Sguera, V., Bassani, L., Landi, R., et al. 2008, A&A, 487, 619
- Sguera et al. (2011) Sguera, V., Drave, S. P., Bird, A. J., et al. 2011, MNRAS, 417, 573
- Sguera et al. (2015) Sguera, V., Bazzano, A., & Sidoli, L. 2015, The Astronomer’s Telegram, 8250
- Sguera et al. (2017) Sguera, V., Sidoli, L., Paizis, A., et al. 2017, MNRAS, 469, 3901
- Shakura et al. (2012) Shakura, N., Postnov, K., Kochetkova, A., & Hjalmarsdotter, L. 2012, MNRAS, 420, 216
- Sidoli et al. (2009) Sidoli, L., Romano, P., Ducci, L., et al. 2009, MNRAS, 397, 1528
- Sidoli (2013) Sidoli, L. 2013, arXiv:1301.7574
- Sidoli (2017) Sidoli, L. 2017, Proceedings of the XII Multifrequency Behaviour of High Energy Cosmic Sources Workshop. 12-17 June, 2017 Palermo, Italy
- Sidoli et al. (2017) Sidoli, L., Tiengo, A., Paizis, A., et al. 2017, ApJ, 838, 133.
- Sidoli & Paizis (2018) Sidoli, L., & Paizis, A. 2018, MNRAS, 481, 2779
- Skrutskie et al. (2006) Skrutskie, M. F., Cutri, R. M., Stiening, R., et al. 2006, AJ, 131, 1163
- Sugizaki et al. (2001) Sugizaki, M., Mitsuda, K., Kaneda, H., et al. 2001, ApJS, 134, 77
- Walter et al. (2003) Walter, R., Rodriguez, J., Foschini, L., et al. 2003, A&A, 411, L427
- Walter & Zurita Heras (2007) Walter, R., & Zurita Heras, J. 2007, A&A, 476, 335
- Walter et al. (2015) Walter, R., Lutovinov, A. A., Bozzo, E., & Tsygankov, S. S. 2015, A&A Rev., 23, 2
- Wegner (2006) Wegner, W. 2006, MNRAS, 371, 185
- Wegner (2014) Wegner, W. 2014, Acta Astron., 64, 261
- Wegner (2015) Wegner, W. 2015, Astronomische Nachrichten, 336, 159
- Wilms et al. (2000) Wilms, J., Allen, A., & McCray, R. 2000, ApJ, 542, 914
- Winkler et al. (2003) Winkler, C., Courvoisier, T. J.-L., Di Cocco, G., et al. 2003, A&A, 411, L1
- Zurita Heras & Walter (2009) Zurita Heras, J. A., & Walter, R. 2009, A&A, 494, 1013