An Analysis of 35+ Million Jobs of Travis CI
Abstract
Travis CI handles automatically thousands of builds every day to, amongst other things, provide valuable feedback to thousands of open-source developers. In this paper, we investigate Travis CI to firstly understand who is using it, and when they start to use it. Secondly, we investigate how the developers use Travis CI and finally, how frequently the developers change the Travis CI configurations. We observed during our analysis that the main users of Travis CI are corporate users such as Microsoft. And the programming languages used in Travis CI by those users do not follow the same popularity trend than on GitHub, for example, Python is the most popular language on Travis CI, but it is only the third one on GitHub. We also observe that Travis CI is set up on average seven days after the creation of the repository and the jobs are still mainly used (60%) to run tests. And finally, we observe that 7.34% of the commits modify the Travis CI configuration. We share the biggest benchmark of Travis CI jobs (to our knowledge): it contains 35,793,144 jobs from 272,917 different GitHub projects.
I Introduction
In the last years, more and more manual software engineering tasks have been assisted or replaced by automatization processes. One of the most popular automatizations in software engineering is continuous integration. This concept of continuous integration was initially to ensure that the new commits are correctly integrated inside the software, i.e., for a new commit or at a specific scheduled time interval, the tests are executed to identify regression bugs in the applications [1]. However, this concept evolved with time, and it is no longer limited to building and testing applications. Indeed, continuous integration is now used for new usages such as code analysis and application deployments. This evolution is illustrated with the new features are proposed the continuous integration tools, such as automatic deployment.
However, those new usages are little studies. It is crucial to analyze those usages since continuous integration is more and more used and taught. Additional knowledge is mandatory to understand the requirements, difficulties of the developers, and to be able to provide new solutions to improve their workflow and new needs.
In this paper, we contribute to this vision by studying the integration of the continuous integration in open-source repositories. We investigate the biggest continuous integration success story [2]: Travis CI. Travis CI is the most popular open-source continuous integration service for GitHub. We consider different aspects of understanding the usage of Travis CI. Firstly, we study who is using Travis CI, secondly when developers integrate Travis CI in their projects, then we analyze the different usages that developers have on Travis CI and finally, we look for if the developers are maintaining their automatization environments.
To sum up, our contributions are:
- •
-
•
A benchmark of all Travis CI jobs executed during 30 September 2018 to 22 January 2019. It contains 35,793,144 Travis CI jobs triggered by 272,917 projects. The benchmark is available on Zenodo with the DOI: 10.5281/zenodo.2560966 for future research. The tool-set that has been used to create the benchmark is available on GitHub.111The tool-set to collect to create the benchmark: https://github.com/tdurieux/travis-listener For comparison, Hilton et al. [5]’s study considers 12,000 projects, our dataset has data from 250,000 projects.
Section II presents what is Travis CI. Section III presents our analysis of Travis CI in four research questions. Section IV presents the related works of this study and Section V concludes this paper.
II What is Travis CI?
Travis CI is a company that offers an open-source continuous integration service that is tightly integrated with GitHub. It allows developers to build their projects without maintaining their own infrastructure. Travis CI provides a simple interface to configure build tasks that are executed for a set of given events: pull requests, commits, crons, and API calls. Currently, Travis CI supports 34 different programming languages including Python, NodeJS, Java, C, C++ in three different operating systems: Linux, Windows, and Mac OSX. It also provides additional services that support, for example, Docker, Android apps, iOS apps, and databases. The Travis CI service is free for open-source projects, and a paid version is available for private projects. It is currently used by more than 932,977 open-source projects and 600,000 users.222From https://travis-ci.org, visited February 26, 2024
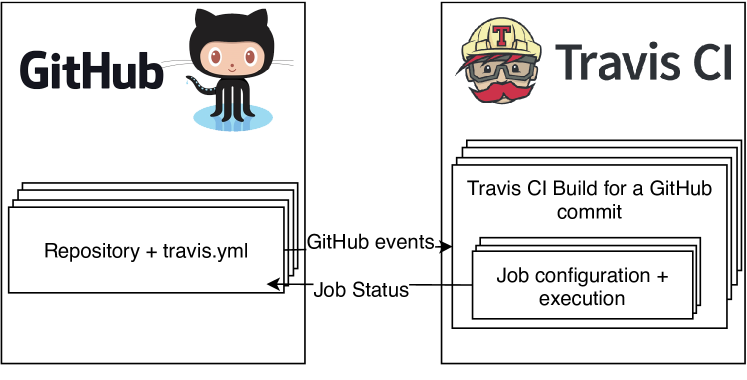
Figure 1 presents a high level representation of Travis CI infrastructure. Travis CI interacts with GitHub with a set of webhooks that are triggered by GitHub events. For each event, Travis CI sets up a new build by reading the configuration that the developers wrote in their repository (.travis.yml file). Each build is composed of one or several jobs. A job is the execution of the build in a specific environment, for example, one job runs with Java 8 and one with Java 9, or a job can also be used for specific tasks such as deploying Docker images. According to our benchmark, on average, each build contains 3.72 jobs.
III Travis CI Analysis
In this section, we present our study on Travis CI to understand the behavior of the developers regarding the automatization of their open-source repositories.
III-A Research Questions
To achieve the goal of this analysis, we focus on four different aspects:
-
•
RQ1. Who is using Travis CI? This first research question aims to identify which type of users or programming communities use Travis CI and at which scale.
-
•
RQ2. Do the projects use Travis CI since their inception? In this research question, we analyze how much time the developers take to setup Travis CI in their projects, and we observe if there is a different behavior depending on the type of user.
-
•
RQ3. How is Travis CI used? The next question is to understand to what extent Travis CI is used to execute tasks that are not related to testing.
-
•
RQ4. To what extent do Travis CI configurations evolve over time? The final question studies the evolution of the Travis CI project configuration in order to understand if the developers take care of maintaining their build configurations.
III-B Study Design
| # Job execution | 35,793,144 |
|---|---|
| # Projects | 272,917 |
| # Users | 123,168 |
| # Period of the study | 30 September 2018 to 22 January 2019 |
To answer our research questions, we create a new benchmark with data extracted from Travis CI and GitHub. We agnostically collected all job information of Travis CI from the 30 September 2018 to the 22 January 2019. The main statistics of the benchmark are presented in Table I. During that period, we collected 35,793,144 build jobs, which represent 59G of raw data. In addition to those job configurations from Travis CI, we collected the GitHub data related to the repositories that use Travis CI during the studied period. We collected data from 272,917 different repositories which represent 2.3G of raw data. The benchmark is available on Zenodo with the DOI: 10.5281/zenodo.2560966 for future research. The tool-set that has been used to create the benchmark is available on GitHub: https://github.com/tdurieux/travis-listener.
III-C RQ1. Who is currently using Travis CI?
The first research question that we investigate is to understand the types of user that use Travis CI. We first look at the number of fork repositories that use Travis CI compared to non-fork repositories. Then we look at the number of organization and individual accounts that use Travis CI.
| Fork | Non-Fork | |
|---|---|---|
| # Projects | 30,579 (11.56%) | 233,880 (88.43%) |
The fork metric indicates the number of forks that are used for active development on GitHub. Indeed, setting up Travis CI on a fork is an additional step that only active developers do. There are two use cases: the first use-case is a developer that frequently contributes to a project using pull requests and wants to ensure the correct behavior of her code before opening the pull request. The second use-case is that the developers that fork a repository to continue or change the direction of the project. Table II presents the results of this study. It shows that most of the active Travis CI users are working on non-forked repositories, and 11.56% of the repositories are forks. It indicates as expected that non-fork repositories are bigger Travis CI users, but sill 30,579 forked repositories used Travis CI during the studied period. It means that the owner of those repositories did the additional step to increase the quality of their contributions.
| Individual User | Organization | |
|---|---|---|
| # Projects | 158,446 (59.91%) | 106,013 (40.08%) |
The second metric is related to the number of users and organizations that use Travis CI. This metric reflects if an organization is more likely to set up Travis CI compare to traditional users. Table III shows the number of repositories that are owned by individual users vs. organizations, according to GitHub API. It shows that 59.91% of the repositories are owned by individual users. However, considering the number of repositories owned by organization vs. users (31 million users vs. 2.1 million organizations333GitHub statistics: https://octoverse.github.com/ (visited 15 June 2019)) it is much likely that an organization that owns a repository will setup Travis CI compared to individual users. The organizations are as expected the biggest Travis CI users in term of jobs executed. Table IV presents the top 10 biggest users of Travis CI. Those ten users represent 4.06% (1,453,755 jobs) of the total amount of jobs executed by Travis CI. The new owner of GitHub (Microsoft + Azure) is the biggest Travis CI user, followed by the Apache foundation, Elastic and Mozilla. We note the absence of the other big software companies such as Google, Apple, Facebook, or Amazon.
| # | Owner | # Jobs | # Projects |
|---|---|---|---|
| 1 | Apache | 248,154 | 262 |
| 2 | Elastic | 188,757 | 38 |
| 3 | Mozilla | 168,394 | 174 |
| 4 | Azure | 161,169 | 143 |
| 5 | Microsoft | 151,654 | 225 |
| 6 | Robertdebock | 129,121 | 91 |
| 7 | Rust-lang | 115,240 | 29 |
| 8 | Rails | 111,530 | 26 |
| 9 | Mike-north | 94,423 | 52 |
| 10 | Pytorch | 85,313 | 8 |
The final observation about who is using Travis CI is about the language that the developers use in Travis CI compared to the languages that they use in GitHub. Table V presents the most popular languages of Travis CI and compares them to GitHub ranking444GitHub language ranking: https://github.blog/2018-11-15-state-of-the-octoverse-top-programming-languages/, N.A. is used when the language is not present in the top 10 of GitHub. We observe that the Travis CI popular language is uncorrelated with the ranking of GitHub. This shows that some language communities, such as Python, PHP, C, Go, Rust, have a stronger usage of Travis CI compared to their popularity. It seems to indicate that those language environments have a stronger culture of continuous integration compared to other environments.
| Rank | |||
|---|---|---|---|
| Travis CI | GitHub | Programing language | # Builds |
| 1 | 3 | Python | 7,793,364 |
| 2 | 1 | NodeJs | 6,441,830 |
| 3 | 4 | PHP | 3,387,538 |
| 4 | 10 | Ruby | 3,030,574 |
| 5 | 5 | C++ | 2,799,603 |
| 6 | 9 | C | 2,459,281 |
| 7 | 2 | Java | 2,200,925 |
| 8 | N.A | Go | 1,512,233 |
| 9 | 8 | Shell | 1,461,724 |
| 10 | N.A | Rust | 1,054,800 |
RQ1. Who is using Travis CI? Our experiment reveals that Travis CI is used by a large diversity of users, by more than 123,168 unique users uses Travis CI during the studied period. Moreover, the biggest Travis CI users are corporate institutions that have open-source projects such as Elastic Search or Microsoft. This study also reveals that some programming language communities are more active on Travis CI than others, for example, Python is the most popular language on Travis CI but is only the third over GitHub repositories.
III-D RQ2. Do the projects use Travis CI since their inception?
In the second research question, we investigate when Travis CI users start to use Travis CI in order to understand the habit of the developers. In this study, we consider that a project uses Travis CI since the beginning when the first Travis CI job is started in the 48 hours after the creation of the GitHub repository. We investigate firstly if the type of project and user has an impact on the Travis CI setup time. Secondly, we analyze how the setup time evolves with the age of the project.
| Project type | User type | # Projects | % |
|---|---|---|---|
| Fork | Individual user | 10,369 | 40.05% |
| Fork | Organization | 1,504 | 32.06% |
| Non-fork | Individual user | 59,411 | 44.81% |
| Non-fork | Organization | 33,886 | 33.44% |
To understand the topology of the setup of Travis CI, we first look if the type of project and the type of user have an impact on the setup time of Travis CI. Table VI presents the number of projects that start to use Travis CI in the 48 hours of their creation. We can observe that individual users set up more frequently Travis CI since the beginning compared to organization projects. However, there is no major difference between forked projects and non-forked projects. A potential explanation of the difference between individual users and organizations can be that projects from organizations are started internally before being released publicly. Consequently, the first Travis CI build will be when the project is made available instead of when the first commit is pushed.
| Creation year | Average | Median | # Projects | % |
| 2008 | 5.2 years | 4.85 years | 213 | 0.07% |
| 2009 | 4.93 years | 4.59 years | 621 | 0.22% |
| 2010 | 3.91 years | 3.64 years | 1,461 | 0.53% |
| 2011 | 3.04 years | 2.75 years | 3,295 | 1.2% |
| Travis CI creation | ||||
| 2012 | 2.29 years | 1.99 years | 5,625 | 2.06% |
| 2013 | 1.6 years | 1.08 years | 9,945 | 3.64% |
| 2014 | 1.08 years | 6.56 months | 16,139 | 5.91% |
| 2015 | 8.77 months | 2.38 months | 25,349 | 9.28% |
| 2016 | 5.46 months | 24.85 days | 36,728 | 13.45% |
| 2017 | 2.9 months | 8.18 days | 54,170 | 19.84% |
| 2018 | 23.3 days | 1.44 days | 102,644 | 37.6% |
| 2019 | 1.37 days | 2.18 hours | 8,269 | 3.02% |
| Total | 5.55 months | 7.6 days | 272,917 | 100% |
Table VII presents the results of our second investigation regarding the setup time. The table contains the average and median time of the setup of Travis CI depending on the age of the project. The first column presents the age of the project; the second and third columns present the average and median time for setting up Travis CI. Finally, the two last columns present the number of projects created for a given year and the proportion of the total number of studied projects.
We observe that the setup time of Travis CI is decreasing with time. In the year of Travis CI creation, it takes almost two years for the projects to set up Travis CI, and nowadays in 2019, the median time is 2.18 hours. This change can be explained firstly by the increasing popularity of Travis CI, secondly by the Travis CI GitHub app that automatically sets up Travis CI when a repository is created.
RQ2. Do the projects use Travis CI since their inception? We observed that it takes seven days (median) to set up Travis CI in a GitHub repository. We also noticed that older projects take months up to years, but this time has drastically decreased over the last two years. Individual users are more prone to set up Travis CI compare to organizations.
III-E RQ3. How is Travis CI used?
Now that we have a better understanding of who and when Travis CI is used by developers, we study the usage of Travis CI by the developers. The goal is to identify the different usages and to what extent they are used.
In order to achieve this goal, we manually analyzed build configurations and commit messages to identify categories of usage. Then, we select keywords that we use to classify automatically the 35,793,144 Travis CI jobs that we collected.
We identify the following eight categories:
-
1.
[Building] building jobs are used to compile and verify that the project still compiles;
-
2.
[Testing] testing jobs are used to compile and run the test suite of the application;
-
3.
[Releasing] releasing jobs are used to deploy the project binaries or the docker images;
-
4.
[Analyzing] analyzing jobs are performing static analysis to detect bugs, typos or to assess the code quality of the project;
-
5.
[Formatting] formatting jobs verify that the source code is correctly formatted or that the license headers are correctly placed;
-
6.
[Documentation] documentation jobs are used to deploy documentation or websites of the project;
-
7.
[Communication] communication jobs consist of communicating information to the developers using email, Slack or GitHub comments and
-
8.
[Unknown] the final category contains the job that we did not succeed to categorize.
Table VIII presents the results of the classification. The first column contains the usage category, the second column contains the number of jobs present in that category, and the final column presents the proportion of this category over the complete benchmark.
The main observation is that the testing and building are the most frequent usage in Travis CI with 66.94% of the usage. Those two usages are followed by the documentation and formatting usages with 3.96% and 1.82% of the jobs, respectively. Those results show that the developers use Travis CI for other purposes than traditional testing; however, this usage is still marginal compared to testing. We plan to reproduce this experiment in one year to observe the evolution of the usage in Travis CI.
| Usage | # Jobs | % |
|---|---|---|
| Testing | 20,991,572 | 58.64% |
| Building | 2,973,544 | 8.30% |
| Documentation | 1,170,264 | 3.26% |
| Formatting | 653,291 | 1.82% |
| Releasing | 514,107 | 1.43% |
| Analyzing | 64,896 | 0.18% |
| Communication | 26,059 | 0.07% |
| Unknown | 9,399,411 | 26.26% |
RQ3. How is Travis CI used? According to our analysis, Travis CI is still mainly used for traditional building and testing activities. However, more than two millions of jobs are dedicated to other usages such as documentation deployment, code analysis, and code formatting. It shows that developers are now considering continuous integration for other purposes.
III-F RQ4. To what extent, Travis CI configurations evolve over time?
The previous research question focuses on the different usages of Travis CI. Now, in this research question, we analyze how frequently developers change their Travis CI configurations. This frequency shows the interest of the developers to maintain their configuration in a working state or the difficulty to set up the Travis CI environment.
The methodology that we follow to track those changes, is the look at the Travis CI configuration of each job and follow any change in their configuration. We track the configuration for each project but separating the configuration for each repository branch and for each build environment (called build matrix in Travis CI). Once we detect a change, we collect the commit SHA that triggered the job and finally count the unique commits that change the Travis CI configurations.
Following this methodology, we observe that 709,220 commits (7.34%) change the configuration during the studied period. Only 104,708 projects (38.36%) change their configuration. The results indicate that the majority of the projects have a stable configuration.
We manually analyze a sample of commits that change the configuration, and we observe that a significant number of builds are related to debugging the Travis CI configuration. It appears that the developers have trouble to set up a stable environment, especially when they are dealing with complex environments such as building mobile applications.
RQ4. To what extent do Travis CI configurations evolve over time? We observe that 7.34% of commits modify Travis CI configurations. This is the first experimental report of developers modifications of CI configuration. Further empirical studies are needed to understand the evolution of CI configuration better.
IV Related Works
Beller et al. [3] present TravisTorrent a benchmark of Travis CI builds where information is extracted from Travis CI and GitHub such as the number of builds, the message of the associated PR. The difference between TravisTorrent and our benchmark is that the age of the data and the completeness of the collected data. Indeed, TravisTorrent focuses on specific repositories (1,300), in our benchmark we collected all the Travis CI jobs between 30 September 2018 and 22 January 2019. Their following study [4] exploits this benchmark to study the build behavior of the projects that use Travis CI. Compared to this paper, we focus our analysis on different aspects. They focused on the outcome of the builds, and we focus on the usage and evolution of the Travis CI configuration.
Hilton et al. [5] study the use of continuous integration in open-source projects. It shows that continuous integration has a positive impact on the projects, and it is used in 70% of the most popular projects on GitHub. In this paper, we study a different aspect of continuous integration as well as including a larger number of builds and projects.
Zhao et al. [6] study the impact of Travis CI on development practices. Their main finding is that GitHub pull requests are more frequently closed after the integration of Travis CI. We did not focus our investigation on the impact of Travis CI on the development practices, but we focus on who, how, and for which purpose Travis CI is used.
Rausch et al. [7] present a study on 14 open-source projects that use GitHub and Travis CI. They analyzed the build failure and identified 14 different error categories. They presented several seven observations such as: “authors that commit less frequently tend to cause fewer build failures”, or “Build failures mostly occur consecutively”. We focused our analysis on the usage of Travis CI and did not analyze the outcome of the build. Moreover, we consider a much higher number of projects compared to this work.
Widder et al. [8] present a study that analyzes the reasons why projects are leaving Travis CI. They observed that this phenomenon is related to the build duration and the repository language. They showed that C# repositories are more likely to quit Travis CI because Travis CI did not support Windows virtual machine (Travis CI nowadays supports Windows virtual machines). On the contrary, repositories that have long build are more likely to continue to use Travis CI. In this paper, we focused our analysis on the usage and did not consider the evolution of the usage over time since we only focus on a four months period. It would be interesting to reproduce the experiment of this paper on the data from 2018 to 2019 when Travis CI supports Windows virtual machines.
V Conclusion
In this study, we analyzed the developer’s usages of Travis CI, one of the most popular build system. We collected 35,793,144 Travis CI jobs from 272,917 projects and we observe that Travis CI is more and more popular and developers on GitHub uses it more rapidly. It is as much used by big companies than individual users (40% vs. 60%) that care about the status of their builds. Indeed, 7.34% of the commits that trigger Travis CI changes the build configuration. Testing and building project are still the most popular usages, but new usages such as deploying documentation and websites, code analysis, and formatting start to emerge on Travis CI. And in 2019, developers take only on average 1.37 days to set up Travis CI. It shows that the developers are interested in the automatization systems, and they are using CI for other tasks than pure project testing and building.
Acknowledgments
This work was supported by Fundação para a Ciência e a Tecnologia (FCT), with the reference PTDC/CCI-COM/29300/2017.
References
- [1] M. Fowler and M. Foemmel, “Continuous integration,” Thought-Works) http://www. thoughtworks. com/Continuous Integration. pdf, vol. 122, p. 14, 2006.
- [2] M. Beller and J. Hejderup, “Blockchain-based software engineering,” in Proceedings of the 41th International Conference on Software Engineering: New Ideas and Emerging Results, ser. ICSE-NIER ’19, 2018.
- [3] M. Beller, G. Gousios, and A. Zaidman, “Travistorrent: Synthesizing travis ci and github for full-stack research on continuous integration,” in Proceedings of the 14th International Conference on Mining Software Repositories. IEEE press, 2017, pp. 447–450.
- [4] ——, “Oops, my tests broke the build: An explorative analysis of travis ci with github,” in Proceedings of the 14th International Conference on Mining Software Repositories, ser. MSR ’17. Piscataway, NJ, USA: IEEE Press, 2017, pp. 356–367. [Online]. Available: https://doi.org/10.1109/MSR.2017.62
- [5] M. Hilton, T. Tunnell, K. Huang, D. Marinov, and D. Dig, “Usage, costs, and benefits of continuous integration in open-source projects,” in Proceedings of the 31st IEEE/ACM International Conference on Automated Software Engineering. ACM, 2016, pp. 426–437.
- [6] Y. Zhao, A. Serebrenik, Y. Zhou, V. Filkov, and B. Vasilescu, “The impact of continuous integration on other software development practices: a large-scale empirical study,” IEEE, pp. 60–71, 2017.
- [7] T. Rausch, W. Hummer, P. Leitner, and S. Schulte, “An empirical analysis of build failures in the continuous integration workflows of java-based open-source software,” in Proceedings of the 14th international conference on mining software repositories. IEEE Press, 2017, pp. 345–355.
- [8] D. G. Widder, M. Hilton, C. Kästner, and B. Vasilescu, “I’m leaving you, travis: A continuous integration breakup story,” 2018.