Measuring Irregular Geographic Exposure on the Internet
Abstract.
We examine the extent of needless traffic exposure by the routing infrastructure to nations geographically irrelevant to packet transmission. We quantify what countries are geographically logical to observe on a network path traveling between two nations through the use of convex hulls circumscribing major population centers. We then compare that to the nation states observed in over 2.5 billion measured paths. We examine both the entire geographic topology of the Internet and a subset of the topology that a Tor user would typically interact with. We reveal that 44% of paths concerning the entire geographic topology of the Internet and 33% of paths in the user experience subset unnecessarily expose traffic to at least one nation, but often more. Finally, we consider the scenario where countries exercise both legal and physical control over autonomous systems, gaining access to traffic outside of their geographic borders, but carried by organizations that fall under the AS’s registered country’s legal jurisdiction. At least 49% of paths in both measurements expose traffic to a geographically irrelevant country when considering both the physical and legal countries that a path traverses.
1. Introduction
The Internet is comprised of independent networks called Autonomous Systems (ASes) which depend on each other for inter-network connectivity. Network traffic often traverses multiple ASes in order to reach its final destination. Any adversarial transit AS situated between sender and receiver, termed a path based adversary, can degrade network availability, violate data integrity, and undermine confidentiality. While a single malicious transit AS is a powerful adversary, nation states represent an even stronger path based adversary. A nation state has the ability to exercise control over both ASes that physically operate networking infrastructure within its borders and ASes whose corporate governance falls within the nation state’s legal jurisdiction. A motivated nation state could coerce multiple ASes into acting as colluding path based adversaries on the nation state’s behalf.
Revelations in recent years have demonstrated the extent to which nation states are willing to exert pressure on private entities in an effort to execute national cyber policy on network traffic. For example, the United States, Great Britain, and other members of the so called Five Eyes intelligence alliance have integrated dragnet surveillance into core Internet transit links that reside within their borders (der, 2013; Zetter, 2015; Anderson, 2006). Additionally, there exist recorded instances of censoring nation states applying domestic censorship policies to network traffic that neither originates nor is bound for domestic sources (Zmijewski, 2010; Ereche, 2010).
Due to the potential security concerns exposure to additional nation states might present, it is reasonable to expect that the Internet’s routing infrastructure minimizes such exposures. In scenarios where sender and receiver reside inside the same or adjacent nation states, one would expect that these are the only jurisdictions traffic is exposed to. Even in scenarios where the sender and receiver are located in non-adjacent nations, and exposure to third party nation states is a physical necessity, one might assume that exposure is limited to a minimal set of nations required to build a physical link between sender and receiver. However, routing decisions focus on the logical network topology rather than the geographic or political topology. This can result in paths exposing traffic to nations which do not lie between the geographic locations of the sender and receiver. This excess exposure needlessly increases the power of certain nation states if they elected to coerce ASes into serving as path-based (i.e. on-path) adversaries on their behalf.
In this work, we examine to what extent the Internet’s routing infrastructure increases the capacity of certain nation states to undermine security properties of network traffic in excess of what would be predicted. Specifically, we quantify how often network traffic is exposed to additional nation states beyond those residing along a geographically logical path between sender and receiver. Building the set of geographically logical countries between sender and receiver is done with a novel technique based on computing a population biased convex hull between the sending country and receiving country. We define the set of geographically normal countries providing transit between source and destination to be the set of all countries that lie at least partially in this convex hull. We examine two populations of paths in this work. First, we examine a sample of the entire topology of the Internet, which we term all-to-all. Second, we examine a subset of paths to the Alexa Top 1000 (Ale, 2018) through the Tor browser, which we call our user experience dataset. To explore the physical exposure of data to nation states we compare the countries where network infrastructure observed on the paths is physically located to the set of geographically normal countries we would expect. We also explore what happens when nation states, in addition to taking advantage of physical exposure, exercise control over ASes whose corporate governance operates within their legal jurisdiction, and leverage that pressure to observe all data handled by such ASes, which we term legal exposure.
All together, we examine over 2.5 billion paths from traceroutes conducted by CAIDA’s Ark measurement framework (ark, 2017) and the RIPE Atlas measurement framework (rip, 2018). Overall, we find that 44% of examined all-to-all paths and 37% of the examined user experience paths physically expose traffic to at least one unexpected nation state. Furthermore, we find that the quality of paths varies greatly on a country-to-country basis. As an example, more than half of the countries observed saw unexpected nation states on 80% or more of their inbound paths. Lastly, when we consider the countries that paths both legally and physically traverse, at least 49% of paths in both datasets expose traffic to at least one unexpected nation state.
The remainder of this paper is presented as follows. In Section 2 we will cover relevant background on how logical routing decisions are made, and expand on the motivation for our study. In Section 3 we will present our methodology for collecting paths, labeling countries that the path either physically or legally exposes data to, and lastly how we build a quantifiable measure of what countries are geographically logical to observe between source and destination. In Section 3.5 we will cover the properties of our resultant datasets. Section 4 examines the extent to which nations physically expose their traffic to other countries, along with how often that exposure is geographically illogical. Section 5 expands this analysis to additionally consider exposure to entities that could be legally coerced by a particular country. Section 6 compares our work to similar studies. Lastly we draw our final conclusions in Section 7.
2. Background and Motivation
2.1. Path Selection On the Internet
The Internet is comprised of a collection of independently administered networks called Autonomous Systems, or ASes. ASes provide network connectivity to hosts inside of their network, enabling those hosts to connect to other host located either inside the same AS or in a remote AS. To this end, ASes deploy special purpose networking equipment called routers, whose job it is to compute the best path between data sender and receiver, and forward data to the next hop (router) in that path. In order to compute best paths, routers execute routing protocols, which facilitate the exchange of topology information between routers using that information to compute best paths. Routing protocols do not compute the best path to every individual IP address, rather, routing protocols compute best paths to blocks of IP address, and forward traffic addressed to any host inside that block along the same path. Routing protocols are typically divided into two categories, inter-AS and intra-AS routing protocols. Inter-AS routing protocols compute the sequence of ASes data will travel when moving between remote ASes. Intra-AS routing protocols compute the best path traffic takes inside a given AS. Intra-AS routing protocols are responsible for both getting traffic to a end destination inside the current AS and delivering traffic to a boarder router that will transfer traffic to the next AS along a multi-AS path.
The Border Gateway Protocol (Rekhter et al., 2006), or BGP, is the de-facto standard inter-AS routing protocol. The single standard routing protocol is a result of the demand for interoperability between independently managed organizations that often compete with each other. BGP is a path vector routing protocol with policies. The policy portion of BGP allows network administrators to select paths based on arbitrary criteria, rather than simple the shortest paths. Commonly, ASes utilize their business relationship with neighboring ASes to make a first pass routing decision. ASes that have direct connectivity with each other typically form customer-provider relationships, where the customer pays the provider for all traffic flowing between the two ASes in exchange for connectivity to remote ASes via the provider. ASes will generally follow a routing policy termed “Valley Free Routing”, where they prefer routes that are more economically advantageous, however recent measurement studies have shown that this is not always the case (Anwar et al., 2015).
Because intra-AS decisions only need to be computed over infrastructure held by one organization, removing the demand for interoperability, there are a myriad of intra-AS routing protocols deployed. Examples include link state protocols such as IS-IS (Oran, 1990) and OSPF (Moy, 1998), along with path vector variants such as EIGRP (Savage et al., 2016). Most intra-AS protocols include the ability to include network policy rather than simple network distance as part of the routing decision making process. This policy is often expressed as an “administrative distance” giving the algorithm hints as to the administrator’s preferences.
2.2. Measuring Utilized Paths
Predicting the exact path data will travel between source and destination is challenging. In the case of inter-domain routing, AS relationships are closely held secrets. These relationships can be inferred with some degree of accuracy based on publicly available BGP mirrors, sources of information on the current state of the BGP global routing table. However, as shown most recently by Anwar et. al. (Anwar et al., 2015), using inferred relationships to predict inter-AS routing paths can be inaccurate. Predicting intra-AS routes is even more challenging. First, which intra-AS routing protocol an AS is using is a corporate secret, and difficult to detect. Second, the particular configuration and administrative preferences that factor into the intra-AS routing protocol’s decision making process are difficult to both infer and to use as a predictive model accurately.
An alternative, but more accurate, method for determining the utilized path between hosts is to execute a traceroute (Malkin, 1993) between the two hosts. Traceroute takes advantage of how networking equipment commonly behaves when it encounters a packet with an expired Time-To-Live (TTL) field. Often, but not always, routers will respond with an ICMP message to the sending host, informing the host that the packet expired, and the IP address at which the packet expired. By sending packets with small, but incrementally increasing, TTLs, and recording the IP addresses that respond, a host can map the sequence of routers a packet traverses on its path. While traceroute provides a high level of accuracy, there are several shortcomings. Most obviously, the source must be under the control of the measuring party. To overcome this shortcoming, there are several distributed measurement test-beds that either conduct traceroutes at regular intervals to large portions of the Internet or conduct traceroutes to specified hosts. Examples of such test-beds include CAIDA’s Ark Infrastructure (ark, 2017) and RIPE’s Atlas Infrastructure (rip, 2018). Another major issue with traceroute is that network infrastructure is not obligated to respond when a packet’s TTL expires. In this case gaps in the full path to the host will result.
2.3. Path Based Adversaries
The security properties of many distributed systems can be impacted by the adversarial AS that transits data, what we refer to as a path based adversary. As an example, a path based adversary can trivially violate the confidentiality of any unencrypted traffic. Despite this obvious threat vector, a recent study by the EFF found that only about half of web traffic is actually encrypted (Gebhart, 2017). More complex attacks undermining confidentially are also possible. Consider an AS that wishes to attempt to de-anonymize users of Tor, an anonymous communication system. Feamster and Dingledine (Feamster and Dingledine, 2004) showed that a path based adversary AS could undermine the anonymity properties of the Tor network when when the AS appears on a path between a user and their entry into the Tor network, as well as appearing between their traffic’s exit point from the Tor network and its final destination. The integrity of distributed systems can also be disrupted by adversaries who lie along a utilized path. Apostolaki et. al. (Apostolaki et al., 2016) demonstrated that adversaries capable of observing traffic between 900 IP blocks could control and edit interactions between a majority of the computational power dedicated to mining Bitcoin, opening up the possibility of double spending via forced forking of the blockchain. Additionally, in 2014 attackers utilized compromised BGP speakers in an effort to hijack communications between Bitcoin miners and their pool servers (Greenberg, 2014), resulting in the theft of Bitcoins.
There exist both academic studies and real world examples of adversaries that can control multiple ASes, becoming exceptionally wide reaching path based adversaries. Johnson et. al. (Johnson et al., 2013) first expanded the AS level Tor adversarial model to include such powerful adversaries when they explored the capacity of Internet Exchange Points to de-anonymize Tor users. Revelations from whistle blowers including both the Snowden leaks (der, 2013) and earlier revelations by the AT&T contractor Mark Klein (Anderson, 2006; Zetter, 2015) demonstrated the willingness of the NSA and other spy agencies such as GCHQ to integrate surveillance devices, and even systems which actively inject data into network streams, inside core network infrastructure located within their respective nations. In addition to the attacks outlined above, documents have revealed a complex infrastructure for violating user confidentiality by building relationship graphs based solely on linking data senders and receivers. Furthermore, there exists evidence of censoring nation states, for example China, either accidentally or intentionally applying censorship policies to traffic that neither originates in nor is bound to domestic hosts (Zmijewski, 2010; Ereche, 2010).
2.4. Motivation
From a security perspective, exposing traffic to any unnecessary nation is potentially problematic since it grants the opportunity for those nations to act as path based adversaries. Examples of potential malicious activity includes more than the aforementioned areas of recent work. More broadly, it includes dropping the data, eavesdropping on the data, and even changing the contents of the data, thus removing any expectation of data integrity. While exposure to some nations is unavoidable, any traffic exposed to extraneous nations, i.e. nations not physically necessary for the propagation of traffic, needlessly increases the aforementioned security risks. Our goal in this paper is to algorithmically measure the fraction of paths that expose network traffic to nations that are geographically illogical, and to quantify how much extraneous traffic a nation state gets to observe and control from these geographically illogical paths. Geographically illogical paths occur both under physical and legal conditions.
There are two scenarios in which data can fall under the legal jurisdiction of a nation. The first, scenario is when the data is handled by networking equipment physically located in the borders of a nation during transit. The second, less obvious scenario, is when data ”legally” transits a nation. In this scenario a nation may have legal jurisdiction of data that does not physically transit a country due to an AS being legally registered in one nation while having physical infrastructure in another. This scenario is of particular interest as of late with the passing of the CLOUD Act in the United States stating that the United States may, in some scenarios, have access to data that is physically stored in other countries but under legal jurisdiction of the United States (Edmonds, 2018). This legal vs. physical router presence motivates our work beyond purely adversarial tampering, particularly from a policy perspective. The ideal geographic situation for data traveling from nation A to nation B is a path that consistently moves towards nation B. In other words, we would logically expect the geographic network level paths between two nations to approximately, but not exactly, traverse the shortest path between those nations. While this definition is simplistic, it does highlight certain path selection choices that are illogical from a geographic standpoint. For example, a path that goes the opposite direction that its destination should be considered illogical. Additionally, data with a destination that lies within the same nation it originated from should almost never leave that nation.
3. Experimental Methodology
In order to quantify the amount of geographically illogical paths and which countries can exert additional control over network traffic we need to build two datasets. First, we must establish a set of countries that we would expect traffic to be logically exposed to during transit between a particular source/destination pair based on geographic realities. We term countries inside of this set geographically normal for a given source and destination. Second, we must establish the actual paths data takes from sources to destinations and establish which countries the network traffic is exposed to. We compute both which countries physically host the network infrastructure traveled, termed physical exposure, and which countries can exert legal pressure on the ASes appearing along the path, termed legal exposure. By comparing the set of countries a path exposes network traffic to with the set of geographically normal countries, we can label the path as either normal, no excess exposure, or non-normal, containing geographically illogical countries. We can also quantify the number of times a country is a benefactor of a non-normal path: specifically the number of additional paths it can observe as the result of geographically irregular paths.
3.1. Geographically Logical Paths
Defining the geographically normal countries for a source and destination pair was done using a novel technique based on convex hulls. The convex hull of a set of points in dimensions is the intersection of all convex sets containing . For points the convex hull is then given by the expression:
| (1) |
A more intuitive way to think about the definition of a convex hull: given a set of points, imagine the shape a stretched rubber band takes when encompassing all of them.
Using Equation 1, we can build convex hulls containing both the set of points that define the country containing the source and a set of points that define the country containing the destination. These convex hulls are computed taking the spherical nature of the Earth into account. Note that when a country is the source and destination of network traffic, we only consider that country as normal and do not build a convex hull for the single country. This convex hull construction efficiently defines all points that lie between source and destination countries. Source and destination were considered at the granularity of nation states to mitigate limitations in the accuracy of GeoIP location usage later. It should be noted that this coarser granularity only increases the number of countries considered geographically normal, thus providing an estimate of geographically normal that tends towards logical over illogical. We then compute the set of geographically normal countries by finding all countries that either fully or partially fall within this convex hull. In order to detect countries that reside inside the convex hull, we test if any of the 15 largest cities in the given country resides inside the convex hull. To detect countries that lie only partially inside of the convex hull, we test if any point along the edge of the convex hull lies inside the borders of a particular country. We consider the entire country to be geographically normal if any of the 15 largest cities inside of a country or the border of a country lies within the defined convex hull.
One option for defining the set of points that make up a country is to utilize the nation’s political borders, provided in the Matic shapefile dataset (sha, 2018). In order to test this approach, we utilized shapefiles which contain points that define polygons of the actual borders of each country. This approach tends to result in convex hulls between two nations that contain countries which do not lie in the path between those nations. One factor contributing to this is countries with non-contiguous territories or remote territorial holdings. An example of this is the United State’s convex hull when including Alaska, Hawaii, Puerto Rico, Guam, and other remote territories, as the resulting convex hull covered roughly one quarter of the earth’s total surface area. Additionally, the political borders of a country do not necessarily reflect where bulk the Internet infrastructure of the country is located; as this generally lies in the more populated areas. Relevant examples of this include China and Russia. To address, this we built a separate definition of points describing a country using the latitude and longitude of the top 15 most populous cities in that country (pop, 2018).
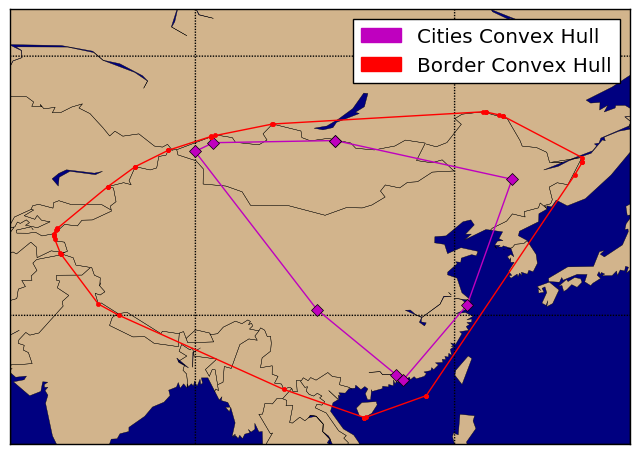
Figure 1 shows an example of the two construction techniques for a selected path between China and Mongolia. The population-based convex hull results in a stricter version of geographically normal between two countries and accurately reflects the fact that 83% of China’s population, including all of its major cities, reside in the eastern portion of the country. The border based convex hull includes countries in the wrong cardinal direction, such as India and Vietnam, a result of China’s concave shape. We chose to use the city or population based construction of a convex hull for the measurements contained inside this work. When a country is both the source and destination of traffic we consider traffic not normal if any other country is found on the path from source to destination.
3.2. Building Path Datasets
Our goal is to measure the physical and legal exposure of paths on the Internet. Ultimately, we do this from two perspectives: an all-to-all perspective and a user experience perspective. In measuring the exposure of paths from an all-to-all perspective, we attempt to gain insight into the entire geographic topology of the Internet. We realize, however, that many users only interact with a subset of the entire topology due to content being cached at CDNs that are geographically local to the end user. Therefore, it is important to separate and compare these two perspectives to understand the similarities and differences between the geographic topology that a user sees and what is actually available. We take advantage of two commonly used traceroute frameworks to obtain a statistically significant sample size for each perspective.
3.2.1. All-To-All Path Set
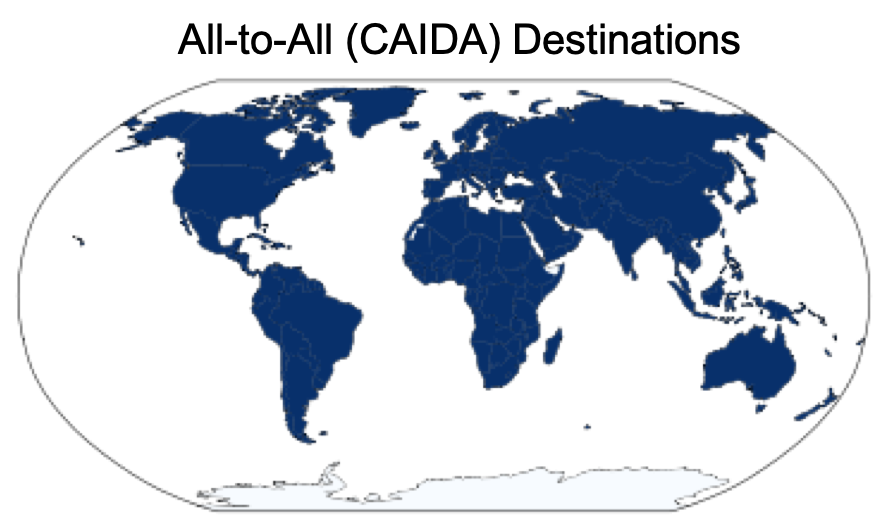
First, we leverage CAIDAs Archipelago Measurement Infrastructure (ARK) (ark, 2017). ARK allows us to measure the entire geographic topology of the Internet. Comprised of over 180 monitors, ARK coordinators monitors which work in teams to send traceroutes to a random IP address in each block of globally addressable IPs 111Specifically, each announced /24 prefix. Note that this does not imply that each monitor probes every announced prefix every 48 hours, but that a single destination prefix will be probed by one monitor each cycle. There are two important features that make this measurement system the best for measuring the geographic topology of the Internet as a whole. First, it provides a uniform sample across the set of possible destinations by probing each announced /24 prefix. Second, it gives us both a geographically and legally diverse monitor set to probe from. The ARK measurement system has probes in over 160 ASNs and 64 unique countries. Figure 3 shows CAIDA monitors located on every major continent.
3.2.2. User Experience Path Set
The majority of (source, destination) pairs on the Internet are not selected in an ”all-to-all” fashion. Users typically access content cached in Content Distribution Networks, or CDNs (Labovitz et al., 2010). CDNs replicate content, storing content on several servers scattered across the Internet. When users attempt to access content stored in a CDN, they are typically directed to the CDN server that is closest to them in terms of the network topology. This has two impacts on the paths user data typically travels over. First, in general we expect paths from users to the CDN nodes serving them to be shorter than the average path length on the Internet, due to the emphasis on content locality. Second, two users accessing the same piece of content might fetch it from different servers, depending on where the users are located. In order to build an accurate model of paths users take to popular content, we need to establish what servers users in a particular network connect to when accessing web content and what the path that specific user would take to those servers.
We visited the Alexa Top 1000 (Ale, 2018) from a collection of geographically distributed vantage points to measure what IP addresses are accessed when users load popular web content. We then recorded the remote hosts connected to in the process of fetching the content. Websites were loaded using a full version of the Chrome browser, driven by automation provided by the Selenium (Sel, 2018) framework. It is vital that websites be fetched using a full browser, rather than simply using DNS resolution of the domain or wget, as a large fraction of the content on websites is loaded only when the CSS and Javascript on a page are processed by a browser rendering engine. The page loads are repeated from a geographically diverse collection of locations because the location a server’s content is fetched from for a particular user vary based on the user’s location, recall the note on CDN locality.
Page loads were conducted through the Tor Network (Dingledine et al., 2004), an anonymous communication tool, which has open proxies scattered around the globe. We use Tor because one of our primary motivations is to understand how users could be affected by censorship from Geographically-Illogical paths. Since Tor is the de facto Censorship-resistant browser, we chose this as our HTTP proxy for Selenium. All DNS resolutions during this data gathering phase were conducted through available public Tor proxies to ensure that our crawler was pointed to the resources that were appropriate for the location of the Tor proxy. To ensure that the Tor browser was not hitting CAPTCA pages and in fact loading all homepage content, we conducted an analysis of the page content through Tor. We found when using a standard web framework analysis tool, Wappalyzer (Wap, 2019), that only 34 of the top 1000 sites contained reCAPTCHA scripts on their homepages. While these reCAPTCHA versions may not have blocked the content in our measurement, we point out that this content was only detected in 3.4% of the top 1000 pages.
We take advantage of the RIPE Atlas (rip, 2018) measurement ecosystem to measure the path a user’s communication would travel to and from these servers. RIPE Atlas allows network operators to conduct measurements to user defined IP addresses from a set of geographically distributed probes. During our crawling of the Alexa Top 1000, we only selected Tor proxies that were located in the same AS/country pair as at least one RIPE Atlas node. For each crawl of the Alexa Top 1000, we conducted traceroutes from the RIPE Atlas probes to all IP addresses observed during page loads conducted from that particular AS/country pair. This set of traceroutes is our ”User Experience” dataset.
3.3. Computing Exposure
The datasets built in the prior section provide us two collections of traceroutes representative of particular populations of paths found on the Internet. We must map each IP address found in these paths to the countries that the data is physically and legally exposed to during transit in order to establish if these paths expose traffic to extraneous countries.
3.3.1. Computing Physical Exposure
Computing physical exposure of a traceroute involves mapping each IP address in the traceroute back to the country it is physically located in. We must use one of many IP geolocation services that exist to solve this problem. There are multiple issues with these services. First, many are not free, or free at scale, so any IP queries to them must be carefully spent. Second, while the services are historically good at geolocating end hosts (at a country granularity), they have been known to be less precise when attempting to geolocate routers (Gharaibeh et al., 2017). We chose to use NetAcuity to geolocate our IP addresses, as research has recently shown them to be best at geolocating routers (dig, 2019). We do not consider the goelocation of any IP address at a resolution finer than the country level to limit the effects of IP geolocation on our results.
3.3.2. Computing Legal Exposure
Computing the legal exposure of a tracreoute is a more exact science. We map each IP address in the path back to the AS who owns the IP address by consulting snapshots of BGP routing tables from RouteViews (RouteViews, 2018). More specifically, we determine the AS who owns an IP address by examining who originated the path for the block of the IP addresses on the day the traceroute was conducted. We then map the AS to its legal jurisdiction with country data from the IANA registry (ian, 2018).


3.4. Common Processing Pipeline
We built a common pipeline to process each traceroute from the all-to-all and user experience datasets using the information gathered from Section 3.3. Due to the monetary cost of geolocating IP addresses, we have carefully chosen how we have spent our queries to NetAcuity. Specifically, we geolocate every router found in the CAIDA traceroutes. Note that this does not mean we have geolocated every router on the Internet, but only the ones seen in the CAIDA traceroutes. Furthermore, we have geolocated every IP address found in the RIPE Atlas traceroutes. Due to CAIDAs measurement process and the monetary costs of geolocating large amounts of IP addresses, we were not able to geolocate every destination where CAIDA targeted a traceroute. Instead, we have geolocated a single IP address in every /26 we saw a traceroute to in CAIDAs measurements. This allows us to lookup IP addresses we do not have specific geolocation for using a longest matching prefix structure.
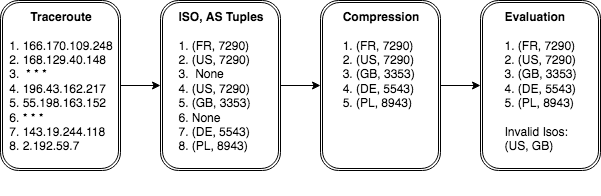
Processing a traceroute, visualized in Figure 4, involves converting an IP level path into an aggregate path of (mapped country, AS tuples). When building this new path, we do not add any hops from the original traceroute measurement where we do not know the AS or country that the IP address belongs to, nor do we include hops which do not respond with an ICMP message to the traceroute. This implies that our measurements and resulting analysis are a lower bound on the countries and ASes that the path exposes traffic to. This is critical to understanding that the raw exposure we will soon present could potentially be worse in practice. Next, We compress repeated instances of the same tuple down to a single instance. Finally, we label paths as either geographically normal or “non-normal” based on sets of expected countries to appear on the path constructed in Section 3.1.
3.5. Dataset Overview
| Measurement Framework | CAIDA | RIPE Atlas |
|---|---|---|
| Measurement Goal | All-To-All Topology | User Experience |
| # of Vantage Points | 174 | 76 |
| # of ASes with Vantage Point(s) | 148 | 76 |
| # of Countries with Vantage Point(s) | 52 | 30 |
| # of Destination Countries Seen | 240 | 64 |
| # of Paths Examined | 2,513,603,233 | 81,288 |
| Global Physical DoN | 0.565 | 0.632 |
| Global Legal DoN | 0.712 | 0.675 |
All together, we examined over 2.5 billion paths from both a physical and legal standpoint using our convex-hull definitions of normal. The examined CAIDA traceroutes were conducted between the dates January 1, 2018 and May 1, 2018. The examined RIPE Atlas traceroutes were conducted in February and March of 2018. We start our examination by looking at a general overview of the number and type of results we have obtained. Table 1 gives a brief overview of the quantity and type of measurements conducted. We see immediately that we have an incredibly large number of paths for our all-to-all topology measurement and a lesser number of paths for our user experience topology measurement. This is simply due to the nature of the measurement systems: CAIDA provides free traceroutes for us to use while the RIPE Atlas ”on demand” system means we have to choose traceroutes wisely based on credits available and responsive probes.
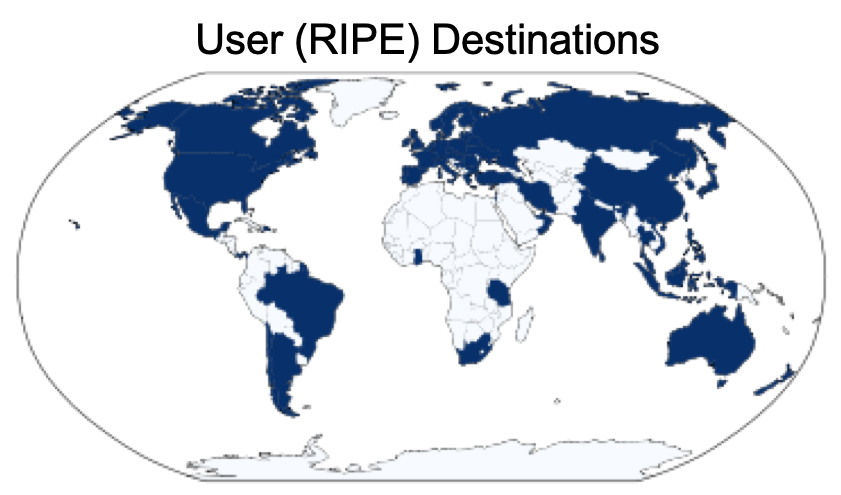
CAIDA’s measurement infrastructure conducts a traceroute to every announced /24 on the Internet, meaning we expect to see every country represented on this list, as there is some amount of Internet infrastructure in every nation. On the other hand, our measurements from RIPE Atlas were specifically to Alexa Top 1000 websites, which are expected to be hosted closer to the majority of end users via CDNs, resulting in a concentration of these destinations in nations with more Internet users. Figure 6 shows that we still see destinations on every major continent in the RIPE measurement data, but not every country.
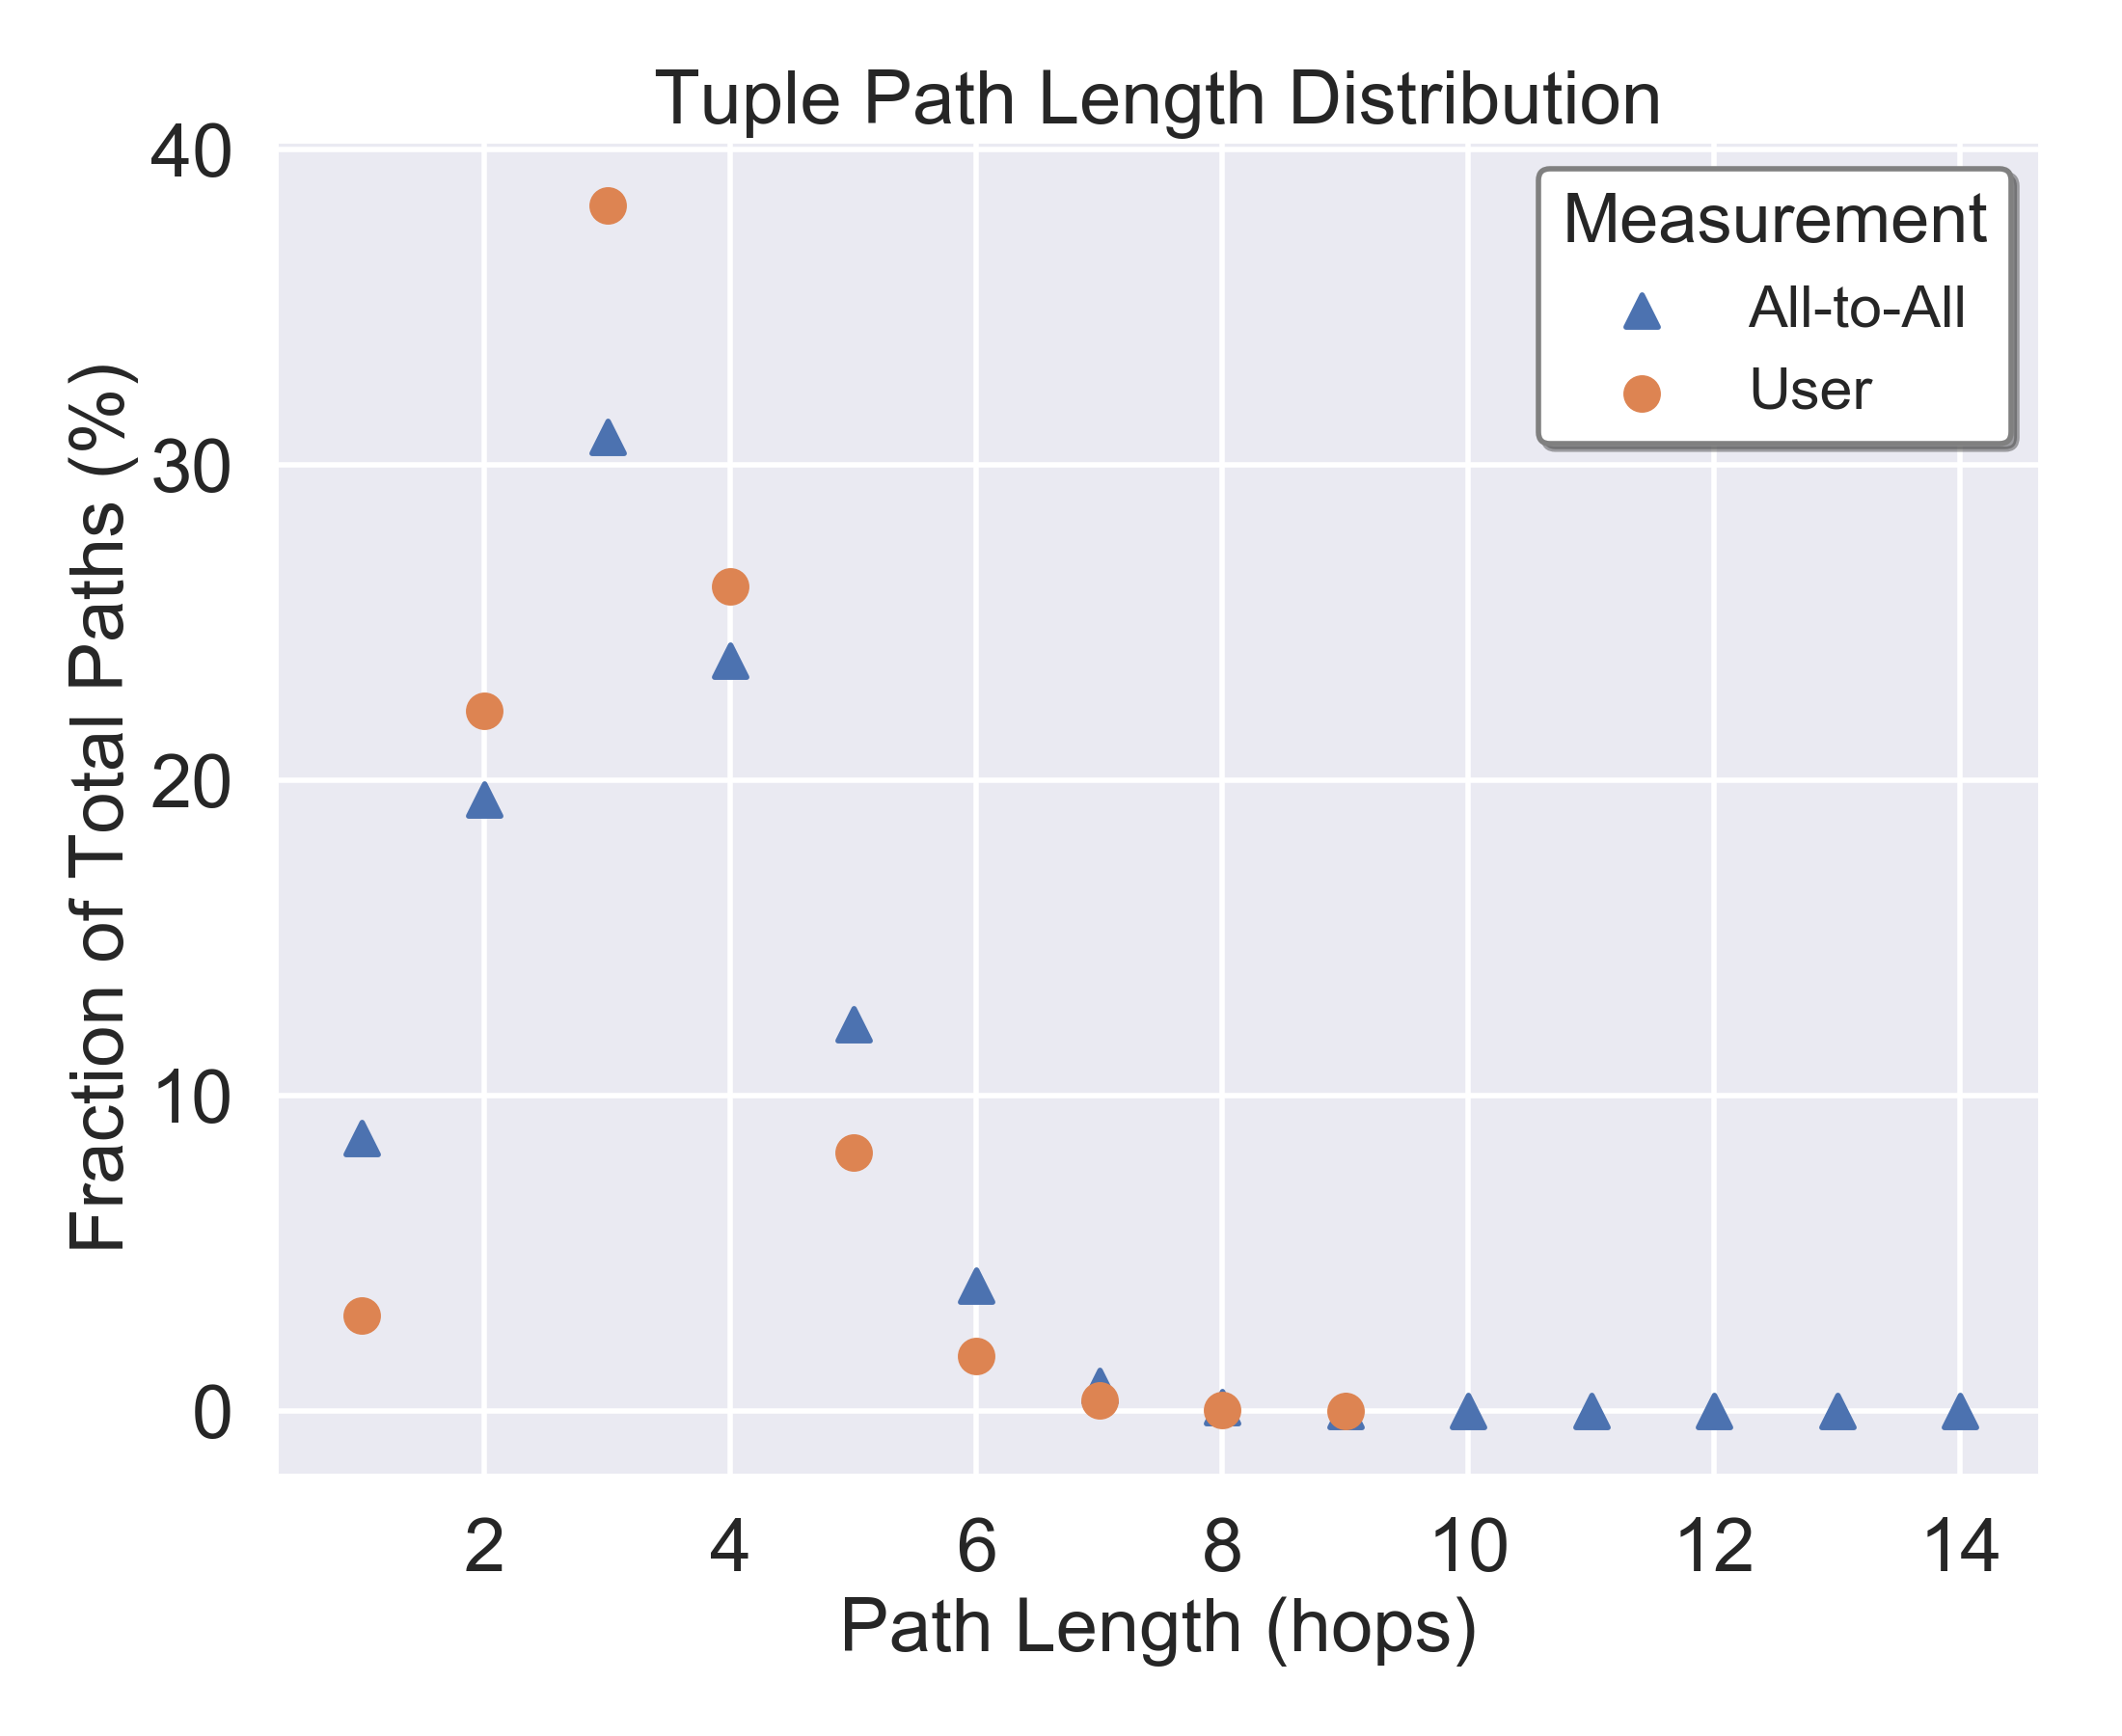
On average, we see that paths to CDNs are slightly shorter in terms of AS/country pairs than paths in our all-to-all dataset, as seen in Figure 8. This trend is slightly less assertive in Figure 8 where we see that at an AS level, the distribution of all-to-all measurements and user experience measurements are relatively close to each other.

For the rest of the paper, we consider the datasets on the following levels: a country level, a regional level, and case studies of particularly interesting countries. Section 4 examines traffic exposure to different entities at a physical level: what countries the packets actually land in. Section 5 then examines traffic exposure to different countries from a legal standpoint: where countries may have access to data that is not physically traversing them but through legal jurisdiction may have some access to the data.
4. Physical Exposure
We want to quantify the amount of needless geographic exposure from one entity to another. As a metric of normalcy, we have defined the degree of normality (DoN) between a particular source and destination as:
| (2) |
In this Section we consider only physical exposure of traffic, in Section 5 we explore what occurs when we additionally consider legal pressure nation states can exert. The global physical DoN for the entire population of CAIDA or All-to-All measured paths is 0.565. The global physical DoN for the entire population of RIPE Atlas or User Experienced paths is 0.632, a roughly 11.9% increase.
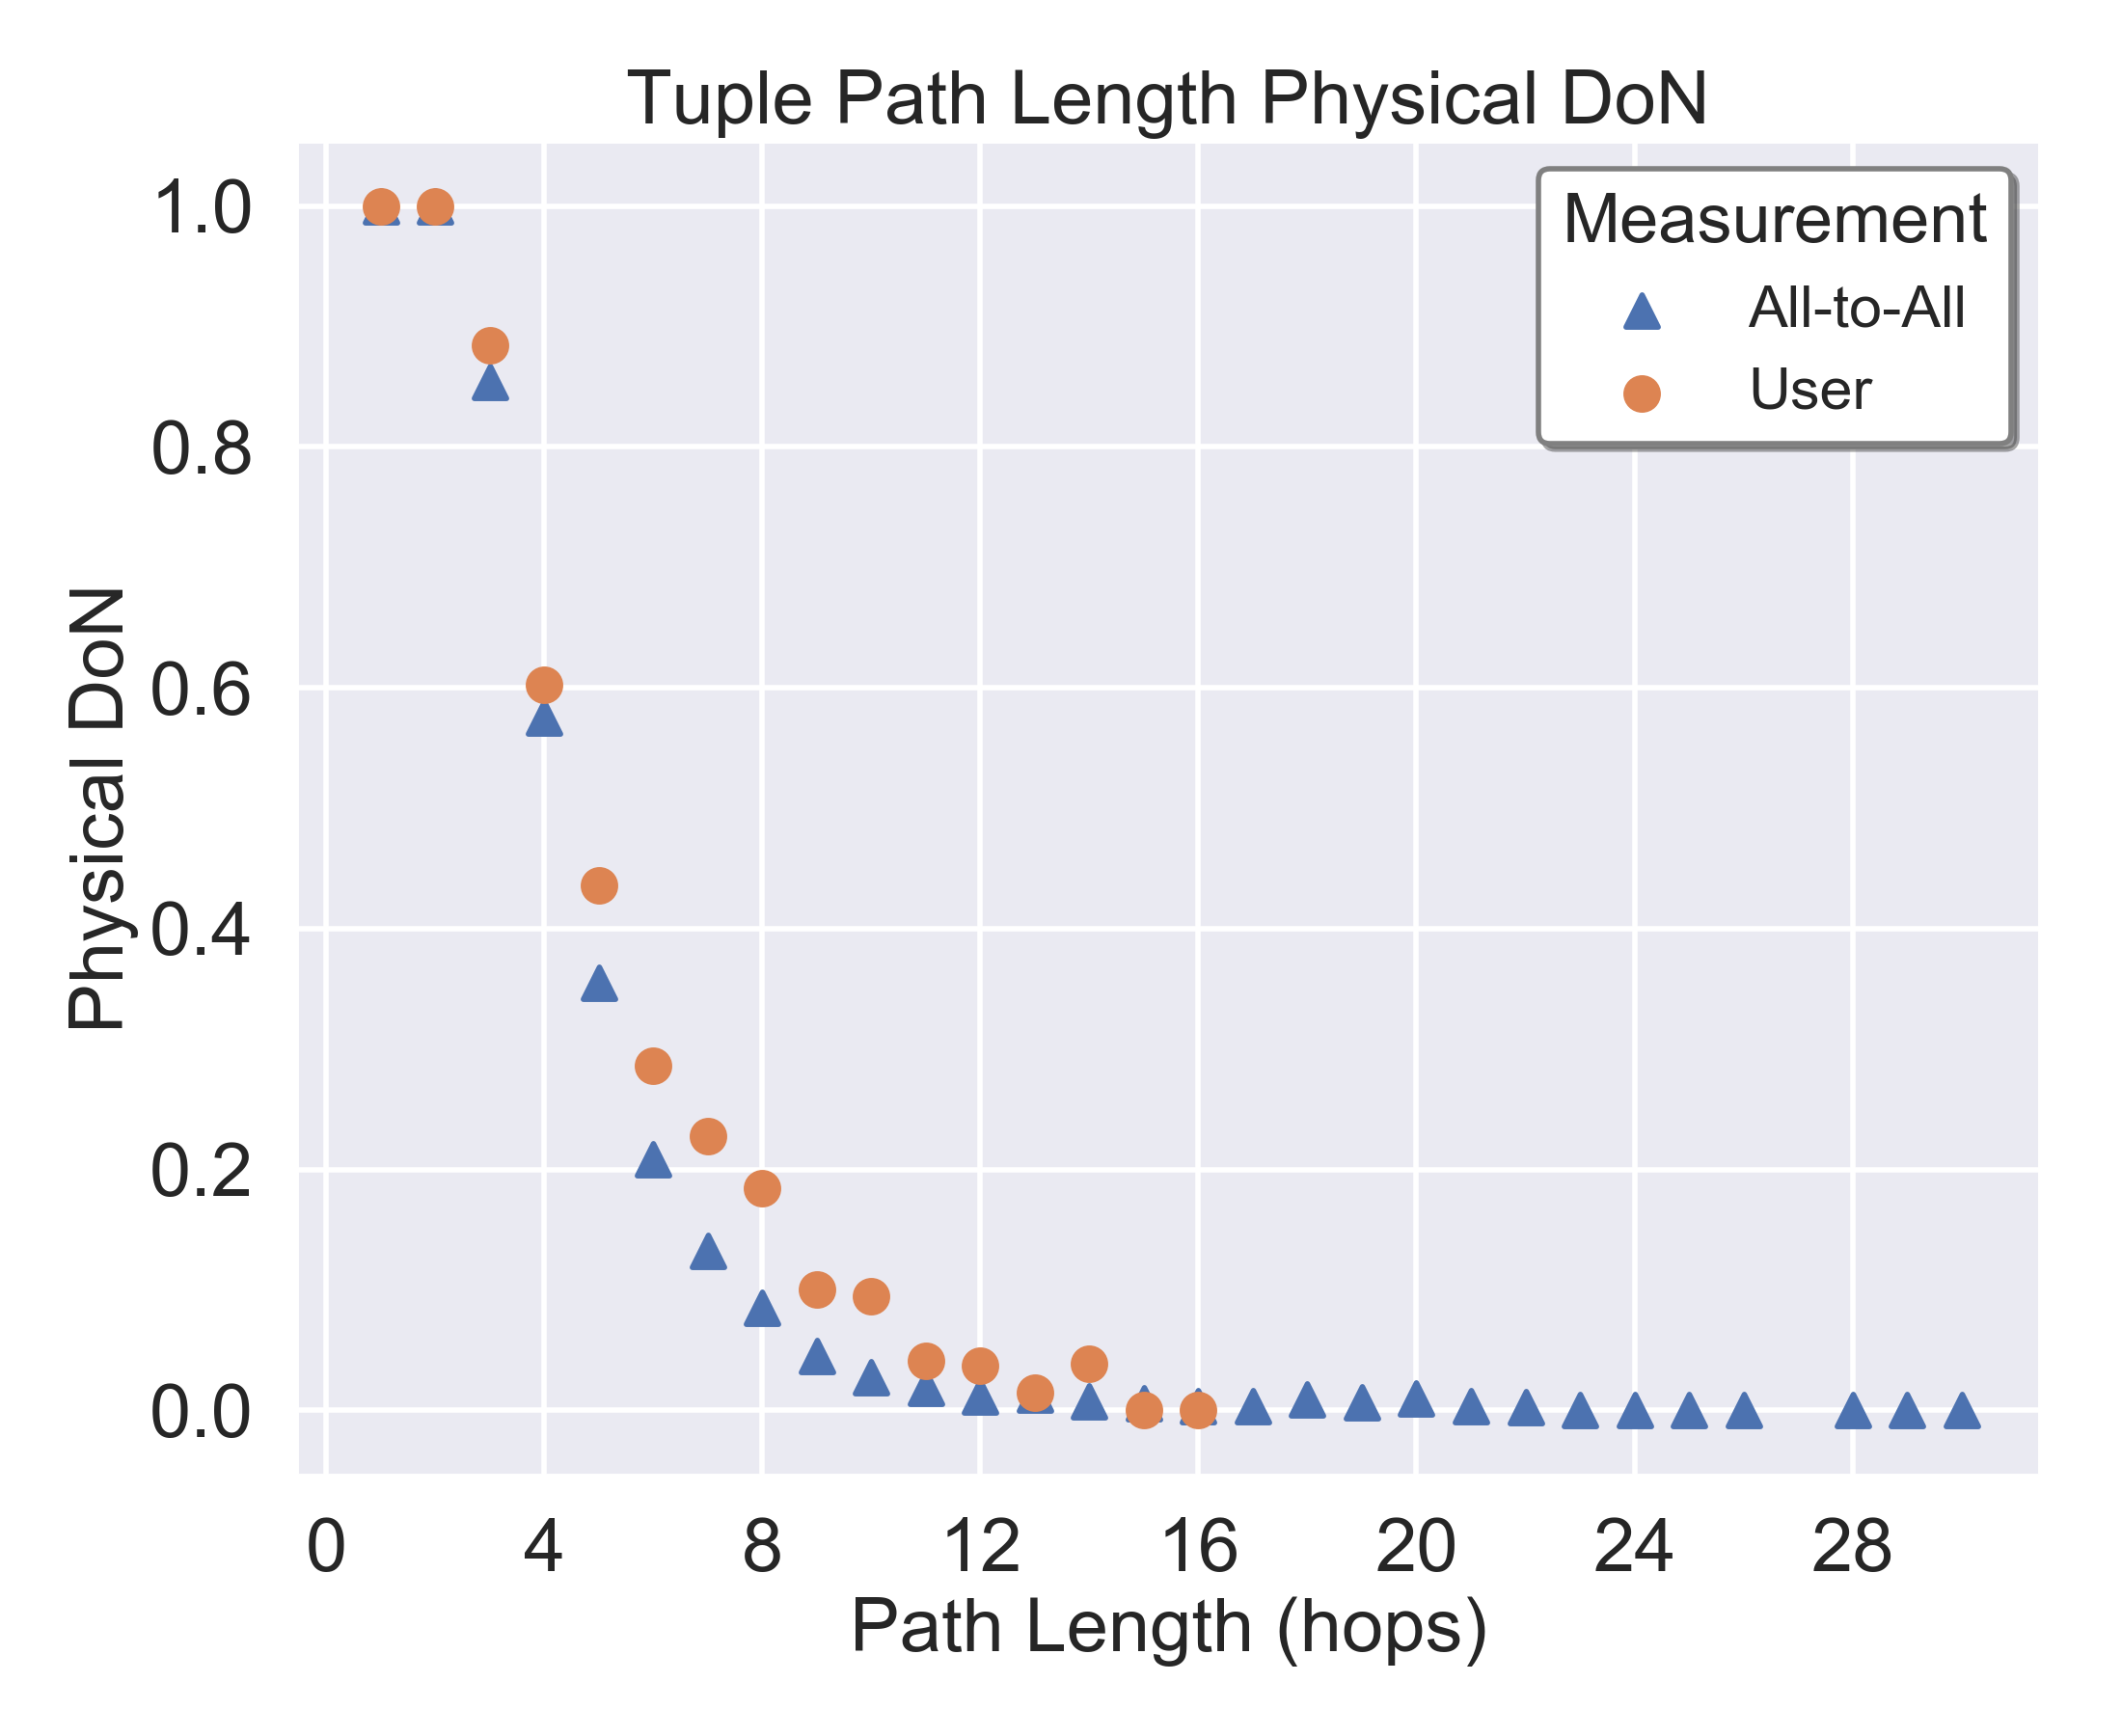
We start our investigation of DoN by looking at the entirety of the measurements from a few different angles. First, we examine DoN given the length of the compressed AS, country tuple path. Figure 9 shows that as the number of hops in the path increases, the the DoN continually degrades. Only paths with less than 5 hops have a DoN above the global average for both all-to-all and user measurements, with DoN dropping below 0.2 when there are 8 or more AS, country hops in the paths. We also see that the longest path in the RIPE Atlas measurements is 16 hops, though we see paths of up to length 30 in the examined CAIDA traceroutes.
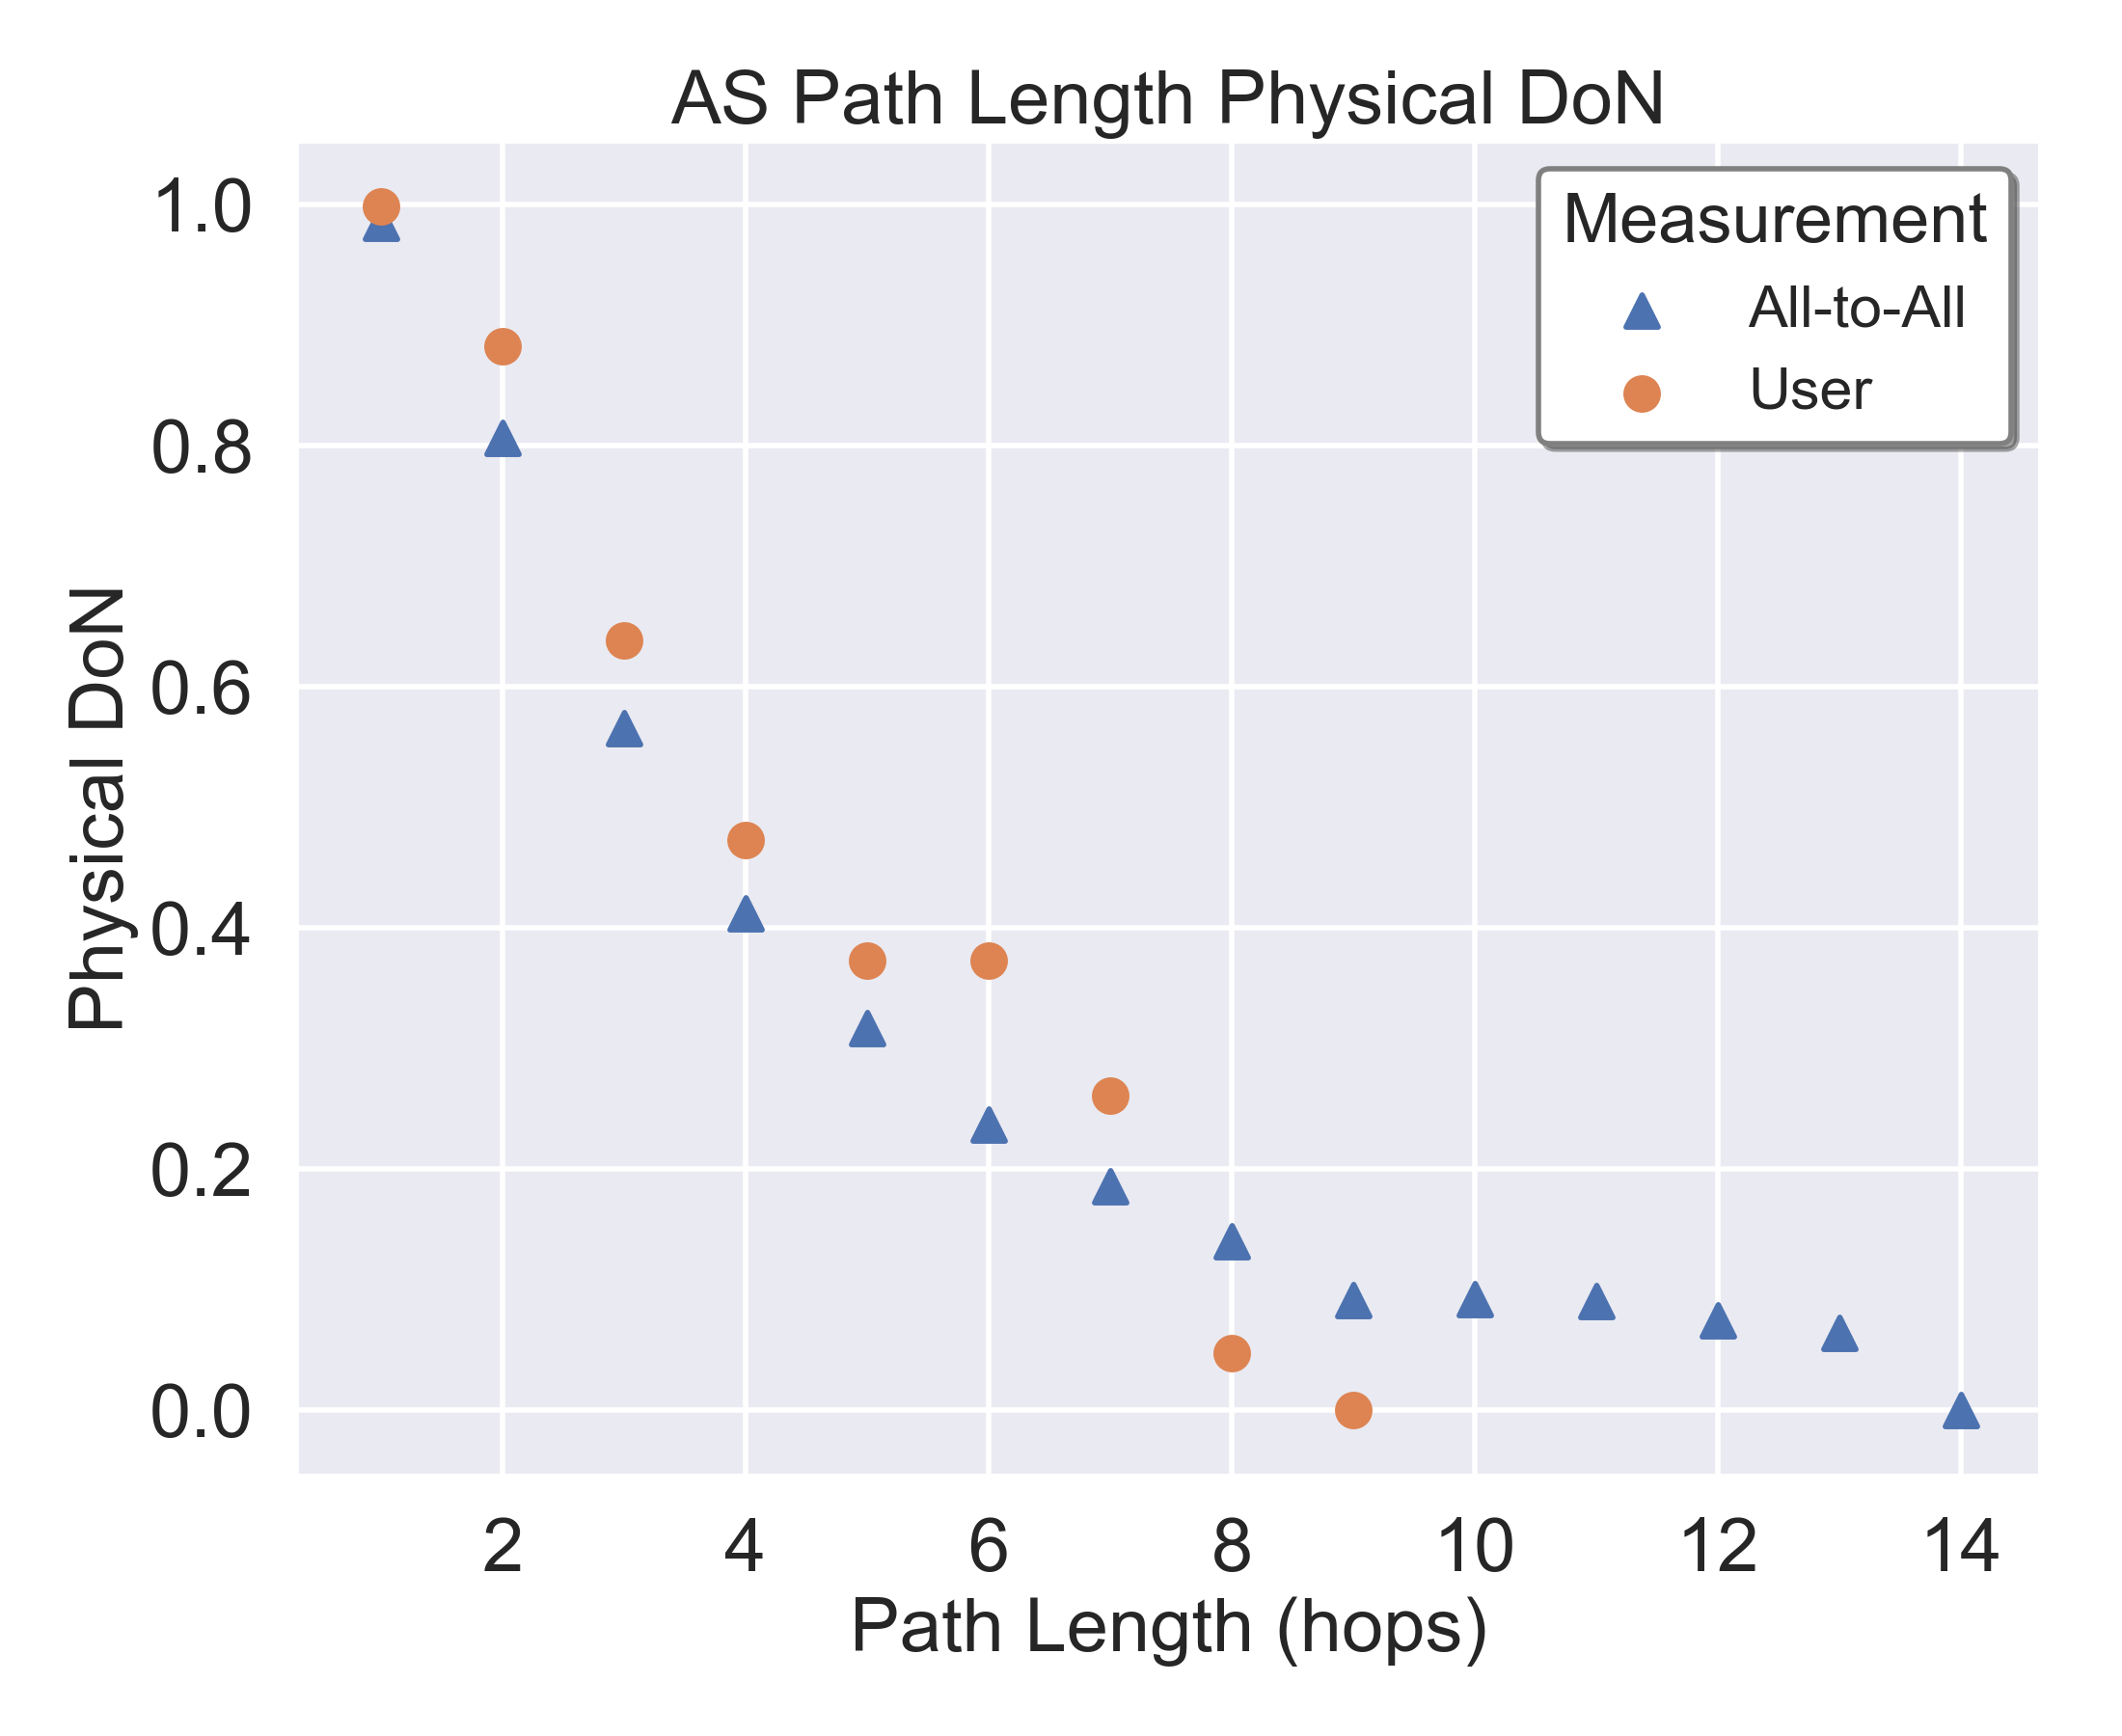
Beyond looking at just the raw number of AS, Country tuple hops in the path, we investigated the DoN as the number of ASes involved grows. Figure 9b shows that similar results as the tuple length DoN. As the path grows longer in the number of ASes that carry the traffic, the less likely it is to be normal. Paths that contain more than 3 ASes in them have a DoN of below the global average for both datasets.
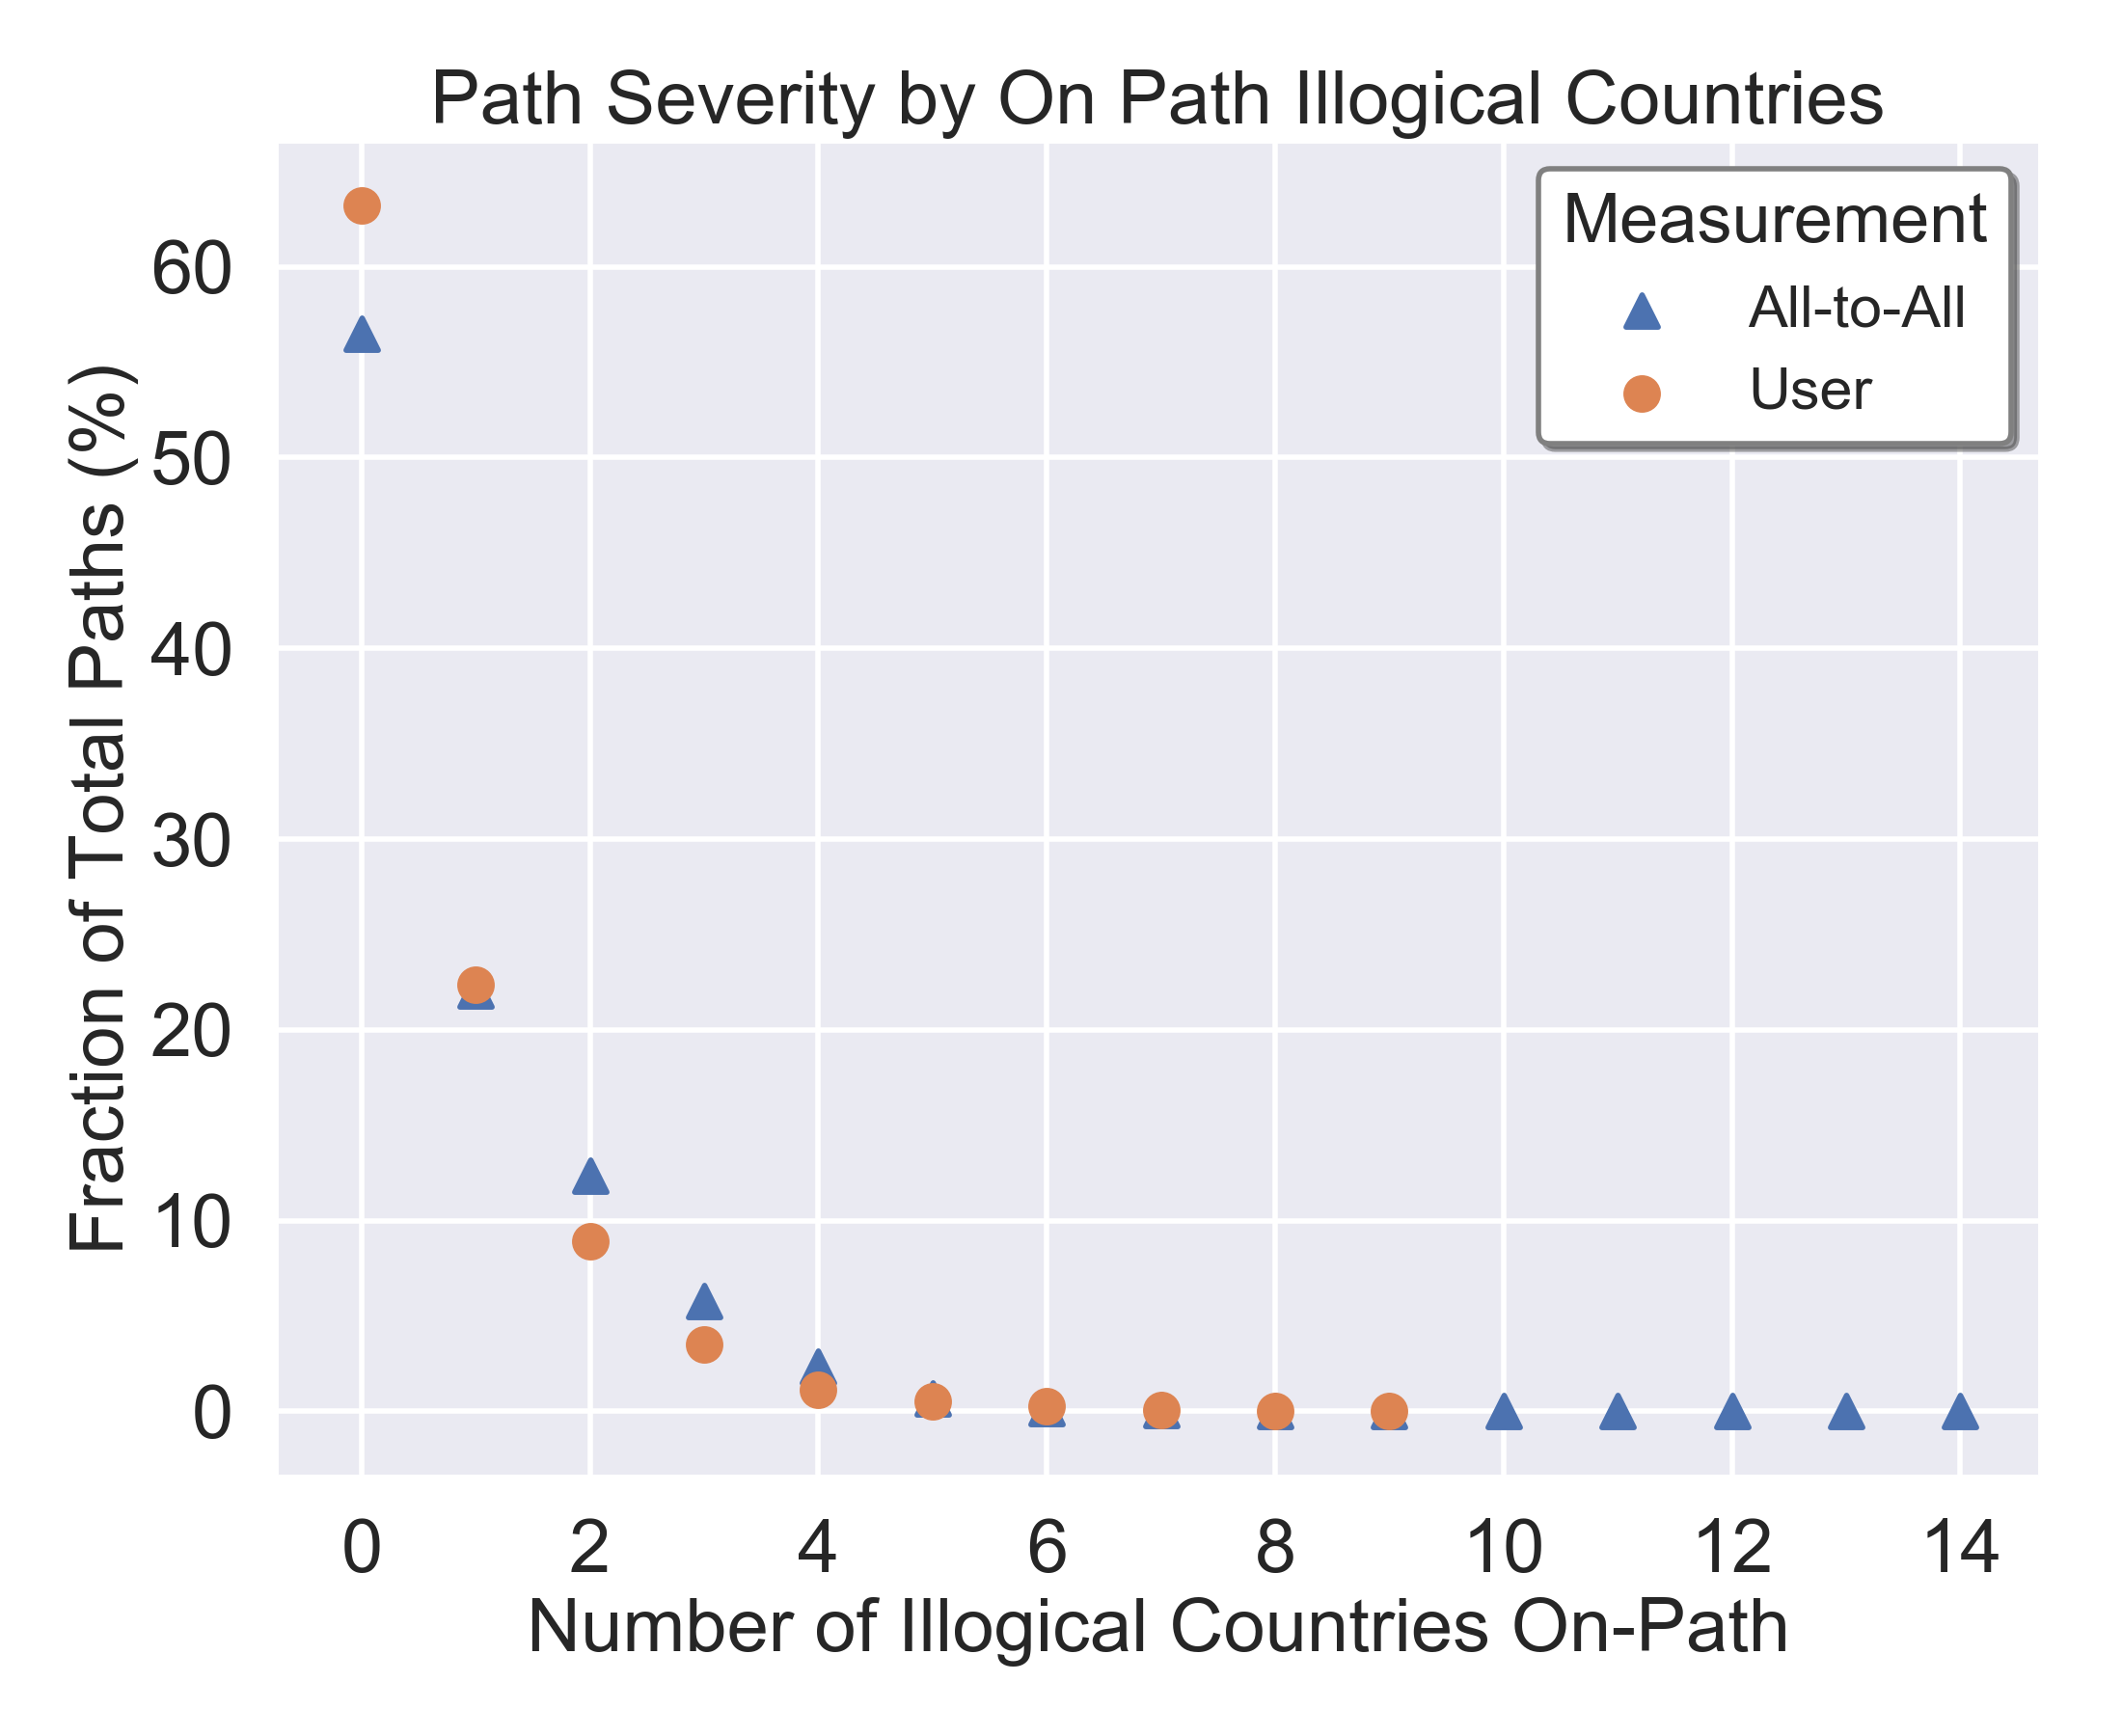
Lastly, Figure 9c gives us insight into the number of geographically illogical countries appearing on each wrong path that was observed. We term any country that is not geographically normal between sender and receiver, but appears in a transit capacity along the path a benefactor. We see that the majority of paths expose data to one or two benefactors. However, roughly a quarter of paths expose to traffic to 3 or more benefactors. Keep in mind that this is only one possible metric of path error severity. One might also wish to consider “intangibles” related to the relationship between, source, destination, and benefactor nations. For instance, one country may want to avoid exposing internet traffic to specific countries for political reasons. Another potential metric for path error severity is distance from the built convex hull.
We split the rest of our examination of DoN into two levels: country and regional. Additionally, we split scenarios for each of the two entities based on the role of the entity in the path: the data source, the destination, or neither the source nor destination (a transit entity).
4.1. Country DoN
DoN gives us the ability to examine how normal a population of paths is. Here we examine the DoN at a country level. Figures 11 and 11 shows CDFs of the DoN of countries given their role in a path. Immediately, we see that the DoN for each role in the path generally follows the same curve, but is shifted left. Particularly interesting is that in both datasets transit DoN is by far the worst, while source DoN is better in every case. We see certain instances of a DoN of 0.00 or 1.00 in our RIPE measurements, these outliers are the result of exceptionally small numbers of observed paths involving the country in question.


While the global DoN for both measurements is above 0.500, we can see from the CDF that this average is biased by a minority of countries, most notably the United States, which appears both as the both the source and destination of a large portion of its traffic. Only roughly a quarter of countries have at or above the global DoN average.
Expanding our examination into country DoN, we look into what countries serve as a transit provider for the most paths in our dataset, and how often such paths are geographically logical. Tables 7 and 7 show the massive percentage of traffic that the United States transits in both of our datasets. The United States appears on more than half of paths as a transit provider, yet belongs on less than half of them. Also of particular interest is that Germany transits twice the percentage of traffic in the user measurements as it does in the all-to-all measurement, but also its transit DoN is also doubled when considering the user measurement. In fact, many of the European countries that transit the most traffic have significantly better transit DoNs in the user measurement than in the all-to-all measurement, reflecting the ability of CDNs to direct users to local copies of content, and as a side benefit cut down on needless exposure.
| Country | Ratio of All Paths Transited | Transit DoN |
|---|---|---|
| US | 0.537 | 0.480 |
| GB | 0.233 | 0.125 |
| FR | 0.112 | 0.141 |
| DE | 0.104 | 0.234 |
| NL | 0.091 | 0.265 |
| ES | 0.0791 | 0.077 |
| CA | 0.075 | 0.455 |
| HK | 0.053 | 0.053 |
| ZA | 0.039 | 0.087 |
| SG | 0.0388 | 0.130 |
| Country | Ratio of All Paths Transited | Transit DoN |
|---|---|---|
| US | 0.365 | 0.449 |
| DE | 0.234 | 0.493 |
| GB | 0.207 | 0.301 |
| NL | 0.164 | 0.438 |
| FR | 0.131 | 0.441 |
| RU | 0.117 | 0.565 |
| SE | 0.069 | 0.274 |
| CA | 0.065 | 0.335 |
| ES | 0.062 | 0.046 |
| HK | 0.043 | 0.167 |
| Country | Transit Only / Total Paths | Transit Only DoN |
| GB | 0.204 | 0.064 |
| US | 0.136 | 0.096 |
| FR | 0.092 | 0.092 |
| DE | 0.087 | 0.169 |
| NL | 0.069 | 0.160 |
| ES | 0.063 | 0.042 |
| HK | 0.050 | 0.034 |
| JP | 0.024 | 0.050 |
| KE | 0.023 | 0.101 |
| CA | 0.022 | 0.021 |
| Country | Transit Only / Total Paths | Transit Only DoN |
| GB | 0.179 | 0.244 |
| DE | 0.120 | 0.323 |
| US | 0.090 | 0.083 |
| NL | 0.079 | 0.279 |
| FR | 0.060 | 0.310 |
| ES | 0.059 | 0.029 |
| SE | 0.054 | 0.254 |
| CA | 0.042 | 0.065 |
| NO | 0.021 | 0.382 |
| HK | 0.020 | 0.002 |
| Country | # Paths Benefited From |
|---|---|
| GB | 457,562,290 |
| US | 276,827,580 |
| FR | 157,935,629 |
| DE | 150,325,940 |
| NL | 136,078,286 |
| ES | 134,843,093 |
| HK | 117,614,775 |
| CA | 48,765,568 |
| JP | 47,694,457 |
| KE | 39,932,587 |
| Country | # Paths Benefited From |
| GB | 9,288 |
| US | 6,488 |
| ES | 4,242 |
| DE | 3,793 |
| NL | 3,580 |
| CA | 2,915 |
| SE | 2,615 |
| FR | 2,204 |
| HK | 1,591 |
| JP | 1,156 |
While looking at the magnitude of traffic each nation transits and its transit DoN is important, we realize that transit DoN can be inflated by paths that start and end in the same country. For instance, the United States contains multiple CAIDA monitors, and is the destination of many traceroutes, inflating its transit DoN. Perhaps more interesting is considering how geographically normal these countries are in paths that they are not the source or destination of. That is, they are only a transit entity on the path. Tables 7 and 7 show the vast difference when we focus on these paths. We now see that Great Britain gets to see an incredible amount of traffic that it is only a transit entity on, and only 6% of that is normal. We also see that the United States gets to see much of the traffic it does because it is either the source or destination of that traffic. We once again see that many transit DoNs for countries are much higher in our user measurements.
In Figure 9 we introduced the term ’benefactor’ of a non-normal path. Tables 7 and 7 show the countries that benefit the most from each set of paths examined. Immediately we see the extraordinary amount of paths that Great Britain and the United States see that they geographically should not. Great Britain is not only the top country in both measurements, but in the all-to-all measurement, Great Britain sees 3 times as many irregular paths as the 3rd most country. This is due in part to Great Britain’s ”piggybacking” off of bad paths bound for the United States, in addition to any illogical paths which traverse Great Britain by itself. Great Britain further benefits from paths originating from countries such as Spain and France ”back tracking” to Great Britain before crossing the Atlantic Ocean.
While these countries benefit from a large number of paths, we see that they do not necessarily do a bad job of transiting all of their traffic. Magnitude is an issue with exposing traffic, but it is also valuable to examine the ratio of the number of paths a nation benefits from to the total amount of traffic the nation transits. Figures 13 and 13 visualize this ratio. We see that many of the top 10 countries from Tables 7 and 7 are not as prominent when considering this ratio. Instead, we see that for certain nations who appear as transit providers, in nearly all instances have no geographic business being on the path. In other words the vast majority of their transit traffic is a result of geographically illogical routes. One interesting point is that we see much of Africa benefits from large fractions of the traffic they transit in our all-to-all measurements but are virtually non-existent in the user measurements, a result of minimal CDN infrastructure appearing in the African continent.


4.2. Regional DoN
Next, we examine DoN at a regional level, where we see in Tables 9 and 9 that certain regions have a better degree of normality when the path is to them rather than from them. For instance, the Americas (North, South, and Central) have a higher than average DoN when the path ends or starts there, but a much lower DoN when they are found transiting data. Part of this could be explained by the smaller number of countries in the Americas, particularly North America. When having more adjacent countries, such as in Europe, there are more choices of countries to route through, and could naturally bring down the DoN for the region. Furthermore, we see that Africa’s DoN is completely reversed when referencing both measurements. In the all-to-all measurement we see that they have a poor DoN when they are the source or transit entity on a path, while in the user measurements they do a much better job, but have poor destination DoN. Finally, we see that in Europe, transit DoN rises dramatically in our user measurements, perhaps indicating that they are a poor transit provider of traffic that is destined outside the region, but have high levels of content localization in for destinations the Region.
| Region | Source DoN | Transit DoN | Destination DoN |
|---|---|---|---|
| Americas | 0.755 | 0.489 | 0.671 |
| Europe | 0.455 | 0.228 | 0.521 |
| Asia | 0.259 | 0.194 | 0.404 |
| Oceania | 0.462 | 0.236 | 0.282 |
| Africa | 0.154 | 0.116 | 0.347 |
| Region | Source DoN | Transit DoN | Destination DoN |
|---|---|---|---|
| Americas | 0.739 | 0.454 | 0.719 |
| Europe | 0.616 | 0.482 | 0.548 |
| Asia | 0.386 | 0.178 | 0.247 |
| Oceania | 0.565 | 0.064 | 0.570 |
| Africa | 0.373 | 0.485 | 0.185 |
Finally, we wish to examine the DoN of each region on a region to region basis. This is particularly important because it shows how normal the routing infrastructure is at a coarser level. Tables 11 and 11 show that when staying inside a region, every region except Asia has an above average DoN. We also see in Table 11 that the DoN from one region to another is highly symmetrical: the DoN traversing from region 1 to region 2 is typically close to the DoN when traversing from region 2 to region 1. We see somewhat less symmetry in DoN in the user experience dataset. Of particular note, Table 11 reveals an incredibly high DoN from every region to the Americas.
| From \To | Africa | Americas | Asia | Europe | Oceania |
| Africa | 0.812 | 0.023 | 0.097 | 0.249 | 0.0003 |
| Americas | 0.051 | 0.904 | 0.583 | 0.597 | 0.209 |
| Asia | 0.017 | 0.237 | 0.376 | 0.176 | 0.201 |
| Europe | 0.147 | 0.454 | 0.177 | 0.651 | 0.024 |
| Oceania | 0.017 | 0.572 | 0.384 | 0.044 | 0.884 |
| From \To | Africa | Americas | Asia | Europe | Oceania |
| Africa | 1.000 | 0.535 | 0.050 | 0.186 | 0.000 |
| Americas | 0.176 | 0.793 | 0.350 | 0.623 | 0.645 |
| Asia | 0.000 | 0.484 | 0.412 | 0.160 | 0.188 |
| Europe | 0.114 | 0.702 | 0.151 | 0.568 | 0.472 |
| Oceania | 0.000 | 0.765 | 0.531 | 0.096 | 0.833 |
5. Legal Exposure


While looking at paths from a purely physical standpoint is important, we also want to consider how geographically normal a path is when additionally considering countries that can exert legal control over an AS transiting traffic. This is particularly important because many ASes are legally registered in one country while having physical infrastructure in another. For example, 18 of our CAIDA monitors are physically located in a country different than the one their ASN is legally registered in. To measure the legal exposure of a path, we take every physical AS, country tuple path we have and map the AS back to the country it was registered in. If we only consider legal exposure, the global DoN for the all-to-all measurement is 0.712 and the user measurement is 0.675. Figures 16 and 16 show the legal DoN of the countries we have measurements for. We see mostly the same trends here that we did in Figures 11 and 11, which is that the DoN of all three curves is mostly the same, but shifted. One difference, however, is in the RIPE legal DoN. Here we see higher transit DoNs than destination DoNs. Again we notice the trend that a small number of very well off nation states drive the overall average due to their involvement with more path. In fact, 80% of nations have a DoN when involved in a path below the average legal DoN.
| Country | # Paths Benefited From |
|---|---|
| US | 316,837,638 |
| BG | 78,707,435 |
| DE | 69,875,057 |
| HK | 58,841,304 |
| GB | 55,482,445 |
| ZA | 46,602,480 |
| AT | 28,613,961 |
| ES | 27,396,710 |
| NL | 26,234,852 |
| IL | 21,173,866 |
| Country | # Paths Benefited From |
|---|---|
| BG | 113,56 |
| US | 6,744 |
| GB | 2,888 |
| DE | 2,036 |
| NL | 1,291 |
| UA | 1,089 |
| RU | 1,059 |
| DK | 7,45 |
| NO | 6,95 |
| ES | 4,58 |
We also examine the benefactors of non-normal legal paths in Tables 13 and 13. Here we see Bulgaria, which was not in the top 10 benefactors for either measurement in terms of physical benefactors, is 1st and 2nd in our legal measurements of the all-to-all topology and user-experience, respectively. This is an exceptionally interesting case since few of the involved paths physically transit Bulgaria, but the Bulgarian government could place pressure on companies corporately headquartered there to gain access to the traffic.
Furthermore, we see that the United States is a benefactor in over 4 times as many paths as anyone else in our all-to-all measurements. This may be due to the fact that many large ASes that are legally registered in the United States have physical infrastructure in multiple countries.
| All-to-All | User | |
|---|---|---|
| Physical | 0.565 | 0.632 |
| Legal | 0.712 | 0.674 |
| Union | 0.519 | 0.500 |
Ultimately, the path entities that have influence over the path that any data takes are both the physical and legal entities that the traffic is exposed to. To examine the normality of paths when considering this, we have determined the normality of paths based on the union of the physical and legal countries transited. We term this DoN union DoN and it accurately reflects all of the entities that could act as path based adversaries on a given path. To compute this DoN we took the physical source and destination of a path and the union of both the legal and physical transit entities. Table 14 shows the drop in DoN across both measurements when we compute this union. It is important to note that the union DoN can only be lower than the physical DoN as we can only add countries to the set when computing the union of transit entities. We see a more than 20% drop in normality for our user-experience data set when we consider the union of physical and legal exposure, as well as an 8% drop in normality in our all-to-all measurement.
Figure 16 gives us insight into the amount of extra countries that a path gets exposed to when we compute the union of the physical and legal transit entities. Here we see that in most instances in which the union results in added exposure, only a single nation state is added.
6. Related Work
While our work is the first comprehensive study of which nation states inordinately benefit from choices made by the Internet’s routing infrastructure, several other works have examined portions of the problem space. Karlin et. al. (Karlin et al., 2009) was one of the first to explore this phenomena. In their work they utilized both traceroutes and inference based on information from BGP routing tables gathered for public mirrors to generate centrality of measures of nation states on the Internet. Our work builds on their techniques in order to explore if the centrality of certain nation states is simply the result of the number of hosts residing in those countries, if it results from providing a necessary physical connection between a send and receiver, or if, as we often saw, it is a physically unnecessary phenomena. Additionally, Karlin et. al. focused only on an ”all-to-all” Internet measurement, rather than exploring the subset of paths used to distribute the majority of content.
Obar and Clement (Obar and Clement, 2013) were the first to explore needless exposure of traffic to unnecessary nation states. Specifically they focused on paths taken from sources inside of Canada to destinations inside of Canada, but exited Canada temporarily to transit infrastructure in the United States. This ”boomeranging” behavior they argued was a violation of the sovereignty of Canadian Internet traffic. Shah and Papadopoulos (Shah and Papadopoulos, 2015) attempted to expand the measurement of this phenomena to all nations, basing their measurements again on observations of the global routing tables. Our work utilizes our novel convex hull based definition of geographically normal to more broadly explore this violation of sovereignty, expanding it to consider traffic transiting between two different countries in addition to traffic starting and ending inside the same nation.
The most similar to our work is Edmundson et. al. (Edmundson et al., 2016), which attempted to refine Shah and Papadopoulos’s measurements of paths starting and ending inside the same nation transiting outside that nation, which they termed ”tromboning”. Like our work, Edmundson et. al. utilized traceroutes rather than inferences based on routing tables, and explored the concept of a ”typical user” model. However, Edmundson et. al. focused their measurements on five countries: Brazil, Netherlands, Kenya, India, and the United States. Our measurements greatly expand on this; for the user model explored 30 and 64 countries as sources and destinations respectively, and our all-to-all model had 52 source and 240 destination nations. Additionally, their work utilized curl in order to build their model of which hosts are contacted during the loading of web content, a methodology that our prior work has found underestimates the number of resources contacted by a factor of roughly 20, and often incorrectly identifies the location of the server supplying the bulk of the content. Like similar work Edmundson et. al. utilize a focused definition of an illogical path, centered only on tromboning, while we apply our convex hull technique to explore geographically illogical paths more broadly. Lastly, given that their work pre-dated events such as the CLOUD act, Edmundson et. al. do not explore legal exposure in their work; given recent events we include this analysis.
Work exploring the degree to which other nation states can impact the Internet connectivity of their citizens or other nations as a result of the AS level Internet topology also exists. One of the most well known of these works is Roberts et. al. (Roberts et al., 2011), where the authors explored how many ASes were physically located inside each country, and how many other nation states those ASes provided that country a direct connection to. More recently, Wahlisch et. al. (Wählisch et al., 2012) explores this concept in detail for traffic sources or destinations specifically in the nation of Germany. Both of these works only consider what ASes have infrastructure inside or directly connected to the given nation states, and do not consider the actual paths traffic takes during transit and what nation states those paths traverse.
7. Conclusions
In this work, we have examined the extent to which the Internet’s routing infrastructure needlessly exposes network traffic to different nations. In summary, our contributions are as follows:
-
•
We developed a unique infrastructure for doing so by defining what a ”normal” geographic path is between two countries through the use of convex hulls.
-
•
We quantified the amount of normal and irregular traffic between two entities through the lense of the path based degree of normality (DoN). We measure the exposure of both the entire geographic topology of the Internet and the subset of the topology that a user generally interacts with and examined over 2.5 billion paths.
-
•
We reveal that 44% of paths concerning the entire geographic topology and 33% of paths concerning the user experienced topology unnecessarily expose network traffic to at least one nation state, often more.
-
•
We examined the benefitting nations and regions of geographically illogical paths.
-
•
We explored the legal countries each measured path traverses to determine the countries with legal jurisdiction over the traversed ASes in all 2.5 billion paths. When considering both the physical and legal countries each path crosses, over 49% of paths in both datasets expose traffic to at least one nation unnecessarily.
-
•
Overall, we found the global DoN for the physical topology to be 0.565 (entire topology) and 0.632 (user), and the legal to be 0.712 (entire) and 0.674 (user). The combined union of the two shows the entire Internet with a 0.519 DoN and user experienced paths to be 0.500. Notably, the Internet averages to be geographically logical in only slightly more than half of all countries and regions.
Future Work: We plan to expand our measurements to examine countries which see temporary, but marked, changes in their DoN. We will then attempt to establish the root cause of such changes. Ideally, we could measure these changes in real-time via measurement infrastructures built into CAIDA systems such as Ark or RIPE Atlas. We are also interested in examining if adversarial actions could result in a temporarily reduced DoN for nations, or if particular nations could inordinately benefit from adversarial reductions in DoN. Lastly, we wish to examine if nations can adjust their routing policies in an effort to increase their DoN, effectively reducing their exposure to nation state level path adversaries.
References
- (1)
- der (2013) 2013. The NSA Uses Powerful Toolbox In Effort To Spy On Global Networks. http://www.spiegel.de/international/world/the-nsa-uses-powerful-toolbox-in-effort-to-spy-on-global-networks-a-940969.html. (2013).
- ark (2017) 2017. The CAIDA UCSD IPv4 Routed /24 Topology Dataset: 1 Jan 2017 - 31 Oct 2017. http://www.caida.org/data/active/ipv4_routed_24_topology_dataset.xml. (2017).
- Ale (2018) 2018. Alexa Top 1000 Websites. https://www.alexa.com/topsites. (2018).
- pop (2018) 2018. The GeoNames Database. http://download.geonames.org/export/dump/. (2018).
- ian (2018) 2018. The Internet Assigned Numbers Authority. https://www.iana.org/numbers. (2018).
- sha (2018) 2018. The Matic Mapping. http://thematicmapping.org/. (2018).
- rip (2018) 2018. The RIPE Atlas Dataset. https://atlas.ripe.net/. (2018).
- Sel (2018) 2018. Selenium Web Browser Automation. https://www.seleniumhq.org/. (2018).
- dig (2019) 2019. The NetAcuity Solution Suite. https://www.digitalelement.com/solutions/. (2019).
- Wap (2019) 2019. Wappalyzer: Identify technology on websites . https://www.wappalyzer.com/. (2019).
- Anderson (2006) Nate Anderson. 2006. ATT Engineer: NSA Built Secret Rooms In Our Facilities. https://arstechnica.com/uncategorized/2006/04/6585-2/. (2006).
- Anwar et al. (2015) Ruwaifa Anwar, Haseeb Niaz, David Choffnes, Ítalo Cunha, Phillipa Gill, and Ethan Katz-Bassett. 2015. Investigating interdomain routing policies in the wild. In Proceedings of the 2015 ACM Conference on Internet Measurement Conference. ACM, 71–77.
- Apostolaki et al. (2016) Maria Apostolaki, Aviv Zohar, and Laurent Vanbever. 2016. Hijacking Bitcoin: Routing Attacks on Cryptocurrencies. arXiv preprint arXiv:1605.07524 (2016).
- Dingledine et al. (2004) Roger Dingledine, Nick Mathewson, and Paul Syverson. 2004. Tor: The Second-generation Onion Router. In Proceedings of the 13th Conference on USENIX Security Symposium - Volume 13 (SSYM’04). USENIX Association, Berkeley, CA, USA, 21–21. http://dl.acm.org/citation.cfm?id=1251375.1251396
- Edmonds (2018) Niki Edmonds. 2018. CLOUD Act Opens Up User Data to Foreign Governments. https://jolt.law.harvard.edu/digest/cloud-act-opens-up-user-data-to-foreign-governments. (2018).
- Edmundson et al. (2016) Anne Edmundson, Roya Ensafi, Nick Feamster, and Jennifer Rexford. 2016. Characterizing and avoiding routing detours through surveillance states. arXiv preprint arXiv:1605.07685 (2016).
- Ereche (2010) Mauricio Ereche. 2010. Odd behaviour on one node in I root-server. https://lists.dns-oarc.net/pipermail/dns-operations/2010-March/005260.html. (2010).
- Feamster and Dingledine (2004) Nick Feamster and Roger Dingledine. 2004. Location diversity in anonymity networks. In Proceedings of the 2004 ACM workshop on Privacy in the electronic society. ACM, 66–76.
- Gebhart (2017) Gennie Gebhart. 2017. We’re Halfway to Encrypting the Entire Web. https://www.eff.org/deeplinks/2017/02/were-halfway-encrypting-entire-web. (2017).
- Gharaibeh et al. (2017) Manaf Gharaibeh, Anant Shah, Bradley Huffaker, Han Zhang, Roya Ensafi, and Christos Papadopoulos. 2017. A Look at Router Geolocation in Public and Commercial Databases. In Proceedings of the 2017 Internet Measurement Conference (IMC ’17). ACM, New York, NY, USA, 463–469. https://doi.org/10.1145/3131365.3131380
- Greenberg (2014) Andy Greenberg. 2014. HACKER REDIRECTS TRAFFIC FROM 19 INTERNET PROVIDERS TO STEAL BITCOINS. https://www.wired.com/2014/08/isp-bitcoin-theft/. (2014).
- Johnson et al. (2013) Aaron Johnson, Chris Wacek, Rob Jansen, Micah Sherr, and Paul Syverson. 2013. Users get routed: Traffic correlation on Tor by realistic adversaries. In Proceedings of the 2013 ACM SIGSAC conference on Computer & communications security. ACM, 337–348.
- Karlin et al. (2009) Josh Karlin, Stephanie Forrest, and Jennifer Rexford. 2009. Nation-state routing: Censorship, wiretapping, and BGP. arXiv preprint arXiv:0903.3218 (2009).
- Labovitz et al. (2010) Craig Labovitz, Scott Iekel-Johnson, Danny McPherson, Jon Oberheide, and Farnam Jahanian. 2010. Internet inter-domain traffic. In ACM SIGCOMM Computer Communication Review, Vol. 40. ACM, 75–86.
- Malkin (1993) G. Malkin. 1993. Traceroute Using an IP Option. RFC 1393. RFC Editor.
- Moy (1998) John Moy. 1998. OSPF Version 2. STD 54. RFC Editor. http://www.rfc-editor.org/rfc/rfc2328.txt http://www.rfc-editor.org/rfc/rfc2328.txt.
- Obar and Clement (2013) Jonathan A Obar and Andrew Clement. 2013. Internet surveillance and boomerang routing: A call for Canadian network sovereignty. (2013).
- Oran (1990) D. Oran. 1990. OSI IS-IS Intra-domain Routing Protocol. RFC 1142. RFC Editor.
- Rekhter et al. (2006) Y. Rekhter, T. Li, and S. Hares. 2006. A Border Gateway Protocol 4 (BGP-4). RFC 4271. RFC Editor. http://www.rfc-editor.org/rfc/rfc4271.txt http://www.rfc-editor.org/rfc/rfc4271.txt.
- Roberts et al. (2011) Hal Roberts, David Larochelle, Rob Faris, and John Palfrey. 2011. Mapping local internet control. In Computer Communications Workshop (Hyannis, CA, 2011), IEEE.
- RouteViews (2018) RouteViews. 2018. RouteViews Dataset. http://www.routeviews.org/. (2018).
- Savage et al. (2016) D. Savage, J. Ng, S. Moore, D. Slice, P. Paluch, and R. White. 2016. Cisco’s Enhanced Interior Gateway Routing Protocol (EIGRP). RFC 7868. RFC Editor.
- Shah and Papadopoulos (2015) Anant Shah and Christos Papadopoulos. 2015. Characterizing International BGP Detours. Technical Report. Technical Report CS-15-104, Colorado State University.
- Wählisch et al. (2012) Matthias Wählisch, Thomas C Schmidt, Markus de Brün, and Thomas Häberlen. 2012. Exposing a nation-centric view on the German internet–a change in perspective on AS-level. In International Conference on Passive and Active Network Measurement. Springer, 200–210.
- Zetter (2015) Kim Zetter. 2015. What We Know About the NSA And ATT’s Spying Pact. https://www.wired.com/2015/08/know-nsa-atts-spying-pact/. (2015).
- Zmijewski (2010) Earl Zmijewski. 2010. Accidentally Importing Censorship. https://dyn.com/blog/fouling-the-global-nest/. (2010).