Line Ratios Reveal N2H+ Emission Originates Above the Midplane in TW Hydrae
Abstract
Line ratios for different transitions of the same molecule have long been used as a probe of gas temperature. Here we use ALMA observations of the N2H+ J = 1-0 and J = 4-3 lines in the protoplanetary disk around TW Hya to derive the temperature at which these lines emit. We find an averaged temperature of 39 K with a one sigma uncertainty of 2 K for the radial range 0.8-2″, significantly warmer than the expected midplane temperature beyond 05 in this disk. We conclude that the N2H+ emission in TW Hya is not emitting from near the midplane, but rather from higher in the disk, in a region likely bounded by processes such as photodissociation or chemical reprocessing of CO and N2rather than freeze out.
1 Introduction
In protoplanetary disks molecular line emission is used to obtain the abundances of different species as well as measure physical properties within the disk such as temperature, turbulence, and ionization. One species which has proved useful for constraining physical properties is N2H+, a molecular ion which emits strongly in protoplanetary disks. N2H+ is formed when H transfers a proton to N2 and is destroyed primarily by reacting with CO. Because of this, as well as the formation reaction competing with proton transfer between H and CO, N2H+ only exists at large abundances in regions with N2 gas but without a large CO gas abundance. As such, N2H+ is a potential tracer of the CO snowline (Qi et al., 2013).
For rings of N2H+ emission the inner radius of the emission has been posited to trace the midplane CO snowline for TW Hya and HD 163296. For HD 163296 the CO snowline location based on N2H+ emission is in good agreement with the snowline location as determined by C18O observations (Qi et al., 2015). However, for TW Hya the snowline location of 30 au based on N2H+ emission is significantly farther out than midplane snowline location of 17 au derived from observations of 13C18O (Qi et al., 2013; Zhang et al., 2016). Additionally, N2H+ emission does not appear to trace the CO snowline in the V4046 Sgr disk (Kastner et al., 2018).
Using physical-chemical and radiative transfer modeling, van ’t Hoff et al. (2017) argue that this discrepancy is due in part to some of the N2H+ emission originating from higher in the disk. The utility of N2H+ as a snowline tracer thus depends on the physical properties of the protoplanetary disk, including its temperature structure. In this letter we use the ratio of N2H+ J = 4-3 to N2H+ J = 1-0 emission observed in TW Hya to derive the average temperature of the N2H+ emitting ring. We demonstrate how temperatures derived from line ratios can inform our understanding of the likely formation pathway of a given molecule as well as what underlying conditions gave rise to the morphology of the emitting region.
2 Observations
The ALMA Band 3 observations targeting N2H+ J = 1-0 where obtained on 2016 October 2 with 42 antennas as part of project 2016.1.00592.S (PI: K. Schwarz). The data were calibrated and imaged using CASA v4.7.0. Phase and amplitude self-calibration were performed on the continuum and applied to the line spectral window. Continuum subtraction was performed using the CASA task uvcontsub. The line data were imaged using natural weighting, resulting in a beam and a per channel rms noise level of 2.2 K per 0.1 km s-1 channel. Additionally, we use archival observations of the N2H+ J = 4-3 transition (2011.0.00340.S, PI: C. Qi). For a detailed discussion of the data reduction we refer the reader to Qi et al. (2013). Here we report only the properties of the final N2H+ image cube for comparison with the 1-0 data. The final image has a synthesized beam of and a per channel rms noise level of 0.71 K per 0.1 km s-1 channel.
3 Analysis
After standard calibration, emission from the N2H+ J = 1-0 transition is not apparent in either the channel maps or moment 0 map. The lack of direct detection of the 1-0 transition in the image plane gives an upper limit on the integrated line intensity of 2.7 K km s-1 for a single hyperfine component, where the upper limit is RMS and km s-1 is the line width based on the 4-3 data. The upper limit for the seven hyperfine components added in quadrature is then 7.1 K km s-1. In order to improve the signal-to-noise of the spectra we employ the stacking method for Keplerian disks introduced by Yen et al. (2016). Using the package eddy (Teague, 2019) the image cube is divided into concentric annuli, which are each de-projected to the system velocity assuming the physical and kinematic properties derived from previous analysis of the CS emission in TW Hya (Teague et al., 2018). The de-projected spectra are then stacked. Line emission is weakly detected in the annular bins in the range 08 to 2″ from source center. In comparison, bright N2H+ 4-3 emission is observed in the image plane in a ring from 0.8 to 12, though weaker emission can be seen out to 25 (Qi et al., 2013). Figure 1 shows the averaged spectrum for a ring from 0.8 to 2″ as well as the ring-averaged 4-3 spectrum for the same parameters.
Multiple hyperfine lines are clearly seen in the averaged 1-0 spectrum. Given sufficient signal-to-noise, the relative strengths of the different hyperfine components can be used to measure the optical depth (e.g., Mangum & Shirley, 2015). We use the ratio of the line relative to the four next strongest hyperfine lines as they appear in our averaged spectrum to calculate the optical depth. For each ratio our data gives an optical depth greater than 1, ranging from 1.5 for the line to 66 for the line. If the N2H+ 1-0 emission is indeed optically thick, the beam temperature should be roughly equal to the gas temperature, implying that N2H+ is emitting from gas colder than 2 K. As we discuss below this seems unlikely given our current understanding of the physical conditions within the TW Hya disk. A more likely explanation is that the signal-to-noise remains too poor to use the relative strength of the hyperfine components to constrain the optical depth.
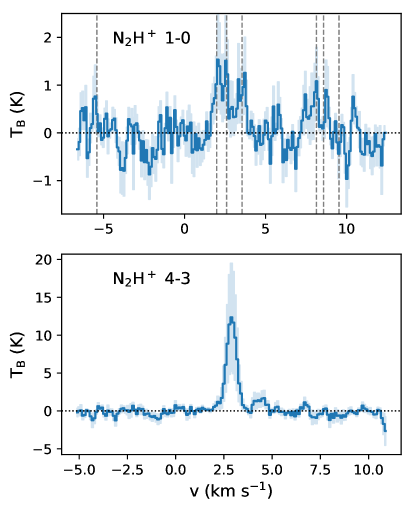
The ring-averaged peak brightness temperatures of the 1-0 and 4-3 lines are K and K respectively, where the uncertainty is the one sigma value. N2H+ is posited to emit at temperatures close to the CO freeze out temperature. At the relevant radii in TW Hya the freeze out temperature is expected to be 21 K (see Schwarz et al., 2016). These brightness temperatures are well below this value and thus the emission is assumed to be optically thin. Radial variations in the intensity of the 4-3 line within our annular bins likely contribute to the uncertainty for the ring-averaged peak brightness. However, as we are directly comparing the 4-3 data to the 1-0 data we choose to treat the two datasets in the same way when averaging. Assuming LTE, the ratio of the integrated intensities can be used to measure the excitation temperature (Goldsmith & Langer, 1999):
| (1) |
where is the line frequency, A is the Einstein coefficient, I is the integrated intensity, g is the statistical weight for a linear rotor, Eul is the energy difference between the two transitions, k is the Boltzmann constant, and T is the excitation temperature. Integrating the ring-averaged spectrum for each transition gives an integrated intensity (and one sigma uncertainty) of K km s-1 for the 1-0 transition and K km s-1 for the 4-3 transition. Using these values we find an excitation temperature of 39 K, with a one sigma uncertainty of 2 K.
4 Discussion
At the radii we consider, 0.8-2″, the radial temperature profile based on observations of 13CO is roughly constant at 21 K (Schwarz et al., 2016). That the temperature probed by 13CO remains constant over many radii suggests that the 13CO emission is originating primarily from just above the CO snow surface. This can also be seen for the more inclined IM Lup disk, where the CO snow surface is directly imaged in addition to constraining the CO freeze out temperature to K (Pinte et al., 2018). As such the 21 K from 13CO provides an upper limit for the midplane temperature at these radii. This is consistent with models of the TW Hya disk (e.g., Du et al., 2015; Kama et al., 2016), which set the midplane temperature in this region at temperatures between 10-20 K. Thus, the K gas where N2H+ is emitting resides above the midplane.
In the disk models of Aikawa et al. (2015) and van ’t Hoff et al. (2017) (itself based on the Kama et al. (2016) model), which focus specifically on the N2H+ 4-3 emission, the 40 K gas temperature contour is at a scale height of for the radii where N2H+ emission is observed. Both sets of models predict N2H+emission at this scale height. In the Aikawa et al. (2015) models including millimeter grains, CO has been converted to CO2 ice at a scale height of 0.2 while photodissociation prevents N2 from being reprocessed into NH3 ice. This combination of a low CO abundance and a high N2 abundance results in a layer of N2H+. CO2 ice has been proposed as a potential reservoir of volatile carbon in disks such as TW Hya with a low CO gas abundance (Eistrup et al., 2016; Bosman et al., 2018; Schwarz et al., 2018). It is also worth noting that our derived temperature for the N2H+ emitting layer of K is close to the expected desorption temperature of CO2 ice.
Alternatively, in the van ’t Hoff et al. (2017) models a surface layer of N2H+ is generated when CO has been dissociated by UV photons while N2 remains self-shielded. These models are specifically tailored to TW Hya while considering only a small network of chemical reactions. The best fit to the observed N2H+ 3-2 emission in TW Hya occurs when both the CO and N2 gas abundances have been reduced, with a total N2/CO ratio of 1. In summary, there are a variety of factors which influence the morphology of the N2H+ emission in TW Hya, with photodissociation and the CO and N2 gas abundances being of particular importance. While several combinations of processes match the observed emission, it is clear that in this system N2H+ emission is not a good tracer of the CO snowline deeper in the disk. That the N2H+ emission in TW Hya originates from a surface layer was also suggested by Nomura et al. (2016) based on the observed brightness temperature of the 4-3 line.
5 Summary
We use averaged observations of the N2H+ J = 1-0 and J = 4-3 lines from to in TW Hya to derive the temperature of the N2H+ emitting layer. We find an excitation temperature of 39 K with a one sigma uncertainty of 2 K, significantly warmer than the expected midplane temperature of 20 K at the radii where N2H+ is observed to emit. Therefore we conclude that in TW Hya N2H+ primarily emits from a surface layer, with the vertical boundaries set by processes such as photodissociation or chemical reprocessing, rather than a layer deeper in the disk bounded by the direct freeze-out of N2 and CO. These results highlight the importance of understanding protoplanetary disk structure when interpreting molecular line observations.
References
- Aikawa et al. (2015) Aikawa, Y., Furuya, K., Nomura, H., & Qi, C. 2015, ApJ, 807, 120
- Bosman et al. (2018) Bosman, A. D., Walsh, C., & van Dishoeck, E. F. 2018, A&A, 618, A182
- Du et al. (2015) Du, F., Bergin, E. A., & Hogerheijde, M. R. 2015, ApJ, 807, L32
- Eistrup et al. (2016) Eistrup, C., Walsh, C., & van Dishoeck, E. F. 2016, A&A, 595, A83
- Goldsmith & Langer (1999) Goldsmith, P. F., & Langer, W. D. 1999, ApJ, 517, 209
- Hunter (2007) Hunter, J. D. 2007, Computing in Science and Engineering, 9, 90
- Kama et al. (2016) Kama, M., Bruderer, S., van Dishoeck, E. F., et al. 2016, A&A, 592, A83
- Kastner et al. (2018) Kastner, J. H., Qi, C., Dickson-Vandervelde, D. A., et al. 2018, ApJ, 863, 106
- Mangum & Shirley (2015) Mangum, J. G., & Shirley, Y. L. 2015, Publications of the Astronomical Society of the Pacific, 127, 266
- McMullin et al. (2007) McMullin, J. P., Waters, B., Schiebel, D., Young, W., & Golap, K. 2007, in Astronomical Society of the Pacific Conference Series, Vol. 376, Astronomical Data Analysis Software and Systems XVI, ed. R. A. Shaw, F. Hill, & D. J. Bell, 127
- Nomura et al. (2016) Nomura, H., Tsukagoshi, T., Kawabe, R., et al. 2016, ApJ, 819, L7
- Pinte et al. (2018) Pinte, C., Ménard, F., Duchêne, G., et al. 2018, A&A, 609, A47
- Qi et al. (2015) Qi, C., Öberg, K. I., Andrews, S. M., et al. 2015, ApJ, 813, 128
- Qi et al. (2013) Qi, C., Öberg, K. I., Wilner, D. J., et al. 2013, Science, 341, 630
- Schwarz et al. (2016) Schwarz, K. R., Bergin, E. A., Cleeves, L. I., et al. 2016, ApJ, 823, 91
- Schwarz et al. (2018) —. 2018, ApJ, 856, 85
- Teague (2019) Teague, R. 2019, The Journal of Open Source Software, 4, 1220
- Teague et al. (2018) Teague, R., Henning, T., Guilloteau, S., et al. 2018, ApJ, 864, 133
- van der Walt et al. (2011) van der Walt, S., Colbert, S. C., & Varoquaux, G. 2011, Computing in Science and Engineering, 13, 22
- van ’t Hoff et al. (2017) van ’t Hoff, M. L. R., Walsh, C., Kama, M., Facchini, S., & van Dishoeck, E. F. 2017, A&A, 599, A101
- Yen et al. (2016) Yen, H.-W., Koch, P. M., Liu, H. B., et al. 2016, ApJ, 832, 204
- Zhang et al. (2016) Zhang, K., Bergin, E. A., Blake, G. A., et al. 2016, ApJ, 818, L16