Phonon localization in surface-roughness dominated nanowires
Abstract
Studies of possible localization of phonons in nanomaterials have gained importance in recent years in the context of thermoelectricity where phonon-localization can reduce thermal conductivity, thereby improving the efficiency of thermoelectric devices. However, despite significant efforts, phonon-localization has not yet been observed experimentally in real materials. Here we propose that surface-roughness dominated nanowires are ideal candidates to observe localization of phonons, and show numerically that the space and time evolution of the energy generated by a heat-pulse injected at a given point shows clear signatures of phonon localization. We suggest that the same configuration might allow experimental observation of localization of phonons. Our results confirm the universality in the surface-roughness dominated regime proposed earlier, which allows us to characterize the strength of disorder by a single parameter combining the width of the wire as well as the mean height of the corrugation and its correlation length.
I Introduction
Anderson localization anderson has been studied most intensely in electronic systems lee-rama ; kramer-mac ; markos , where experiments have clearly observed the metal-insulator transition in three dimensions and absence of true metallic behavior in one and two dimensions as predicted by the scaling theory of localization abrahams . The corresponding problem of photon localization has also been studied extensively john , although it is only expected to occur in artificially constructed dielectric microstructures john1 ; ski . On the other hand while artificially constructed elastic networks tigg do show phonon localization, and numerical studies of finite size properties of inverse participation ratios garel and finite-time scaling beltukov clearly indicate the presence of Anderson localization of acoustic phonons in mass-disordered harmonic crystals, the absence of experimental observations of phonon-localization in real materials indicates that either the strength of bulk disorder required is impractical, or that the experimental signature of localization is not clear, or both.
The subject of phonon-localization in real materials, especially in low dimensional nanostructures, has become a topic of current interest because of the role it plays in the context of thermoelectricity snyder ; dubi ; taka ; hu . A good thermoelectric device should have a large electrical but a small thermal conductivity, an “electron-crystal and phonon-glass” snyder ; slack . Indeed it was shown in recent experiments li ; hochbaum ; lim that crystalline silicon nanowires with corrugated surfaces can have very small thermal conductivity (reaching the amorphous limit for wires of thickness nm). It has been argued that such small thermal conductivity can result generically from the presence of localized phonons in nanowires with rough surfaces ma . Subsequent numerical simulations mm show that in the surface-roughness dominated case, there exists a universal regime where the disorder of the wire can be characterized by a single combination of three different relevant parameters, the width of the wire , the mean height of surface corrugation and the correlation length of the disorder.
While the effect of surface disorder on phonon transport has been studied numerically using a variety of techniques MC1 ; MC2 ; MD1 ; MD2 ; MD3 ; MD4 ; WS1 ; WS2 ; WS3 ; WS4 ; WS5 ; WS6 , in the present work we suggest that it should be possible to experimentally observe the localization of phonons in rough nanowires by systematically studying the frequency and disorder dependence of the propagation of elastic waves when a well-characterized pulse source is injected into the material majumdar . By numerically analyzing the time evolution of the energy injected by the source inside surface-roughness dominated nanowires of different disorder, we show that there are several characteristic properties that can be used to identify phonons that have localization lengths much smaller than the length of the wire. The basic idea is very simple; injecting heat-pulses corresponding to various frequency regimes and observing the energy at well-defined positions as a function of time provides a reliable measure of energy localization. We show that for strong disorder, at a given time clearly shows long-lived resonances excited at positions that vary depending on the frequency, which are hallmarks of existence of localized phonons. At the same time defined as the energy remaining within a small range around the site of injected heat-pulse remains independent of time indicating localization of energy. In addition we show that in this strong disorder regime an appropriately defined mean displacement measuring the diffusion of energy from the injection site also becomes essentially independent of time after a transient period, the saturation value being smaller for larger disorder. In contrast, in a weakly disordered regime we observe to decrease with time and to either keep increasing or slowly saturating at a value close to its maximum, indicating that energy is transported easily, although not necessarily in a standard diffusive manner. It should be possible to distinguish between the two regimes experimentally, by carefully measuring the energy profile across the wire, starting from the site of injection of a well-defined heat-pulse. Moreover we confirm that for a given length of the nanowire, while the surface roughness parameters and as well as the diameter of a nanowire determine the strength of surface disorder, a single combination
| (1) |
characterizes the measure of disorder in the surface-roughness dominated regime as proposed in [mm, ]. Thus it should be possible to study the effects of such disorder systematically by preparing nanowires with similar -values. We suggest that the wires produced by Electroless Etching (ELE) in the experiments of Hochbaum et al hochbaum showing amorphous-like thermal conductivity should be good candidates to observe phonon-localization.
II Observing localized phonons
There are two possible reasons why localization of phonons has not yet been observed in real systems although localization of electrons has clearly been observed experimentally. We discuss the reasons and propose alternative options in the following subsections.
II.1 Bulk vs surface disorder
Even in electronic systems, driving a metal to an insulator by increasing the bulk disorder by, e.g., increasing the density of impurities is not easy; the resistivity often saturates when the mean free path becomes comparable to the lattice spacing. The original solution was to dope the material, where it was possible to observe metal-insulator transition by systematically doping phosphorous in silicon rosenbaum . For phonons, obtaining localized states in a silicon wire would presumably require replacing some of the silicon atoms with ‘defect’ atoms. However as numerical simulations by Monthus and Garel garel show, adding defect masses twice as heavy had only a minor effect and kept the system in the weakly disordered regime. Indeed, the simulations required defect masses almost twenty times as heavy in order to observe a transition to localization in three dimensions. This would mean that random substitution of even the heaviest atoms available will not be sufficient to localize phonons in a silicon wire.
An alternative possibility is to consider surface disorder in reduced dimensions. This will not allow us to explore the critical nature of phonon localization transition since all states are expected to remain localized in reduced dimensions. We therefore do not attempt to study the localization transition; instead our focus is on the existence and observation of localization of acoustic phonons in surface-disorder dominated nanowires. This is also more relevant in the context of thermoelectricity, where a surface disorder will typically affect the thermal conductivity of a nanowire more than the corresponding electrical conductivity and is therefore more suitable as a thermoelectric device. It is already known hochbaum that thermal conductivity of surface disordered (but otherwise crystalline) silicon nanowires of diameters nm (prepared by ELE) can have very low thermal conductivity, which can reach the limiting amorphous limit for nm. This was attributed to the presence of localized phonons mm . If correct, it should be easier to achieve localization of phonons in surface disordered nanowires.
One problem with surface disorder is that it requires several parameters to characterize its strength. Consider Figure 1, which is a typical sample we use for our numerical simulations.

First of all in addition to the length of the wire, the diameter appears explicitly in characterizing the effective disorder since obviously the same surface disorder would be more effective in narrower wires than in wider wires. In addition, the strength of disorder is not only given by the mean height of the corrugation , but also by the correlation length . All these parameters are separately used in e.g. characterizing the ELE silicon nanowires used in the experiments of Hochbaum et al hochbaum . In order to do a systematic study of localization of phonons, this is clearly too large a parameter space to explore experimentally. However, recently it has been shown by numerical simulations mm that a single parameter , as defined in Eq. (1), characterizes the effective disorder of the wire in a regime where surface disorder dominates over any bulk disorder and transport is dominated by diffusive phonons. It is not clear if this characterization remains valid in the strongly disordered systems dominated by the presence of localized phonons. If true, this will clearly simplify the search for phonon localization enormously.
II.2 Heat-pulse and energy evolution
The second complication with phonons is that while for electronic systems the existence of a Fermi surface makes sure that transport is dominated by electrons near the Fermi energy, heat transport involves a sum over a band of phonon frequencies, including very low frequencies that are hard to localize. If, e.g., states beyond a certain frequency are localized, all other states below that frequency remain either diffusive or ballistic and contribute to the transport. Therefore the signature of the presence of these localized phonons are not obvious from transport measurements, except for a reduction in thermal conductivity.
Majumdar majumdar has suggested that one can inject a heat pulse at some given point on the wire and observe the time evolution by observing the effect at various distances as a function of time. Presumably the effect of the source pulse will reach different distances at different times depending on if it encounters a localized phonon or not. Here we propose that in such an experiment, it should be possible to study the energy evolution (kinetic and potential) accumulated at time at a position , which includes the total energy of all atoms across the width of the wire. The total energy in the system is
| (2) |
For more detailed analysis, it is also useful to consider the energy in a given region (for instance, in the neighborhood of the source),
| (3) |
where is the lattice spacing. Clearly for a localized phonon, this quantity should remain almost independent of time. As for transport properties, a suitable parameter is the mean displacement, , which measures the diffusion of the energy from the source,
| (4) |
Note that is normalized by factor of so that the value corresponds to the energy homogeneously distributed along the sample. Thus a localized phonon would lead to a saturation value of after a transient time, the saturation value being smaller for larger disorder.
Of course, the above quantities will depend on the specific realization of disorder. For a more accurate analysis, it would be useful to repeat the simulations for an statistical ensemble of disordered samples and consider the mean values, which is beyond the scope of our current investigation. Nevertheless, we emphasize that while such ensemble averaging would produce a more smooth time-dependence of the above quantities, the qualitative signatures of localized phonons as described above in the overall time-dependence are not sensitive to the sample to sample fluctuations.
III Model and numerical simulations
Typical structure for a nanowire with surface disorder is shown in Fig. 1. Atoms with mass occupy a rectangular square lattice. The distance between nearest neighbor atoms defines the unit of length. The spring constant measures the harmonic force between neighboring atoms. For a square lattice, allowed frequencies fill the frequency band . The size of the sample is defined by its width and length . The surface disorder is modeled by correlated disorder of mean corrugation height and correlation length . Beside the four length parameters , , and , the propagation of phonons depend on their frequency or period . In our units, the speed of long wavelength phonons so that the value of period equals to the wavelength, .
The sample is excited by a time dependent force acting on atoms in one column, usually at the center of the sample :
| (5) |
with and . The frequency of the source, is chosen from the acoustic band, .
The energy, given by the external force, propagates through the sample. In our model the energy is transmitted by scalar acoustic waves propagating on the two-dimensional square lattice. We solve numerically the wave equation
| (6) | |||||
| (7) |
For each , Eq. 6 is an equation of motion of atom interacting with its four nearest neighbors. Equation 6 is formally the finite difference approximation of continuous wave equation with Laplacian substituted by expression on the r.h.s. of (6). We apply explicit numerical algorithm described in [nr, ] with time step and set along the disordered horizontal boundaries. Absorbing boundary conditions abs-bc are implemented at the left () and right () boundaries.
Neglecting phonon-phonon interaction in our model is justified by experimental data for thermal conductivity of surface-roughness dominated silicon nanowires li ; hochbaum ; lim , e.g. synthesized by electroless etching (ELE). Phonon-phonon interactions give rise to a temperature dependence of at high temperatures am in contrast to the power-law behavior at low , leading to a peak in at some intermediate temperature. For bulk silicon this peak occurs at around K, but for ELE nanowires of thickness less than nm this peak is not observed up to K, showing the dominance of surface scattering even at high temperatures.
Typical time of simulation . After the source is applied, we calculate numerically the energy (kinetic and potential) accumulated at time in the ‘column’ . Note that this is the energy of all atoms in the column . In what follows, we will present the time and space distribution for the energy normalized to maximal energy observed throughout the simulation, .


IV Results
The first question we address is whether or not localized phonon states exist in our system that can be excited by the injection of a localized heat-pulse. The second question we study is whether the existence of localized phonon states imply localization of energy around the region where the heat-pulse is injected. As we show below, the answer to both is positive.
IV.1 Existence of localized phonon states
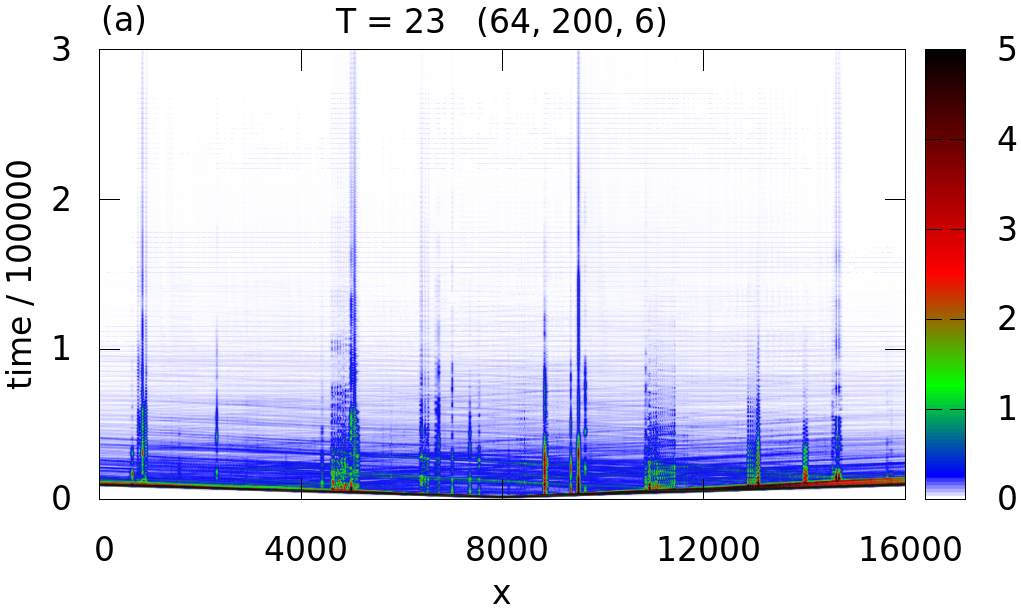
Fig. 2 shows the evolution of the energy in time and space along the sample for a period of the source . A small number of long-lived resonances are clearly visible. The energy propagates from the center of the lattice (position of the source in this case) and excites resonances which correspond to localized phonons. The lifetime of resonances can be very long; some are excited at the beginning of the simulation within time , and survive the entire time of the simulation . As shown in Fig 2(c), the energy localized at the resonance oscillates in time being transferred to other resonances. This is confirmed by detailed analysis of time evolution (not shown). Finally, Fig. 2(d) presents a snapshot of the energy distribution in the sample for . Four resonances, identified also in panels (a) and (b), are clearly visible.
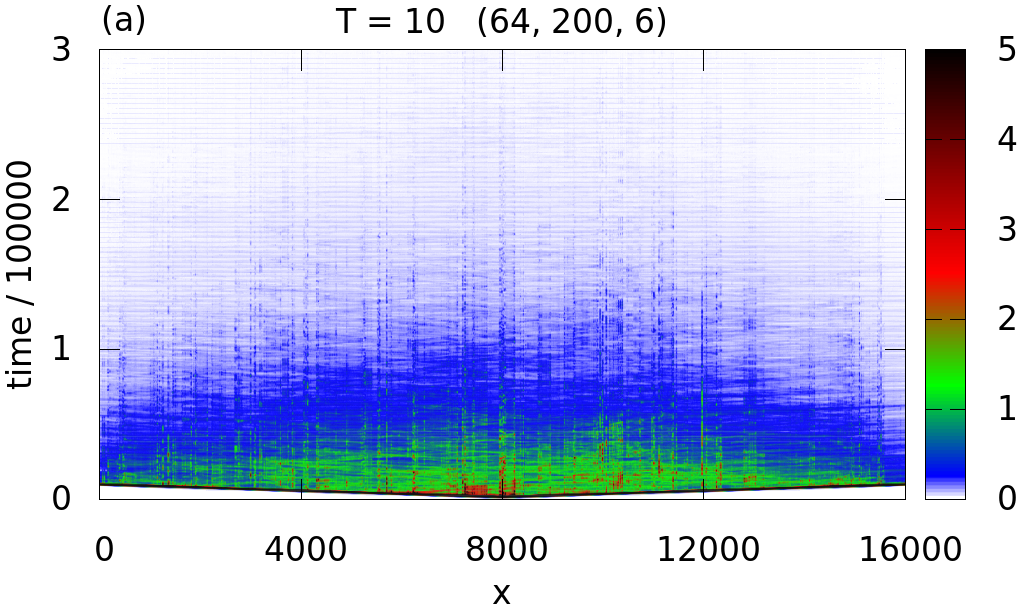
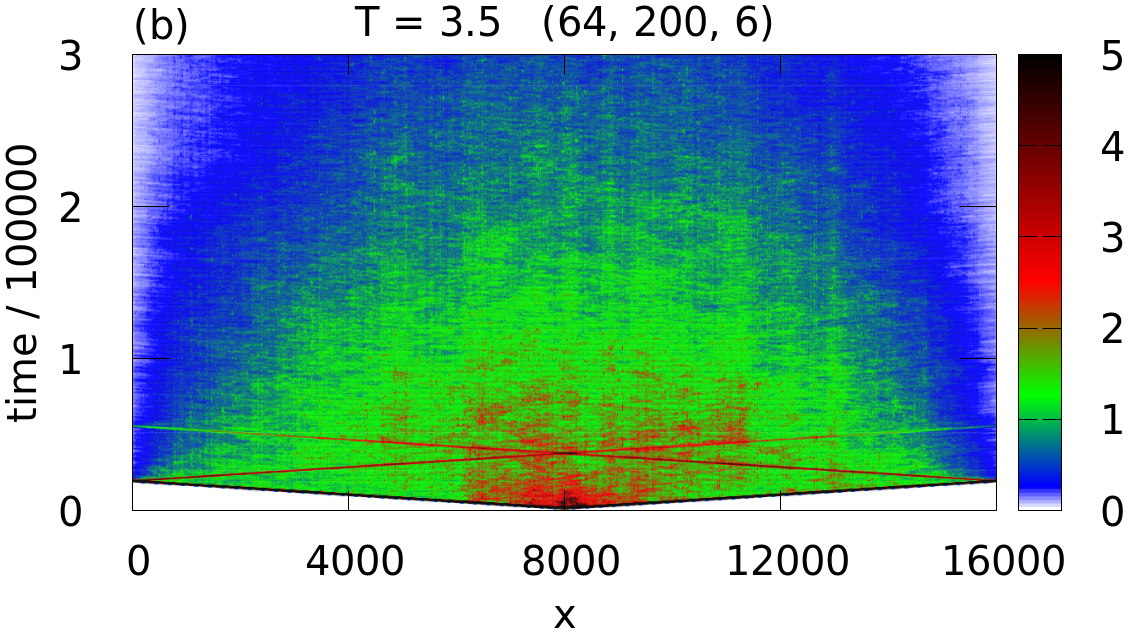
We verified (data not shown) that the positions of resonances do not depend on the position of the source. This means that they could really be associated with localized eigenstates of the disordered structure. On the other hand, changing the frequency of the source results in excitation of different resonances localized at other positions of the sample. As predicted theoretically mm , the number of resonances increases when the frequency of the source increases. Since their mutual distance decreases, their lifetime, defined by overlap of eigenstates, is shorter. As an example, Fig. 3 shows the time evolution of the energy for the same sample but at two higher frequencies, and . Note that the shorter lifetime does not necessarily indicate a wider resonance, but just that two nearby resonances has larger probability to overlap. Clearly, this depends on the particular realization of disorder and an averaging over ensembles with different realizations of disorder will be needed to estimate the range of where one can expect localization.
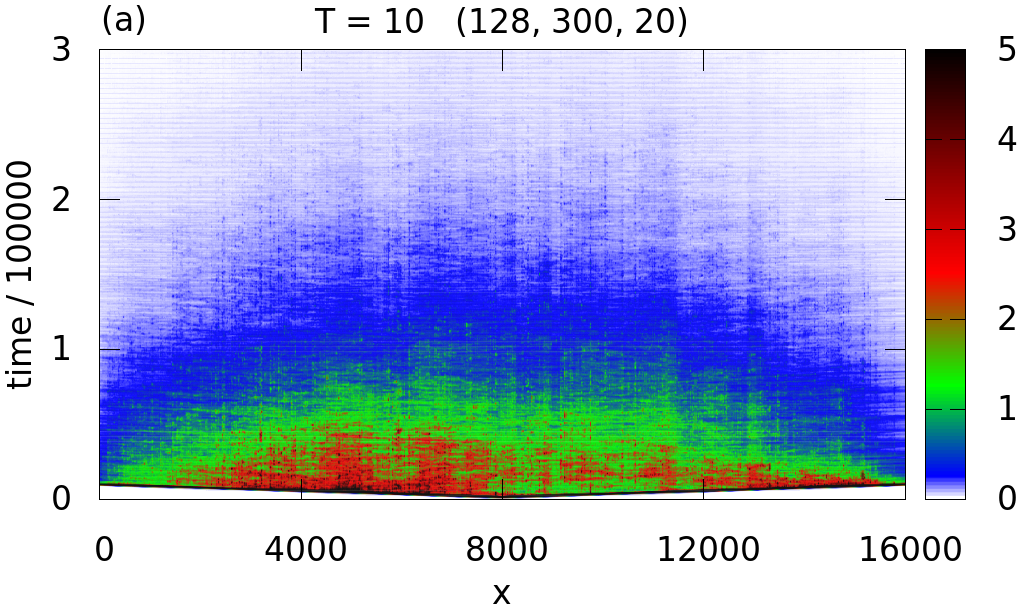
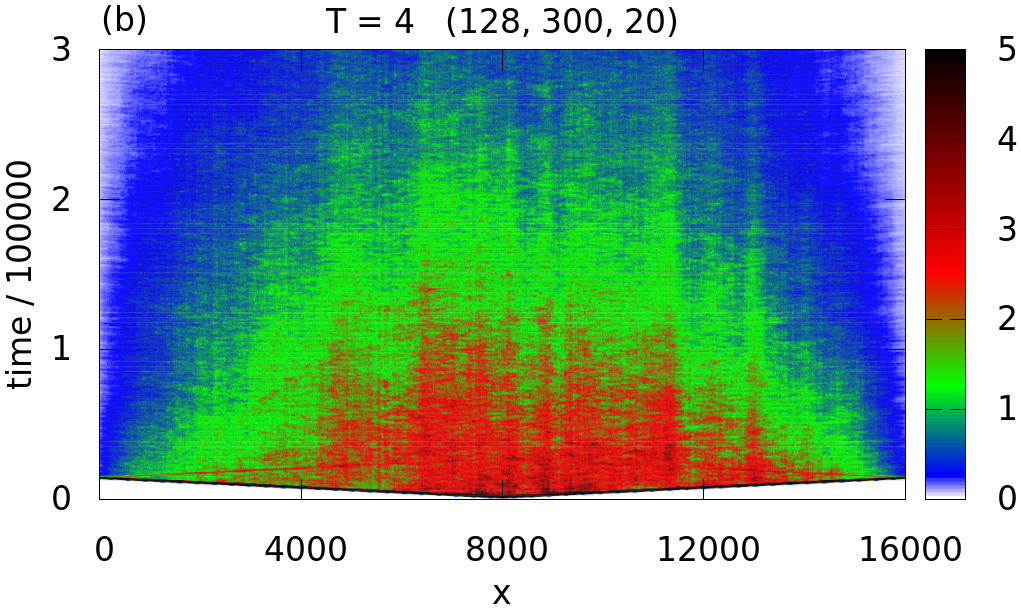
We found that localized resonances are not necessarily limited to small widths comparable to the mean corrugation height . As an example, we show in Fig. 4 resonances observed in a system with and . As we show later, localization depends on a combination of three parameters of the wire , and as well as the frequency of the source.
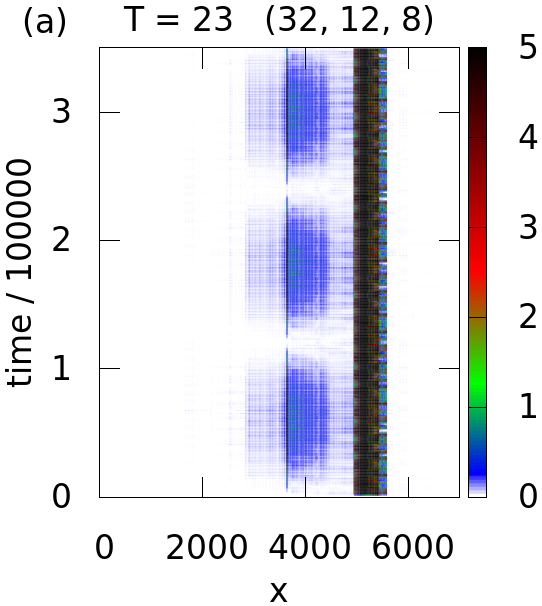


For small and large disorder , it might happen that the width of the wire at some part of the sample becomes smaller than the wavelength of propagating phonons. One example is shown in Fig. 5, where energy of the source is trapped in a narrow region in the center of the sample. This is easy to understand: the phonon can propagate through the wire with local width only if the phonon frequency . Indeed, phonons with higher frequency easily propagate through the bottleneck region (data not shown).
Localization of the injected energy in a small region shown in Fig. 5(a) enables us to demonstrate the existence of localized phonons. The energy trapped in the narrow region around the source location tunnels to the left and excites the resonance localized at (position of the resonance is shown in Fig. 5(c)). The resonance excites and de-excites with the period (Fig. 5(b)) following the textbook formula for double-well potentialFe
| (8) |
where is the eigenfrequency of the resonance and . The effect is observable only for frequencies close to . Note that the position of the resonance does not exhibit any special fluctuation of the surface disorder (in contrast to the position of the “bottlenecks”).
IV.2 Localization of energy and universality
In the previous subsection we showed that localized phonon states do exist in wires with large surface disorder. Now we want to show that the existence of these localized states imply localization of energy injected into the sample. To measure the effect of localization, we calculate the time evolution of the energy defined in (3), the total energy around the region of the source, as well as the mean displacement of energy away from the source. Time independence of these functions would imply that the energy is not able to propagate away from a given region, which we expect to be a reliable measure of the localization of energy.
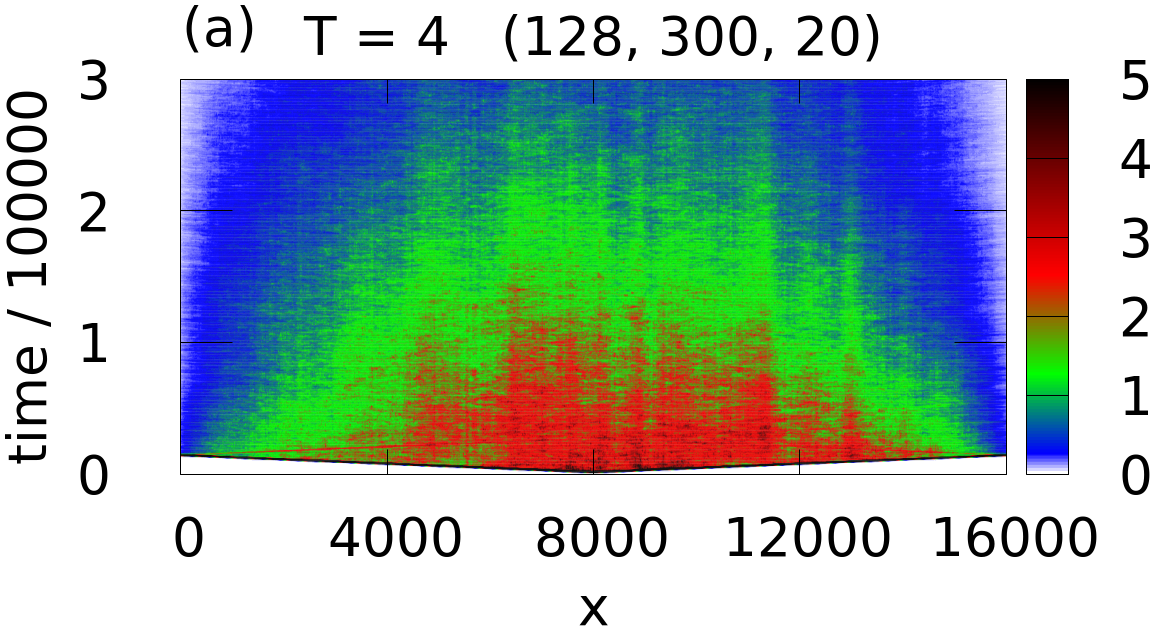
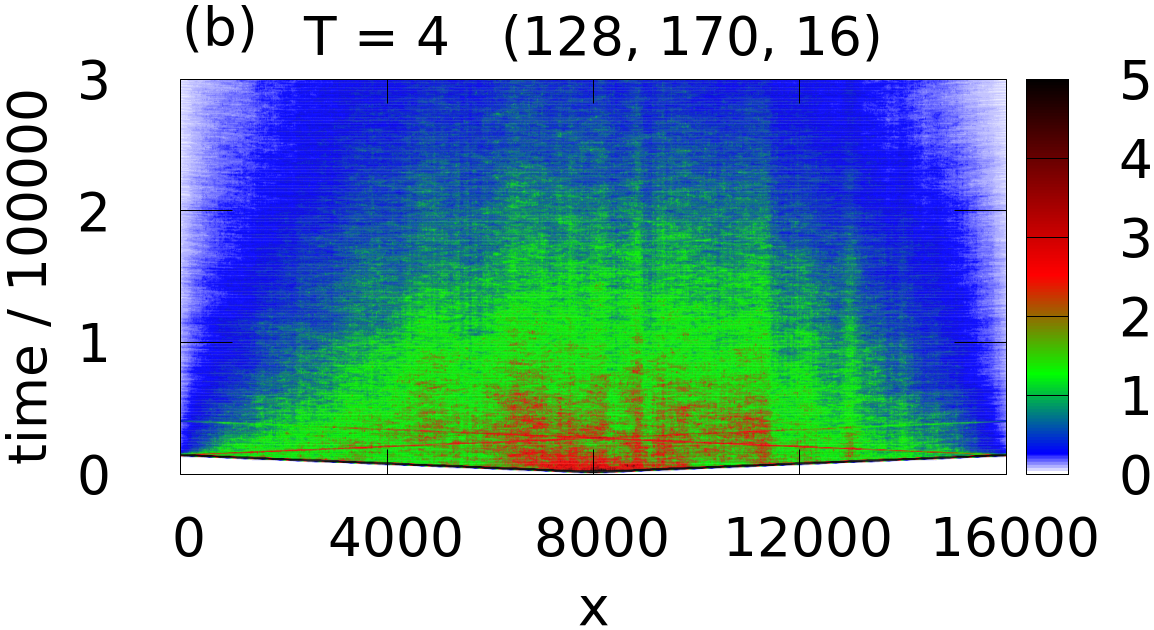
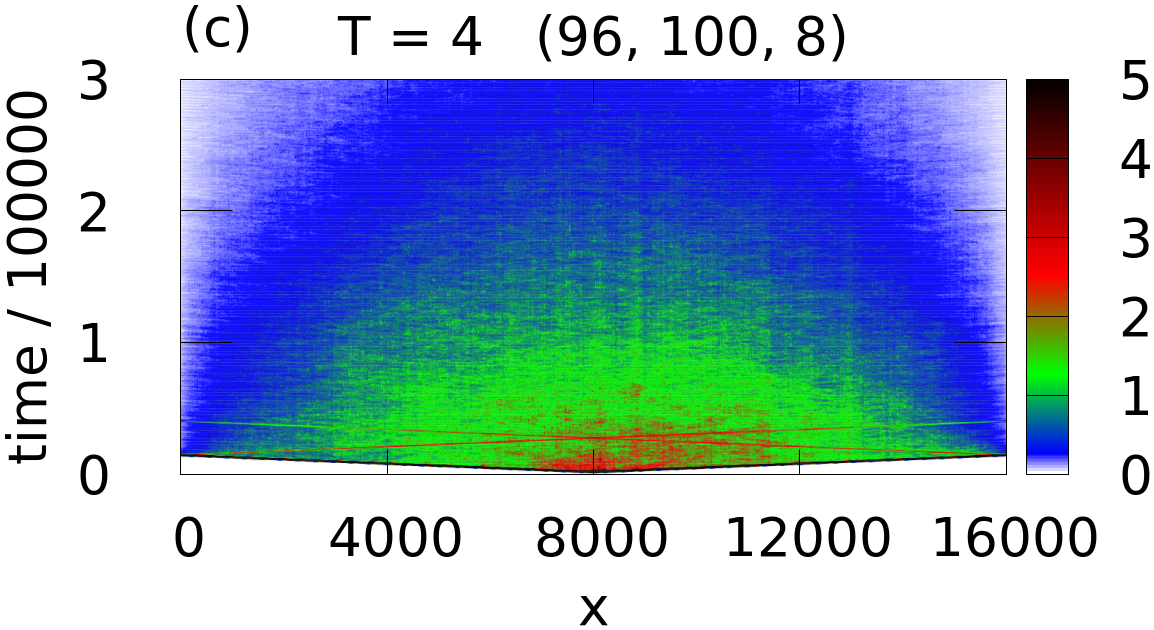
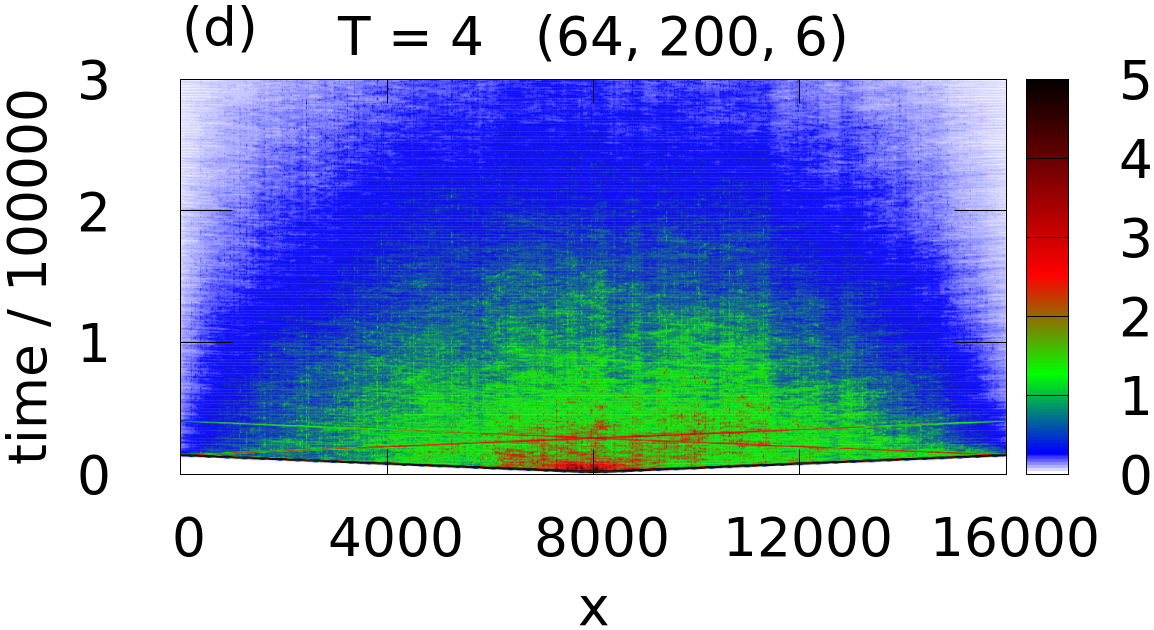
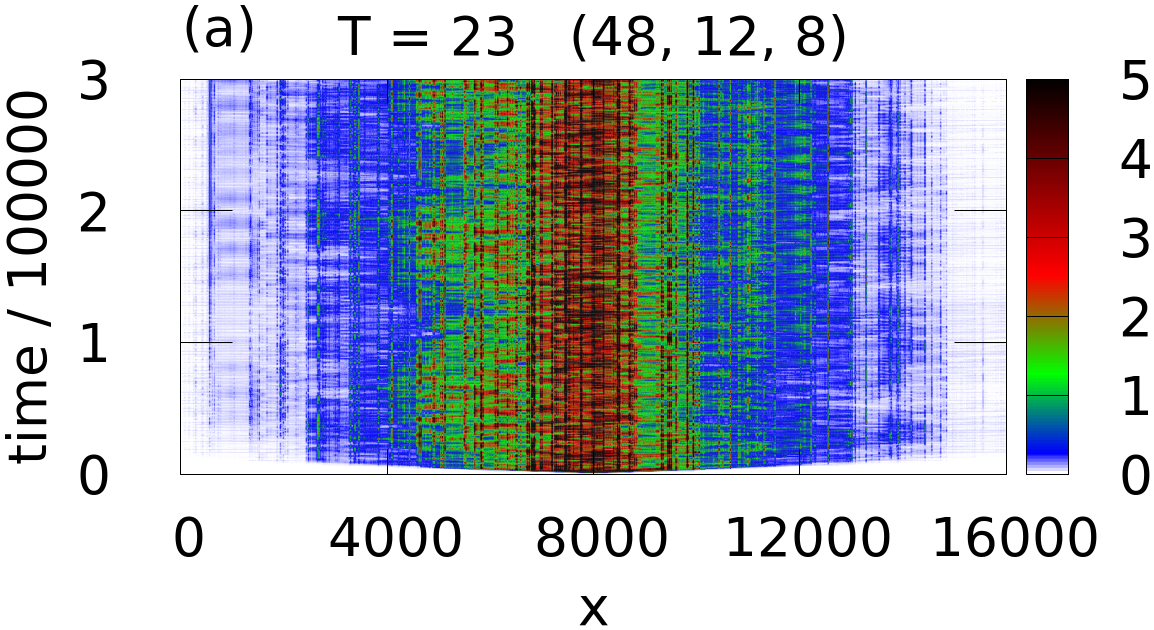
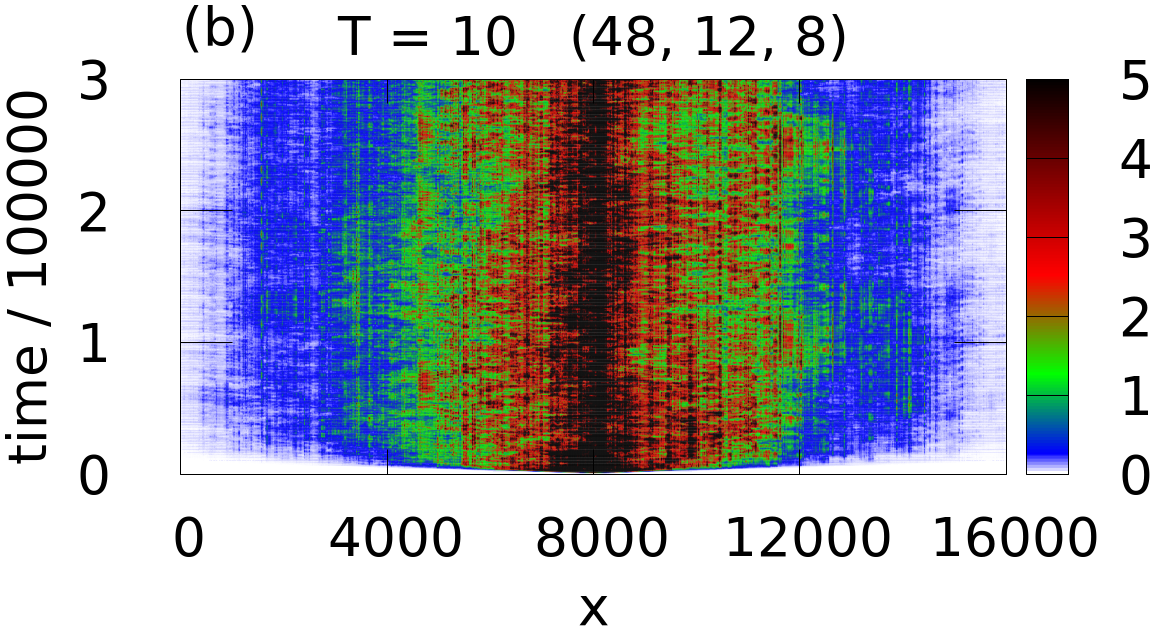
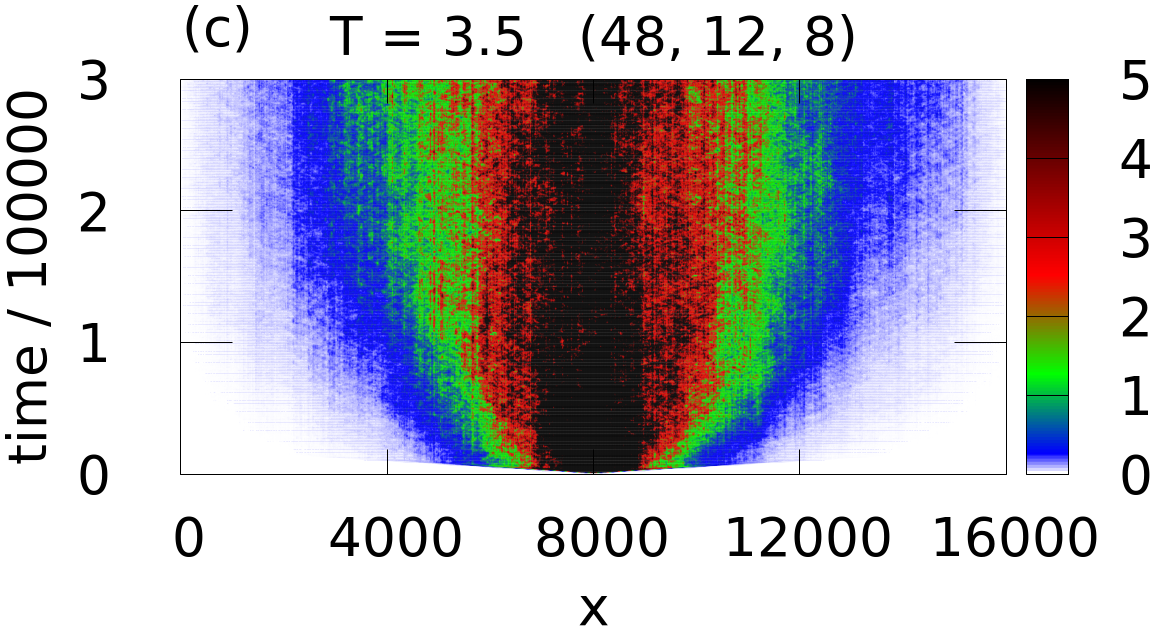
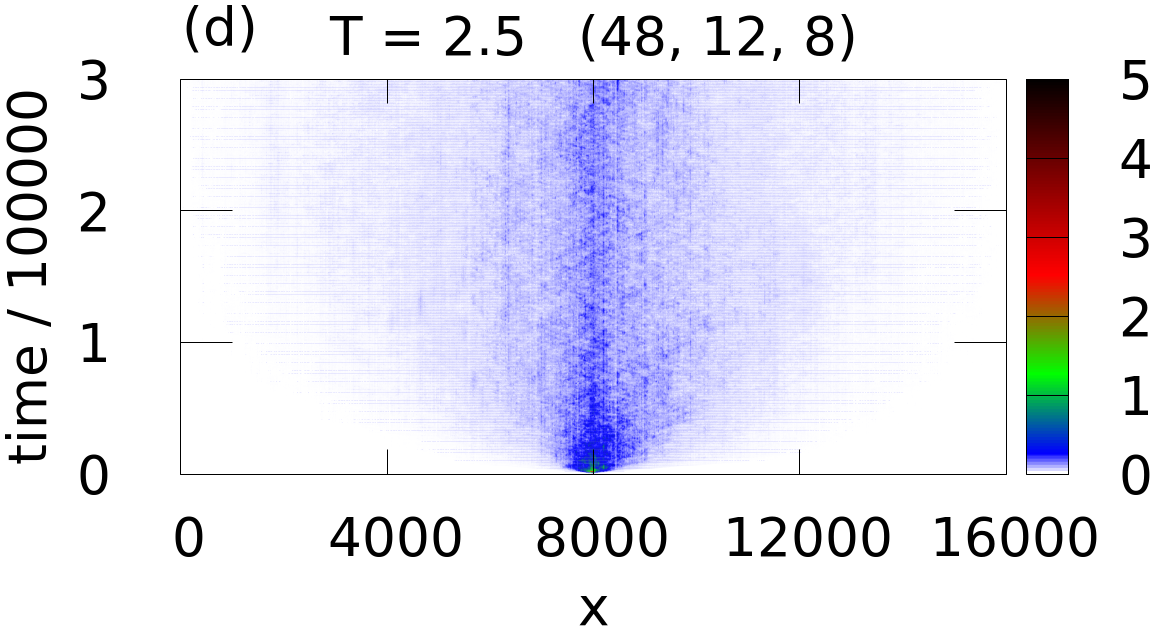
First, in order to verify the hypothesis of universality proposed in [mm, ], namely that the propagation of phonons with a given frequency depends only on , not independently on all the different length scales, we simulated large number of various samples that differ in , and and found that the transport of energy in various samples is similar if theses samples possess similar values of the parameter . As an example, we show in Fig. 6 the time and space evolution of the normalized energy for four disordered systems with different width and disorder but similar values of . More quantitatively, we plot in Fig. 7 the quantity for various disordered samples. Our data show that samples with similar value of exhibit similar time evolution and similar saturation values . Also, increases when increases. This is consistent with the proposal that for a given frequency, localization appears in samples with smaller values of .

For a small value of , we show in Fig. 8 the energy profile for the sample for various periods of the source. Presented results indicate that phonons are localized for any period. For large (small frequency, left upper panel), the transport is suppressed due to the bottleneck effects. This can be concluded from the long vertical lines which indicate strong reflection of waves at a given position. For higher frequencies, localization appears due to large number of resonances. The localization of phonons is confirmed also by the time evolution of the displacement which converges to rather small values for any period and by time evolution of the energy in the central region of the sample which clearly does not decrease with time.


In the opposite limit, weakly disordered samples with large values of exhibit fast decrease of the energy of the system. An example is shown in Fig. 9.
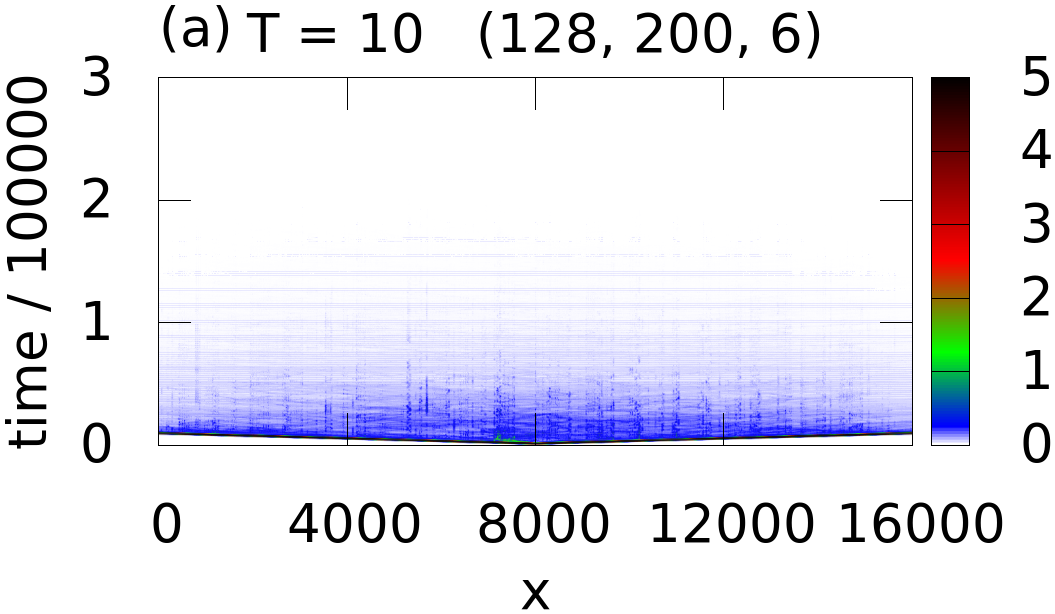

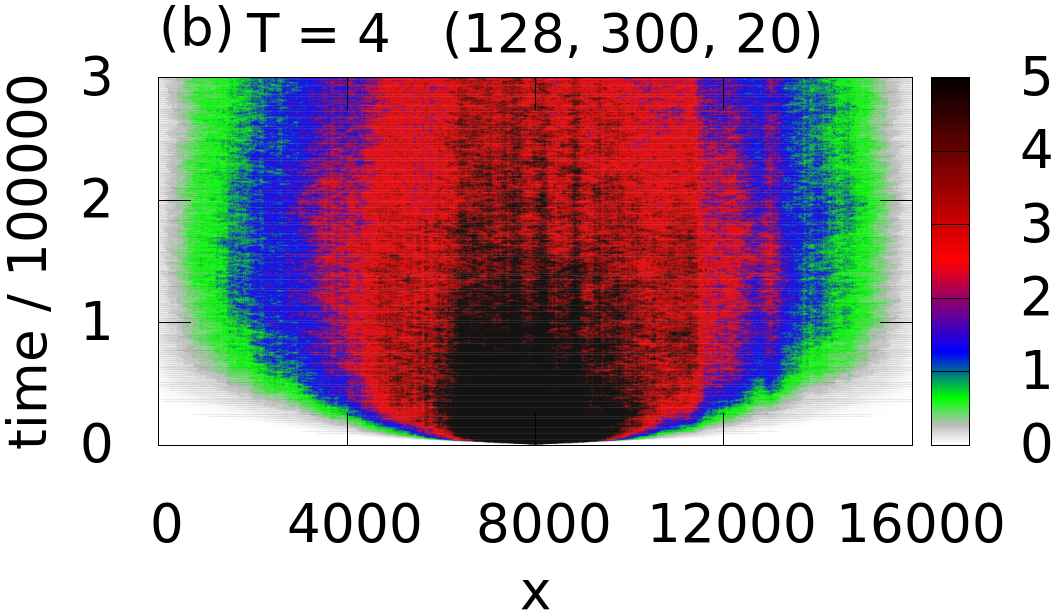
Thus, as shown in Figs. 8 and 9, the time evolution of the energy as well as the mean displacement are good quantitative measures of localization. In the localized regime, the energy does not propagate away from the region of the source. In the highly delocalized regime, decreases exponentially. This exponential decrease, , is observed in various systems with large , and the exponent decreases when decreases. For smaller values of , it is difficult to distinguish between the exponential and a power-law behavior. We expect that adding a weak bulk disorder could make a power-law regime more robust, indicating a diffusive-like regime. Indeed, bulk disorder is always present in real samples, and it can be introduced easily by considering a small amount of different atoms (say, with mass ). As shown in Fig. 10, this indeed generates a clear power-law decrease of the energy .



V Summary and discussion


We argue that nanowires with rough surfaces are good candidates to observe localization of phonons experimentally. By studying numerically the space and time evolution of energy across the length of a nanowire with surface disorder after a heat pulse is injected at some position, we show that it is possible to determine if localized phonons are excited at various positions that might affect the nature of energy transport in the wire. We confirm the universality proposed earlier mm that for a wire of a given length, surface disorder is characterized by a single parameter where is the diameter, is the correlation length and is the mean corrugation height, smaller corresponding to larger disorder. While the values of the individual disorder parameters we choose for our simulation are not necessarily realistic, the universality allows us to consider values of the parameter that are experimentally accessible. For sufficiently small values of , heat pulses (of frequencies within the band) injected into the wire excites long-lived resonances at various positions that depend on the frequency of the heat pulse. By considering the time evolution of the energy content within a region near the pulse as well as the mean displacement away from the pulse we show that energy remains localized for sufficiently large disorder. We show that as increases, localized phonons start to overlap and generate transport that is more diffusive like. Adding a weak bulk disorder makes this transport regime more robust.
Although the observation of individual localized phonons might be difficult in experiment, since it requires very narrow frequency pulse, we believe that the effect of localization is experimentally observable if the time evolution of the injected energy is measured along the sample.
As we indicated in the text, heat transport experiments have observed very small thermal conductivity in surface disordered silicon nanowires hochbaum ; lim . While they are suggestive of the presence of localized phonons mm , it is not a direct observation of phonon localization. Here we note that the values of the universal surface disorder parameter that corresponds to regimes where localized phonons are observed in our simulations are in the same range for the ELE silicon nanowires as reported in Lim et al lim , where it varies from for a wire characterized by to for a wire with . Thus we propose that similar ELE nanowires should be good candidates for experimental studies of localization of phonons.
We note that we have not done any ensemble averaging of that requires considering a large number of samples with different realizations of disorder. Clearly, it would be useful to study such ensemble averaged quantities in order to obtain a more accurate time dependence of the energy. Figure 11 shows one example for an intermediate , where sample to sample fluctuations are already significant. Nevertheless, the qualitative features of the functions or are not sensitive to different realizations of disorder. For example the power-law decay of for all four samples are similar, with exponent that varies between and . Moreover, our analysis of different combinations of length scales leading to similar values of can be thought of as one way of considering different realizations of disorder. Since it involves significant computational time, we argue that an extensive study of ensemble averaging is not necessary for our current limited purposes. It would of course be important if we need to obtain e.g. the exact power law in the diffusive transport regime or the values of where a crossover from the localized to diffusive regime might occur. This crossover is expected to depend on the frequency of the heat pulse, and again, a careful ensemble averaging would be needed to find any possible ‘phase boundary’ in this disorder-frequency space. We leave these interesting questions for future considerations.
VI acknowledgment
We acknowledge financial support from the Slovak Re- search and Development Agency under Contracts No. APVV-16-0372 and APVV-14-0605 and from the agency VEGA under Contract No. 1/0108/17. K.A.M. acknowledges stimulating discussions with A. Majumdar and R. Chen.
References
- (1) P.W. Anderson, Phys. Rev. 109, 1492 (1958).
- (2) P. Lee and T.V. Ramakrishnan, Rev. Mod. Phys. 57, 287 (1985).
- (3) B. Kramer and A. MacKinnon, Rep. Prog. Phys 56, 1469 (1993).
- (4) P. Markoš, Acta Phys. Slov. 56, 561 (2006).
- (5) E. Abrahams, P.W. Anderson, D.C. Licciardello and T.V. Ramakrishnan, Phys. Rev. Lett. 42, 673 (1979).
- (6) S. John, Phys. Rev. Lett. 53, 2169 (1984); P.W. Anderson, Phil. Mag. B52, 505 (1985); S. John, Phys. Rev. Lett. 58, 2486 (1987).
- (7) S. John, Physics Today 44, 32 (1991).
- (8) S. E. Skipetrov and J. H. Page, New J. phys. 18, 021002 (2016).
- (9) H. Hu, A. Strybulevych, J.H. Page, S.E. Skipetrov and B.A. van Tiggelen, Nature Phys. 4, 945 (2008); S. Faez, A. Strybulevych, J.H. Page, A. Lagendijk and B.A. van Tiggelen, Phys. Rev. Lett. 103, 155703 (2009).
- (10) C. Monthus and T. Garel, Phys. Rev. B81, 224208 (2010).
- (11) Y. M. Beltukov and S. E. Skipetrov, Phys. Rev B96, 174209 (2017).
- (12) G.J. Snyder and E.S. Toberer, Nat. Mater. 7, 105 (2008).
- (13) Y. Dubi and M. Di Ventra, Rev. Mod. Phys. 83, 131 (2011).
- (14) T. Takabatake, K. Suekuni, T. Nakayama and E. Kaneshita, Rev. Mod. Phys. 86, 669 (2014).
- (15) S. Hu, Z. Zhang, P. Jiang, J. Chen, S. Volz, M. Nomuro and B. Li, J. Phys. Chem. Lett. 9, 3959 (2018).
- (16) G.A.Slack,in CRC Handbook of Thermoelectrics, edited by D. M. Rowe (CRC Press, Boca Raton, FL, 1995), p. 407.
- (17) D. Li, Y. Wu, P. Kim, L. Shi, P. Yang, and A. Majumdar, Applied Physics Letters 83, 2934 (2003).
- (18) A.I. Hochbaum, R. Chen, R.D. Delgado,, W. Liang, E.C. Garnett, M. Najarian, A. Majumdar and P. Yang, Nature (London) 451, 163 (2008).
- (19) J. Lim, K. Hippalgaonkar, S.C. Andrews, A. Majumdar and P. Yang, Nano Lett. 12, 2475 (2012).
- (20) K. A. Muttalib, and S. Abhinav, Phys. Rev. B 96, 075403 (2017).
- (21) P. Markoš and K.A. Muttalib, Phys. Rev. B97, 085423 (2018).
- (22) A. L. Moore, S. K. Saha, R. S. Prasher, and L. Shi, Appl. Phys. Lett. 93, 083112 (2008).
- (23) D. Lacroix, Appl. Phys. Lett. 89, 103104 (2006).
- (24) D. Donadio and G. Galli, Phys. Rev. Lett. 102, 195901 (2009).
- (25) Y. He and G. Galli, Phys. Rev. Lett. 108, 215901 (2012)
- (26) T. Zushi, K. Ohmori, K. Yamada, and T. Watanabe, Phys. Rev. B 91, 115308 (2015).
- (27) L. Liu and X. Chen, J. Appl. Phys. 107, 033501 (2010).
- (28) D. H. Santamore and M. C. Cross, Phys. Rev. B. 63, 184306 (2001).
- (29) D. H. Santamore and M. C. Cross, Phys. Rev. Lett. 87, 115502 (2001).
- (30) G. B. Akguc and J. Gong, Phys. Rev. B. 80, 195408 (2009).
- (31) J. Hyun Oh, M. Shin, and M.-G. Jang, JAP 111, 044304 (2012).
- (32) A. A. Maznev, Phys. Rev. B 91, 134306 (2015).
- (33) L. N. Maurer, S. Mei, and I. Knezevic, Phys. Rev. B 94, 045312 (2016).
- (34) A. Majumdar, private communications.
- (35) T.F. Rosenbaum, R.F. Milligan, M.A. Paalanen, G.A. Thomas, R.N. Bhatt and W. Lin, Phys. Rev. B 27, 7509 (1983).
- (36) W.H. Press, S.A. Teukolsky, W. T. Vetterling and B. P. Flannery, Numerical Recipes in Fortran 77, 2nd Ed., Cambridge Univ. Press (1992).
-
(37)
R. Clayton and B. Enquist: Bull. of the Seismological Society of America col. 67, n. 6, pp. 1529-1540 (1977).
To avoid the reflection at the boundary and , the Laplace equation in these columns is substituted by
(Eq. 9 of cited paper) which supports only outgoing waves.(9) - (38) N. W. Ashcroft and N. D. Mermin, Solid State Physics, Thomson Learning (1976).
- (39) R. P. Feynman,R. B. Leighton and M. Sands, The Feynman Lectures on Physics, Addison-Westley publ. Comp. (1966).
- (40) Sharp maximum observed for short time is due to ballistic phonons excited by source at the beginning of simulations which transmit a big portion to the energy.