Epitaxial Stabilisation of Alloys
Abstract
The thermodynamic stability of germanium tin alloys is investigated across the composition range by applying density functional theory (DFT) together with the cluster expansion formalism (CE). It is known that GeSn alloys are immiscible and that non-equilibrium growth techniques are required to produce metastable films and nanostructures. Insight into the driving forces behind component segregation is gained by investigating the equilibrium thermodynamics of GeSn systems. The alloy free energy of mixing is computed by combining enthalpies from CE with entropy terms for configurational and vibrational degrees of freedom. Volume deformations due to the large mismatch in ionic radii are readily found to be the key driving force for immiscibility at all temperatures of relevance. This leads to a study of epitaxial stabilisation by employing latticed matched substrates to favour growth of alloys with fractional compositions of , approximately and . Reduction of the free energy of mixing due to epitaxial strain in thin films is quantified for each substrate leading to indicators for growth of kinetically stable films.
I Introduction
Germanium tin (GeSn) alloys have received significant attention over the past decade due to their potential applications in optoelectronic devices.Doherty et al. (2020) At low tin content these alloys have been shown to exhibit a direct energy band gap, making them particularly suitable for photonics devices that promise the possibility of being integrated into silicon-based technologies, as GeSn has been grown employing CMOS-compatible processes.Wang et al. (2007); Conley et al. (2014) Although GeSn alloys with low Sn concentrations have been reported in the literature for some time, progress towards general technological applications has been much slower mainly due to two of its key characteristics: i) Ge and Sn atoms exhibit a large difference in ionic radii which results in a solid solubility of tin in germanium of less than ,Olesinski and Abbaschian (1984) and ii) tin’s stable phase under standard conditions is the tetragonal -Sn structure instead of the preferable cubic -Sn structure, which only becomes stable at temperatures below C at standard pressure. Raynor and Smith (1958) These characteristics result in significant difficulty in incorporating Sn into a cubic Ge lattice without the precipitation of metallic -Sn clusters. Significant progress has been made in recent years towards fabricating GeSn alloys by employing non-equilibrium epitaxial growth techniques such as molecular beam epitaxy (MBE) and chemical vapour deposition (CVD), allowing realization of thin films with thicknesses up to hundreds of nanometres. Piao et al. (1990); Gencarelli et al. (2013); Conley et al. (2014); Wirths et al. (2016); Dou et al. (2018); Wei et al. (2021); Dascalescu et al. (2020); Tai et al. (2020) Moreover, recent studies have reported lasers comprised of thin films with low tin content (), indicating significant advances towards fabrication of alloys with device-grade crystallinity. Wirths et al. (2015); Reboud et al. (2017); Rainko et al. (2019); Elbaz et al. (2020); Chrétien et al. (2019)
Although recent efforts have been focused on low tin content alloys with a direct band gap for applications in photonics, the electronic structure of germanium-tin alloys has been predicted to vary significantly with composition: while the addition of a few atomic percent of tin into germanium induces a transition from indirect to a direct band gap, alloys with larger tin contents exhibit semimetallic behaviour. Polak et al. (2017); O’Donnell et al. Integration of direct band gap into electronic devices promises advantages such as enhanced carrier mobilities, optical interconnects, and improved efficiency in tunnelling-based devices such as tunnelling field-effect transistors (TFETs) or tunnel diodes. Sau and Cohen (2007); Kao et al. (2012); Schulte-Braucks et al. (2015) However, the possibility of increasing tin composition to induce semimetallic regions or to counteract confinement-induced band gap widening in nanoscale devices further increases the technological value of these alloys. With critical dimensions for modern electronics already below nm, designs capable of exploiting semimetals using confinement- and surface-assisted band gap engineering are being considered, and the ability to further modify band gaps by varying alloy composition introduces another parameter to achieve new nanoelectronic device designs. Ansari et al. (2012); Sanchez-Soares and Greer (2016); Ansari et al. (2016); Sanchez-Soares et al. (2016); Gity et al. (2017, 2018) The growth of crystalline alloys with intermediate tin contents has also been experimentally achieved; recently, atomically flat epitaxial films grown on with tin content as high as were reported in the literature. Suzuki et al. (2016) In their study, compressive strain due to high Sn content of films pseudomorphically grown on germanium substrates resulted in crystalline films with a critical thickness of 3 nm. In contrast, the use of lattice-matched substrates has been reported to allow growth of alloys with compositions and even stabilisation of pure -Sn films with thicknesses in excess of 100 nm. Farrow et al. (1981); Hochst and Hernandez-Calderon (1983); Asom et al. (1989); John et al. (1989); Bowman et al. (1990); Piao et al. (1990) Strain reduction by growth on lattice-matched substrates thus allows fabrication of semimetallic with thicknesses on the order of hundreds of nanometres, which is well above the lengths required for nanoelectronic applications.
This work investigates the thermodynamic stability of bulk and epitaxial alloys. Density functional theory (DFT) calculations are performed in conjunction with the cluster expansion (CE) formalism to quantify the magnitude of various contributions to the Helmholtz free energy of mixing that lead to immiscibility in bulk GeSn alloys. The case of epitaxially grown alloys is then explored by analysing the impact of constraining the lattice constant of alloys along a plane on the structural properties and free energy contributions. Results suggest that high tin content alloys may be epitaxially grown by appropriate choice of substrate material and orientation.
II Methods
Computational methods are applied to study the thermodynamic stability of alloys for fractional compositions . The Helmholtz free energy is given by
| (1) |
with the internal energy, the temperature, and the entropy; electronic, vibrational and configurational contributions to the free energy are considered. The configurational contribution to the internal energy is considered using two approximations: the Bragg-Williams (BW) model and the cluster expansion (CE) formalism. Bragg and Williams (1934); Williams (1935a, b); Sanchez et al. (1984) Both methods define the configurational energy in terms of interaction parameters that can be extracted from density functional theory (DFT) calculations using periodic supercells. In the BW model, the bond energies do not account for local variations in the alloy composition, whereas the CE is designed to describe all bonding configurations arising in a random alloy. The DFT calculations applied here to determine the alloy interaction energies employ the usual Kohn-Sham (KS) framework in an implementation using norm-conserving pseudopotentials and linear combination of numerical atomic orbitals (NAO) basis sets.Soler et al. (2002); Ozaki (2003); Ozaki and Kino (2004); Atomistix Toolkit version 2016.4 Pseudopotentials include 4s and 4p electrons to describe germanium and 4d, 5s, and 5p electrons for tin. Basis sets used to expand wavefunctions include s4p4d3f2 NAO for germanium and s2p3d3f2 NAO for tin, where the notation indicates the number of -type, -type, -type, and -type orbitals centred about atoms of each species. Brillouin zone integrations are performed on a -point grid generated according to the Monkhorst-Pack scheme with a density of at least 7 -points / Å-1. Monkhorst and Pack (1976) Real-space quantities are discretised on a grid with a minimum cut-off energy of 100 Hartree. A parametrisation of the local density approximation (LDA) is employed for the exchange-correlation potential. Perdew and Zunger (1981)
Minimisation of the total energy with respect to ionic positions and periodic cell dimensions (geometry optimization) is performed on all supercells to determine relaxed geometries, which are defined as having a maximum force acting on an atom less than a threshold of Å and with all elements of the corresponding stress tensors less than . The inclusion of spin-orbit interactions in the calculations is found to have a relatively small impact on the final atomic positions and total energies for a reference set of alloy supercells and thus is neglected, a finding consistent with a recent study for germanium tin alloys. Polak et al. (2017) However, it is noted that spin-orbit coupling can have a significant influence on KS band dispersions. O’Donnell et al.
The structural properties of tin and germanium in the diamond structure computed with this approach are given in table 1. The calculated equilibrium lattice parameters show agreement with experimentally reported values to within 1%. Farrow et al. (1981); Baker and Hart (1975); Thewlis and Davey (1954) The bulk modulus as calculated for germanium exhibits a deviation of less than 3% with respect to the experimental values obtained from ultrasound techniques, and the calculated bulk modulus for tin in the -phase lies within previously reported values obtained from neutron scattering experiments. Bruner and Keyes (1961); Price et al. (1971); Buchenauer et al. (1971)
The BW model is a mean-field model resulting from a nearest neighbour description for the configurational energy of a substitutional alloy
| (2) |
with and giving the bond energies and number of bonds, respectively, between atoms of type and located on lattice sites. The BW model describes the atom-atom interactions in GeSn alloys solely in terms of the three possible nearest neighbour interaction or bond energies , and yielding an expression as
| (3) |
where is the nearest neighbour coordination number and the number of atoms in a considered cell. Germanium tin alloys under typical experimental growth conditions are random alloys. Biswas et al. (2016); Mukherjee et al. (2017) Topologically, each lattice site is given an occupation Ge or Sn with probability and , respectively, with each lattice site having four nearest neighbours as per bonding in non-amorphous group IV materials. To determine the nearest neighbour interactions in the BW model, energies for the homonuclear bonds Ge-Ge and Sn-Sn are obtained from the DFT total energies for relaxed diamond cells and for isolated Ge and Sn atoms, respectively. For the heteronuclear bond energy, a DFT total energy calculation is performed for a fictitious zinc-blende germanium tin alloy and taking the aforementioned isolated atom simulations as reference. This parametrisation neglects bond energy changes due to local variations in the occupation of nearest neighbour atom sites and from higher coordination shells. However, the BW model yields a useful indicator of alloy stability through the relative binding energy
| (4) |
which provides a comparison of the energy of a heteronuclear bond to the average energy of the homonuclear bonds. The magnitude and sign of the relative binding energy provide a clear and intuitive indication for a preference to segregate or to form a solid solution.
The most severe limitations inherent to the BW model can be overcome by including interactions beyond nearest neighbours through the cluster expansion formalism. By characterizing lattice site occupations using spin variables corresponding to the atom type as , analogous to the Ising model, the configuration within a supercell representing an alloy can be represented by a vector . The internal configurational energy may then expanded as
| (5) |
whereby lattice sites are grouped into clusters denoted with associated pseudospin , which is the average product of lattice site spins over each set of unique clusters, and are effective cluster interactions (ECI). By including all clusters, the internal energy of any alloy configuration can be exactly reproduced. However the main effects of the chemical bonding are generally speaking localized and the magnitudes for the ECIs are found to rapidly decrease with increasing cluster size and range, thus the internal energy of an alloy can be well approximated by truncating the sum in eq. 5 to include relatively small and short range clusters. The ECI in the truncated sum can then be extracted from explicit total energy calculations performed on a relatively small set of configurations in an approach known as the Connolly-Williams method or the structure inversion method. Connolly and Williams (1983) In order to define an optimal set of clusters to include when building the CE for the germanium tin alloys, a set of 47 crystalline test structures with a maximum of 8 atoms per supercell are generated following an algorithm designed to maximise the predictive power of the fit whilst minimising the computational effort of the required first principles calculations. (van de Walle and Ceder, 2002a) The total energies for the test structures are used to extract the ECI coefficients for two atom clusters with a maximum range of 1 nm and for three atom clusters with a maximum range of 0.52 nm. The selection of clusters to include in the CE applies a statistical measure relying on a cross-validation score and variance minimisation techniques to reproduce the supercell energies for the test structures. Stone (1974) The resulting cross validation score is 5 meV/atom, which is comparable to the error expected from the DFT energies used to determine the ECI values.
| (Å) | (GPa) | |||
|---|---|---|---|---|
| This work | Exp. | This work | Exp. | |
| Ge | Baker and Hart (1975) | Bruner and Keyes (1961) | ||
| Sn | Farrow et al. (1981); Thewlis and Davey (1954) | Price et al. (1971); Buchenauer et al. (1971) | ||
The temperature dependence of the free energy requires determination of the configurational, electronic and vibrational contributions to the entropy. The configurational entropy is estimated in a first approximation by enumerating unique atomic configurations for a random alloy at each composition. Electronic contributions to the free energy are computed from a temperature-independent, one-electron band model employing the density of states calculated from DFT. Wolverton and Zunger (1995); van de Walle (2009) These electronic band calculations are performed with a set of supercells designed to mimic the radial correlation functions of random alloys known as special quasirandom structures (SQS); Zunger et al. (1990); Hass et al. (1990) 64-atom cubic supercells ( simple cubic) have been generated stochastically using a simulated annealing procedure. Van de Walle et al. (2013) The dimensions of generated SQS allow targeting the site-site correlations of clusters found to be most relevant by the CE whilst maintaining DFT calculations tractable. Vibrational contributions to the free energy are estimated using a bond stiffness versus bond length model. Within this model, force constant tensors are obtained by computing reaction forces on crystalline structures with slight atomic displacements and at varying levels of strain. van de Walle and Ceder (2002b); Fultz (2010) Three crystalline structures are chosen: i) elemental Ge; ii) elemental Sn; and again iii) a fictitious GeSn zinc-blende structure. Cubic supercells with 64 atoms are employed such that the minimum distance between displaced atoms is at least 1.2 nm. Reaction forces are computed at 10 different levels of strain and for atomic displacements limited to 0.02 nm away from ideal lattice sites. The force constant tensors are used to perform a polynomial fit relating bond lengths to bond stiffness; this parametrisation can then be used on arbitrarily large supercells to calculate phonon frequencies and determine vibrational contributions to the free energy . Bozzolo et al. (2007) Additional details on the bond stiffness vs. bond length model and comparisons of extracted vibrational properties with experimental literature are provided as Supplementary Information.
Two cluster expansions are defined: the cluster expansion of the configurational energy from a set 47 crystalline cells as described previously, and a second expansion for the temperature-dependent vibrational contributions to free energy computed from 64-atom SQS. These two expansions can then be merged to produce a set of temperature dependent ECI. In the following, it will be shown that the electronic contributions to the free energy are negligible, and as such are ignored. Once the TECI are determined, they can be implemented in semi-grand canonical ensemble Monte Carlo simulations to calculate a phase diagram. Configurational entropy contributions are readily included in the MC method as the simulation samples accessible configurations at a given temperature. In the semi-grand canonical ensemble, the number of atoms is fixed, with the energy and composition allowed to fluctuate based on an externally imposed difference in chemical potential between the two atom types as well as an externally imposed temperature. van de Walle and Asta (2002) Supercells based on a face-centred cubic primitive cell () and with a corresponding lattice constant of 26 nm and 1,185,408 atomic sites are employed for an improved description of long-range order and ensemble averages. The number of equilibration passes and the averaging passes are determined based on a target precision of for the atomic composition of the phase. The phase diagram across the full alloy composition range is then determined using the procedure described in ref. van de Walle and Asta, 2002.
III Results and Discussion
III.1 Bulk alloys
The configurational energy of mixing or formation energy is evaluated in a first approximation using the BW model for the composition range . Computed nearest neighbour interactions result in a relative binding energy value of : although its positive sign indicates phase segregation is energetically favourable, its magnitude is near the precision limit of DFT simulations employed in its calculation. Thus while the BW model predicts a slight preference for the system to segregate, kinetically grown, strain-free metastable alloys could exhibit random species distribution due to the relatively large energetic cost of rearranging bond types when compared to predicted stability gains. The magnitude of the relative binding energy also suggests that entropy contributions to the free energy may have a substantial impact on reducing the the free energies for mixing tending to stabilise metastable structures at typical growth temperatures.
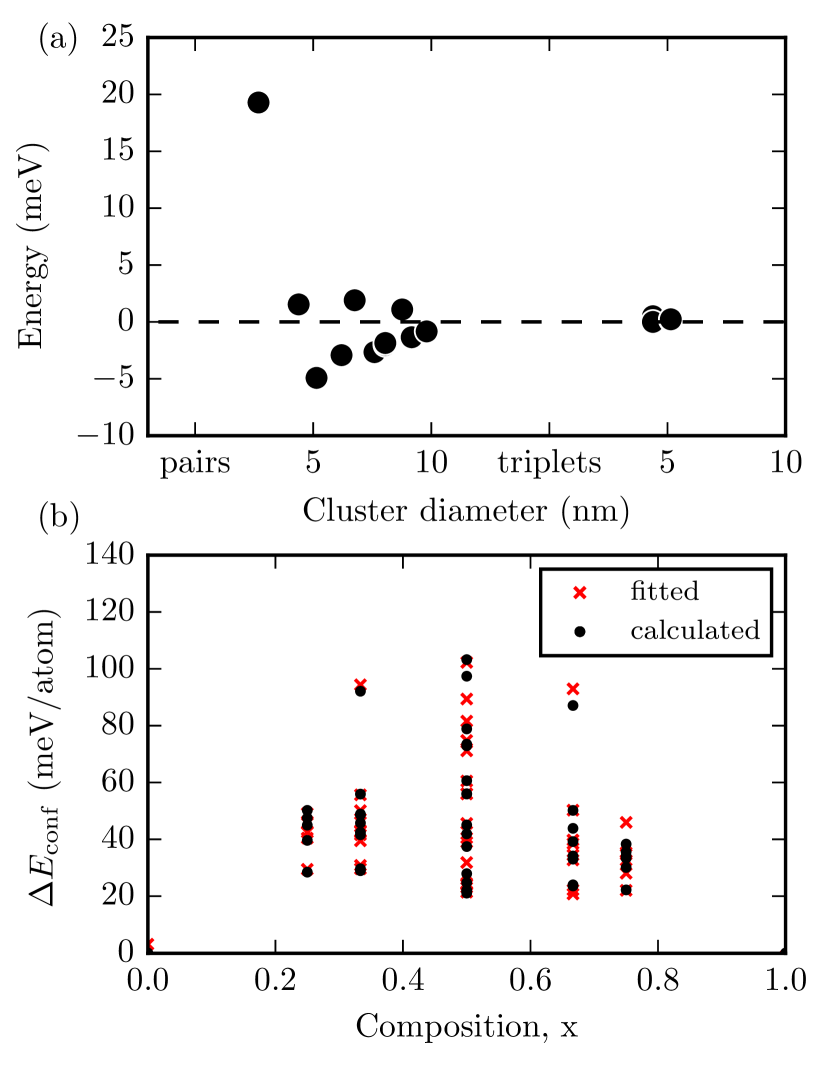
To provide a more accurate treatment of the free energies and to identify the dominant stabilising effects for germanium tin alloys, the CE is applied to account for configurational variations beyond the nearest neighbour description provided by the BW model. Figure 1(a) shows the extracted ECI coefficients for the CE. The magnitude of two-atom cluster ECIs are seen to decay rapidly with distance from a maximum of approximately 20 meV/atom for the nearest-neighbour pair cluster to less than 5 meV/atom for longer range pairs. The ECIs of the three-atom clusters are an order of magnitude smaller than typical values for pair clusters, with a maximum value of 0.5 meV/atom. Consistent with the simple BW analysis and in agreement with experiment, the CE results also predict germanium and tin to be immiscible at zero temperature and thermodynamic equilibrium as shown in fig. 1(b).
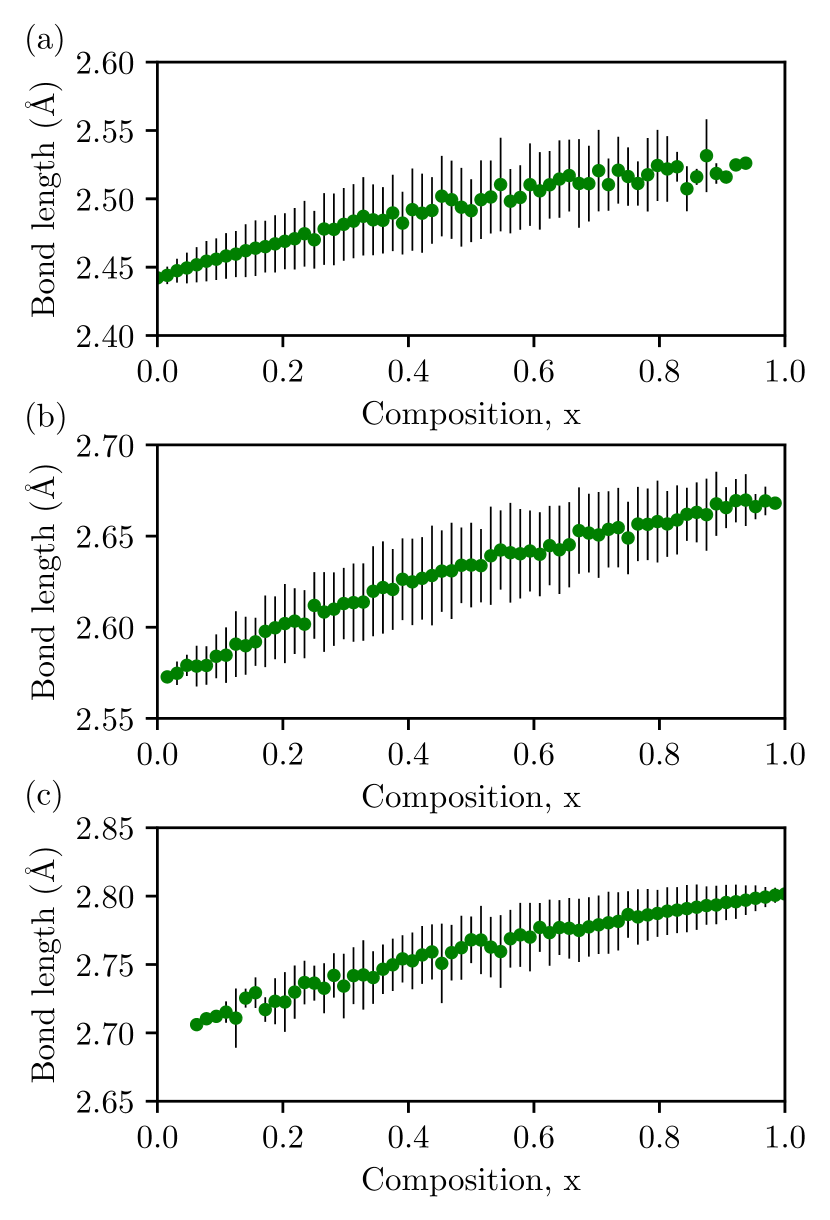
Results obtained with lattice models are compared directly to DFT calculations over the set of 64-atom SQS. Atomic positions and lattice constants in the SQS are relaxed using DFT by constraining the cell shape to cubic while allowing the cell volume to vary, an approach previously argued to provide total energies representative of disordered states. Ghosh et al. (2008) Figure 2 shows the evolution of Ge-Ge, Ge-Sn, and Sn-Sn bond lengths with alloy composition as determined from SQS. Bond lengths calculated for low Sn composition deviate less than 2% with respect to values reported in previous theoretical and experimental literature.O’Halloran et al. (2019); Gencarelli et al. (2015) The difference in atomic radii between Ge and Sn and the local variations in chemical environments result in bond lengths with standard deviations on the order of 1% at intermediate compositions. The alloy lattice constants are compared to literature values by fitting the optimized SQS lattice constants at varying compositions using
| (6) |
from which a bowing parameter value of nm is obtained, consistent with values reported in other recent theoretical and experimental works. Gencarelli et al. (2013); Xu et al. (2017); Polak et al. (2017)
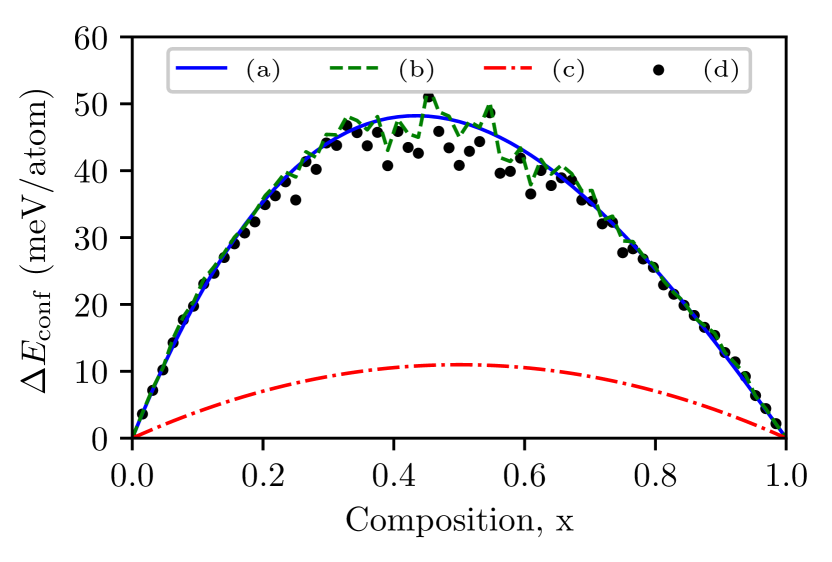
Figure 3 compares the formation energy of random alloys across the full composition range as predicted with the BW model, the cluster expansion, and from DFT calculations of SQS. It is observed that although the BW model correctly predicts immiscibility, it underestimates the formation energy of GeSn random alloys by an order of magnitude with respect to results obtained from the CE fit and from 64-atom SQS. Hence there is a stronger tendency for germanium and tin to segregate than the local bond analysis from the BW model indicates. The improved treatment by the CE is seen through its ability to reproduce the energies of relaxed SQS with an RMS error of 2 meV/atom (green dashed curve).
The free energy at finite temperature has been computed by including the electronic, vibrational, and configurational contributions. Electronic contributions are computed from the density of states using the KS band structures obtained for the SQS. The vibrational contributions are calculated by the bond stiffness versus bond length model, and configurational entropy is estimated by enumerating unique configurations at a given composition for a cell containing a large number of atoms, using the Boltzmann entropy expression and Stirling’s approximation to yield
| (7) |
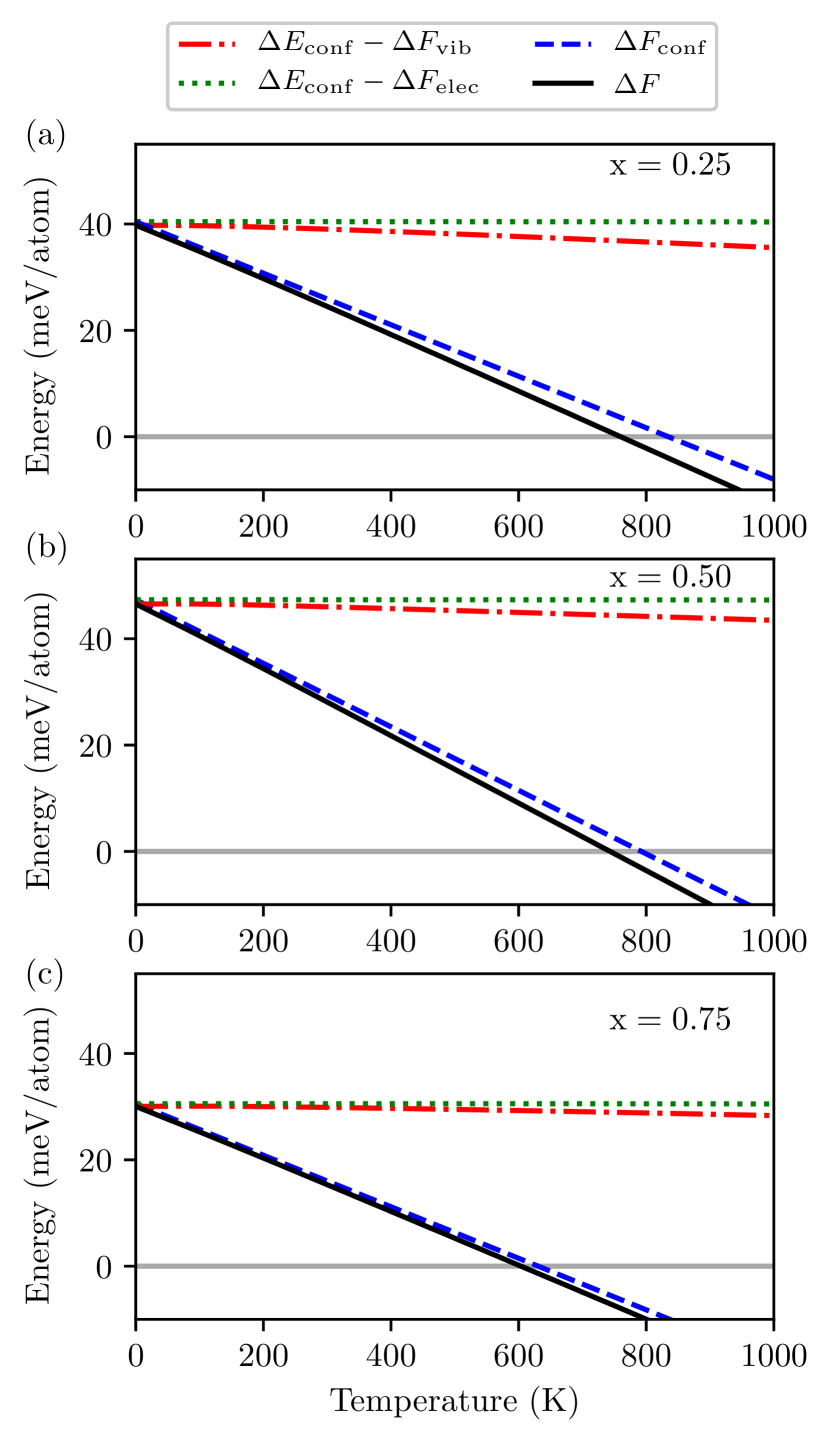
with Boltzmann’s constant. We note that while this simplified approach assumes all alloy configurations at a given composition are equally accessible and thus represents an upper limit to configurational entropy, it provides estimates useful for comparing the magnitude of various contributions to free energy. Figure 4 shows the resulting temperature dependence of the total free energy of mixing and its various contributions for the representative compositions of , , and ; it is seen that the calculated electronic entropy contributions remain below 1 meV/atom for temperatures up of 1000 K for all three alloy compositions. The configurational entropy contributions dominate the temperature dependence of the free energy of mixing and serve as the main stabilising force at all temperatures of interest, with vibrational contributions favouring alloy formation to a lesser degree. The critical temperature, i.e. temperatures at which the disordered phase becomes energetically favourable, is seen to decrease for larger tin compositions in a result attributable to the asymmetry observed in fig. 3 for the composition-dependent formation energy ; while this asymmetry is reproduced by both the CE fit and SQS calculations, the formation energy in the BW model reduces to which is symmetric about .
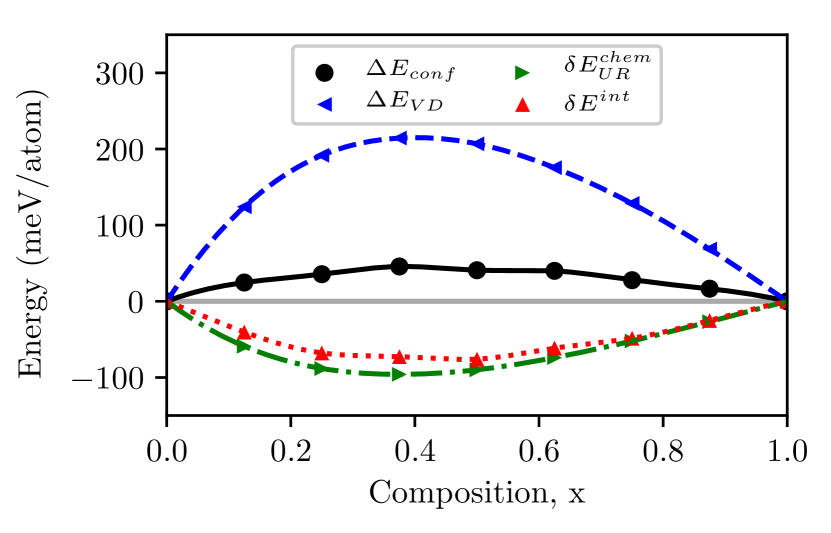
To further investigate the origin of the asymmetry, the formation energy is partitioned as
| (8) |
where the three contributions correspond to the volume deformation energy, the chemical or spin-flip energy, and the internal relaxation energy. The volume deformation energy is defined as the energy required to hydrostatically strain Ge and Sn cells to the equilibrium lattice parameter corresponding to a specific alloy composition. The resulting strain energies are weighted by their respective fractional compositions in the alloy
| (9) |
where is the energy for = {Ge,Sn} at the equilibrium lattice constant for ={Ge,Sn, Ge1-xSnx}. The chemical or spin-flip energy corresponds to the energy gained when germanium and tin atoms occupying (unrelaxed–) diamond lattice sites form heteronuclear bonds
| (10) |
The internal relaxation energy is the energy gained when the atomic positions in an alloy are allowed to relax by displacing them from the ideal diamond lattice sites:
| (11) | |||
where and indicate whether the atomic positions are relaxed or constrained to the ideal diamond lattice sites, respectively. Figure 5 shows the dependence of each contribution as computed for 64-atom SQS across the composition range, and table 2 lists their magnitude at compositions x=0.25, x=0.50, and x=0.75. The large difference between the Ge and Sn equilibrium lattice parameter results in the volume deformation energy dominating and destabilising the alloys, and the marked asymmetry observed for this quantity can be ascribed to the significant difference between components’ bulk moduli; the volume expansion required to accommodate Sn into Ge-rich alloys increases formation energy significantly more than the corresponding volume contraction associated with incorporation of Ge into Sn-rich alloys. Contributions arising from chemical interactions between different atomic species and the relaxation of internal coordinates are of a similar magnitude and act to stabilise the alloys, partially offsetting the effects of the volume deformations. Although the magnitude of stabilising contributions correlates with the magnitude of volume deformation energies, the asymmetry present in the latter dominates formation energies and thus results in larger destabilisation for germanium-rich alloys compared to tin-rich alloys.
| Composition | ||||
|---|---|---|---|---|
| (x) | (meV/atom) | |||
| 0.25 | 36 | 192 | -88 | -67 |
| 0.50 | 41 | 207 | -90 | -76 |
| 0.75 | 28 | 128 | -52 | -48 |
The impact of the asymmetry on the system’s critical temperature is revealed by the phase boundary between the disordered phase (i.e. random alloy) and decomposition into the elemental phases. Lattice model Monte Carlo simulations employing the CE fit enable larger supercells than tractable with DFT to be studied, resulting in a much improved treatment for ensemble averages over large numbers of alloy configurations. Temperature effects are included by combining ECIs describing the internal configurational energies with configurational and vibrational free energy contributions. The resulting phase diagram for is shown in fig. 6, where two horizontal lines indicating the temperatures for the phase transition and melting point of tin have been included for reference. The higher transition temperatures found with this method when compared to those shown in fig. 4 are attributed to a more accurate treatment of configurational entropy contributions, as the MC simulation accounts for energy variations across alloy configurations. Germanium-rich alloys with compositions up to are predicted to be stable below the eutectic temperature, in agreement with previous reports;Olesinski and Abbaschian (1984) for tin-rich alloys stability is only observed for compositions at temperatures where -Sn remains stable. Predicted critical temperatures at intermediate compositions are well above the melting temperature for tin. These results clearly indicate that growth of bulk equilibrium alloys at technologically relevant compositions is not possible at standard pressure. It is worth noting that inclusion of vibrational free energy contributions reduces predicted critical temperatures, with larger reductions for germanium-rich compositions. This can be attributed to a stabilising effect associated from softening of phonon modes by addition of tin, partially counteracting the destabilising effects of volume deformations. Gassenq et al. (2017); Xu et al. (2019); Bouthillier et al. (2020)
III.2 Epitaxial alloys
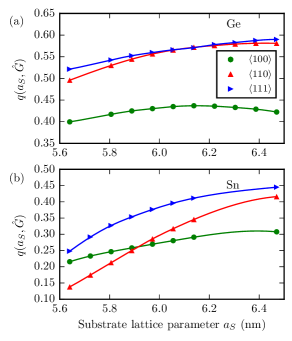
The primary factor leading to the high critical temperatures has been shown to arise from the large difference in equilibrium volumes for germanium and tin. Although these findings can be anticipated based on the large difference between the atomic radii of germanium and tin, the purpose of this work is to quantify the magnitude of the energies required to be overcome to stabilise thin films. By coherent epitaxial growth, the lattice spacing parallel to a substrate can to a large extent be constrained within a thin film and result in stabilisation.Wood and Zunger (1988); Zunger and Wood (1989); Ozoliņš et al. (1998a) The extent to which coherent growth can stabilise germanium tin alloys is examined by constraining lattice parameters for the SQS along a selected plane to mimic the effect of growth on substrates for which epitaxially stable films of -Sn and/or germanium-tin alloys have already been demonstrated, namely: (0.564 nm), (0.610 nm), and (0.648 nm). Farrow et al. (1981); Hoffman et al. (1989); John et al. (1989); Bowman et al. (1990); Calavita et al. (1990); Piao et al. (1990) To explore the most promising orientations for stabilising the alloys by coherent growth, an epitaxial softening function is defined as
| (12) |
which is the ratio between the increase in energy due to biaxial strain as a result of epitaxial growth along a direction on a substrate with lattice constant , and the increase in energy due to hydrostatically straining to the substrate lattice constant . The ratio between the two energies quantifies the degree to which out-of-plane relaxation can stabilise an epitaxially grown thin film, with lower values of signalling increased stability. Lower values of the softening function in general imply a reduction in the formation of dislocations and other strain-induced film or surface defects.Ozoliņš et al. (1998b) Figure 7 shows the epitaxial softening functions of germanium and tin as computed with DFT; it is seen that is the softest direction for germanium and tin for values of in the vicinity of their equilibrium lattice constants. This conclusion is retained at all compositions if the alloy epitaxial softening function is estimated as a weighted sum of the elemental softening functions. This suggests that -oriented films will tend to minimise internal strain energy and thus structural defects for epitaxially coherent films, and is consistent with at least one experimental analysis. Asano et al. (2014)
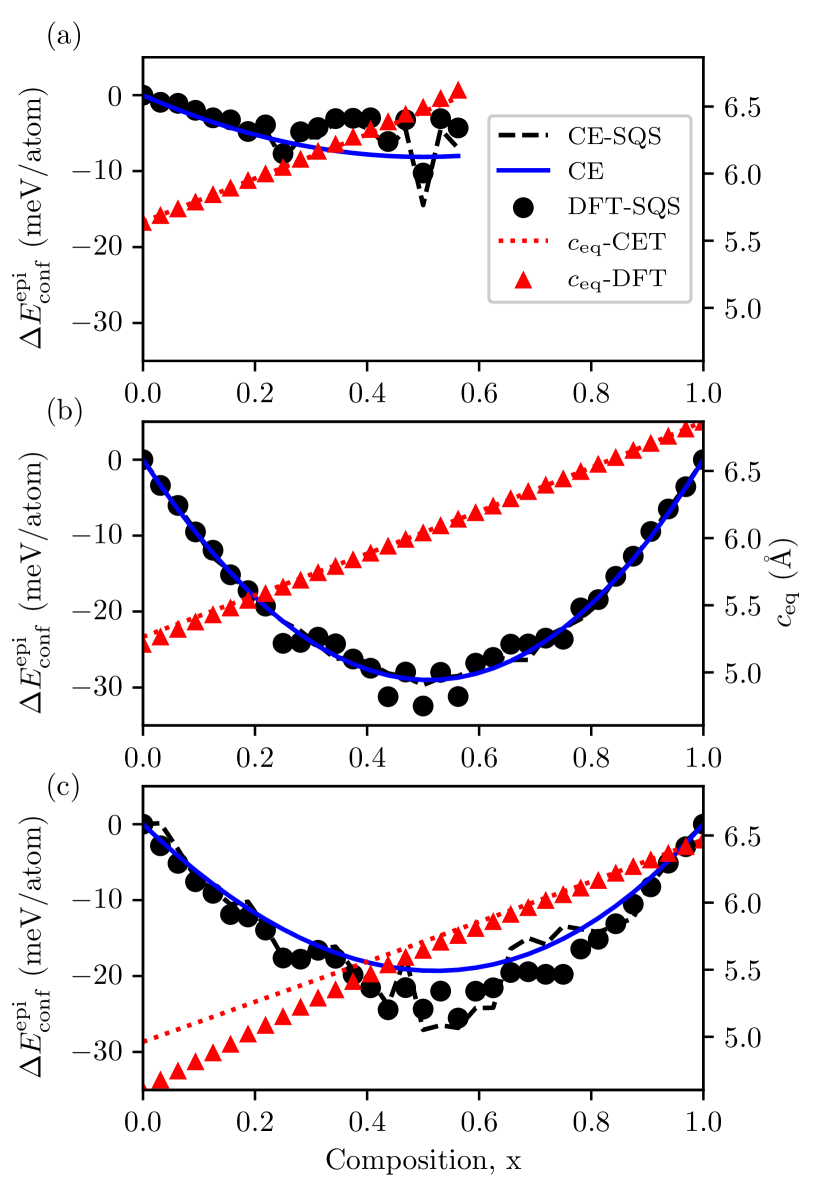
Epitaxial growth on (001)-oriented substrates is evaluated by constraining the lattice parameters of 64-atom SQS along and to match the lattice spacing to that of the three substrates under consideration. The third lattice parameter for each supercell is allowed to relax. This scheme neglects the role of surface and interfacial effects, but it does provides a baseline for the energetics of the alloy compositions independent of these effects. Figure 8 shows the computed epitaxial formation energy relative to decomposition into the coherently strained elemental constituents. In this case, the substrates suppress the tendency to segregate due to the coherent strain assumed for the segregated elemental components leading to a stabilisation of the alloys even at zero temperature. Note geometry optimizations for SQS biaxially strained to the Ge lattice constant with compositions above resulted in amorphous structures and thus are not included in the analysis of Figure 8(a). Formation energies obtained from DFT calculations have been used to fit cluster expansion ECIs in order to investigate the case of random alloys and eliminate restrictions on the cluster ensemble averages arising from the use of the SQS approach. The CE predict all alloys to be energetically favourable with respect to coherent decomposition with a trend whereby stability decreases along the (ZnTe/GaSb)-(CdTe/InSb)-Ge sequence, indicating growth on germanium to be the least favourable choice for alloy growth if coherent decomposition is assumed. Additionally, fig. 8 includes the magnitude of the out-of-plane lattice parameter for each substrate as computed with DFT for SQS and a continuum elasticity theory (CET), Zunger and Wood (1989) where good agreement between both methods is found across most of the composition range in Ge and ZnTe/GaSb substrates. However, significant deviations between the two approaches are seen at low tin content alloys coherent to CdTe/InSb substrates due to anharmonic effects at these large strains not taken into account within CET. From analysis of the vibrational contributions to the free energy in a manner similar to fig. 4, it is found that the aforementioned sequence in pseudomorphic alloy stability is maintained at finite temperatures, although we note that the bond stiffness vs. bond length model and harmonic approximation employed in this work are inadequate to describe the vibrational properties of pseudomorphic germanium and tin with up to 15% biaxial strain, as evident from calculations employing CET.
Decompositions of epitaxial formation energies akin to those defined for bulk alloys in eq. 8 are presented in table 3 for alloys at a composition . The effects of growth on lattice-matched substrates can be observed in the formation energy decomposition corresponding to the ZnTe/GaSb substrates. Whereas the computed epitaxial spin-flip and internal relaxation energies remain similar to the values found for bulk alloys, the volume deformation energy relative to epitaxially coherent decomposition is reduced by resulting in the observed enhancement to stability. By comparing results across the different substrates, it is observed that destabilisation of component segregation results in an overall reduction of with increasing substrate lattice parameter due to germanium’s larger bulk modulus. However, the magnitudes of stabilising contributions and are observed to also decrease with increasing bond lengths associated with alloys grown on substrates with larger lattice spacings. This leads to the ZnTe/GaSb substrate exhibiting the lowest value of across the three substrates.
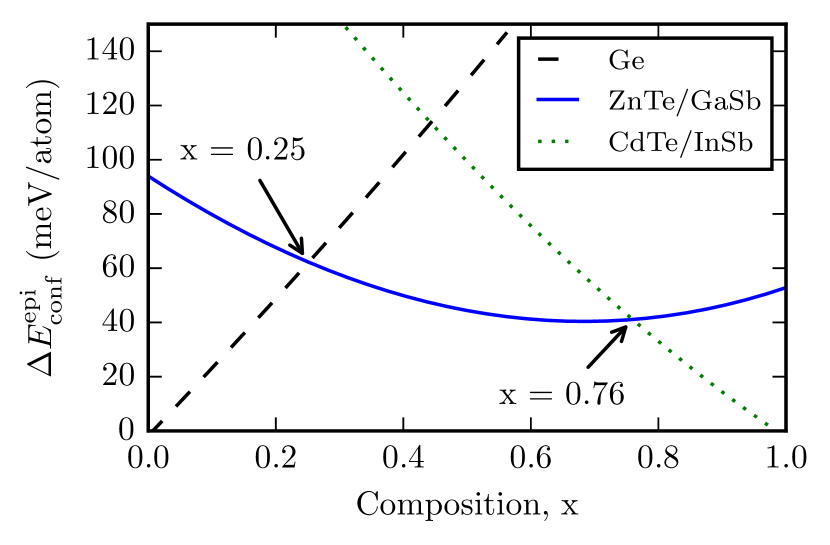
As a final point, the relative stability of the alloys grown on different substrates in fig. 9 are compared by computing the formation energy for epitaxial alloys with respect to non-coherent decomposition into their (unstrained) bulk elemental components. The substrate providing the lowest formation energy, and thus highest stability with respect to segregation, is observed to depend on alloy composition. Within the set of substrates considered, Ge is preferred for compositions below , CdTe/InSb for compositions above , and ZnTe/GaSb for , indicating the latter to be energetically favourable across much of the composition range where the alloy exhibits are expected to display semimetallic behaviour. The asymmetry discussed for bulk alloys whereby tin-rich compositions have relatively lower formation energies is also present for alloys grown on ZnTe/GaSb, as seen in fig. 9.
| Substrate | ||||
|---|---|---|---|---|
| (meV/atom) | ||||
| Ge | -10 | 195 | -107 | -97 |
| ZnTe/GaSb | -32 | 131 | -89 | -75 |
| CdTe/InSb | -24 | 114 | -76 | -62 |
IV Conclusion
A study for the thermodynamic stability of GeSn alloys has been undertaken with models for both relaxed and pseudomorphic thick GeSn layers. A CE fit is performed and demonstrated to be capable of reproducing energies from DFT calculations for SQS across the full alloy composition range. From the CE, an asymmetry in the formation energies of random alloys as a function of alloy composition is identified whereby introduction of Sn into Ge-rich alloys results in larger formation energies relative to the case of introducing Ge into Sn-rich alloys. A partitioning of the formation energy into a volume deformation, chemical and relaxation terms reveals the volume deformation energy dominates the zero-temperature formation energies and drives immiscibility for these alloys with the chemical and relaxation energies serving to reduce the formation energies. Evaluation of free energy at finite temperatures reveals the configurational entropy dominates stabilising contributions with vibrational terms contributing to a lesser extent, and the electronic contributions have negligible impact in the temperature range of interest. CE fits describing configurational and temperature-dependent vibrational properties are employed to calculate the system’s phase diagram using lattice Monte Carlo simulations. It is shown that the critical temperature for stability of Ge1-xSnx alloys generally decreases at higher Sn composition as a result of the aforementioned asymmetry in the formation energy versus composition. As well, vibrational terms introduce an opposing asymmetry in the phase diagram whereby the stability of Ge-rich alloys is enhanced at finite temperatures due to the softening of phonon modes associated with incorporation of Sn into the lattice. The phase diagram identifies critical temperatures between the range of the melting temperatures for Sn and Ge for essentially the entire composition range, in good agreement with known experimental properties for bulk GeSn alloys. It should be noted that relaxation in thin films or nanowires can be enhanced by strain relaxation normal to the surfaces and can serve to stabilise nanostructures.
The influence of pseudomorphic growth on stability was considered by studying alloys biaxially strained to the lattice spacing of substrates previously used for coherent epitaxial growth of Ge1-xSnx which provide lattice matching at compositions x=0, and approximately for x=0.5 and x=1. The preferred growth orientation is analysed with the epitaxial softening function which indicates the (001)-orientation is preferable at small to moderate strains. Analysis of the formation energies reveals pseudomorphic growth enhances alloy stability by impeding coherent segregation resulting in alloy stability even at zero temperature. Growth on ZnTe/GaSb substrates is predicted to provide the greatest epitaxial stabilisation across most of the composition range. Comparing pseudomorphic formation energies across substrates with respect to incoherent segregation reveals ZnTe/GaSb to be energetically favourable across approximately half of the composition range (), with Ge (CdTe/InSb) substrates providing greater stability for (). This result correlates with a recent study where similar crossing points were determined when computing thin film critical thicknesses using continuum elasticity theory. O’Donnell et al. (2020) It is worth noting that even though, for example, the results for the formation energies for an x=0.25 alloy grown on either Ge or ZnTe/GaSb substrates are predicted to be comparable, their resulting electronic properties can be significantly different. Recent calculations report the compressive strain built into Ge0.75Sn0.25/Ge results in a zero band gap semimetal band structure, whereas the tensile strain built into Ge0.75Sn0.25/ZnTe leads to a band overlap (negative band gap) of approximately 600 meV. O’Donnell et al. (2020)
Results presented in this work emphasise built-in strain to be the driver of immiscibility in Ge1-xSnx alloys. Strategies for stabilisation must thus be directed at tackling this issue by balancing several complementary effects such as relaxation normal to surfaces in nanostructures, by targeting Sn-rich compositions, and by choice of substrates that induce epitaxial stabilisation of alloys while delivering suitable critical thicknesses and electronic properties. In the context of materials engineering, selection of alloy composition, strain, film thickness (quantum confinement), and surface chemistry enables a wide range of options for the tailoring of the thermomechanical and electronic properties of GeSn alloys for technological applications.
Acknowledgements.
This work was funded by Science Foundation Ireland through a Principal Investigator award Grant No. 13/IA/1956, by the Nottingham Ningbo New Materials Institute, and the National Science Foundation of China Project Code 61974079.References
- Doherty et al. (2020) J. Doherty, S. Biswas, E. Galluccio, C. A. Broderick, A. Garcia-Gil, R. Duffy, E. P. O’Reilly, and J. D. Holmes, Chemistry of Materials 32, 4383 (2020).
- Wang et al. (2007) G. H. Wang, E.-H. Toh, X. Wang, D. H. L. Seng, S. Tripathy, T. Osipowicz, T. K. Chan, K. M. Hoe, S. Balakumar, C. H. Tung, G.-Q. Lo, G. Samudra, and Y.-C. Yeo, in 2007 IEEE International Electron Devices Meeting (IEEE, 2007).
- Conley et al. (2014) B. R. Conley, A. Mosleh, S. A. Ghetmiri, W. Du, R. A. Soref, G. Sun, J. Margetis, J. Tolle, H. A. Naseem, and S.-Q. Yu, Optics Express 22, 15639 (2014).
- Olesinski and Abbaschian (1984) R. W. Olesinski and G. J. Abbaschian, Bulletin of Alloy Phase Diagrams 5, 265 (1984).
- Raynor and Smith (1958) G. V. Raynor and R. W. Smith, Proceedings of the Royal Society of London. Series A. Mathematical and Physical Sciences 244, 101 (1958).
- Piao et al. (1990) J. Piao, R. Beresford, T. Licata, W. Wang, and H. Homma, Journal of Vacuum Science & Technology B: Microelectronics Processing and Phenomena 8, 221 (1990).
- Gencarelli et al. (2013) F. Gencarelli, B. Vincent, J. Demeulemeester, A. Vantomme, A. Moussa, A. Franquet, A. Kumar, H. Bender, J. Meersschaut, W. Vandervorst, R. Loo, M. Caymax, K. Temst, and M. Heyns, ECS Transactions 50, 875 (2013).
- Wirths et al. (2016) S. Wirths, D. Buca, and S. Mantl, Progress in Crystal Growth and Characterization of Materials 62, 1 (2016).
- Dou et al. (2018) W. Dou, M. Benamara, A. Mosleh, J. Margetis, P. Grant, Y. Zhou, S. Al-Kabi, W. Du, J. Tolle, B. Li, et al., Scientific reports 8, 5640 (2018).
- Wei et al. (2021) L. Wei, Y. Miao, R. Pan, W. wei Zhang, C. Li, H. Lu, and Y.-F. Chen, Journal of Crystal Growth 557, 125996 (2021).
- Dascalescu et al. (2020) I. Dascalescu, N. C. Zoita, A. Slav, E. Matei, S. Iftimie, F. Comanescu, A.-M. Lepadatu, C. Palade, S. Lazanu, D. Buca, V. S. Teodorescu, M. L. Ciurea, M. Braic, and T. Stoica, ACS Applied Materials & Interfaces 12, 33879 (2020).
- Tai et al. (2020) Y.-C. Tai, P.-L. Yeh, S. An, H.-H. Cheng, M. Kim, and G.-E. Chang, Nanotechnology 31, 445301 (2020).
- Wirths et al. (2015) S. Wirths, R. Geiger, N. von den Driesch, G. Mussler, T. Stoica, S. Mantl, Z. Ikonic, M. Luysberg, S. Chiussi, J. M. Hartmann, H. Sigg, J. Faist, D. Buca, and D. Grutzmacher, Nature Photonics 9, 88 (2015).
- Reboud et al. (2017) V. Reboud, A. Gassenq, N. Pauc, J. Aubin, L. Milord, Q. Thai, M. Bertrand, K. Guilloy, D. Rouchon, J. Rothman, et al., Applied Physics Letters 111, 092101 (2017).
- Rainko et al. (2019) D. Rainko, Z. Ikonic, A. Elbaz, N. von den Driesch, D. Stange, E. Herth, P. Boucaud, M. E. Kurdi, D. Grützmacher, and D. Buca, Scientific Reports 9, 259 (2019).
- Elbaz et al. (2020) A. Elbaz, D. Buca, N. von den Driesch, K. Pantzas, G. Patriarche, N. Zerounian, E. Herth, X. Checoury, S. Sauvage, I. Sagnes, A. Foti, R. Ossikovski, J.-M. Hartmann, F. Boeuf, Z. Ikonic, P. Boucaud, D. Grützmacher, and M. E. Kurdi, Nature Photonics 14, 375 (2020).
- Chrétien et al. (2019) J. Chrétien, N. Pauc, F. A. Pilon, M. Bertrand, Q.-M. Thai, L. Casiez, N. Bernier, H. Dansas, P. Gergaud, E. Delamadeleine, R. Khazaka, H. Sigg, J. Faist, A. Chelnokov, V. Reboud, J.-M. Hartmann, and V. Calvo, ACS Photonics 6, 2462 (2019).
- Polak et al. (2017) M. P. Polak, P. Scharoch, and R. Kudrawiec, Journal of Physics D: Applied Physics 50, 195103 (2017).
- (19) C. O’Donnell, A. Sanchez-Soares, C. A. Broderick, and J. C. Greer, arXiv:2012.11311 .
- Sau and Cohen (2007) J. D. Sau and M. L. Cohen, Physical Review B 75 (2007), 10.1103/physrevb.75.045208.
- Kao et al. (2012) K.-H. Kao, A. S. Verhulst, W. G. Vandenberghe, B. Soree, G. Groeseneken, and K. D. Meyer, IEEE Transactions on Electron Devices 59, 292 (2012).
- Schulte-Braucks et al. (2015) C. Schulte-Braucks, D. Stange, N. von den Driesch, S. Blaeser, Z. Ikonic, J. M. Hartmann, S. Mantl, and D. Buca, Applied Physics Letters 107, 042101 (2015).
- Ansari et al. (2012) L. Ansari, G. Fagas, J.-P. Colinge, and J. C. Greer, Nano Letters 12, 2222 (2012).
- Sanchez-Soares and Greer (2016) A. Sanchez-Soares and J. C. Greer, Nano Letters 16, 7639 (2016).
- Ansari et al. (2016) L. Ansari, G. Fagas, F. Gity, and J. C. Greer, Applied Physics Letters 109, 063108 (2016).
- Sanchez-Soares et al. (2016) A. Sanchez-Soares, C. O’Donnell, and J. C. Greer, Physical Review B 94 (2016), 10.1103/physrevb.94.235442.
- Gity et al. (2017) F. Gity, L. Ansari, M. Lanius, P. Schüffelgen, G. Mussler, D. Grützmacher, and J. C. Greer, Applied Physics Letters 110, 093111 (2017).
- Gity et al. (2018) F. Gity, L. Ansari, C. König, G. A. Verni, J. D. Holmes, B. Long, M. Lanius, P. Schüffelgen, G. Mussler, D. Grützmacher, et al., Microelectronic Engineering 195, 21 (2018).
- Suzuki et al. (2016) A. Suzuki, O. Nakatsuka, S. Shibayama, M. Sakashita, W. Takeuchi, M. Kurosawa, and S. Zaima, Japanese Journal of Applied Physics 55, 04EB12 (2016).
- Farrow et al. (1981) R. Farrow, D. Robertson, G. Williams, A. Cullis, G. Jones, I. Young, and P. Dennis, Journal of Crystal Growth 54, 507 (1981).
- Hochst and Hernandez-Calderon (1983) H. Hochst and I. Hernandez-Calderon, Surface Science 126, 25 (1983).
- Asom et al. (1989) M. T. Asom, E. A. Fitzgerald, A. R. Kortan, B. Spear, and L. C. Kimerling, Applied Physics Letters 55, 578 (1989).
- John et al. (1989) P. John, T. Miller, and T.-C. Chiang, Physical Review B 39, 3223 (1989).
- Bowman et al. (1990) R. C. Bowman, P. M. Adams, M. A. Engelhart, and H. Höchst, Journal of Vacuum Science & Technology A: Vacuum, Surfaces, and Films 8, 1577 (1990).
- Bragg and Williams (1934) W. L. Bragg and E. J. Williams, Proceedings of the Royal Society A: Mathematical, Physical and Engineering Sciences 145, 699 (1934).
- Williams (1935a) E. Williams, Proceedings of the Royal Society of London. Series A, Mathematical and Physical Sciences 151, 231 (1935a).
- Williams (1935b) E. Williams, Proceedings of the Royal Society of London. Series A, Mathematical and Physical Sciences 152, 231 (1935b).
- Sanchez et al. (1984) J. M. Sanchez, F. Ducastelle, and D. Gratias, Physica A. Statistical and Theoretical Physics 128, 334 (1984).
- Soler et al. (2002) J. M. Soler, E. Artacho, J. D. Gale, A. García, J. Junquera, P. Ordejón, and D. Sánchez-Portal, Journal of Physics: Condensed Matter 14, 2745 (2002).
- Ozaki (2003) T. Ozaki, Phys. Rev. B 67, 155108 (2003).
- Ozaki and Kino (2004) T. Ozaki and H. Kino, Phys. Rev. B 69, 195113 (2004).
- (42) Atomistix Toolkit version 2016.4, “QuantumWise A/S (www.quantumwise.com).” .
- Monkhorst and Pack (1976) H. J. Monkhorst and J. D. Pack, Phys. Rev. B 13, 5188 (1976).
- Perdew and Zunger (1981) J. P. Perdew and A. Zunger, Physical Review B 23, 5048 (1981).
- Baker and Hart (1975) J. F. C. Baker and M. Hart, Acta Crystallographica Section A 31, 364 (1975).
- Thewlis and Davey (1954) J. Thewlis and A. Davey, Nature 174, 1011 (1954).
- Bruner and Keyes (1961) L. J. Bruner and R. W. Keyes, Physical Review Letters 7, 55 (1961).
- Price et al. (1971) D. L. Price, J. M. Rowe, and R. M. Nicklow, Physical Review B 3, 1268 (1971).
- Buchenauer et al. (1971) C. Buchenauer, M. Cardona, and F. Pollak, Physical Review B 3, 1243 (1971).
- Biswas et al. (2016) S. Biswas, J. Doherty, D. Saladukha, Q. Ramasse, D. Majumdar, M. Upmanyu, A. Singha, T. Ochalski, M. A. Morris, and J. D. Holmes, Nature Communications 7 (2016), 10.1038/ncomms11405.
- Mukherjee et al. (2017) S. Mukherjee, N. Kodali, D. Isheim, S. Wirths, J. M. Hartmann, D. Buca, D. N. Seidman, and O. Moutanabbir, Physical Review B 95 (2017), 10.1103/physrevb.95.161402.
- Connolly and Williams (1983) J. W. D. Connolly and A. R. Williams, Physical Review B 27, 5169 (1983).
- van de Walle and Ceder (2002a) A. van de Walle and G. Ceder, Journal of Phase Equilibria 23, 348 (2002a).
- Stone (1974) M. Stone, Journal of the Royal Statistical Society: Series B (Methodological) 36, 111 (1974).
- Wolverton and Zunger (1995) C. Wolverton and A. Zunger, Physical Review B 52, 8813 (1995).
- van de Walle (2009) A. van de Walle, Calphad 33, 266 (2009).
- Zunger et al. (1990) A. Zunger, S.-H. Wei, L. Ferreira, and J. E. Bernard, Physical Review Letters 65, 353 (1990).
- Hass et al. (1990) K. Hass, L. Davis, and A. Zunger, Physical Review B 42, 3757 (1990).
- Van de Walle et al. (2013) A. Van de Walle, P. Tiwary, M. De Jong, D. Olmsted, M. Asta, A. Dick, D. Shin, Y. Wang, L.-Q. Chen, and Z.-K. Liu, Calphad 42, 13 (2013).
- van de Walle and Ceder (2002b) A. van de Walle and G. Ceder, Reviews of Modern Physics 74, 11 (2002b).
- Fultz (2010) B. Fultz, Progress in Materials Science 55, 247 (2010).
- Bozzolo et al. (2007) G. Bozzolo, R. D. Noebe, and P. B. Abel, Applied computational materials modeling: theory, simulation and experiment (Springer Science & Business Media, New York, 2007).
- van de Walle and Asta (2002) A. van de Walle and M. Asta, Modelling and Simulation in Materials Science and Engineering 10, 521 (2002).
- Ghosh et al. (2008) G. Ghosh, A. van de Walle, and M. Asta, Acta Materialia 56, 3202 (2008).
- O’Halloran et al. (2019) E. J. O’Halloran, C. A. Broderick, D. S. P. Tanner, S. Schulz, and E. P. O’Reilly, Optical and Quantum Electronics 51, 314 (2019).
- Gencarelli et al. (2015) F. Gencarelli, D. Grandjean, Y. Shimura, B. Vincent, D. Banerjee, A. Vantomme, W. Vandervorst, R. Loo, M. Heyns, and K. Temst, Journal of Applied Physics 117, 095702 (2015).
- Xu et al. (2017) C. Xu, C. L. Senaratne, R. J. Culbertson, J. Kouvetakis, and J. Menéndez, Journal of Applied Physics 122, 125702 (2017).
- Gassenq et al. (2017) A. Gassenq, L. Milord, J. Aubin, N. Pauc, K. Guilloy, J. Rothman, D. Rouchon, A. Chelnokov, J. M. Hartmann, V. Reboud, and V. Calvo, Applied Physics Letters 110, 112101 (2017).
- Xu et al. (2019) C. Xu, P. M. Wallace, D. A. Ringwala, S. L. Y. Chang, C. D. Poweleit, J. Kouvetakis, and J. Menéndez, Applied Physics Letters 114, 212104 (2019).
- Bouthillier et al. (2020) É. Bouthillier, S. Assali, J. Nicolas, and O. Moutanabbir, Semiconductor Science and Technology 35, 095006 (2020).
- Wood and Zunger (1988) D. M. Wood and A. Zunger, Physical Review Letters 61, 1501 (1988).
- Zunger and Wood (1989) A. Zunger and D. Wood, Journal of Crystal Growth 98, 1 (1989).
- Ozoliņš et al. (1998a) V. Ozoliņš, C. Wolverton, and A. Zunger, Physical Review B 57, 4816 (1998a).
- Hoffman et al. (1989) C. A. Hoffman, J. R. Meyer, R. J. Wagner, F. J. Bartoli, M. A. Engelhardt, and H. Höchst, Physical Review B 40, 11693 (1989).
- Calavita et al. (1990) E. Calavita, M. A. Engelhart, and Höchst, in The Physics of Semiconductors: Proceedings of the 20th International Conference (1990).
- Ozoliņš et al. (1998b) V. Ozoliņš, C. Wolverton, and A. Zunger, Applied Physics Letters 72, 427 (1998b).
- Asano et al. (2014) T. Asano, S. Kidowaki, M. Kurosawa, N. Taoka, O. Nakatsuka, and S. Zaima, Thin Solid Films 557, 159 (2014).
- O’Donnell et al. (2020) C. O’Donnell, A. Sanchez-Soares, C. A. Broderick, and J. C. Greer, arXiv:2012.11311 (2020).