Consistent SDNs through Network State Fuzzing
Abstract
The conventional wisdom is that a software-defined network (SDN) operates under the premise that the logically centralized control plane has an accurate representation of the actual data plane state. Unfortunately, bugs, misconfigurations, faults or attacks can introduce inconsistencies that undermine correct operation. Previous work in this area, however, lacks a holistic methodology to tackle this problem and thus, addresses only certain parts of the problem. Yet, the consistency of the overall system is only as good as its least consistent part.
Motivated by an analogy of network consistency checking with program testing, we propose to add active probe-based network state fuzzing to our consistency check repertoire. Hereby, our system, Pazz, combines production traffic with active probes to periodically test if the actual forwarding path and decision elements (on the data plane) correspond to the expected ones (on the control plane). Our insight is that active traffic covers the inconsistency cases beyond the ones identified by passive traffic. Pazz prototype was built and evaluated on topologies of varying scale and complexity. Our results show that Pazz requires minimal network resources to detect persistent data plane faults through fuzzing and localize them quickly while outperforming baseline approaches.
Index Terms:
Consistency, Fuzzing, Network verification, Software defined networking.I Introduction
The correctness of a software-defined network (SDN) crucially depends on the consistency between the management, the control and the data plane. There are, however, many causes that may trigger inconsistencies at run time, including, switch hardware failures [1, 2], bit flips [3, 4, 5, 6, 7, 8], misconfigurations [9, 10, 11], priority bugs [12, 13], control and switch software bugs [14, 15, 16]. When an inconsistency occurs, the actual data plane state does not correspond to what the control plane expects it to be. Even worse, a malicious user may actively try to trigger inconsistencies as part of an attack vector.
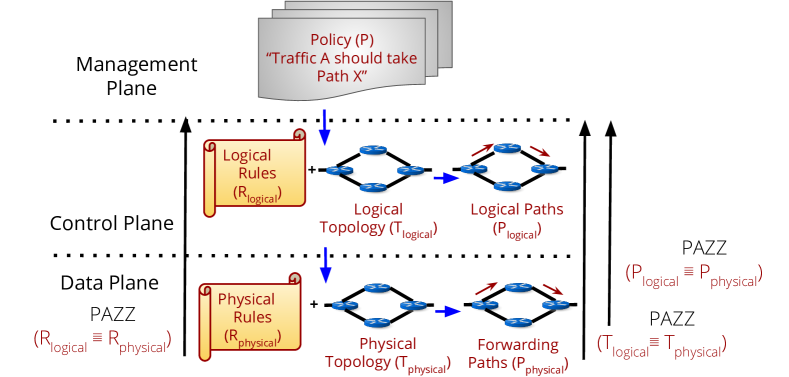
Figure 1 shows a visualization inspired by the one by Heller et al. [17] highlighting where consistency checks operate. The figure illustrates the three network planes – management, control, and data plane – with their components. The management plane establishes the network-wide policy , which corresponds to the network operator’s intent. To realize this policy, the control plane governs a set of logical rules (logical) over a logical topology (logical), which yield a set of logical paths (logical). The data plane consists of the actual topology (physical), the rules (physical), and the resulting forwarding paths (physical).
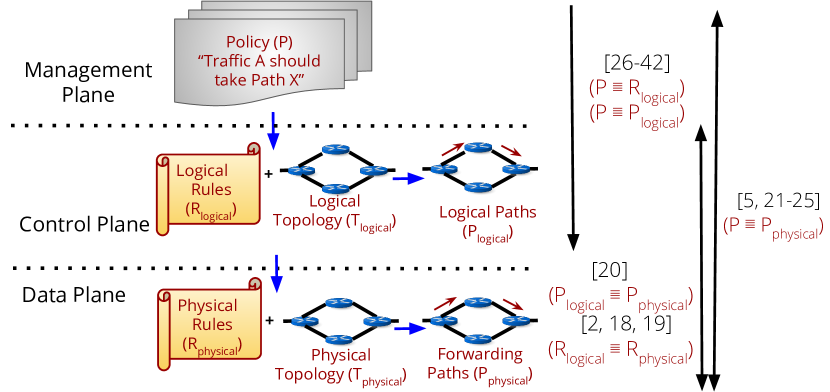
Consistency checking is a complex problem. Prior work has tackled individual subpieces of the problem as highlighted by Figure 1. Monocle [4], RuleScope [18], and RuleChecker [19] use active probing to verify whether the logical rules logical are the same as the rules physical of the data plane. ATPG [2] creates test packets based on the control plane rules to verify whether paths taken by the packets on the data plane physical are the same as the expected path from the high-level policy without giving attention to the matched rules. VeriDP [20] in SDNs and P4CONSIST [21] in P4 SDNs use production traffic to only verify whether paths taken by the packets on the data plane physical are the same as the expected path from the control plane logical. NetSight [22], PathQuery [23], CherryPick [24], and PathDump [25] use production traffic whereas SDN Traceroute [26] uses active probes to verify physical. Control plane solutions focus on verifying network-wide invariants such as reachability, forwarding loops, slicing, and black hole detection against high-level network policies both for stateless and stateful policies. This includes tools [27, 28, 29, 30, 31, 32, 33, 34, 35, 36, 37] that monitor and verify some or all of the network-wide invariants by comparing the high-level network policy with the logical rule set that translates to the logical path set at the control plane, i.e., logical or logical. These systems, however, only model the network behavior which is insufficient to capture firmware and hardware bugs as “modeling” and verifying the control-data plane consistency are significantly different techniques.
Typically, previous approaches to consistency checking proceed “top-down,” starting from what is known to the management and control planes, and subsequently checking whether the data plane is consistent. We claim that this is insufficient and underline this with several examples (§II-C) wherein data plane inconsistencies would go undetected. This can be critical, as analogous to security, the overall system consistency is only as good as the weakest link in the chain.
We argue that we need to complement existing top-down approaches with a bottom-up approach. To this end, we rely on an analogy to program testing. Programs can have a huge state space, just like networks. There are two basic approaches to test program correctness: one is static testing and the other is dynamic testing using fuzz testing or fuzzing [38]. Hereby, the latter is often needed as the former cannot capture the actual run-time behavior. We realize that the same holds true for network state.
Fuzz testing involves testing a program with invalid, unexpected, or random data as inputs. The art of designing an effective fuzzer lies in generating semi-valid inputs that are valid enough so that they are not directly rejected by the parser, but do create unexpected behaviors deeper in the program, and are invalid enough to expose corner cases that have not been dealt with properly. For a network, this corresponds to checking its behavior not only with the expected production traffic but with unexpected or abnormal packets [39]. However, in networking, what is expected or unexpected depends not only on the input (ingress) port but also the topology till the exit (egress) port and configuration i.e., rules on the switches. Thus, there is a huge state space to explore. Relying only on production traffic is not sufficient because production traffic may or may not trigger inconsistencies. However, having faults that can be triggered at any point in time, due to a change in production traffic e.g., malicious or accidental, is undesirable for a stable network. Thus, we need fuzz testing for checking network consistency. Accordingly, this paper introduces Pazz which combines such capabilities with previous approaches to verify SDNs against persistent data plane faults. Therefore, similar to program testing we ask: “How far to go with consistency checks?”
Our Contributions:
-
•
We identify and categorize the causes and symptoms of data plane faults which are currently unaddressed to provide some useful insights into the limitations of existing approaches by investigating their frequency of occurence. Based on our insights, we make a case for fuzz testing mechanism for campus and private datacenter SDNs (section II);
-
•
We introduce a novel methodology, Pazz which detects and later, localizes faults by comparing control vs. data plane information for all three components, rules, topology, and paths. It uses production traffic as well as active probes (to fuzz test the data plane state) (section III);
-
•
We develop and evaluate Pazz prototype111Pazz software and experiments with topologies and configs will be made public to the research community. in multiple experimental topologies representative of multi-path/grid campus and private datacenter SDNs. Our results show that fuzzing through Pazz outperforms baseline approach in all experimental topologies while consuming minimal resources as compared to Header Space Analysis to detect and localize data plane faults (section IV);
II Background & Motivation
This section briefly navigates the landscape of faults and reviews the symptoms and causes (section II-A) to set the stage for the program testing analogy in networks (section II-B). Finally, we highlight the scenarios of data plane faults manifesting as inconsistency (section II-C).
II-A Landscape of Faults: Frequency, Causes and Symptoms
As per the survey [1], the top primary causes for abnormal network behaviour or failures in the order of their frequency of occurence are the following:
1) Software bugs: code errors, bugs, etc.,
2) Hardware failures or bugs: bit errors or bitflips, switch failures, etc.,
3) Attacks and external causes: compromised security, DoS/DDos, etc., and
4) Misconfigurations: ACL /protocol misconfigs, etc.
In SDNs, the above causes still exist and are persistent [2, 3, 4, 12, 13, 14, 15, 16, 40, 41, 42]. We, however, realized that the symptoms [1] of the above causes can manifest either as functional or performance-based problems on the data plane. To clarify further, the symptoms are either functional (reachability, security policy correctness, forwarding loops, broadcast/multicast storms) or performance-based (Router CPU high utilization, congestion, latency/throughput, intermittent connectivity). To abstract the analysis, if we disregard the performance-based symptoms, we realize the functional problems can be reduced to the verification of network correctness. Making the situation worse, the faults manifest in the form of inconsistency where the expected network state at control plane is different to the actual data plane state.
A physical network or network data plane comprises of devices and links. In SDNs, such devices are SDN switches connected through links. The data plane of the SDNs is all about the network behaviour when subjected to input in the form of traffic. Just like in programs, we need different test cases as inputs with different coverage to test the code coverage. Similarly, in order to dynamically test the network behaviour thoroughly, we need input in the form of traffic with different coverage [43]. Historically, the network correctness or functional verification on the data plane has been either a path-based verification (network-wide) [20, 22, 23, 24, 25, 26, 44] or a rule-based verification (mostly switch-specific) [2, 4, 26, 19, 18, 45]. A path-based verification can be end-to-end or hop-by-hop whereas rule-based verification is a switch-by-switch verification. The network coverage brings us to the concept of Packet Header Space Coverage.
II-B Packet Header Space Coverage: Active vs Passive
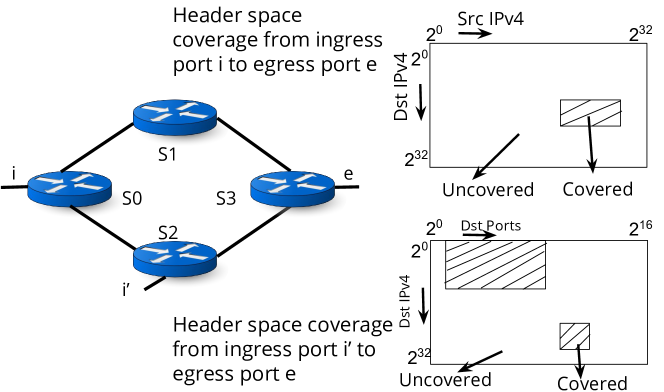
We observe that networks just as programs can have a huge distributed state space. Packets with their packet headers, including source IP, destination IP, port numbers, etc., are the inputs and the state includes all forwarding equivalence classes defined by the flow rules. Note, that every pair of ingress-egress ports (source-destination pair) can have different forwarding equivalence classes (FECs). We use the term covered packet header space to refer to it. Our motivation is that the forwarding equivalence classes refer to parts of the packet header space. For a given pair of ingress and egress ports (source-destination pair), when receiving traffic on the egress port from the ingress port, we can check if the packet is covered by the corresponding “packet header space”. If it is within the space it is “expected”, otherwise it is “unexpected” and, thus, we have discovered an inconsistency due to the presence of a fault on the data plane.
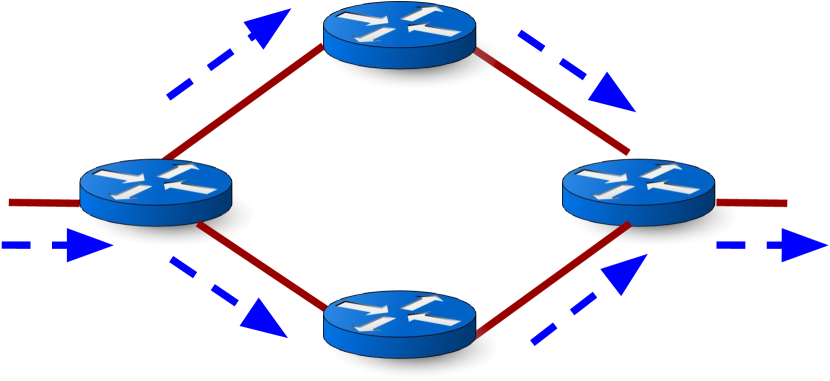
Consider the example topology in Figure 2. It consists of four switches S0, S1, S2, and S3. Let us focus on two ingress ports and and one egress port . The figure also includes possible packet header space coverage. For to , it includes matches for the source and destination IPv4 addresses. For to , it includes matches for the destination IPv4 address and possible destination port ranges. Indeed, it is possible to take into account other dimensions such as IPV6 header space, source-destination MAC addresses.
When testing a network, if traffic adheres to a specific packet header space, there are multiple possible cases. If we observe a packet sent via an ingress port and received at an egress port then we need to check if it is within the covered area, if it is not we refer to the packet as “unexpected” and then, we have an inconsistency for that packet header space caused by a fault. If a packet from an ingress port is within the expected packet header space of multiple egress ports, we need to check if the sequence of rules expected to be matched and path/s expected to be taken by the packet correspond to the actual output port on data plane. This is yet another way of finding inconsistency caused by faults.
| Type of monitoring/verification | |||
| Related work in the data plane | Traffic Type (Packet header space coverage) | Rule-based | Path-based |
| ATPG [2] 222In this tool, if the packet is received at the expected destination from a source, path is considered to be the same. | Active | (✓) | (✓) |
| Monocle [4] | Active | (✓) | |
| RuleScope [18] | Active | (✓) | |
| RuleChecker [19]333In this tool, authors claim that tool may detect match and action faults without guarantee. | Active | (✓) | |
| SDNProbe [45] | Active | (✓) | (✓) |
| FOCES [44] | Passive | (✓) | (✓) |
| VeriDP [20] | Passive | (✓) | (✓) |
| NetSight [22] | Passive | (✓) | (✓) |
| PathQuery [23] | Passive | (✓) | (✓) |
| CherryPick [24]444In this tool, issues in only symmetrical topologies are addressed. | Passive | (✓) | (✓) |
| PathDump [25] | Active | (✓) | (✓) |
| P4CONSIST [21] | Passive | ✓ | |
| Pazz | Active, Passive | ✓ | ✓ |
|---|---|---|---|
Similar to program testing where negative test cases are used to fuzz test, in networking, we should not only test the network state with “expected” or the production traffic, but also with specially crafted probe packets to test corner cases and “fuzz test”. In principle, there are two ways for testing network forwarding: passive and active. Passive corresponds to using the existing traffic or production traffic while active refers to sending specific probe traffic. The advantage of passive traffic is that it has low overhead and popular forwarding paths are tested repeatedly. However, production traffic may (a) not cover all cases (covers only faults that can be triggered by production traffic only); (b) change rapidly; and (c) have delayed fault detection, as the fraction of traffic triggering the faults is delayed. Indeed, malicious users may be able to inject malformed traffic that may trigger fault/s. Thus, production traffic may not cover the whole packet header space achievable by active probing.
Furthermore, we should also fuzz test the network state. This is important as we derive our network state from the information of the controller. Yet, this is not sufficient since we cannot presume that the controller state is complete and/or accurate. Thus, we propose to generate packets that are outside of the covered packet header space of an ingress/egress port pair. We suggest doing this by systematically and continuously or periodically testing the header space just outside of the covered header space. E.g., if port 80 is within the covered header space test for port 81 and 79. If x.0/17 is in the covered header space test for x.1.0.0 which is part of the x.1/17 prefix. In addition, we propose to randomly probe the remaining packet header space continuously or periodically by generating appropriate test traffic. The goal of active traffic generation through fuzzing is to detect the faults identifiable by active traffic only.
Table I shows the existing data plane approaches on the basis of kind of verification or monitoring in addition to the packet header space coverage. We see that the existing dataplane verification approaches are insufficient when it comes to both path and rule-based verification in addition to ensuring sufficient packet header space coverage. In this paper, our system Pazz aims to ensure packet header space coverage in addition to path and rule-based verification to ensure network correctness on the data plane and thus, detecting and localizing persistent inconsistency.
Expected/actual route blue/red arrows.
II-C Data plane faults manifesting as inconsistency
II-C1 Faults identified by Passive Traffic: Type-p
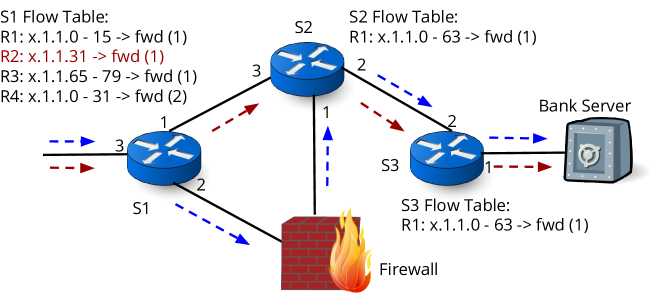
To highlight the type of faults, consider a scenario shown in Figure 3. It has three OpenFlow switches (S1, S2, and S3) and one firewall (FW). Initially, S1 has three rules R1, R3, and R4. R4 is the least specific rule and has the lowest priority. R1 has the highest priority. Note the rules are written in the order of their priority.
Incorrect packet trajectory: We start by considering a known fault [20, 22, 25]–hidden rule/misconfiguration. For this, the rule R2 is added to S1 via the switch command line utility. The controller will remain unaware of R2 since R2 is a non-overlapping flow rule. Thus, it is installed without notification to the controller [46]. [4, 12] have hinted at this problem. As a result, traffic to IP x.1.1.31 bypasses the firewall as it uses a different path.
Priority faults are another reason for such incorrect forwarding where either rule priorities get swapped or are not taken into account. The Pronto-Pica8 3290 switch with PicOS 2.1.3 caches rules without accounting for rule priorities [13]. The HP ProCurve switch lacks rule priority support [12]. Furthermore, priority faults may manifest in many forms e.g., they may cause the trajectory changes or incorrect matches even when the trajectory remains the same. Action faults can be another reason where bitflip in the action part of the flowrule may result in a different trajectory.
Insight 1: Typically, the packet trajectory tools only monitor the path.
Correct packet trajectory, incorrect rule matching: If we add a higher priority rule in a similar fashion where the path does not change, i.e., the match and action remains the same as in the shadowed rule, then previous work will be unable to detect it and, thus, it is unaddressed 555We validated this via experiments. OpenFlow specification [46] states that if a non-overlapping rule is added via the switch command-line utility, controller is not notified.. Even if the packet trajectory is correct but wrong rule is matched, it can inflict serious damages. Misconfigs, hidden rules, priority faults, match faults (described next) may be the reason for incorrect matches. Next, we focus on match faults where anomaly in the match part of a forwarding flow rule on a switch causes the packets to be matched incorrectly. We again highlight known as well as unaddressed cases starting with a known scenario. In Figure 3, if a bitflip666A previously unknown firmware bug in HP 5406zl switch., e.g., due to hardware problems, changes R1 from x.1.1.0/28 to match from x.1.1.0 upto x.1.1.79. Traffic to x.1.1.17 is now forwarded based on R1 rather than R4 and thus, bypasses the firewall. This may still be detectable, e.g., by observing the path of a test packet [20]. However, the bitflip in R1 also causes an overlap in the match of R1 and R3 in switch S1 and both rules have the same action, i.e., forward to port 1. Thus, traffic to x.1.1.66 supposed to be matched by R3 will be matched by R1. If later, the network administrator removes R3, the traffic still pertaining to R3 still runs. This violates the network policy. In this paper, we categorize the dataplane faults detectable by the production traffic as Type-p faults.
Insight 2: Even if the packet trajectory remains the same, the matched rules need to be monitored.
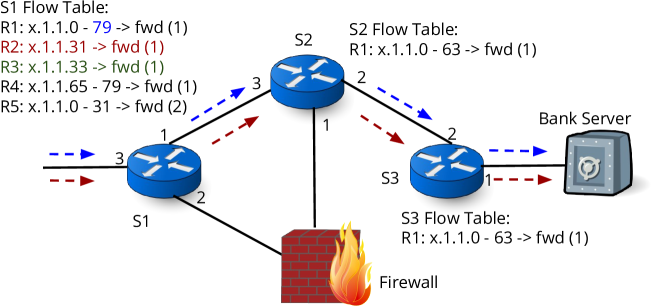
II-C2 Faults identified by Active Traffic only: Type-a
To highlight, we focus on hidden or misconfigured rule R3 (in green) in Figure 4. This rule matches the traffic corresponding to x.1.1.33 on switch S1 and reaches the confidential bank server, however, the expected traffic or the production traffic does not belong to this packet header space [40, 41, 42]. Therefore, we need to generate probe packets to trigger such rules and thus, detect their presence. This will require generating and sending the traffic corresponding to the packet header space which is not expected by the control plane. We call this traffic as fuzz traffic in the rest of the paper since it tests the network behavior with unexpected packet header space. In this paper, we categorize the dataplane faults detectable by only the active or fuzz traffic as Type-a faults.
Insight 3: The tools which test the rules check only rules “known” to the control plane (SDN controller) by generating active traffic for “known” flows.
Insight 4: Typically, the active traffic for certain flows checks only if the path remains the same even when rule/s matched may be different on the data plane.
III Pazz Methodology
Motivated by our insights gained in section II-C about the Type-p and Type-a faults on the data plane resulting in inconsistency, we aim to take the consistency checks further. Towards this end, our novel methodology, Pazz compares forwarding rules, topology, and paths of the control and the data plane, using top-down and bottom-up approaches, to detect and localize the data plane faults.
Pazz, derived from Passive and Active (fuZZ testing),
takes into account both production and probe traffic to ensure adequate packet header
space coverage.
Pazz checks the matched forwarding flow rules as well as the links constituting paths of various packet headers (5-tuple microflow) present in the passive and active traffic.
To detect faults, Pazz collects state information (in terms of reports)
from the control and the data plane: Pazz compares
the “expected” state reported by
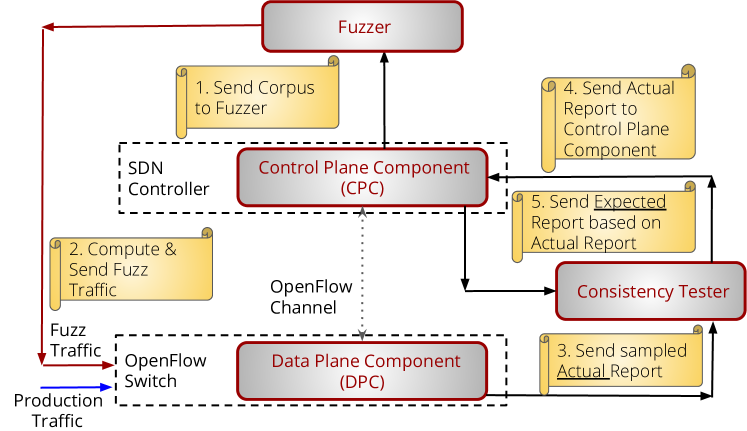
the control to the “actual” state collected from the data plane. Figure 5 illustrates the Pazz methodology. It consists of four components sequentially:
-
1.
Control Plane Component (CPC): Uses the current controller information to proactively compute the packets that are reachable between any/every source-destination pair. It then sends the corpus of seed inputs to Fuzzer. For any given packet header and source-destination pair, it reactively generates an expected report which encodes the paths and sequence of rules. (section III-B)
-
2.
Fuzzer: Uses the information from CPC to compute the packet header space not covered by the controller and hence, the production traffic. It generates active traffic for fuzz testing the network. (section III-C)
-
3.
Data Plane Component (DPC): For any given packet header and source-destination pair, it encodes the path and sequence of forwarding rules to generate a sampled actual report. (section III-A)
-
4.
Consistency Tester: Detects and later, localizes faults by comparing the expected report/s from the CPC with the actual report/s from the DPC. (section III-D)
Now, we will go through all components in a non-sequential manner for the ease of description.
III-A Data Plane Component (DPC)
To record the actual path of a packet and the rules that are matched in forwarding, we rely on tagging the packets contained in active and production traffic. In particular, we propose the use of a shim header that gives us sufficient space even for larger network diameters or larger flow rule sets. Indeed, INT [47] can be used for data plane monitoring, however, it is applicable for P4 switches [48] only. Unlike [23, 20, 24, 25, 22], we use our custom shim header for tagging, therefore tagging is possible without limiting forwarding capabilities. To avoid adding extra monitoring rules on the scarce TCAM which may also affect the forwarding behavior [23, 49], we augment OpenFlow with new actions. Between any source-destination pair, the new actions are used by all rules of the switches to add/update the shim header if necessary for encoding the sequence of inports (path) and matched rules. To remove the shim header, we use another custom OpenFlow action. To trigger the actual report to the Consistency Tester, we use sFlow [50] sampling. Indeed, we can use any other sampling tool. Note sFlow is a packet sampling technique so it samples packets not flows based on sampling rate and polling interval. For a given source, the report contains the packet header, the shim header content, and the egress port of the exit switch (destination).
Even with a shim header: Verify, however, it is impractical to expect packets to have available and sufficient space to encode information about each port and rule on the path. Therefore, we rely on a combination of bloom filter [51] and binary hash chains. For scalability purposes, sampling is used before sending a report to the Consistency Tester.
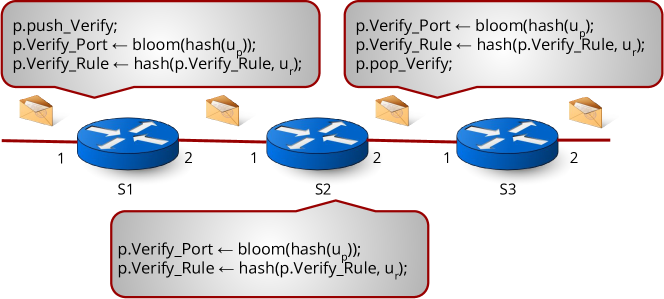
Data Plane Tagging: To limit the overhead, we decided to insert Verify shim header on layer-2. VerifyTagType is EtherType for Verify header, Verify_Port (bloom filter) encodes the local inport in a switch, and Verify_Rule (binary hash chain) encodes the local rule/s in a switch. Thus, the encoding is done with the help of the bloom filter and binary hash chain respectively. To take actions on the proposed Verify shim header and to save TCAM space, we propose four new OpenFlow actions: two for adding (push_verify) and removing (pop_verify) the Verify shim header and two for updating the Verify_Port (set_Verify_Port) and Verify_Rule (set_Verify_Port) header fields respectively. Since, the header size of the Verify_Port and Verify_Rule and tagging actions are implementation-specific, we have explained them in prototype section section IV-A1, section IV-A2 respectively. Algorithm 1 explains the data plane tagging algorithm between a source-destination pair. For each packet either from the production or active traffic (section III-C) entering the source inport, Verify shim header will be added automatically by the switch. For each switch on the path, the tags in the packet namely, Verify_Port and Verify_Rule fields get updated automatically. Figure 6 illustrates the per-switch tagging approach. Once the packet leaves the destination outport, the resulting report known as the actual report is sent to the Consistency Tester (section III-D). Note if there is no Verify header, Verify shim header is pushed on the exit switch to ensure that any traffic injected at any switch interface between a source-destination pair gets tagged. To reduce the overhead on the Consistency Tester as well as on the switch, we employ sampling at the egress port. We continuously or periodically test the network as the data plane is dynamic due to reconfigurations, link/switch/interface failures, and topology changes. Note, periodic testing can also be executed by implementing timers.
III-B Control Plane Component (CPC)
In principle, we can use the existing control plane mechanisms, including HSA [29], NetPlumber [30] and APVerifier [37]. In addition to experiments in [37], our independent experiments show that Binary Decision Diagram (BDD)-based [52] solutions like [37] perform better for set operations on headers than HSA [29] and NetPlumber [30]. In particular, we will propose in the following a novel BDD-based solution that supports rule verification in addition to path verification (APVerifier [37] takes into account only paths). Specifically, our Control Plane Component (CPC) performs two functions: a) Proactive reachability and corpus computation, and b) Reactive tag computation.
Proactive Reachability & Corpus Computation: We start by introducing an abstraction of a single switch configuration called switch predicate. In a nutshell, a switch predicate specifies the forwarding behavior of the switch for a given set of incoming packets, and is defined in turn by the rule predicates. More formally, the general configuration abstraction of a SDN switch with ports to can be described by switch predicates: where and where denotes the number of switch ports. The packets headers satisfying predicate can be forwarded from port to port only. The switch predicate is defined via rule predicates: which are given by the flowrules belonging to the switch and a flowtable . Each rule has an identifier that consists of a and representing the flowtable in which the rule resides, t array representing a list of inports for that rule, array representing a list of outports in the action of that rule and the rule priority . Based on the rule priority , in the match part and in the action part of a flowrule, each rule has a list of rule predicates (BDD predicates) which represent the set of packets that can be matched by the rule for the corresponding inport and forwarded to the corresponding outport.
Similar to the plumbing graph of [30], we generate a dependency graph of rules (henceforth, called rule nodes) called reachability graph based on the topology and switch configuration which computes the set of packet headers between any source-destination pair. There exists an edge between the two rules and , if (1) out_port of rule is connected to in_port of ; and (2) the intersection of rule predicates for and is non-empty. For computational efficiency, each rule node keeps track of higher priority rules in the same table in the switch. A rule node computes the match of each higher priority rule, subtracting it from its own match. We refer to this as the same-table dependency of rules in a switch. In the following, by slightly abusing the notation, we will use switch predicates and rule predicates to denote also the set of packet headers: they imply. Disregarding the ACL predicates for simplicity, the rule predicates in each switch representing packet header space forwarded from inport to outport is given by . The switch predicates are then computed as:
More specifically, to know the reachable packet header space (set of packet headers) between any source-destination pair in the network, we inject a fully-wildcarded packet header set h from the source port. If the intersection of the switch predicate and the current packet header is non-empty, i.e., , the packet is forwarded to the next switch until we reach the destination port. Thus, we can compute reachability between any/every source-destination pair. For caching and tag computation, we generate the inverse reachability graph simultaneously to cache the traversed paths and rules matched by a packet header between every source-destination pair. After the reachability/inverse reachability graph computation, CPC sends the current switch predicates of the entry and exit switch pertaining to a source-destination pair to Fuzzer as a corpus for fuzz traffic generation (section III-C).
In case of a FlowMod, the reachability/inverse reachability graph and new corpus are re-computed. Recall every rule node in a reachability graph keeps track of high-priority rules in a table in a switch. Therefore, only a part of the affected reachability/inverse reachability graph needs to be updated in the event of rule addition/deletion. In the case of rule addition, the same-table dependency of the rule is computed by comparing the priorities of new and old rule/s before it is added as a new node in the reachability graph. If the priority of a new rule is higher than any rule/s and there is an overlap in the match part, the new switch predicate: as per the new rule predicate: is computed as:
Reactive Tag Computation: For any given data plane report corresponding to a packet header between any source-destination pair, we traverse the pre-computed inverse reachability graph to generate a list of sequences of rules that can match and forward the actual packet header observed at a destination port from a source port. Note, there can be multiple possible paths, e.g., due to multiple entry points and per-packet or per-flow load balancing. For a packet header , the appropriate Verify_Port and Verify_Rule tags are computed similarly as in Algorithm 1. The expected report is then sent to the Consistency Tester (section III-D) for comparison. Note we can generate expected reports for any number of source-destination pairs.
III-C Fuzzer
Inspired by the code coverage-guided fuzzers like LibFuzz [53], we design a mutation-based fuzz testing [54] component called Fuzzer. Fuzzer receives the corpus of seed inputs in the form of the switch predicates of the entry and exit switch from the CPC for a source-destination pair. In particular, the switch predicates pertaining to the inport of the entry switch (source) and the outport of the exit switch (destination) represent expected covered packet header space containing the set of packet headers satisfying those predicates. Fuzzer applies mutations to the corpus (Algorithm 2).
Where Can Most Faults Hide: Before explaining Algorithm 2, we present a scenario to explain the packet header space area where potential faults can be present. Consider the example topology illustrated in Figure 2. Due to a huge header space in IPv6 (128-bit), we decide to focus on the destination IPv4 header space (32-bit) in a case of destination-based routing. In principle, it is possible to consider IPv6 header space as the fuzzing mechanism remains the same. We use , and to represent covered packet header space (switch predicates) of switches , and between i-e (source-destination pair). Note there can be multipaths for the same packet header p. Now, assume there is only a single path: , the reachable packet header space or net covered packet header space area is given by . Note this area corresponds to the control plane perspective so there may be more or less coverage on the data plane. The production traffic is generated in the area which depends on the expected rules of at an ingress port i for a packet header p destined to e. In principle, the production traffic will cover the packet header space area . Now, the active traffic should be generated for the uncovered area where represents the universe of all possible packet header space which is to for a destination IPv4 header space.
As stated in section II-B, we need to start with active traffic generation on the boundary of the net covered packet header space area between a source-destination pair as there is a maximum possibility of faults in this area. A packet will reach from iff all of the rules on the switches in a path match it; else it will be dropped either midway or on the first switch. Therefore, for an end-to-end reachability, the ruleset on and should match the packet contained in the production traffic belonging to the covered packet header space: . This implies that we need to first generate active traffic in the area: and then randomly generate in the leftover area. Traffic can, however, be also injected at any switch on any path between a source-destination pair, thus the checking needs to be done for different source-destination pairs.
We now explain the Algorithm 2 in the context of Figure 2. For active or fuzz traffic generation, if there is a difference in the covered packet header space areas of S0 and S3, we first generate traffic in the area, i.e., denoted by (Line 1). Recall there is a high probability that there may be hidden rules in this area since the header space coverage of the exit switch may be bigger than the same at the entry switch. Later, we generate traffic randomly in the residual packet header space area, i.e., denoted by (Lines 2-6). We generate traffic randomly in the area as this is mostly, a huge space and fault/s can lie anywhere. The fuzz traffic generated randomly is given by the completely uncovered packet header space area denoted by . Thus, the fuzz traffic that the Fuzzer generates belongs to the packet header space area given by and . It is worth noting that not all of the packets generated by the fuzz traffic are allowed in the network due to a default drop rule in the switches. Therefore, if some packets in the fuzz traffic are matched, the reason can be attributed to either the presence of faulty rule/s, wildcarded rules or hardware/software faults to match such traffic. This also highlights that the fuzz traffic may not cause network congestion. As discussed previously, there is another scenario where the traffic gets injected at one of the switches on the path between a source-destination pair and may end up getting matched in the data plane. Verify header is pushed at the exit switch if it is not already present (section III-A, section IV-A2) and thus, the packets still get tagged in the data plane to be sent in the actual report. However, the CPC may generate empty Verify_Rule and Verify_Port tags as the traffic is unexpected. In such cases, the fault is still detected but may not be localized automatically (section III-D). Furthermore, Fuzzer can be positioned to generate traffic at different inports to detect more faults in the network between any/every source-destination pair. In case if the production traffic does not cover all of the expected rules at the ingress or entry switch, Fuzzer design can be easily tuned to also generate the traffic for critical flows. Our evaluations confirm that an exhaustive active traffic generator which randomly generates the traffic in the uncovered area performs poorly against Pazz in the real world topologies (section IV-E). Note if the network topology or configuration changes, the CPC sends the new corpus to the Fuzzer and Algorithm 2 is repeated. We can continuously or periodically test the network with fuzz traffic for any changes.
III-D Consistency Tester
After receiving an actual report from the data plane, the Consistency Tester queries the CPC for its expected report for the packet header and the corresponding source-destination pair in the actual report. Once Consistency Tester has received both reports, it compares both reports as per Algorithm 3 for fault detection and the localization. To avoid confusion, we use , tags for the actual data plane report and , tags for the corresponding expected control plane report respectively. If Verify_Rule tag is different for a packet header and a pair of ingress and egress ports, then the fault is detected and reported (Lines 1-2). Note that we avoid the bloom filter false positive problem by first matching the hash value for the Verify_Rule tag. Therefore, the detection accuracy is high unless a hash collision occurs in Verify_Rule field (section IV-A3). Once a fault is detected, Consistency Tester uses the Verify_Port bloom-filter for localization of faults where the actual path is different from the expected path, i.e., the bloom filter is different from the bloom filter (Lines 3-8). Therefore, is compared with the per-switch hop Verify_Port in the control plane or for the hop starting from the source inport to the destination outport. This hop-by-hop walkthrough is done by traversing the reachability graph at the CPC hop-by-hop from the source port of the entry switch to the destination port of the exit switch. As per the Algorithm 3, the bitwise logical AND operation between the and the is executed at every hop. It is, however, important to note that if actual path was same as expected path, i.e., even when actual rules matched were different on the data plane, i.e., (Lines 10-13), the localization of faulty gets tricky as it can be either a case of Type-p match faults (e.g., bitflip in match part) (Lines 10-11) or Type-a fault (Lines 12-13). Hereby, it is worth noting that there will be no expected report from the CPC in the case of unexpected fuzz traffic. Therefore, Consistency Tester checks if (Line 10). If true, localization can be done through hop-by-hop manual inspection of expected switches or manual polling of expected switches (Lines 10-11) else the Type-a fault may be localized to the entry switch as it has a faulty rule that allows the unexpected fuzz traffic in the network (Lines 12-13). There is another scenario where the actual rules matched are same as expected but the path is different (Lines 14-20). This is a case of Type1-action fault (e.g., bitflip in the action part of the rule). In this case, the expected and actual Verify_Port bloom filter can be compared and thus, Type-p action fault is detected and localized. Note action fault is Type-p as it is caused in production traffic.
Binary hash chain in Verify_Rule gives Pazz better accuracy, however, we lose the ability to automatically localize the Type-p match faults where the path remains the same and rules matched are different since the Verify_Port bloom filter remains the same. To summarize, detection will happen always, but localization can happen automatically only in the case of two conditions holding simultaneously: a) when traffic is production; and b) when there is a change in path since Verify_Port bloom filter will be different. In most cases, fuzz traffic is not permitted in the network. Recall active traffic can be injected from any switch in between a source-destination pair. In such cases, the will still be detected and can be localized by either manual polling of the switches or hop-by-hop traversal from source to destination. Blackholes for critical flows can be detected as Consistency Tester generates an alarm after a chosen time of some seconds if it does not receive any packet pertaining to that flow. For localizing silent random packet drops, MAX-COVERAGE [55] algorithm can be implemented on Consistency Tester.
IV Pazz Prototype and Evaluation
IV-A Prototype
IV-A1 DPC: Verify Shim Header
We decided to use a 64-bit (8 Byte) shim header on layer-2: Verify.
To ensure sufficient space, we limit the link layer MTU to a maximum of 8,092
Bytes for jumbo frames and 1,518 Bytes for regular frames. Verify has three
fields, namely:
VerifyTagType: 16-bit EtherType to signify Verify header.
Verify_Port: 32-bit encoding the local inport in a switch.
Verify_Rule: 16-bit encoding the local rule/s in a switch.
We use a new EtherType value for VerifyTagType to ensure that any layer-2
switch on the path without our OpenFlow modifications will forward the
packet based on its layer-2 information. The Verify shim header is inserted within the layer 2 header after the source MAC address, just like a VLAN
header. In presence of VLAN (802.1q), the Verify header is
inserted before the VLAN header. Note Verify header is backward compatible with legacy L2 switches, and transparent to other protocols.
IV-A2 DPC: New OpenFlow Actions
The new actions ensure that there is no interference in forwarding as no extra rules are added. To ensure efficient
use of the shim header space, we use the bloom filter to encode path-related information in the Verify_Port field and binary hash chains to encode rule-level information in the Verify_Rule field. A binary hash chain adds a new hash-entry to an existing hash-value by computing a hash
of the existing hash-value and the new hash-entry and then storing it as the
new value. The Verify_Port field is a Bloom-filter which will contain all intermediate hash results including the first and last value. This ensures that we can test the initial value as well as the final path efficiently.
set_Verify_Port: Computes hash of the unique identifier (up) of the switch ID and its inport ID
and adds the result to the Bloom-filter in the Verify_Port field.
set_Verify_Rule: Computes hash of the globally unique identifier (ur) of the flow rule, i.e., switch ID and rule ID
(uniquely identifying a rule within a table), flow table ID with the previous value of the Verify_Rule to form a binary hash chain.
push_verify: Inserts a Verify header if needed, initializes the value in Verify_Rule to 1 and the value of Verify_Port is the hash of up. It is immediately followed by set_Verify_Rule and set_Verify_Port. If there is no Verify header, push_verify is executed at the entry and the exit switch between a source and destination pair.
pop_verify: Removes the Verify header from the tagged
packet.
push_verify should be used, if there is no Verify header for a) all packets entering a source inport or b) all packets leaving the destination outport (in case, if any traffic is injected between a source-destination pair) just before a report is generated to the Consistency Tester. For packets leaving the destination outport, pop_verify should be used only after a sampled report to the Consistency Tester has been generated.
To initiate and execute data plane tagging, the actions set_Verify_Port and set_Verify_Rule are prepended to all flow rules in the switches as first actions in the OpenFlow “action list” [46]. On the entry and exit switch, action push_verify is added as the first action. On the exit switch, pop_verify is added as an action once the report is generated. Recall, our actions do not change the forwarding behavior per se as the match part remains unaffected. However, if one of the actions gets modified unintentionally or maliciously, it may have a negative impact but gets detected and localized later. Notably, set_Verify_Rule encodes the priority of the rule and flow table number in the Verify_Rule field and thus, providing support for rule priorities/cascaded flow tables.
IV-A3 Bloom Filter & Hash Function
We use Verify_Port bloom filter for the localization of detected faults. In an extreme case from the perspective of operational networks like datacenter networks or campus networks, for a packet header and a pair of ingress and egress port, if CPC computes different paths with hops in each of the paths, the probability of a collision in bloom filter and hash value simultaneously will be given by:
In our case, using the bloom filter false positive formula [51] as (bloom filter size) of the Verify_Port field and is the network diameter or the number of switches in a path. is the probability of collision of the hash function computed using a simple approximation of the birthday attack formula:
is the number of different paths, is 216 for 16-bit Verify_Rule field hash.
For the 16-bit Verify_Rule hash operation, we used Cyclic Redundancy Check (CRC) code [56]. For the 32-bit Verify_Port Bloom filter operations, we use one of the similar approaches as mentioned in [51]. First, three hashes are computed as: for where and are the two halves of a 32-bit Jenkins hash [57] of . Then, we use the first 5 bits of to set the 32-bit Bloom filter for .
Pazz Components: We implemented DPC on top of software switches, in particular, Open vSwitch [58] Version 2.6.90. The customized OvS switches and the fuzz/production traffic generators run in vagrant VMs. Currently, the prototype supports both OpenFlow 1.0 and OpenFlow 1.1. In our prototype, we chose Ryu SDN controller. Python-based Consistency Tester, Java-based CPC and Python-based Fuzzer communicate through Apache Thrift [59].
IV-B Experiment Setup
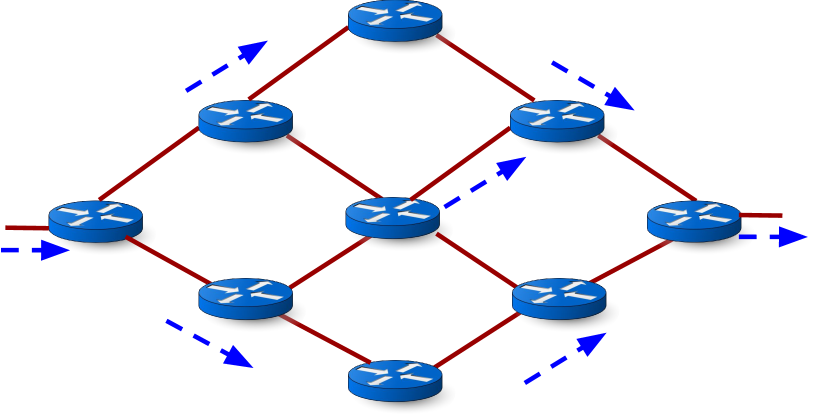
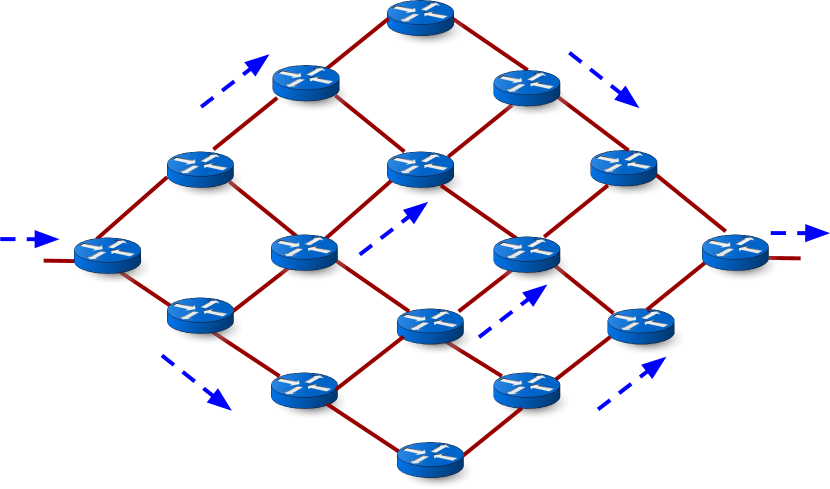
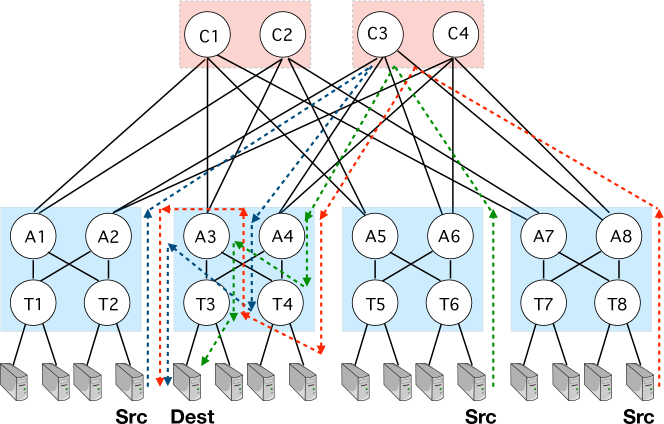
We evaluate Pazz on 4 topologies: a) 3 grid topologies (Figure 7) of 4, 9 and 16 switches respectively with varying complexities to ensure diversity of paths, and b) 1 datacenter fat-tree (4-ary) topology of 20 switches with multipaths (Figure 8). Experiments were conducted on an 8 core 2.4GHz Intel-Xeon CPU machine and 64GB of RAM. For scalability purposes, we modified and translated the Stanford backbone configuration files [60] to equivalent OpenFlow rules as per our topologies, and installed them at the switches to allow multi-path destination-based routing. We used our custom script to generate configuration files for the four experimental topologies. The configuration files ensured the diversity of paths for the same packet header. Columns 1-4 in Table II illustrate the parameters of the four experimental topologies.
| Topology | #Rules | #Paths | Path Length | Reachability graph computation time | Fuzzer Execution Time |
| 4 switches (grid) | ~5k | ~24k | 2 | 0.64 seconds | ~1 ms |
| 9 switches (grid) | ~27k | ~50k | 4 | 0.91 seconds | ~1.2 ms |
| 16 switches (grid) | ~60k | ~75k | 6 | 1.13 seconds | ~3.2 ms |
| 4-ary fat-tree (20 switches) | ~100k | ~75k | 6 | 1.15 seconds | ~7.5 ms |
Column 5 depicts the reachability graph computation time by the CPC for the experimental topologies proactively by the CPC. Represents an average over 10 runs.
Column 6 depicts the Fuzzer execution time to compute the packet header space for generating the fuzz traffic for the corresponding experimental topologies. Represents an average over 10 runs.

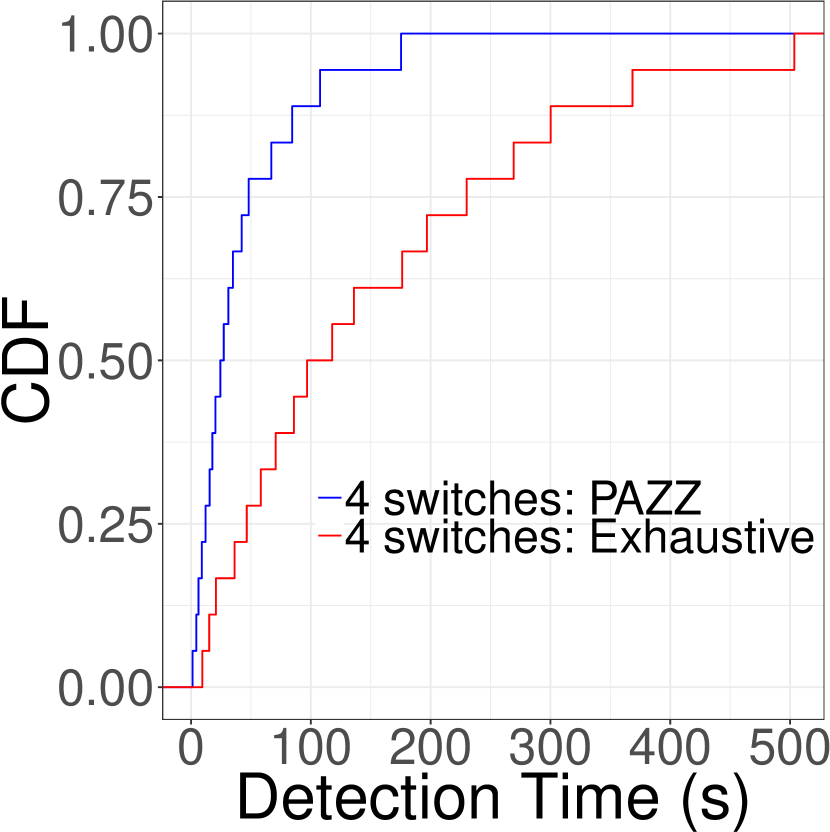
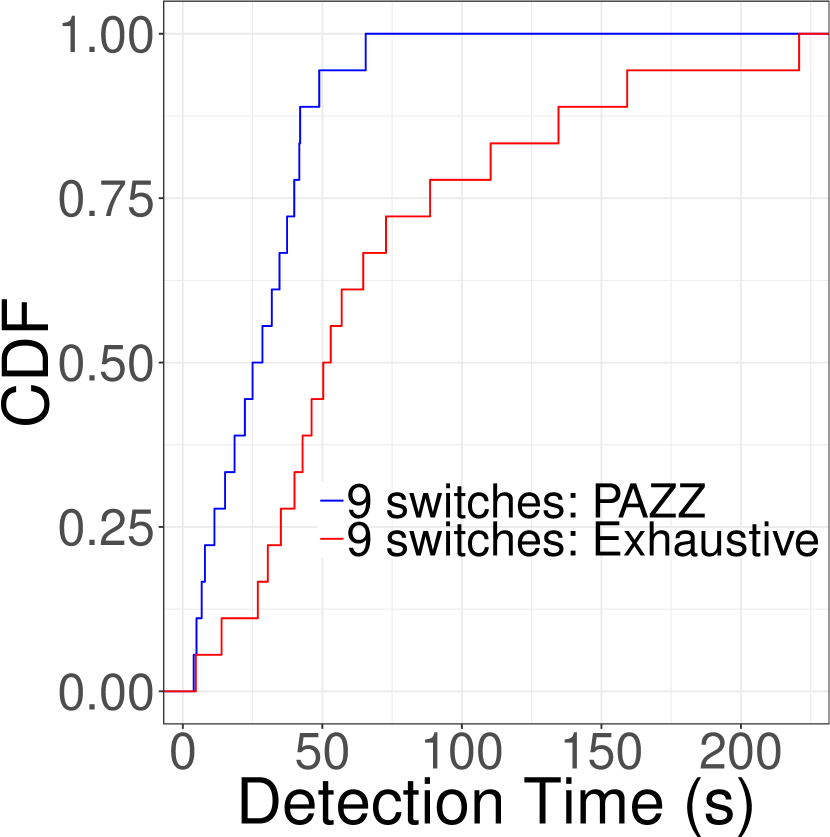
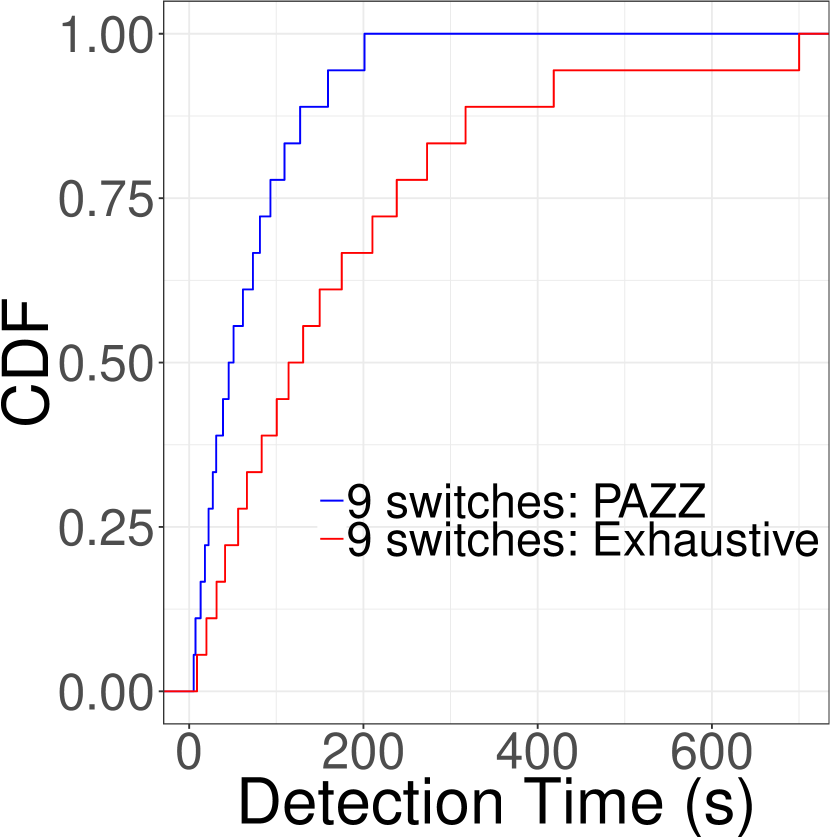
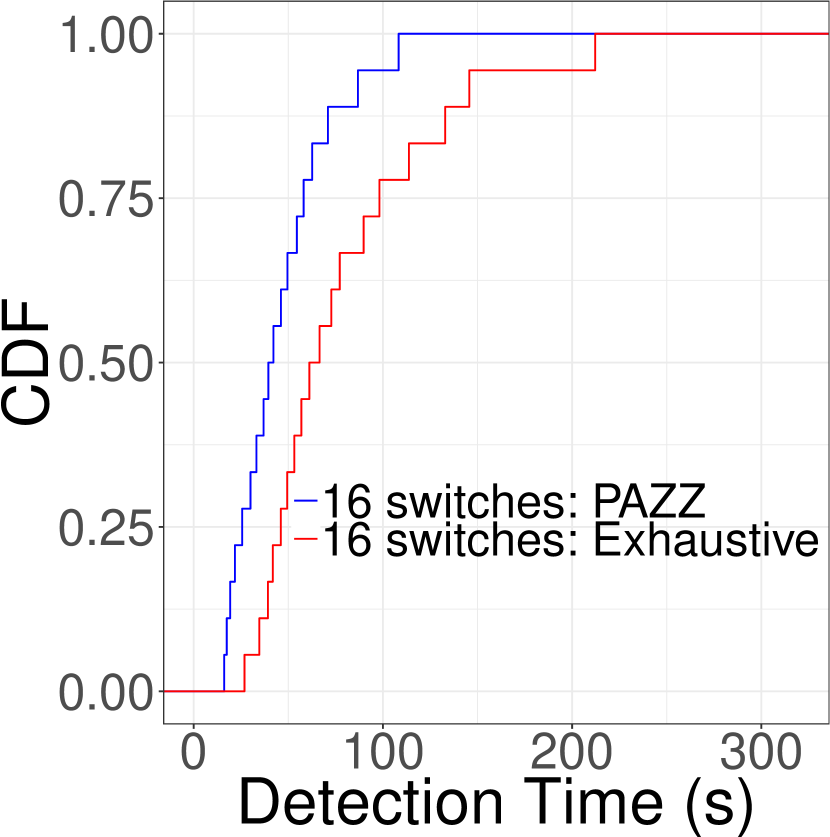
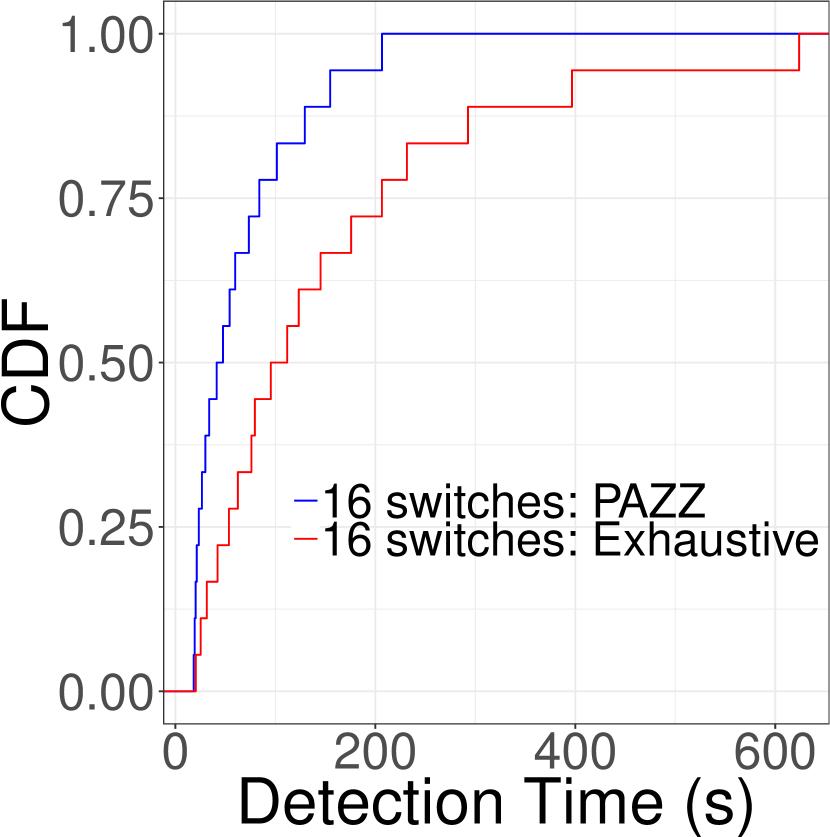
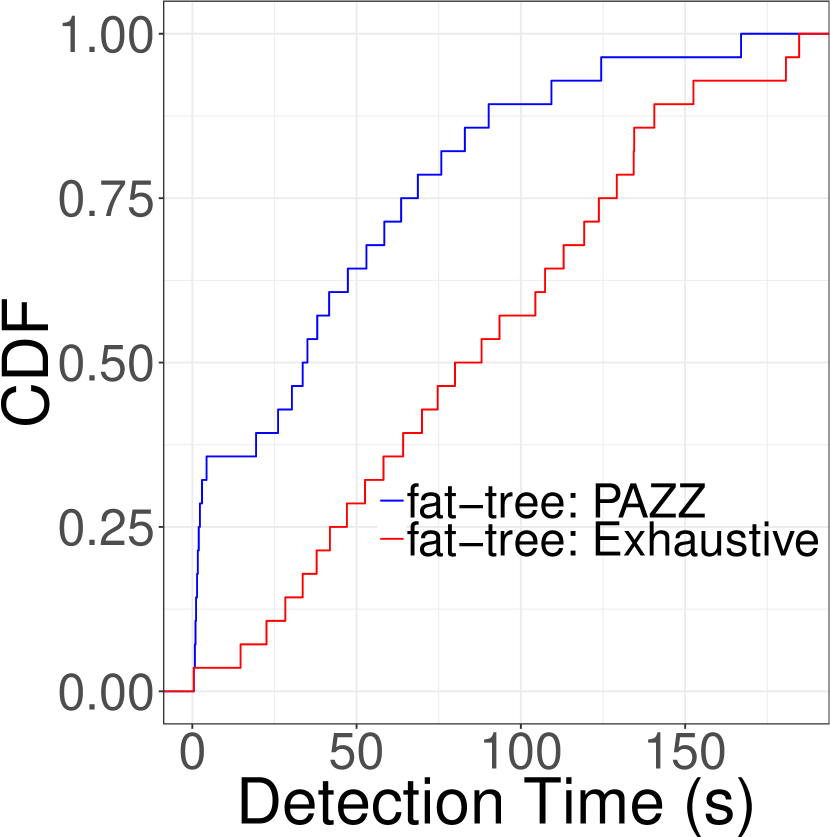
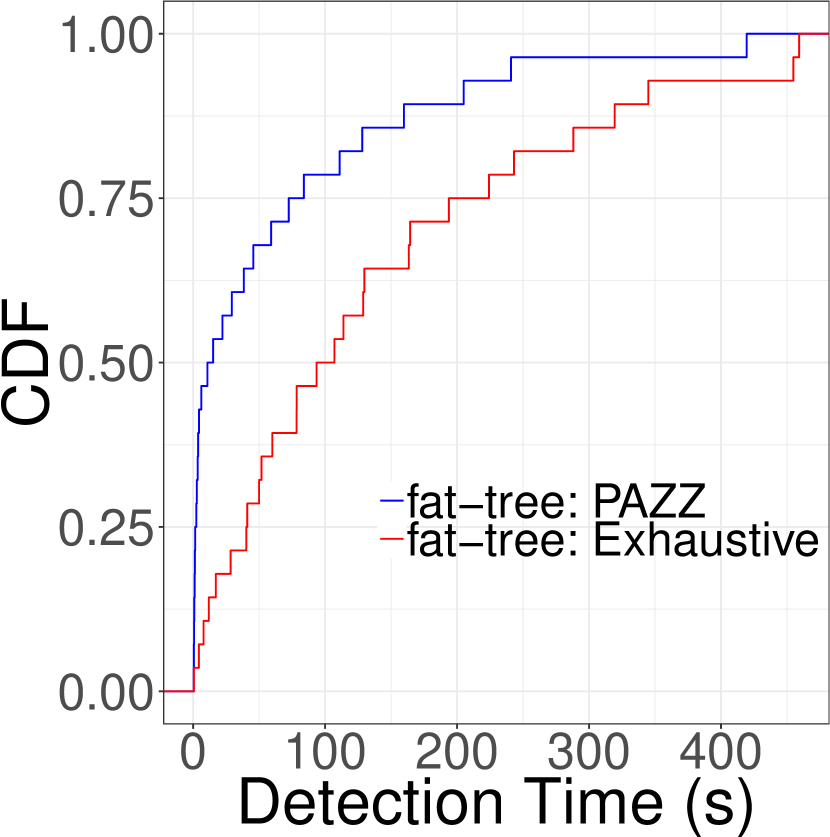
b), c), d), e) For a source-destination pair, comparison of fault detection time by Pazz (blue) and exhaustive packet generation approach (red) in all 4 experimental topologies (4-switch, 9-switch, 16-switch and 4-ary fat-tree respectively). In each figure, left to right illustrates sampling rate of 1/100 (left), and 1/1000 (right) respectively.
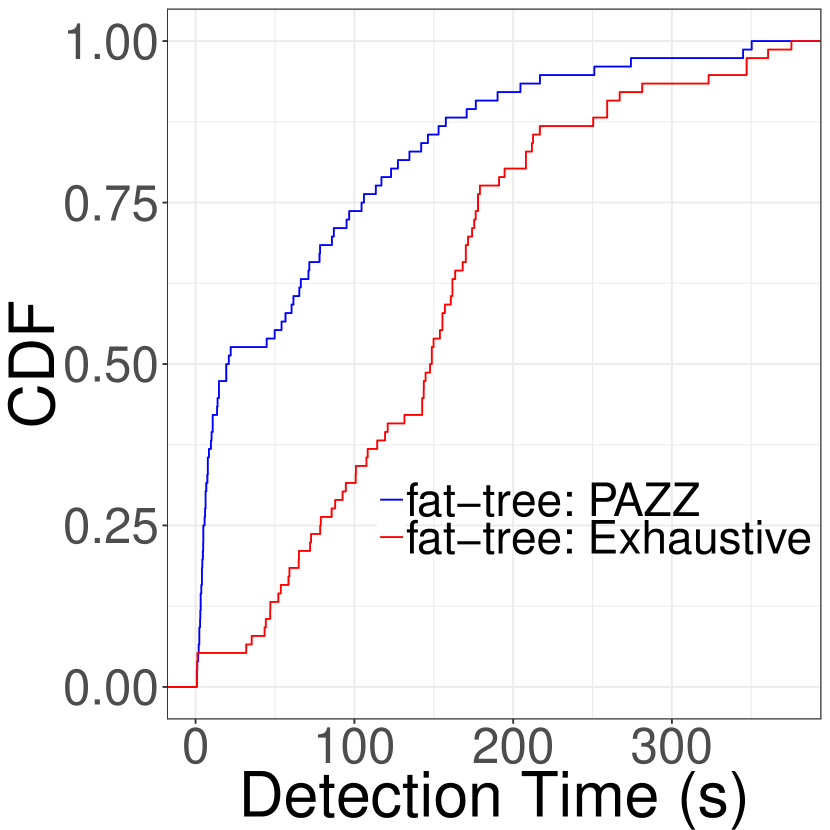
f) For 3 source-destination pairs, comparison of fault detection time (in seconds) by Pazz (blue) and exhaustive packet generation approach (red) in 4-ary fat-tree topology. Left to right illustrates sampling rate of 1/100 (left), and 1/1000 (right) respectively.
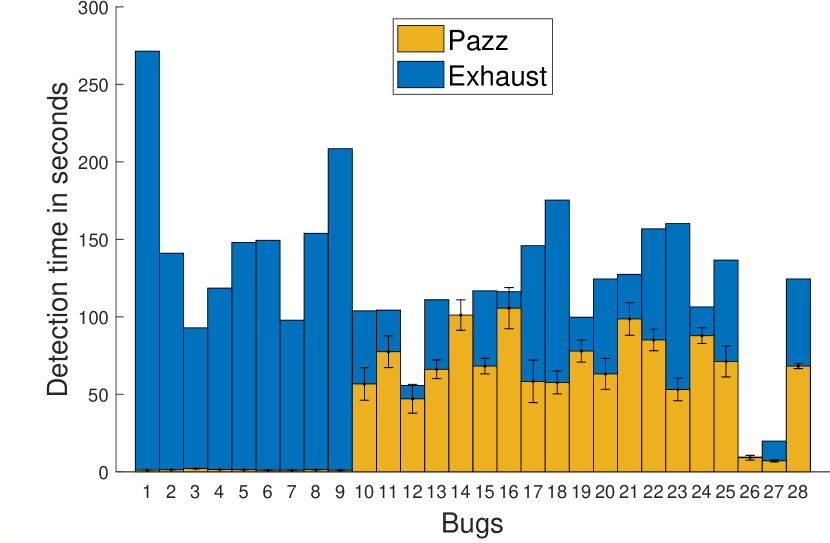
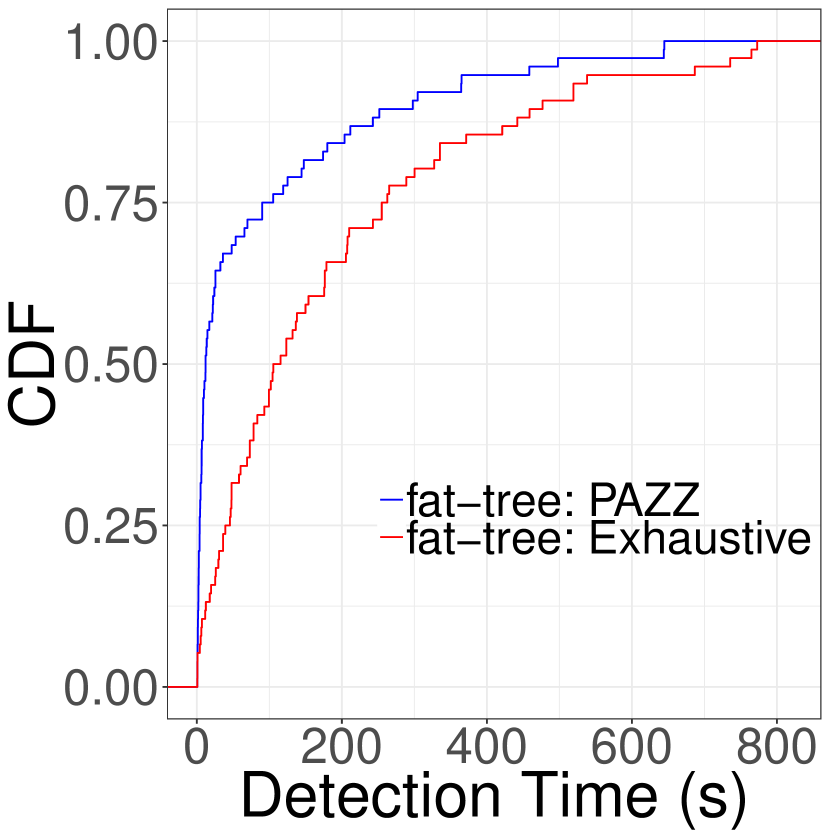
b) Illustrates the median fault detection time in Pazz with quartiles vs baseline for a single source-destination pair in 4-ary fat-tree topology with sampling rate of 1/1000. (Figure 9 (right) represents CDF of the mean fault detection time.)
We randomly injected faults on randomly chosen OvS switches in the data plane where each fault belonged to different packet header space (in 32-bit destination IPv4 address space) either in the production or fuzz traffic header space. In particular, we injected Type-p (match/action faults) and Type-a faults. ovs-ofctl utility was used to insert the faults in the form of high-priority flow rules on random switches. Therefore, we simulated a scenario where the control plane was unaware of these faults in the data plane. We made a pcap file of the production traffic generated from our Python-based script that crafts the packets. In addition, we made a pcap of the fuzz traffic generated from the Fuzzer. The production and fuzz traffic pcap files were collected using Wireshark and replayed in parallel and continuously at the desired rate using Tcpreplay [61] with infinite loops to test the network continuously. To execute Pazz periodically instead of continuously, there is an API support to implement timers with desired timeouts as per the deployment scenario. For sampling, we used sFlow [50] with a polling interval of 1 second and a sampling rate of 1/100, 1/500 and 1/1000. Note, the polling interval and sampling rate can be modified as per the deployment scenario. The sampling was done on the egress port of the exit switch in the data plane so the sampled actual report reaches the Consistency Tester and thus, avoids overwhelming it. Note each experiment was conducted for ten times for a randomly chosen source-destination pair.
Workloads: For 1 Gbps links between the switches in the 4 experimental topologies: 3 grid and 1 fat-tree (4-ary), the production traffic was generated at 106 pps (packets per second). In parallel, fuzz traffic was generated at 1000 pps, i.e., % of the production traffic. Note, the fuzz traffic rate can be modified as per the use-case requirements.
IV-C Evaluation Strategy
For a source-destination pair, our experiments are parameterized by: (a) size of network (4-20 switches), (b) path length (2-6), (c) configs (flow rules from 5k-100k), (d) number of paths (24k-75k), (e) number around (1-30) and kind of faults (Type-p, Type-a), (f) sampling rate (1/100, 1/500,
1/1000) with polling interval (1 sec), and (g) workloads, i.e., throughput (106 pps for production and 1000 pps for fuzz traffic). Note, due to space constraints, we removed the results of 1/500 sampling rate. Our primary metrics of interest are fault detection with localization time, and comparison of fault detection/localization time in Pazz against the baseline of exhaustive traffic generation approach and Header Space Analysis (HSA) [29].
In particular, we ask these questions:
Q1. How does Pazz perform under different topologies and configs of varying scale and complexity? (section IV-D)
Q2. How does Pazz compare to the strawman case of exhaustive random packet generation for a single and multiple source-destination pairs? (section IV-E)
Q3. How much time does Pazz take to compute reachability graph as compared to Header Space Analysis [29]? (section IV-F)
Q4. How much time does Pazz take to generate active traffic for a source-destination pair and how much overhead does Pazz incur on the links? (section IV-G)
Q5. How much packet processing overhead does Pazz incur on varying packet sizes? (section IV-H)
IV-D Pazz Performance
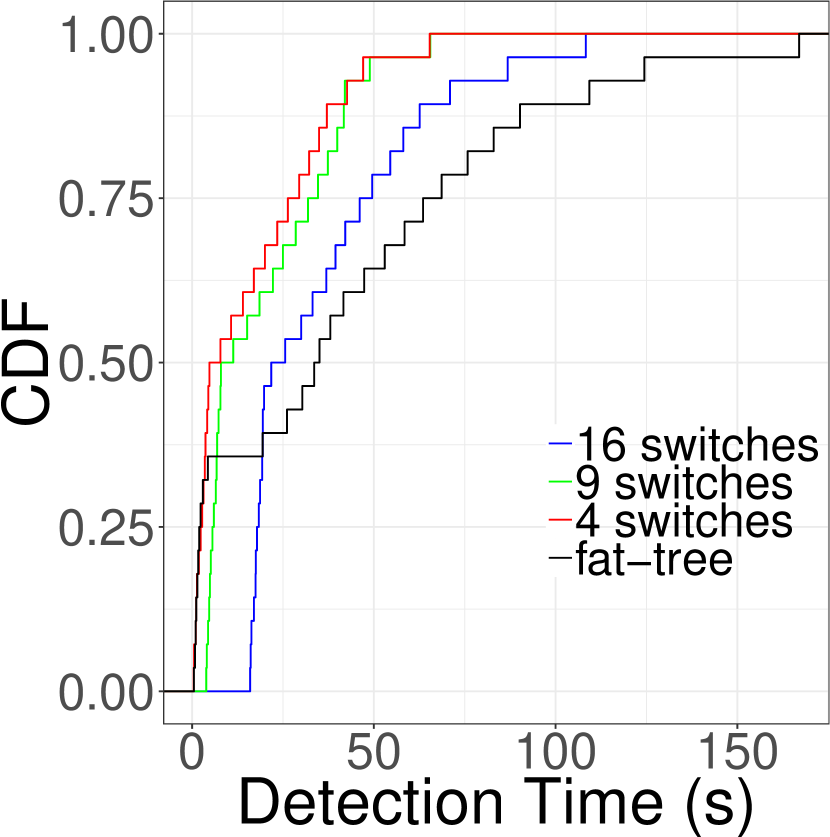
Figure 9 illustrates the cumulative distribution function (CDF) of the Type-p and Type-a faults detected in the four different experimental topologies with the parameters mentioned in Table II. As expected, in a grid 16-switch topology with 60k rules and 75k paths, Pazz takes only 25 seconds to detect 50% of the faults and 105 seconds to detect all of the faults in case of sampling rate 1/100 and polling interval of 1 second (left in Figure 9). For the same sampling rate of 1/100, in the case of 4-ary fat-tree topology with 20 switches containing 100k rules and 75k paths, Pazz detects 50% of the faults in 40 seconds and all faults in 160 seconds. Since the production traffic was replayed at 106 pps in parallel with the fuzz traffic replayed at 1000 pps, the Type-p faults in the production traffic header space (35% of total faults) were detected faster in a maximum time of 24 seconds for all four topologies as compared to the Type-a faults (65% of total faults) in the fuzz traffic header space which were detected in a maximum time of 420 seconds.As the experiment was conducted ten times, the time taken is the mean of the ten values to detect a fault pertaining to a packet header space. We omitted confidence intervals as they are small after 10 runs. In all cases, the detection time difference was marginal.
Localization Time: As per Algorithm 3, the production traffic-specific faults after detection were automatically localized within a span of 50 secs for all four experimental topologies. The localization of faults pertaining to fuzz traffic was manual as there was no expected report from the CPC. Hereby, the localization was done for two cases: a) when the fuzz traffic entered at the ingress port of the entry switch and b) when the fuzz traffic entered in between a pair of ingress and egress ports. For the first case, the localization of each fault happens in a second after the fault was detected by the Consistency Tester as the first switch possessed a flow rule to allow such traffic in the network. For the second case, i.e., where fuzz traffic was injected from between the pair of ingress and egress ports took approx. 2-3 minutes after detection for manual localization as the path was constructed after hop-by-hop inspection of the switch rules.
To compute the CPU usage in Pazz, we measured the CPU time () required for computing expected paths, test and detect inconsistency per sFlow sample analyzed by the Consistency Tester (brain of Pazz) for the 4-ary fat-tree scenario. Our single threaded implementation, required ms (mean), and ms (median) with a minimum of ms, and a maximum of ms for each sample on a single core of the Intel Xeon E- GHz CPU. For the memory usage, topology and configuration are the main factors. The fat-tree scenario with k rules requires the maximum resident set size (RSS) of MB. Memory usage of CPC is mentioned in section IV-F.
IV-E Comparison to Exhaustive Packet Generation
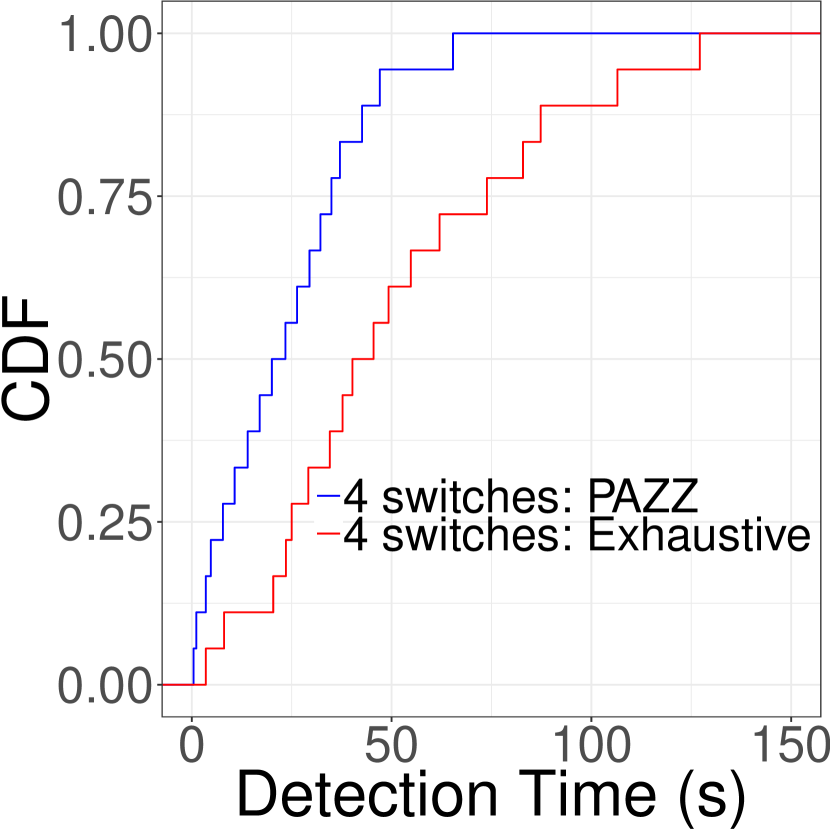
We compare the fault detection time of Pazz which uses Fuzzer against exhaustive packet generation approach. For a fair comparison, the exhaustive packet generation approach generates the same number of flows randomly and at the same rate like Pazz. Figures 9, 9, 9 and 9 illustrate the fault detection time CDF in 4-switch, 9-switch, 16-switch and 4-ary fat-tree (20-switch) experimental topologies respectively. Two figures for each experimental topology illustrates the results for two different sampling rates of 1/100, and 1/1000 (left and right) respectively. The blue line indicates Pazz which uses Fuzzer and the red line indicates exhaustive packet generation approach. As expected, we observe that Pazz performs better than exhaustive packet generation approach. Pazz provides an average speedup of 2-3 times. We observe in all cases, 50% of the faults are detected in a maximum time of ~50 seconds or less than a minute by Pazz. Note we excluded the Fuzzer execution time (section IV-G) in the plots. It is worth mentioning that Pazz will perform much better if we compare against a fully exhaustive packet generation approach which generates 232 flows in all possible destination IPv4 header space. Hereby, the detected faults are Type-a as they require active probes in the uncovered packet header space. Since Pazz relies on production traffic to detect the Type-p faults hence, we get rid of the exhaustive generation of all possible packet header space. Similar results were observed for localization of detected faults.
Multiple Source-Destination Pairs & Header Coverage: We observed the similar results for different source-destination pairs when we placed Fuzzer and production traffic generator at different sources in parallel for a different header space coverage. Figure 9 shows the fault detection time comparison of Pazz against exhaustive packet generation approach for 3 different source-destination pairs in the 4-ary fat tree topology (Figure 8). Note3, Pazz can be extended to Layer-2 and Layer-4 headers.
Figures 10(a), 10(b) illustrate the median fault detection time with quartiles in Pazz against the baseline for 4-ary fat-tree topology (20 switches) with 100k rules for a single source-destination pair for sampling rates: 1/100 and 1/1000 respectively. Note, due to space constraints, we removed the quartile plots for the three grid topologies. To summarize, the results of the four experimental topologies are as expected and similar without any observable deviation.
IV-F Reachability Graph Computation vs Header Space Analysis (HSA) [29]
Table II (Column 5) shows the reachability graph computation in all experimental topologies by the CPC for an egress port. To observe the effect of evolving configs, we added additional rules to various switches randomly. We observe that CPC computes the reachability graph in all topologies in s.
We compare CPC against the state-of-the-art Header Space Analysis (HSA) [29] that can be used to generate reachability graphs to generate test packets and compute covered header space. HSA is also used by NetPlumber [30] and ATPG [2]. We observe that HSA library has scalability issues due to poor support for set operations on wildcards unlike BDDs [52]. Indeed, we reconfirm this by running a simple reachability experiment between a source-destination pair in the fat-tree topology of 20 switches with 100k rules in total. In this experiment, we compare the resource usage of the Python implementation of HSA library with the CPC of Pazz which uses BDDs. HSA requires in excess of GB of memory to compute only possible paths between two ports, while the CPC requires only GB of memory to compute all 75k paths.
IV-G Fuzzer Execution Time & Overhead
Execution Time: Table II (Column 6) illustrates the time taken by Fuzzer to compute the packet header space for fuzz traffic in the four experimental topologies after it receives the covered packet header space (corpus) from the CPC. Since we considered destination-based routing hence, the packet header space computation was limited to 32-bit destination IPv4 address space in the presence of wildcarded rules.
When some of the rules were added to the data plane, the CPC recomputed the corpus, the new corpus was sent to the Fuzzer which recomputed the new fuzz traffic within a maximum time of 7.5 milliseconds.
Overhead: The fuzz traffic contains 54-byte test packets at the rate of 1000 pps on a 1 Gbps link that is 0.04% of the link bandwidth and therefore, minimal overhead on the links at the data plane. Note that most of the fuzz traffic is dropped at the first switch unless there is a flow rule to match that traffic and thus, incurring even less overhead on the links.
IV-H DPC Overhead
We generated different packet sizes from 64 bytes to 1500 bytes at almost Gbps rate on the switches running the DPC software of Pazz and the native OvS switches. We added flow rules on our switches to match the packets and tag them by the Verify shim header using our push_verify, set_Verify_Rule and set_Verify_Port actions in the flow rule. Then, we measured the average throughput over 10 runs.
We observe that the Verify shim header and the tagging mechanism incurred negligible throughput drop as compared to the native OvS. However, a throughput drop of 1.1.% is observed only on the entry switch/exit switch as push_verify actions happen on the entry switch/exit switch to insert the Verify shim header. Furthermore, sFlow sampling is done at the exit switch only. On the contrary, set_Verify_Port and set_Verify_Rule just set the Verify_Port and Verify_Rule fields respectively and have no observable impact. Thus, Pazz introduces minimal packet processing overheads atop OvS.
V Related Work
In addition to the related work covered in section I that includes the existing literature based on [17] and Table I, we now will navigate the landscape of related works and compare them to Pazz in terms of the Type-p and Type-a faults which cause inconsistency (section II). The related work in the area of control plane [27, 28, 29, 30, 34, 36, 37, 31, 32, 33, 35] either check the controller-applications or the control-plane compliance with the high-level network policy. These approaches are insufficient to check the physical data plane compliance with the control plane. As illustrated in Table I, we navigate the landscape of the data plane approaches and compare them with Pazz based on the ability to detect Type-p and Type-a faults. It is worth noting that the approaches either test the rules or the paths whereas Pazz tests both together. In the case of Type-p match faults (section II-C1) when the path is same even if different rule is matched, path trajectory tools [20, 22, 23, 24, 25, 26, 44] fail. The approaches based on active-probing [2, 4, 26, 19, 18, 45] do not detect the Type-a faults (section II-C2) caused by hidden or misconfigured rules on the data plane which only match the fuzz traffic. These tools, however, only generate the probes to test the rules known or synced to the controller. Such Type-a faults are detected by Pazz. Recently, Shukla et al. developed P4CONSIST [21] which relies on production traffic to detect path-based control-data plane inconsistency in P4 SDNs. However, it cannot localize and calso, cannot detect rule-based control-data plane inconsistency in SDNs like Pazz. Furthermore, the packet header space coverage is less than Pazz as it solely relies on production traffic. Recently, P4RL [39] leveraged machine learning-guided fuzzing to detect path deviations in P4 switches. However, P4RL is limited to P4 switches only.
VI Discussion: How far to go?
Motivated by our analysis of existing faults which cause inconsistency in SDNs and the fact that network consistency is only as good as its weakest link, we have argued that we need to take consistency checks further. Using an analogy to program testing, we proposed a novel “bottom-up” methodology, making the case for network state fuzzing.
However, the question of “how far to go?” in terms of consistency checks is a non-trivial one and needs further attention. In particular, while methodologies such as Pazz provide a framework to systematically find (and subsequently remove) faults, in theory, they raise a question of how much resources to invest. Indeed, we observe that providing full coverage of forwarding flow rules, topology, and forwarding paths is inherently expensive: Consider a simplistic linear network of switches with two links between each switch. Assume IP traffic enters from a source and exits on a destination, and each switch stores a simple forwarding rule: switch for bases its forwarding decisions solely on the least significant bit of the destination IP address: packets of even bits are forwarded to the upper link (up) and packets of odd bits to the lower (lo) link. While such a configuration requires only a small constant number of rules per switch, the number of possible paths is exponential in : the set of paths is given by . In addition to the combinatorial complexity of testing static configurations, we face the challenge that both the (distributed) control plane and the data plane state (as well as possibly the network connecting the controllers to the data plane elements) evolve over time, possibly in an asynchronous (or even stateful [27]) and hard to predict manner. This temporal dimension exacerbates the challenge of identifying faults, raising the question “how frequently to check”.
Finally, the question of finding faults can go beyond deciding on the right amount of resources to invest: as any traffic-based testing introduces the inherent “Schrödinger’s cat” problem that tagged traffic may not be subject to the same treatment as the untagged one.
We note that current trends towards programmable data planes [48] and hardware [62] may aid in solving some of the issues this paper raises. INT [47] in P4 specifically tries to solve the problem of network monitoring but is yet to be made scalable for the whole network and is limited to the P4 switches. Still, leveraging programmability, future SDNs will encompass even more possibilities of faults with a mix of vendor-code, reusable libraries, and in-house code. Yet, there will no longer be a common API, i.e., OpenFlow. As such the general problem will persist and we will have to explore how to extend the Pazz methodology to programmable networks.
Overall, as illustrated in Figure 11, Pazz checks consistency at all levels between control and the data plane, i.e., logical physical, logical physical, and logical physical.
VII Conclusion & Future Work
This paper presented Pazz, a novel network verification methodology that automatically detects and localizes the data plane faults manifesting as inconsistency in SDNs. Pazz periodically fuzz tests the packet header space and compares the expected control plane state with the actual data plane state. The tagging mechanism tracks the paths and rules at the data plane while the reachability graph at the control plane tracks paths and rules to help Pazz in verifying consistency. Our evaluation of Pazz over real network topologies and configurations showed that Pazz efficiently detects and localizes the faults causing inconsistency while requiring minimal data plane resources (e.g., switch rules and link bandwidth).
Currently, we do not handle transient faults [63], packet rewriting and checking of backup rules lays the groundwork for our future work. For improving the performance of Pazz further, we consider multithreading at the Consistency Tester will allow multiple flows to be checked in parallel. For DPC, Data Plane Development Kit (DPDK) or P4 can improve the DPC performance. We will consider performance-related faults like throughput, latency and packet-loss. Distributed SDN controller and P4-specific hardware [48, 62] design and implementation will also be a part of our future work.
References
- [1] H. Zeng, P. Kazemian, G. Varghese, and N. McKeown, “A Survey Of Network Troubleshooting,” Stanford University, Tech. Rep. TR12-HPNG-061012, 2012.
- [2] ——, “Automatic test packet generation,” in Proceedings of the 8th international conference on Emerging networking experiments and technologies. ACM, 2012.
- [3] P. Gawkowski and J. Sosnowski, “Experiences with software implemented fault injection,” in Architecture of Computing Systems (ARCS), 2007.
- [4] P. Perešíni, M. Kuźniar, and D. Kostić, “Monocle: Dynamic, Fine-Grained Data Plane Monitoring,” in Proc. ACM CoNEXT, 2015.
- [5] B. Schroeder, E. Pinheiro, and W.-D. Weber, “Dram errors in the wild: a large-scale field study,” in ACM SIGMETRICS Performance Evaluation Review, vol. 37, no. 1. ACM, 2009, pp. 193–204.
- [6] Z. Al-Ars, A. J. van de Goor, J. Braun, and D. Richter, “Simulation based analysis of temperature effect on the faulty behavior of embedded drams,” in Proceedings International Test Conference 2001 (Cat. No. 01CH37260). IEEE, 2001, pp. 783–792.
- [7] NetworkWorld, “Cisco says router bug could be result of ‘cosmic radiation‘ … Seriously?” https://www.networkworld.com/article/3122864/cisco-says-router-bug-could-be-result-of-cosmic-radiation-seriously.html, 2016.
- [8] Y. Yankilevich and G. Malchi, “Tcam soft-error detection method and apparatus,” Jul. 20 2017, US Patent App. 15/390,465.
- [9] R. Mahajan, D. Wetherall, and T. Anderson, “Understanding bgp misconfiguration,” in ACM SIGCOMM Computer Communication Review. ACM, 2002.
- [10] “Cloud leak: Wsj parent company dow jones exposed customer data,” https://www.upguard.com/breaches/cloud-leak-dow-jones/.
- [11] “Con-ed steals the ’net’,” http://dyn.com/blog/coned-steals-the-net/.
- [12] M. Kuźniar, P. Perešíni, and D. Kostić, “What you need to know about sdn flow tables,” in Proc. PAM, 2015.
- [13] N. Katta, O. Alipourfard, J. Rexford, and D. Walker, “Cacheflow: Dependency-aware rule-caching for software-defined networks,” in ACM SOSR, 2016.
- [14] J. Rexford, “SDN Applications,” in Dagstuhl Seminar 15071, 2015.
- [15] M. Kuzniar, P. Peresini, M. Canini, D. Venzano, and D. Kostic, “A SOFT Way for Openflow Switch Interoperability Testing,” in Proc. ACM CoNEXT, 2012.
- [16] M. Kuzniar, P. Peresini, and D. Kostić, “Providing reliable fib update acknowledgments in sdn,” in Proc. ACM CoNEXT, 2014.
- [17] B. Heller, J. McCauley, K. Zarifis, P. Kazemian, C. Scott, N. McKeown, S. Shenker, A. Wundsam, H. Zeng, S. Whitlock, V. Jeyakumar, and N. Handigol, “Leveraging SDN layering to systematically troubleshoot networks,” 2013.
- [18] K. Bu, X. Wen, B. Yang, Y. Chen, L. E. Li, and X. Chen, “Is every flow on the right track?: Inspect SDN forwarding with RuleScope,” in IEEE INFOCOM, 2016.
- [19] P. Zhang, C. Zhang, and C. Hu, “Fast testing network data plane with rulechecker,” in Network Protocols (ICNP). IEEE, 2017.
- [20] P. Zhang, H. Li, C. Hu, L. Hu, L. Xiong, R. Wang, and Y. Zhang, “Mind the gap: Monitoring the control-data plane consistency in software defined networks,” in Proceedings of the 12th International on Conference on emerging Networking EXperiments and Technologies. ACM, 2016.
- [21] A. Shukla, S. Fathalli, T. Zinner, A. Hecker, and S. Schmid, “P4CONSIST: Towards Consistent P4 SDNs,” in IEEE Journal on Special Areas in Communication (JSAC)- NetSoft, 2020.
- [22] N. Handigol, B. Heller, V. Jeyakumar, D. Mazières, and N. McKeown, “I Know What Your Packet Did Last Hop: Using Packet Histories to Troubleshoot Networks,” in USENIX NSDI, 2014.
- [23] S. Narayana, M. Tahmasbi, J. Rexford, and D. Walker, “Compiling Path Queries,” in Proc. USENIX NSDI, 2016.
- [24] P. Tammana, R. Agarwal, and M. Lee, “CherryPick: Tracing Packet Trajectory in Software-Defined Datacenter Networks,” in ACM SOSR, 2015.
- [25] ——, “Simplifying datacenter network debugging with pathdump,” in USENIX OSDI, 2016.
- [26] K. Agarwal, J. Carter, and C. Dixon, “SDN traceroute : Tracing SDN Forwarding without Changing Network Behavior,” 2014.
- [27] S. K. Fayaz, T. Yu, Y. Tobioka, S. Chaki, and V. Sekar, “Buzz: Testing context-dependent policies in stateful networks,” in Proc. USENIX NSDI, 2016.
- [28] H. Mai, A. Khurshid, R. Agarwal, M. Caesar, P. B. Godfrey, and S. T. King, “Debugging the Data Plane with Anteater,” in SIGCOMM, 2011.
- [29] P. Kazemian, G. Varghese, and N. McKeown, “Header Space Analysis: Static Checking for Networks,” in Proc. USENIX NSDI, 2012.
- [30] P. Kazemian, M. Chang, H. Zeng, G. Varghese, N. Mckeown, and S. Whyte, “Real Time Network Policy Checking Using Header Space Analysis,” in Proc. USENIX NSDI, 2013.
- [31] H. Zeng, S. Zhang, F. Ye, V. Jeyakumar, M. Ju, J. Liu, N. McKeown, and A. Vahdat, “Libra: Divide and Conquer to Verify Forwarding Tables in Huge Networks,” in USENIX NSDI, 2014.
- [32] M. Canini, D. Venzano, P. Perešíni, D. Kostić, and J. Rexford, “A NICE Way to Test Openflow Applications,” in Proc. USENIX NSDI, 2012.
- [33] C. Scott, A. Wundsam, B. Raghavan, A. Panda, A. Or, J. Lai, E. Huang, Z. Liu, A. El-Hassany, S. Whitlock et al., “Troubleshooting blackbox sdn control software with minimal causal sequences,” in ACM SIGCOMM Computer Communication Review. ACM, 2015.
- [34] A. Khurshid, X. Zou, W. Zhou, M. Caesar, and P. B. Godfrey, “VeriFlow: Verifying Network-Wide Invariants in Real Time,” in USENIX NSDI, 2013.
- [35] A. Fogel, S. Fung, L. Pedrosa, M. Walraed-Sullivan, R. Govindan, R. Mahajan, and T. D. Millstein, “A general approach to network configuration analysis.” in NSDI, 2015.
- [36] N. P. Lopes, N. Bjørner, P. Godefroid, K. Jayaraman, and G. Varghese, “Checking Beliefs in Dynamic Networks,” in Proc. USENIX NSDI, 2015.
- [37] H. Yang and S. S. Lam, “Real-Time Verification of Network Properties Using Atomic Predicates,” in IEEE/ACM Transactions on Networking, 2016.
- [38] P. Godefroid, M. Y. Levin, and D. Molnar, “SAGE: whitebox fuzzing for security testing,” in CACM, vol. 55, no. 3, 2012.
- [39] A. Shukla, K. N. Hudemann, A. Hecker, and S. Schmid, “Runtime Verification of P4 Switches with Reinforcement Learning,” in ACM SIGCOMM NetAI, 2019.
- [40] P.-W. Chi, C.-T. Kuo, J.-W. Guo, and C.-L. Lei, “How to detect a compromised sdn switch,” in Network Softwarization (NetSoft), 2015. IEEE, 2015.
- [41] M. Antikainen, T. Aura, and M. Särelä, “Spook in your network: Attacking an sdn with a compromised openflow switch,” in Nordic Conference on Secure IT Systems. Springer, 2014.
- [42] G. Pickett, “Staying persistent in software defined networks,” in Black Hat, 2015.
- [43] G. Varghese, “Technical perspective: Treating networks like programs.” New York, NY, USA: ACM, Oct. 2015.
- [44] P. Zhang, S. Xu, Z. Yang, H. Li, Q. Li, H. Wang, and C. Hu, “Foces: Detecting forwarding anomalies in software defined networks,” in ICDCS. IEEE, 2018.
- [45] Y. Ke, H. Hsiao, and T. H. Kim, “SDNProbe: Lightweight Fault Localization in the Error-Prone Environment,” in 2018 IEEE 38th International Conference on Distributed Computing Systems (ICDCS). IEEE, 2018.
- [46] OpenFlow Spec, “https://www.opennetworking.org/images//openflow-switch-v1.5.1.pdf,” 2015.
- [47] C. Kim, A. Sivaraman, N. Katta, A. Bas, A. Dixit, and L. J. Wobker, “In-band network telemetry via programmable dataplanes,” in ACM SOSR, 2015.
- [48] P. Bosshart, D. Daly, G. Gibb, M. Izzard, N. Mckeown, J. Rexford, C. Schlesinger, D. Talayco, A. Vahdat, G. Varghese, and D. Walker, “P4: Programming Protocol-Independent Packet Processors,” 2014.
- [49] H. Zhang, C. Lumezanu, J. Rhee, N. Arora, Q. Xu, and G. Jiang, “Enabling Layer 2 Pathlet Tracing through Context Encoding in Software-Defined Networking,” in HotSDN, 2014.
- [50] S. Panchen, P. Phaal, and N. McKee, “Inmon corporation’s sflow: A method for monitoring traffic in switched and routed networks,” 2001.
- [51] A. Kirsch and M. Mitzenmacher, “Less hashing, same performance: building a better bloom filter,” in ESA. Springer, 2006.
- [52] R. E. Bryant, “Graph-based algorithms for boolean function manipulation.” Washington, DC, USA: IEEE Computer Society, Aug. 1986.
- [53] “Llvm compiler infrastructure: libfuzzer: a library for coverage-guided fuzz testing,” http://llvm.org/docs/LibFuzzer.html.
- [54] Z. Zhang, Q.-Y. Wen, and W. Tang, “An efficient mutation-based fuzz testing approach for detecting flaws of network protocol,” in Computer Science & Service System (CSSS), 2012.
- [55] R. R. Kompella, J. Yates, A. Greenberg, and A. C. Snoeren, “Detection and localization of network black holes,” in INFOCOM 2007. 26th IEEE International Conference on Computer Communications. IEEE.
- [56] G. Castagnoli, J. Ganz, and P. Graber, “Optimum cycle redundancy-check codes with 16-bit redundancy,” in IEEE Transactions on Communications. IEEE, 1990.
- [57] B. Jenkins, “Hash functions,” in Dr Dobbs Journal.
- [58] “Open vswitch,” http://openvswitch.org/, 2016.
- [59] “Apache thrift,” https://thrift.apache.org/.
- [60] “Hassel-public,” https://bitbucket.org/peymank/hassel-public/.
- [61] A. Turner and M. Bing, “Tcpreplay: Pcap editing and replay tools for* nix,” in online], http://tcpreplay. sourceforge. net, 2005.
- [62] D. Firestone et al., “Azure accelerated networking: Smartnics in the public cloud,” in USENIX NSDI, 2018.
- [63] A. Shukla, S. Schmid, A. Feldmann, A. Ludwig, S. Dudycz, and A. Schuetze, “Towards transiently secure updates in asynchronous sdns,” in Proceedings of the 2016 ACM SIGCOMM Conference, 2016, pp. 597–598.