Evolution of interfacial dislocation network during low-stress high temperature creep of particle strengthened alloy system using discrete dislocation dynamics
Abstract
We use three-dimensional discrete dislocation dynamics (DDD) simulations to study the evolution of interfacial dislocation network (IDN) in particle-strengthened alloy systems subjected to a constant stress at high temperatures. We have modified the dislocation mobility laws to incorporate the recovery of dislocation network by climb. The microstructure consists of uniformly distributed cuboidal inclusions embedded in the simulation box. Based on the systematic simulations of IDN formation as a function of applied stress for prescribed inter-particle spacing and glide-to-climb mobility ratio, we derive a relation between effective stress and normalized dislocation density. We use link-length analysis to show self similarity of immobile dislocation links irrespective of the level of applied stress. Moreover, we modify Taylor’s relation to show the dependence of effective stress on ratio between mobile to immobile dislocation density. We justify the relation with the help of a theoretical model which takes into account the balance of multiplication and annihilation rates of dislocation density.
keywords:
discrete dislocation dynamics, creep, superalloyThe dislocation movement and their interactions with underlying microstructure decide the life of strengthened Ni-base superalloys. These alloys exhibit exceptional mechanical strength at high temperature because of precipitation strengthening where coherent precipitates impedes the motion of dislocation through matrix [1]. Many TEM observations have revealed the formation of dense interfacial dislocation network (IDN) around cuboidal precipitates during low to intermediate stresses () and high homologous temperature () creep deformation of these materials [2, 3, 4, 5, 6, 7]. Several groups have reported that the evolution of the dense network of dislocation govern the recovery process during creep. Over the years, researchers have developed sophisticated electron microscopy techniques to investigate the formation of dislocation networks high temperature creep [8, 9, 10, 11, 12, 13]. Most of these investigations show the IDN over the surface of precipitates. They have proposed that such network formed as a result of dislocation reactions. A steady state high temperature creep evolution in particle strengthened alloy system can be visualized as development of three dimensional IDN network and consecutive occurrence of strain hardening and recovery events [14, 15, 16]. Attractive junctions formed due to dislocation reactions contribute to strain hardening. Under the influence of applied stress, eventually the some of the attractive junctions break down and released dislocation gives rise to recovery event. Further, the released dislocation again conjoins the network and consecutive strain hardening and recovery events are repeated.
Most studies conclude that the characteristics of the dislocation network is a complex byproduct of applied stress, lattice misfit, and interparticle spacing [8, 17]. Zhang et.al. [11] have studied the role of sign and magnitude of lattice mismatch between and coherent precipitates on the mobile characteristics of the network. Larger negative misfit transforms more mobile hexagonal morphology to less mobile square network. In some cases, dislocation network contains a mixture of square and hexagonal morphology [7, 18]. Several studies based on computer simulations in three dimensions have been conducted to understand the mechanisms of formation of IDN and its role during the high temperature creep at continuum as well as atomic length scales. Yashiro et. al. [19] investigated the stability of interfacial dislocation network and introduced a softening mechanisms of dislocation penetration through precipitate by using back-force model in DDD framework. Further, using back-force model, Huang et. al. [20] investigated the effect of precipitate size, channel width, and shape of precipitate (spherical and cuboidal) on formation of dislocation network and hardening rate. In another work, Haghighat et. al. [21] reported a DDD model wherein the dislocation-precipitate interaction forces and the conservative climb of edge dislocation as recovery mechanism during high temperature creep is taken into account. Furthermore, Liu et. al. [22] extended the model by incorporating misfit stresses to understand formation of different dislocation junctions (e.g. Lomer junction, Hirth junction, glissile junction, etc.) arising due to dislocation reactions and studied its effect on dynamic recovery during high temperature creep. Using DDD simulations, Gao et. al. [23] have investigated the effect of sign of lattice misfit and sign of applied stress (compressive or tensile) on deformation mechanisms and anisotropy of deformation in channels.
Zhu et. al. [24] studied the formation of interfacial dislocation network using molecular dynamics simulations where stability of dislocation network was shown to be due to the formation of Lomer-Cottrel junctions and dislocation network provides resistance to matrix dislocation to penetrate the particles.
Many studies have analysed the dislocation network using link-length distribution model where the statistical distribution of dislocation link length gives the useful measures of high temperature creep [25, 26, 27, 28]. There exists a stress dependent threshold dislocation link length in the distribution below which all the dislocation links are sessile whereas remaining region consists of mobile dislocation links. A steady state of dislocation network is realised when the dislocation link distribution is time independent. Thus, the ratio of mobile dislocation density to sessile dislocation density is constant at steady state. Sills et. al. [29] reported that dislocation link length follows an exponential distribution using DDD simulations of strain hardening in single crystals at room temperature and showed that the Taylor’s relation is obeyed in DDD simulations. However, at high temperatures (above ) the validity of Taylors’ relation is not known with certainty [30].
In this work, we investigate the mechanisms for the formation of the interfacial dislocation network with the help of DDD method. Besides, we obtain the relationship between normalized dislocation density and normalized effective stress at the steady state high temperature creep and rationalize the relation theoretically.
The constant stress DDD simulations of microstructure comprising of uniformly arranged coherent ordered cuboidal inclusions are performed using modified ParaDis code. The ParaDis code is large scale massively parallel code to perform single crystal discrete dislocation dynamics simulation in FCC and BCC metals. The detailed algorithm and exhaustive exposition to method is available in references [31, 32]. The current open source ParaDis code takes into account dislocation-dislocation elastic interaction and dislocation elastic self-interaction. The detailed model description and governing equations are elucidated in reference [33]. However, we summarize the extensions in the following equations.
-
1.
ParaDis code has been extended to take into account particle-dislocation interaction forces arising due to order strengthening (refer eqn (1)).
(1) Where, is particle-dislocation forces on the segment connecting node and ; is APB energy; is dislocation segment vector; is Burger’s vector; is normal distance from dislocation node to surface of the particle; represents normal vector to the particle from node.
-
2.
For dislocation segments lying on slip planes, octahedral slip and climb is considered. On the other hand, for dislocation segments not lying on slip planes, only isotropic climb is considered (refer (2)). Climb mobility of mixed dislocation segment is described as interpolation between climb mobility of edge component of dislocation segment and glide mobility of screw component of the dislocation segment (see eqn (3)).
(2) where, , , and represents glide, climb, and line components of drag tensor respectively; represents slip plane; represents dislocation line vector; is tangential line vector to dislocation node; , here represents Levi-Civita symbol.
(3) where, and are drag coefficients of edge and screw dislocation segments along slip normal direction. Here, and represents the drag coefficient of screw dislocation along glide direction.
-
3.
The particle in the simulation box is constructed as superellipsoidal inclusions. Previous DDD studies [21, 22] have employ perfect cubes as inclusions, despite the fact that in reality the particles are cuboidal shaped with rounded corners and edges. Superellipsoids are perfect geometric shapes belonging to superquadric family which are similar to cubes but with rounded corners and edges [34].It can be described by following equation
(4) where, ,, and represents the half edge length of cuboid, is the exponent which should be more than 3. Here we chose the value of as .
The simulation box composed of eight equidistant cuboidal inclusion is considered to perform constant stress simulations. Parameters used for simulations are summarized in table 1.
| Shear modulus, | |
|---|---|
| Poisson’s ratio, | |
| Simulation box size | 1 |
| Slip systems | , |
| Burgers vector magnitude | |
| Particle sizes | |
| Channel Spacing | |
| Applied stress | along direction |
| Glide to climb mobility ratio | |
| Climb mobility |
The applied stress levels of , , and are taken in order to understand effect of applied stress. Since the DDD simulations are computationally intensive, in order to obtain appreciable plastic strain, we have chosen higher levels of stresses compared to those used in standard creep experiments. In all set of simulations, we choose inter-particle spacing as . The initial dislocation lines are generated by the cross product of plane normal of particle surface and slip plane of the dislocation. The anti-phase boundary (APB) energy is chosen such that the dislocation segments are impervious to particles. We take the APB energy as .
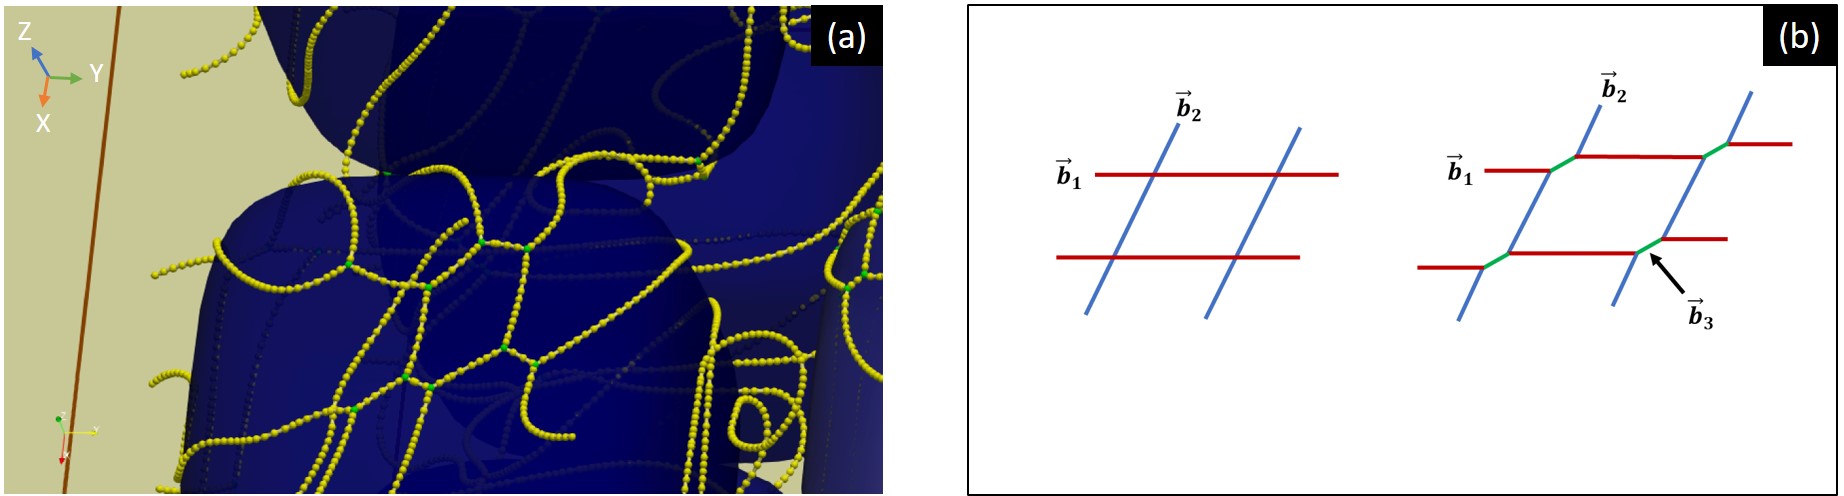
The initial dislocation configuration which is used for each set of simulation is shown in fig 1(a). Figure 1 (b) shows a three dimensional interfacial dislocation network formed around cuboidal particles.
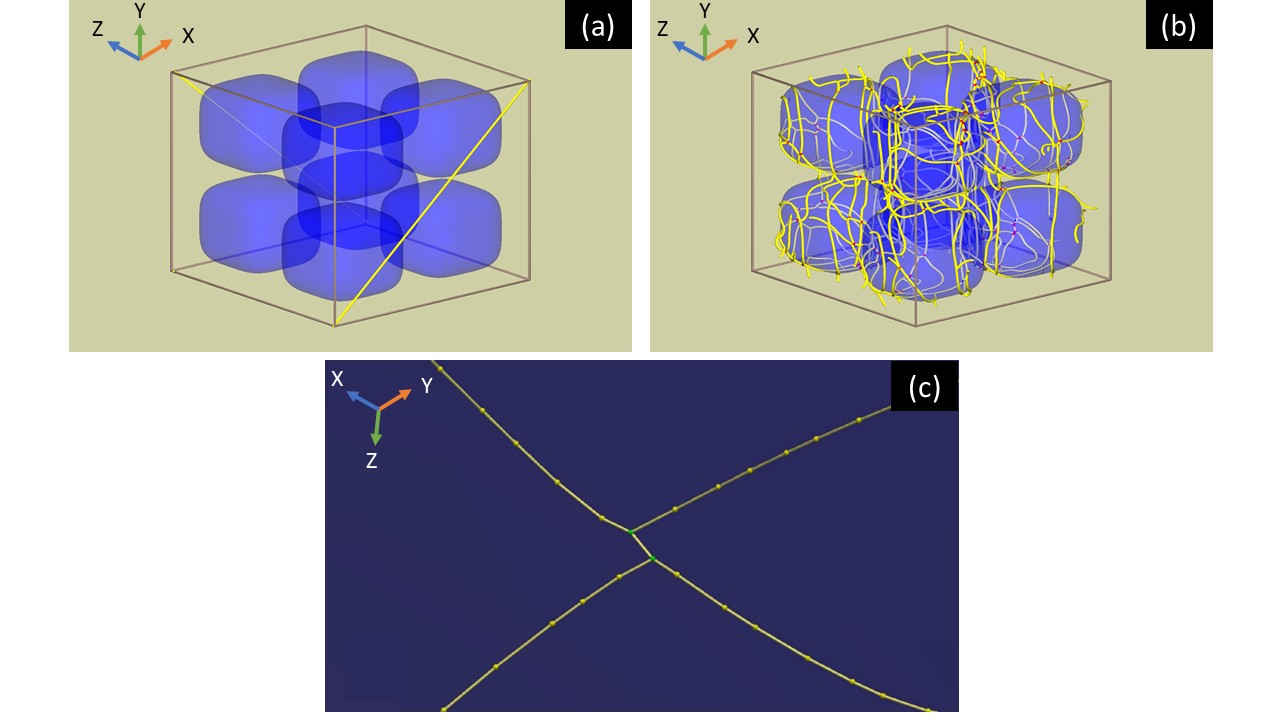
The intersection of non-coplanar dislocations produces triple junction (triple junction is the one where three dislocation segments meet) (see fig 1 (c)). The process is generally referred as zipping of junction. Under some critical stress, however, the unzipping of junction can take place wherein the triple junction can get destroyed. In some instances, since the triple junctions are more energetically favorable, even though quadraple junctions (quadraple junction is one where four dislocation segments meet) are formed, it get converted into two triple junctions. It identifies the fact that triple junctions are most stable which constitutes the complex three dimensional IDN. Every two triple junctions formed hold the dislocation link possessing the Burgers vector which is given as per energetically favorable dislocation reaction shown below
Thus, the Schmid factor associated with newly formed dislocation segment is zero. Consequently, the immobile links act as a bridge between four mobile dislocation segments. This leads to an implication that immobile dislocation links critically controls dynamics of interfacial dislocation network.
The IDN comprises mobile as well as immobile dislocations. The ratio of mobile to immobile dislocation length () in the network is strongly influenced by applied stress, as seen in fig 2(a).
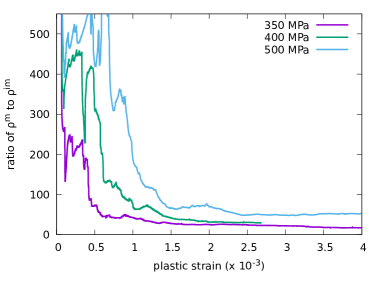
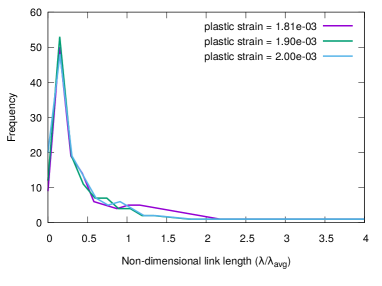
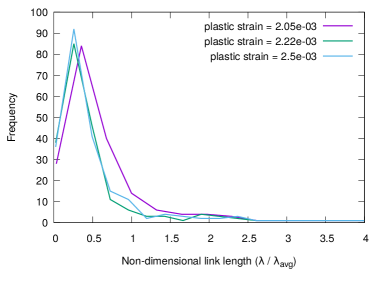
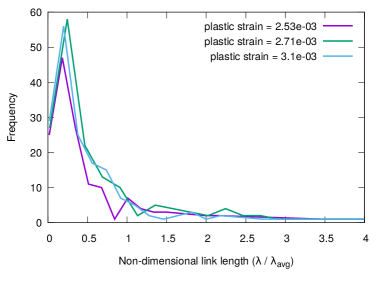
Figure 2(b),(c), and (d) show the distribution of immobile link length. It is evident that the immobile link length distribution is fairly time independent after a critical strain is achieved. The immobile dislocation link length scales inversely with applied stress [35]. The mobile dislocations can easily multiply in simulations with higher applied stresses. Consequently, larger mobile dislocation density has more probability to collide with network to form junctions, and thus the large number of triple junctions of shorter length are formed at higher stresses.
Our simulation results show morphological features of interfacial dislocation network which bears good resemblance to that of the TEM observations. We have observed hexagonal loops over the surface of particles, comprised of dislocation segments with three different Burgers vector (refer fig 3 (a) ) [8, 9]. The formation of hexagonal loops can be explained as illustrated in fig 3 (b). In some instances, distorted hexagonal loops may form as an effect of immobile dislocation links being dragged due to motion of mobile dislocation links. Although, in case of 500 MPa, the loops consist of dislocation segments with three distinct Burgers vectors, the morphology appears to be more square like. This can be attributed to the shorter length of immobile dislocation lengths at applied stress of 500 MPa.
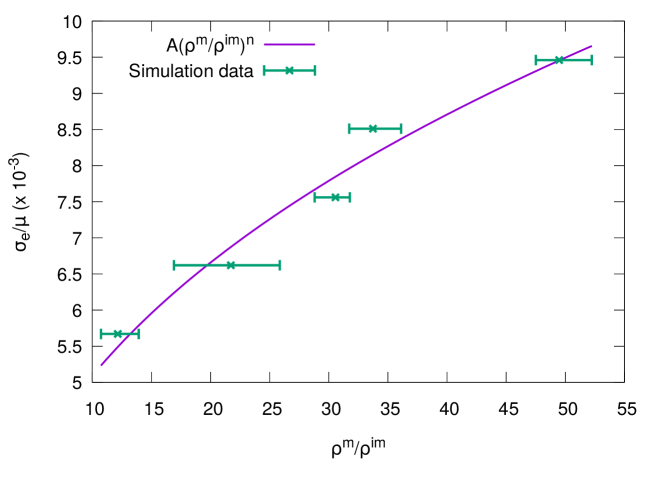
Additionally, we show the relationship between the normalized effective stress () and ratio of mobile to immobile dislocation density (). The effective stress is calculated by subtracting volume average back stress from applied stress. We invoke work hardening theory by Brown-Stobbs [36] to get an approximate measure of back-stress. The back-stress can be approximately given as product of shear modulus (), plastic strain(), and volume fraction of particles. As per figure 2, after a critical strain is achieved, the reaches a steady state values in all cases of different stress levels. Figure 4 represents the effect of normalized applied stress on ratio of mobile to immobile dislocation density. The average values of after the steady state value is reached are obtained and fitted to equation 5.
| (5) |
After fitting, the values of and are obtained to be and with standard error of and respectively. This result signifies that the normalized effective stress scales non-linearly with ratio of mobile to immobile dislocation density. This result displays the deviation from Taylor’s relation where the exponent to dislocation density is half. The deviation from the Taylor’s relation can be attributed to high temperature recovery mechanisms present in the model. In the light of our results, the exponent to dislocation density can be rationalized as per ref [37] which explains the relationship between stress and dislocation density at high homologous temperature. Assume that the rate of increase in dislocation density is proportional to plastic strain rate, i.e.,
| (6) |
where is change in dislocation density, is plastic strain, is time interval, and is proportionality constant. Further, the annihilation of dislocation density at high homologous temperatures is dependent on dislocation spacing. The dislocation spacing can be approximated as . Hence, annihilation rate is given as
| (7) |
where is proportionality constant. From equation (6) and (7), we obtain the net rate of change of dislocation density as
| (8) |
At steady state, where , from equation equation (8), we yield a relation between strain rate and dislocation density as
| (9) |
The stress exponent of single crystal superalloy CMSX-4 varies from 3 to 7 at low to intermediate stresses and high homologous temperatures [38]. Hence
| (10) |
where is proportionality constant and is effective stress. Combining equations (9) and (10), we obtain the relation between effecttive stress and dislocation density as
| (11) |
The exponent we obtained in equation (5) from simulation data lies in between the exponent shown in equation (11).
To summarize, three dimensional DDD simulations are performed by employing the modified ParaDis code. Our simulations show the formation of three dimensional IDN around cuboidal particles. The IDN is formed as a by-product of dislocation reaction. The characteristics of dislocation network morphology resembles well to the experiments. The attractive junction generated due to dislocation reactions provides the strength to the network. The immobile link length distribution is time independent after a critical strain is achieved at given applied stress. Moreover, we present the relationship between applied stress and ratio of mobile to immobile dislocation density and it agrees well with theoretical relation. The relation shows deviation from Taylor’s relation.
References
References
- Reed [2008] R. C. Reed, The superalloys: fundamentals and applications, Cambridge university press, 2008.
- Lasalmonie and Strudel [1975] A. Lasalmonie, J. L. Strudel, Phil. Mag. 32 (1975) 937–949.
- Feller-Kniepmeier and Link [1989] M. Feller-Kniepmeier, T. Link, Mat. Sci. and Engg. A 113 (1989) 191–195.
- Pollock and Argon [1992] T. Pollock, A. Argon, Acta Metal. et Mat. 40 (1992) 1–30.
- Nategh and Sajjadi [2003] S. Nategh, S. A. Sajjadi, Mat. Sci. and Engg. A 339 (2003) 103–108.
- Carroll et al. [2008] L. Carroll, Q. Feng, T. Pollock, Metall. and Mat. Trans. A 39 (2008) 1290–1307.
- Ru et al. [2016] Y. Ru, S. Li, J. Zhou, Y. Pei, H. Wang, S. Gong, H. Xu, Sci. rep. 6 (2016) 29941.
- Gabb et al. [1989] T. Gabb, S. Draper, D. Hull, R. Mackay, M. Nathal, Mat. Sci. and Engg.: A 118 (1989) 59–69.
- Sugui et al. [2000] T. Sugui, Z. Huihua, Z. Jinghua, Y. Hongcai, X. Yongbo, H. Zhuangqi, Mat. Sci. and Engg. A 279 (2000) 160–165.
- Zhang et al. [2002] J. X. Zhang, T. Murakumo, Y. Koizumi, T. Kobayashi, H. Harada, S. Masaki, Metall. and Mat. Tran. A: Phys. Metall. and Mat. Sci. 33 (2002) 3741–3746.
- Zhang et al. [2003] J. X. Zhang, T. Murakumo, H. Harada, Y. Koizumi, Scr. Mat. 48 (2003) 287–293.
- Zhang et al. [2005] J. X. Zhang, J. C. Wang, H. Harada, Y. Koizumi, Acta Mat. 53 (2005) 4623–4633.
- Alexander et al. [2007] E. Alexander, L. Thomas, N. Gert, J. of Micro. 228 (2007) 110–117.
- Lagneborg [1968] R. Lagneborg, J. of Mat. Sci. 3 (1968) 596–602.
- Lagneborg [1969a] R. Lagneborg, Metal Sci. J. 3 (1969a) 18–23.
- Lagneborg [1969b] R. Lagneborg, Metal Sci. J. 3 (1969b) 161–168.
- Yue et al. [2018] Q. Yue, L. Liu, W. Yang, T. Huang, J. Zhang, H. Fu, Mat. Sci. and Engg. A (2018).
- Field et al. [1992] R. Field, T. Pollockf, W. Murphy, Superalloys 1992 (1992).
- Yashiro et al. [2008] K. Yashiro, M. Konishi, Y. Tomita, Comp. Mat. Sci. 43 (2008) 481–488.
- Huang et al. [2012] M. Huang, L. Zhao, J. Tong, Intl. J. of Plast. 28 (2012) 141–158.
- Hafez Haghighat et al. [2013] S. M. Hafez Haghighat, G. Eggeler, D. Raabe, Acta Mat. 61 (2013) 3709–3723.
- Liu et al. [2014] B. Liu, D. Raabe, F. Roters, A. Arsenlis, Acta Mat. 79 (2014) 216–233.
- Gao et al. [2015] S. Gao, M. Fivel, A. Ma, A. Hartmaier, J. of the Mech. and Phy. of Solids 76 (2015) 276–290.
- Zhu et al. [2013] Y. Zhu, Z. Li, M. Huang, Comp. Mat. Sci. 70 (2013) 178–186.
- Lin et al. [1989] P. Lin, S. Lee, A. Ardell, Acta Metall. 37 (1989) 739–748.
- Shi and Northwood [1993] L. Shi, D. Northwood, J. of Mat. Sci. 28 (1993) 5963–5974.
- Ardell and Przystupa [1984] A. Ardell, M. Przystupa, Mech. of Mat. 3 (1984) 319–332.
- Ostrom and Lagneborg [1976] P. Ostrom, R. Lagneborg, J. of Engg. Mat. and Tech. 98 (1976) 114–121.
- Sills et al. [2018] R. B. Sills, N. Bertin, A. Aghaei, W. Cai, Phys. Rev. Lett. 121 (2018) 085501.
- Mecking and Kocks [1981] H. Mecking, U. Kocks, Acta Metall. 29 (1981) 1865–1875.
- Bulatov and Cai [2006] V. Bulatov, W. Cai, Computer simulations of dislocations, volume 3, Oxford University Press on Demand, 2006.
- Arsenlis et al. [2007] A. Arsenlis, W. Cai, M. Tang, M. Rhee, T. Oppelstrup, G. Hommes, T. G. Pierce, V. V. Bulatov, Model. and Sim. in Mat. Sci. and Engg. 15 (2007) 553–595.
- Jogi and Bhattacharya [2016] T. Jogi, S. Bhattacharya, Trans. of the Indian Inst. of Metals 69 (2016) 507–512.
- Jaklic et al. [2013] A. Jaklic, A. Leonardis, F. Solina, Segmentation and recovery of superquadrics, volume 20, Springer Science & Business Media, 2013.
- Madec et al. [2000] R. Madec, B. Devincre, L. P. Kubin, MRS Online Proc. Lib. Arc. 653 (2000).
- Brown and Stobbs [1971] L. M. Brown, W. M. Stobbs, Phil. Mag (1971) 1185–1199.
- Horiuchi and Otsuka [1972] R. Horiuchi, M. Otsuka, Trans. of the Japan Inst. of Metals 13 (1972) 284–293.
- Kondo et al. [2007] Y. Kondo, N. Miura, T. Matsuo, in: Mat. Sci. Forum, volume 539, Trans Tech Publ, pp. 3100–3105.