A Progressive Visual Analytics Tool for
Incremental Experimental Evaluation
Abstract.
This paper presents a visual tool – AVIATOR – that integrates the progressive visual analytics paradigm in the IR evaluation process. This tool serves to speed-up and facilitate the performance assessment of retrieval models enabling a result analysis through visual facilities. AVIATOR goes one step beyond the common “compute–wait–visualize” analytics paradigm, introducing a continuous evaluation mechanism that minimizes human and computational resource consumption.
1. Motivations
The development of a new retrieval model is a demanding activity that goes beyond the definition and the implementation of the model itself. A retrieval model can be conceived as part of an ecosystem where each component interacts with the others to produce the final document ranking for the user. As shown in (Ferro and Silvello, 2018), the effectiveness of a model highly depends on the pipeline components it interacts with (e.g., stoplist and stemmer). To determine which configuration is best in order to get the most out of a model is a demanding activity. In fact, it requires the inspection of several component pipelines and a comparison to baselines through multiple test collections and evaluation measures.
The typical evaluation process comprises the following phases: corpus preprocessing (e.g., tokenization, stopword removal, stemming) and indexing phase, the retrieval phase and the evaluation phase itself. If something is modified in the preprocessing phase, the whole collection has to be re-indexed before testing the retrieval model and conducting the evaluation again. Unfortunately, indexing a collection may require hours, if not days, depending on the hardware and on the collection size. To assess the best configuration of components over multiple collections on the basis of a grid search requires great human effort and computational resources.
We propose an “all-in one visual analytics tool for the evaluation of IR systems” (AVIATOR) to speed up this evaluation process. The idea behind the tool is to improve test retrieval models, calculate approximate measures, explore the results and make baseline comparisons during the indexing phase. AVIATOR allows the user to issue queries to a system while the indexing phase is still running and to explore partial evaluation results in an intuitive way thanks to visual analytics advances. In particular, leveraging on the progressive visual analytics paradigm “enable(s) an analyst to inspect partial results of an algorithm as they become available and interact with the algorithm to prioritize subspaces of interest” (Stolper et al., 2014).
Visual analytics and IR experimental evaluation have interacted before producing visual tools to design and ease failure analysis (Angelini et al., 2014), what-if analysis (Angelini et al., 2016), to explore pooling strategies (Lipani et al., 2017) and to enable interactive grid exploration over a large combinatorial space of systems (Angelini et al., 2018). Nevertheless, they followed the “compute-wait-visualize” paradigm of visual analytics. AVIATOR moves a step beyond (partially) removing the “wait” phase. To the best of our knowledge, our paper is the first to focus on progressive visual analytics employed in IR to enable the dynamic and incremental evaluation of IR systems.
A video showing the main functionalities of the system is available at the URL: https://www.gigasolution.it/v/Aviator.mp4.
2. System Overview
AVIATOR embodies five phases: preprocessing, incremental indexing, retrieval, evaluation and visual analysis.
In the preprocessing phase the document corpus is partitioned into bundles , where , has size and has size . The bundles are populated by uniformly sampling such that . This sampling strategy is described in (Hawking and Robertson, 2003), where it is also shown that biased sub-collections exhibit similar behavior with uniform samples in terms of precision.
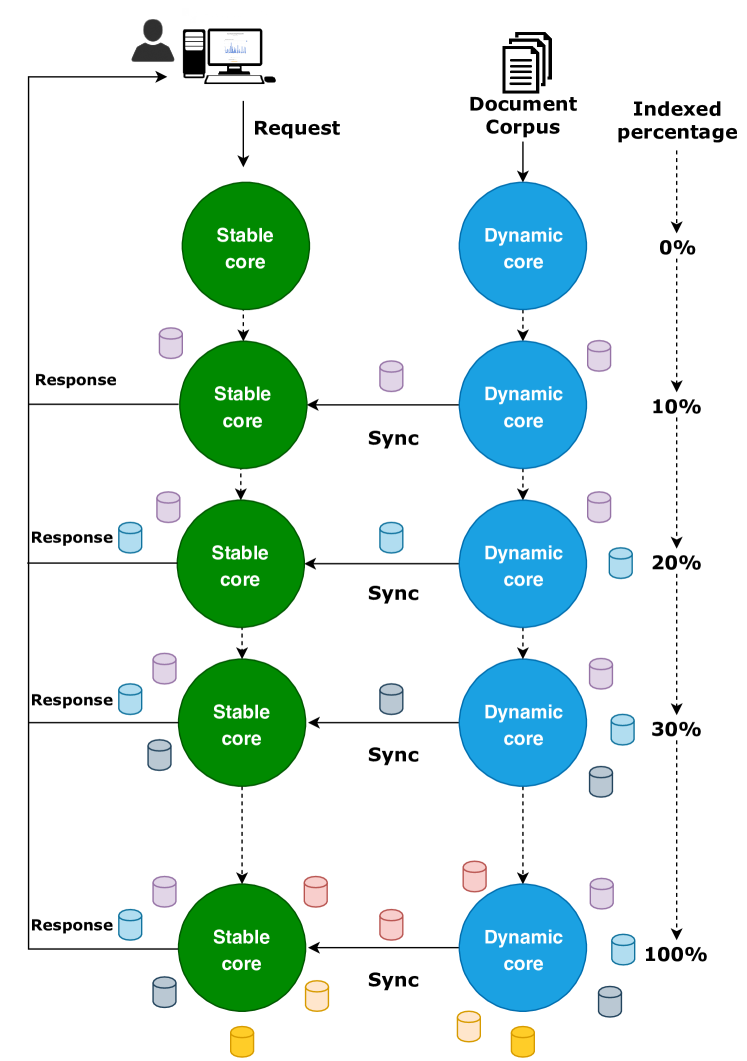
As shown in Figure 1, in the incremental indexing phase, we adopt two parallel system threads each one implementing an independent instance of the same IRS. These threads are referred to as dynamic and stable core, respectively. The dynamic core indexes of the first corpus bundle and then releases the partial index to the stable core. The stable core enables the user to run the retrieval phase on the partial index, while the dynamic core proceeds to index the second bundle. When the second bundle has been indexed, an interrupt is issued to the stable core and the user decides if s/he wants to update the index and run a new retrieval phase or to continue with the index already at hand.
In the retrieval phase the partial index is queried by the user. Currently, AVIATOR is based on batch retrieval on shared test collections. Hence, in each retrieval phase at least 50 queries are issued and a TREC-like run is returned for evaluation. The user can select several standard retrieval models or can use a custom one loaded into the system. This phase can be considered as dynamic since the user can keep querying the partial index by changing the retrieval model or its parameters.
The runs produced in the retrieval phase undergo continuous evaluation as they are being produced. Once the evaluation phase is performed, the results are visualized by the visual analytics component that enables the user to conduct an in-depth and intuitive analysis.
3. Back-end component
The back-end component implements the first four phases described above. AVIATOR is a client-server application built on top of an IR system of choice. In the current implementation, AVIATOR is based on Apache Solr 111http://lucene.apache.org/solr/ which in turn exploits the widely-used Apache Lucene search engine. In the back-end, AVIATOR acts as a wrapper on the IR system, controlling every stage of the IR process (indexing, retrieval and evaluation) via HTTP through a REpresentational State Transfer (REST)ful Web service.
AVIATOR’s demo version is based on the Disk 4&5 of the TREC TIPSTER collection 222https://trec.nist.gov/data/qa/T8_QAdata/disks4_5.html and on the topics (no. ) of the TREC7 ad-hoc track (Voorhees and Harman, 1998). For testing purposes AVIATOR was designed to work with different IR system pipelines including four different stoplists (indri, lucene, terrier, nostop), four stemmers (Hunspell, Krovetz, Porter, nostem), and four IR models (BM25, boolean333The boolean model, implemented in Apache Solr, uses a simple matching coefficient to rank documents, Dirichlet LM, TF-IDF).
The incremental index is designed to work on corpus bundles (10%, 20%, , 100% of the corpus). This implies that, at the time of writing, the AVIATOR demo version works on 160 () different indexes that if statically stored in the memory would occupy up to GB.
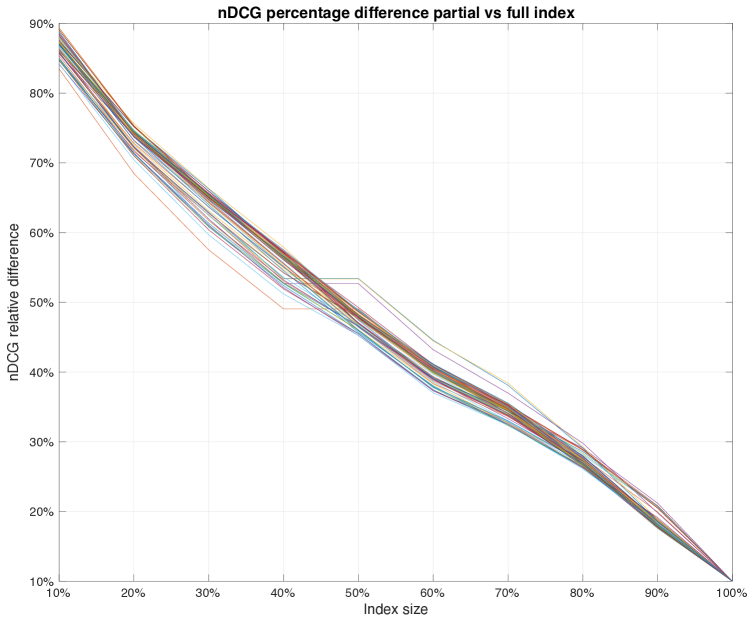
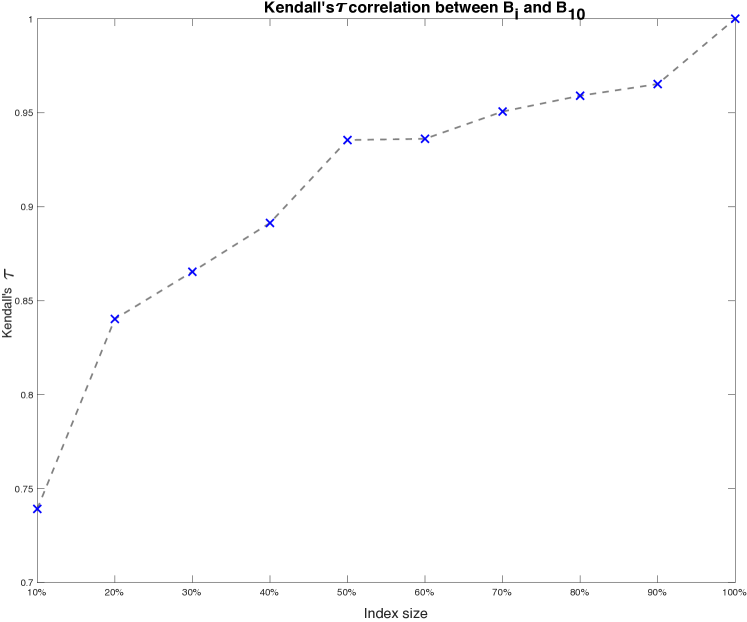
The system run obtained over a partial index is an approximation of the “true” run obtained on the complete index. In Figure 2 we show the average nDCG was shown in relation to the system performance difference between partial and full index. As expected, the precision of the measure grows with the index size and the approximate effectiveness is consistent across all the 64 tested systems. For instance, with index size for most of the systems the nDCG estimation is lower than the true value obtained with the full index. Figure 3 shows that, on the TREC7, the system rankings obtained on partial indexes are highly correlated to the ranking obtained on the full one. The correlation is based on Kendall’s (Kendall, 1948) and, following a common rule of thumb (Voorhees, 2001), two rankings were found to be highly correlated, with . Thus, in comparing all the 64 IR systems on the of the full index () our systems ranking is quite close to the one obtained with the full index. The correlation increases rather rapidly and when half of the collection is indexed, AVIATOR generates a reliable estimation of average system performances.
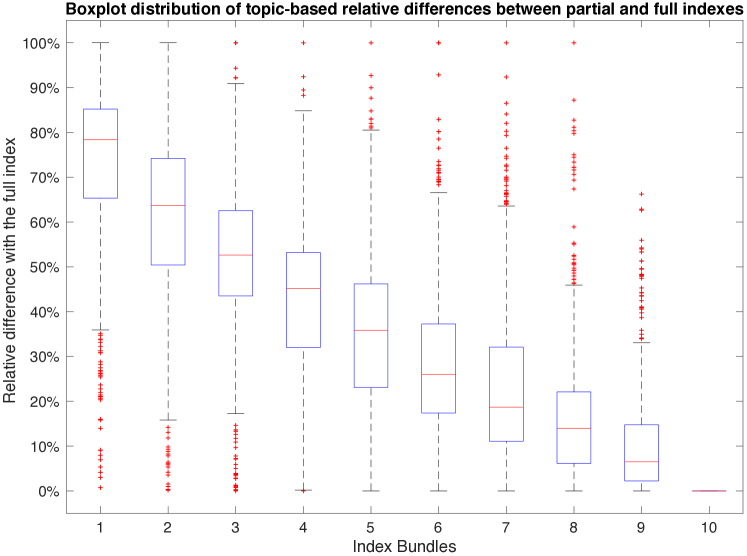
Figure 4 illustrates a topic based analysis of the nDCG where relative difference between the 64 runs are calculated on partial indexes and the final runs are calculated on the full index. We can see that with a index (bundle 1), half of the topics have an nDCG presenting a difference with the true nDCG value. Nevertheless, as can be seen, nDCG approximation improves steadily as the index grows. With half of the collection indexed (bundle 5) the nDCG approximation for half of the topics shows less than a difference from the final value.
4. Front-end component
The front-end component is a Web application designed on the basis of the Model-View-Controller design pattern. Its development leverages on HTML5, D3 444https://d3js.org and JQuery 555https://jquery.com JavaScript libraries.
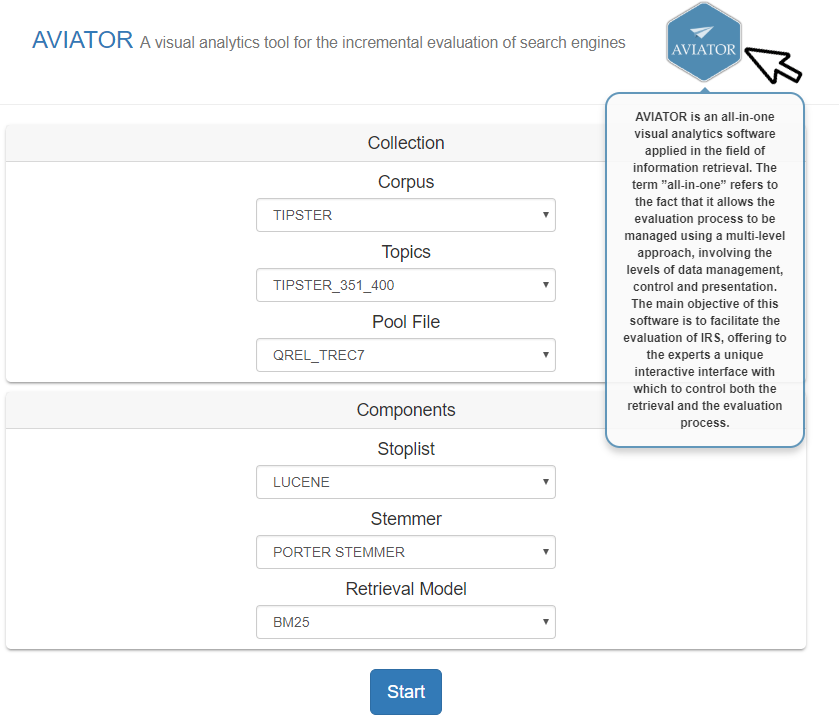
Figure 5 shows the configuration page of AVIATOR. The user can select amongst different corpora, topic sets and pool files. The current version of AVIATOR is based on the TIPSTER collection and TREC7 ad-hoc topics and pool file. For demo purposes the partial indexes have been precomputed. The interaction with the system can therefore be artificially sped up to avoid the actual waiting time between one index version and the next. Moreover, the user can select the stoplist and the stemmer to be used for building the index and a retrieval model. In turn, the retrieval model can be changed afterwards and other models can be added to the evaluation and analytics phase.
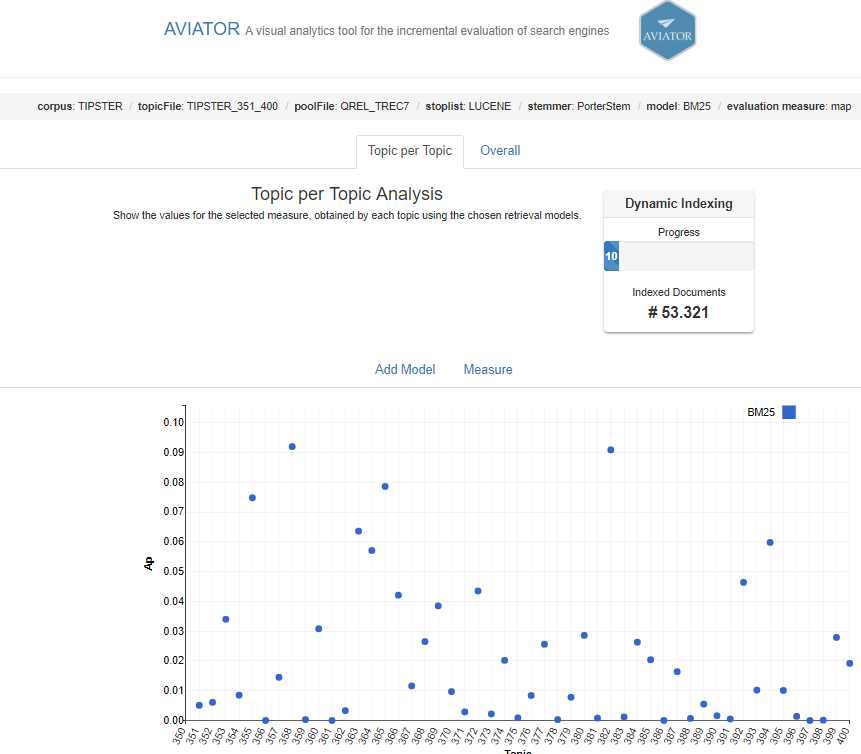
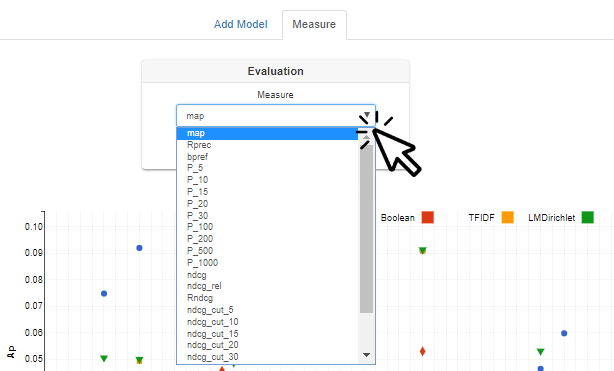
Figure 6 shows the main analytics interface for the topic based analysis. In the top of the screen, the main settings related to the collection and index are reported, as a reference for the user. Below, the two tabs can be used to conduct a topic based or an overall analysis. In the top-right corner, the user can see the percentage of the corpus and the number of documents currently indexed. The main interaction interface shows a scatter plot with the Average Precision values of the retrieval model selected in the configuration phase. Just above the scatter plot, the two tabs can be used to add new retrieval models and to change the evaluation measure, as shown in Figure 7 (all measures returned by trec_eval are available).
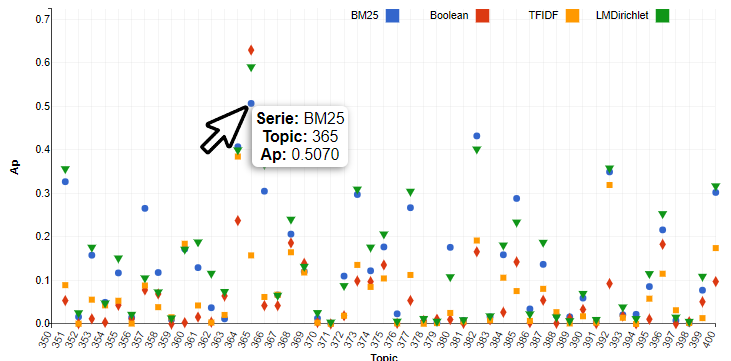
Figure 8 illustrates the scatter plot. Four different retrieval models can be compared through a pop-up window that can be triggered with a mouse over the points of the plot. The pop-up reports the retrieval model, the measure value and the topic being inspected. The user can zoom over a specific part of the scatter plot to better inspect the results.
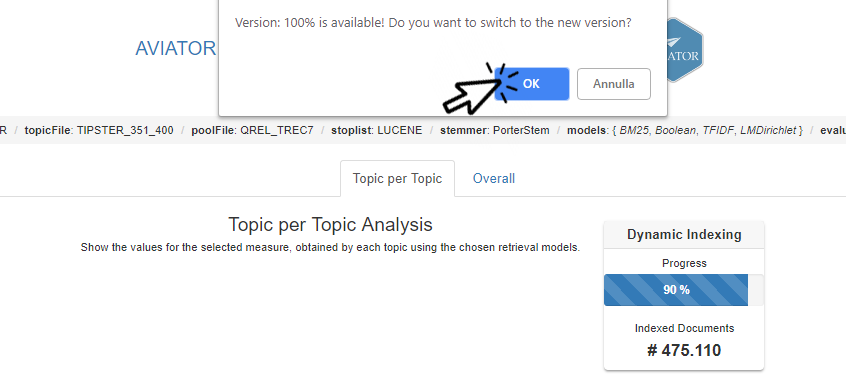
Figure 9 illustrates how the user is notified when a new version of the index is ready. The user can decide whether or not to work on a new version of the index. When a new version of the index is loaded all the visualizations are updated accordingly and the user settings are maintained from one version to the next.
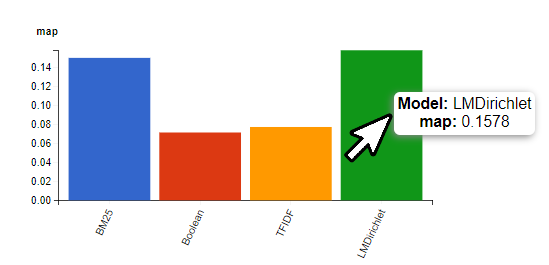
Figure 10 shows the interface enabling the inspection of overall results (averaged over all topics) of the tested retrieval models. In this case too, a mouse over the plot bars triggers a pop-up window, providing detailed information on the inspected system.
Diagrams, images, screen shots
References
- (1)
- Angelini et al. (2018) M. Angelini, V. Fazzini, N. Ferro, G. Santucci, and G. Silvello. 2018. CLAIRE: A combinatorial visual analytics system for information retrieval evaluation. Information Processing & Management in print (2018). https://doi.org/10.1016/j.jvlc.2013.12.003
- Angelini et al. (2014) M. Angelini, N. Ferro, G. Santucci, and G. Silvello. 2014. VIRTUE: A Visual Tool for Information Retrieval Performance Evaluation and Failure Analysis. J. Vis. Lang. Comput. 25, 4 (2014), 394–413. https://doi.org/10.1016/j.jvlc.2013.12.003
- Angelini et al. (2016) M. Angelini, N. Ferro, G. Santucci, and G. Silvello. 2016. A Visual Analytics Approach for What-If Analysis of Information Retrieval Systems. In Proc. 39th Annual International ACM SIGIR Conference on Research and Development in Information Retrieval (SIGIR 2016). ACM Press, New York, USA.
- Ferro and Silvello (2018) N. Ferro and G. Silvello. 2018. Toward an anatomy of IR system component performances. Journal of the Association for Information Science and Technology 69, 2 (2018), 187–200. https://doi.org/10.1002/asi.23910
- Hawking and Robertson (2003) D. Hawking and S. E. Robertson. 2003. On Collection Size and Retrieval Effectiveness. Information Retrieval 6, 1 (2003), 99–105.
- Kendall (1948) M.G. Kendall. 1948. Rank correlation methods. Griffin, Oxford, England.
- Lipani et al. (2017) A. Lipani, M. Lupu, and A. Hanbury. 2017. Visual Pool: A Tool to Visualize and Interact with the Pooling Method. In Proc. 40th Annual International ACM SIGIR Conference on Research and Development in Information Retrieval (SIGIR 2017). ACM Press, New York, USA.
- Stolper et al. (2014) C. D. Stolper, A. Perer, and D. Gotz. 2014. Progressive Visual Analytics: User-Driven Visual Exploration of In-Progress Analytics. IEEE Trans. Vis. Comput. Graph. 20, 12 (2014), 1653–1662.
- Voorhees (2001) E. Voorhees. 2001. Evaluation by Highly Relevant Documents. In Proc. 24th Annual International ACM SIGIR Conference on Research and Development in Information Retrieval (SIGIR 2001), D. H. Kraft, W. B. Croft, D. J. Harper, and J. Zobel (Eds.). ACM Press, New York, USA, 74–82.
- Voorhees and Harman (1998) E. M. Voorhees and D. Harman. 1998. The Text Retrieval Conferences (TRECS). In TIPSTER TEXT PROGRAM PHASE III:. Morgan Kaufmann.