AT 2017fvz: a nova in the dwarf irregular galaxy NGC 6822
Abstract
A transient in the Local Group dwarf irregular galaxy NGC 6822 (Barnard’s Galaxy) was discovered on 2017 August 2 and is only the second classical nova discovered in that galaxy. We conducted optical, near-ultraviolet, and X-ray follow-up observations of the eruption, the results of which we present here. This ‘very fast’ nova had a peak -band magnitude in the range mag, with decline times of d and d. The early- and late-time spectra are consistent with an Fe ii spectral class. The H emission line initially has a full width at half-maximum intensity of km s-1 – a moderately fast ejecta velocity for the class. The H line then narrows monotonically to km s-1 by 70 d post-eruption. The lack of a pre-eruption coincident source in archival Hubble Space Telescope imaging implies that the donor is a main sequence, or possibly subgiant, star. The relatively low peak luminosity and rapid decline hint that AT 2017fvz may be a ‘faint and fast’ nova.
keywords:
novae, cataclysmic variables – stars: individual (AT 2017fvz)1 Introduction
Classical novae (CNe) belong to the class of accreting binaries known as cataclysmic variables. As first proposed by Walker (1954), these are closely interacting binaries consisting of a white dwarf (WD) accreting material from a donor – either a main sequence, subgiant, or red giant star (see Darnley et al., 2012). Through Roche-lobe overflow or the stellar wind of an evolved donor, hydrogen-rich material from the donor streams, usually via an accretion disk (Warner, 1995), onto the WD where severe heating and compression take place. Given favourable conditions, this results in a thermonuclear runaway (TNR) within the accreted envelope on the WD with a proportion of that envelope subsequently ejected — the nova eruption (Starrfield et al., 1976). The luminosity of these systems typically increases to a few (see, e.g., Bode, 2010) with peak absolute magnitudes reaching in extreme cases (Shafter et al., 2009; Aydi et al., 2018).
Following the TNR, stable H-burning continues within any material remaining on the WD surface. This results in the emission of a large amount of X-rays typically peaking in the range eV — the so-called super-soft X-ray source (SSS; see van den Heuvel et al., 1992). The SSS is initially obscured by optically thick ejecta surrounding the nova; however, once the optical depth has decreased sufficiently, the SSS is unveiled.
All novae are predicted to recur (Yaron et al., 2005), but the broad range of times between consecutive eruptions has led to segregation based on recurrence period (). CNe have been observed to erupt just once. Recurrent novae (RNe) are systems with a high-mass WD and high accretion rates that have been recorded erupting multiple times.
One can categorise novae into different speed classes based on their decline times, and (Payne-Gaposchkin, 1957). These denote the time taken to decay by 2 or 3 mag (respectively) from maximum light. Zwicky (1936) first proposed a relationship between the decline time and the maximum absolute visual magnitude of a nova. Subsequently, Mclaughlin (1945) and Arp (1956) developed the ‘maximum magnitude – rate of decline’ relation (MMRD; see, e.g., Downes & Duerbeck, 2000). However, the MMRD suffers from a large scatter, and the relation has been diluted by the discovery of ‘faint and fast’ novae (Kasliwal et al., 2011; Shara et al., 2016) and short-cycle RNe ( yr; Darnley & Henze, in prep.).
Independent studies of Galactic novae using Gaia data release 2 (DR2; Gaia Collaboration et al., 2018) parallaxes appear to show contradictory results. Schaefer (2018) proposes that the MMRD is an unusable distance determination method and that it should no longer be employed. However, Selvelli & Gilmozzi (2019) show that the MMRD relationship is strengthened once Gaia distances are assumed. Although there is some overlap, these two studies use different samples of novae. Shara et al. (2017) used a large sample of M 87 novae to clearly demonstrate (see their Figure 1) the impact of ‘faint and fast’ novae on the MMRD distribution and therefore that the concept is inherently flawed.
Novae may be divided into two spectroscopic classes based on the prominent non-Balmer emission lines in their early-post-maximum spectra: either He/N or Fe ii (Williams, 1992, 1994). The contribution of novae from each class varies between different galaxies, possibly due to variations in the dominant stellar population and metallicity of a given host (Shafter, 2013). Novae from younger (disk) populations have higher mean WD masses than those from older (bulge) populations. High-mass WDs create lower mass but higher velocity ejecta than their low-mass counterparts, and are believed to produce the He/N dominant spectra, with the lower mass WDs creating the Fe ii class (Williams, 2012; Shafter, 2013).
The study of novae in extragalactic environments provides the only way to explore how the local environment (e.g., the metallicity and star-formation rate) can affect the nova rate and characteristics of nova eruptions (Shara et al., 2016). The M 31 nova population is dominated by the Fe ii class (82%; Shafter et al., 2011). Yet ‘bulgeless’ galaxies show similar numbers of each class. For example, five of the ten spectroscopically classified novae in M 33 are Fe ii; the M 33 spectral type distribution differs from that of M 31 at the 98% confidence level (Shafter et al., 2012, 2014). The fraction of Fe ii novae in the LMC is also (Shafter, 2013).
NGC 6822 is a dark matter dominated (Weldrake et al., 2003) dwarf irregular galaxy in the Local Group at a distance kpc (Rich et al., 2014). It provides a low-metallicity environment compared to the majority of Local Group novae: [Fe/H] (see, e.g., Larsen et al., 2018).
AT 2017fvz111https://wis-tns.weizmann.ac.il/object/2017fvz (aka KAIT-17bm) is only the second nova to be discovered within NGC 6822 (see Section 4.1 for a discussion of the first nova). It was discovered on 2017 Aug. 2.384 UT with an unfiltered magnitude of 17.6 at , (J2000; Hestenes, Zheng & Filippenko, 2017) by the Katzman Automatic Imaging Telescope (KAIT; Filippenko et al., 2001) of the Lick Observatory Supernova Search (LOSS). This nova was also observed by the All-Sky Automated Survey for Supernovae (ASAS-SN; see Shappee et al., 2014) on Aug. 3.190 and then with the Asteroid Terrestrial-impact Last Alert System (ATLAS; Tonry et al., 2018; Heinze et al., 2018) on Aug. 3.386.
Here we report optical, near-ultraviolet (NUV), and X-ray observations of the eruption of AT 2017fvz. In Section 2 we describe the observations and data analysis. In Section 3 we present the results of the photometry, spectroscopy, and X-ray analysis, and we discuss these in Section 4. We summarise our findings in Section 5. Throughout, all times are quoted in coordinated universal time (UT), all uncertainties are quoted to 1, and all upper limits to 3.
2 Observations and Analysis
2.1 Ground-based photometry
The field containing the nova had been monitored by KAIT using its clear filter since 2017 July 15.404 without any associated detections until the discovery on Aug. 2.384, after which the nova was followed until Aug. 31.284. ATLAS monitored a similar field from July 5.477 using its ‘orange’ filter, approximately covering and (5600–8200 Å)222http://www.fallingstar.com/specifications.php, without any associated detections until the first detection on Aug. 3.386. Like KAIT, the nova was monitored after discovery by ATLAS for the next 47 d until Sep. 19.317 using the orange filter and also a ‘cyan’ filter which approximately covers and (4200–6500 Å). A few hours before the ATLAS detection, the nova was detected by ASAS-SN on 2017 Aug. 3.190 with a -band filter. A Liverpool Telescope (LT; Steele et al., 2004) follow-up campaign began 7.53 d post-discovery; observations were taken with IO:O333http://telescope.livjm.ac.uk/TelInst/Inst/IOO through filters.
Debiasing and flatfielding of the LT data were performed by the automatic LT reduction pipeline. Aperture photometry was calculated from these data using standard tools within PyRAF and calibrated against stars from the Local Group Galaxies Survey (LGGS; Massey et al., 2007). The magnitudes of the LGGS stars were calculated using transformations from Jester et al. (2005, their Table 1). Each time spectra were obtained with the SPectrograph for the Rapid Acquisition of Transients (SPRAT; Piascik et al., 2014, see Section 2.2) by the LT, acquisition images were also taken using the SPRAT detector. These images were reduced in the same manner as the IO:O data. The acquisition images were unfiltered, but the photometry was calibrated relative to the filter.
The KAIT data were reduced using a custom pipeline (Ganeshalingam et al., 2010). Point-spread-function (PSF) photometry was obtained using the IDL implementation of DAOPHOT (Stetson, 1987; Landsman, 1993). Several nearby stars from the APASS catalog (Henden et al., 2009) were used to calibrate the KAIT clear-band data, with their magnitudes converted to the Landolt -band system using the empirical prescription presented by R. Lupton444http://sdss.org/dr7/algorithms/sdssUBVRITransform.html.
2.2 Spectroscopy
The optical spectra of AT 2017fvz were taken using SPRAT on the LT. SPRAT is a spectrograph with a slit long and wide giving a resolution of 18 Å per pixel, corresponding to at the centre of the spectrum. It covers visible wavelengths in the range 4000–8000 Å. The details of the spectra, which were obtained using the blue-optimised mode, are summarised in Table 1. All spectra were extracted, wavelength calibrated, and flux calibrated using the SPRAT pipeline (Piascik et al., 2014), except for the Aug. 25 spectrum which was not flux calibrated owing to poor sky transparency (clouds). The spectra were then analysed using routines with PyRAF.
| UT Datea | MJD (d) | (d) | Exposure time (s) |
|---|---|---|---|
| 2017-08-09.900 | 57974.900 | 8.016 | |
| 2017-08-15.924 | 57980.924 | 14.040 | |
| 2017-08-19.894 | 57984.894 | 18.010 | |
| 2017-08-25.885 | 57990.885 | 24.001 | |
| 2017-09-12.879 | 58008.879 | 41.995 | |
| 2017-10-10.848 | 58036.848 | 69.964 |
-
•
aThe date refers to the midpoint of each observation.
2.3 Swift NUV and X-ray observations
Five target-of-opportunity (ToO) observations with the Neil Gehrels Swift Observatory (Gehrels et al., 2004), totalling 20.0 ks, were utilised to follow the NUV and X-ray evolution of the AT 2017fvz (Target ID: 10268). We summarise all of the Swift data in Table 2.
| Expa | Dateb | MJD | X-ray rate ( ct s-1) | ( erg s-1) | ||||
|---|---|---|---|---|---|---|---|---|
| (ks) | (UT) | (d) | (d) | (mag) | 0.3–1 keV | 0.3–10 keV | 0.3–1 keV | 0.3–10 keV |
| 3.9 | 2017-09-09 | 58005 | 38.12 | |||||
| 3.7 | 2017-10-08 | 58034 | 67.12 | |||||
| 3.4 | 2017-11-07 | 58064 | 97.12 | |||||
| 3.7 | 2018-04-27 | 58235 | 268.12 | |||||
| 4.0 | 2018-08-25 | 58355 | 388.12 | |||||
-
•
aDead-time corrected XRT exposure time.
-
•
bStart date of the observation.
-
•
cTime since day of eruption on 2017 Aug. 1.884.
-
•
dVega magnitudes for the filter (central wavelength: 2600 Å).
-
•
eX-ray luminosity upper limits (unabsorbed, blackbody fit, 0.3–1 keV or 0.3–10 keV, as indicated).
NUV data were obtained with the UV/Optical Telescope (UVOT; Roming et al., 2005) through the filter. X-ray data were collected by the X-ray Telescope (XRT; Burrows et al., 2005) in photon-counting mode. The NUV data were processed with HEASoft tools (v6.24; Blackburn, 1995) and using the most recent calibration files. We extracted the count-rate upper limits from the X-ray data using the online Swift XRT tool555http://www.swift.ac.uk/user_objects/ (Evans et al., 2009).
3 Results
3.1 Reddening
NGC 6822 has a Galactic longitude and latitude of and , respectively (Mateo, 1998). This results in that galaxy being affected by a modest amount of foreground Milky Way extinction. Kayser (1967) found the Galactic reddening toward the outer regions of NGC 6822 to be mag, as did Massey et al. (1995) with mag. These are consistent with Gallart et al. (1996) and Massey et al. (2007) who found mag and mag, respectively. The online dust-mapping tool666http://argonaut.skymaps.info (Green et al., 2018) returns a Galactic reddening toward NGC 6822 of mag.
Cepheid variables within NGC 6822 have been employed to estimate the internal reddening. McAlary et al. (1983) found mag, Gieren et al. (2006) reported a similar average reddening of mag. Rich et al. (2014) used optical and infrared data for Cepheids to determine that the foreground reddening along the line of sight to NGC 6822 is mag.
We have no knowledge of the radial displacement of AT 2017fvz within NGC 6822 so we adopt the two most extreme values of reddening. The foreground reddening toward NGC 6822 gives the lower limit, the addition of reddening internal to NGC 6822 gives the upper limit.
3.2 Photometric evolution
The AT 2017fvz photometry from ASAS-SN, ATLAS, KAIT, LT, and Swift are presented in Figure 1 and in Tables 8–10. The light curves illustrate that the nova was discovered prior to peak optical magnitude. We calculate the time of eruption to be 2017 Aug. , the midpoint between the last nondetection (KAIT) with mag on 2017 Aug. 1.384 and the discovery on Aug. 2.384. Throughout, we refer to the time of eruption as .
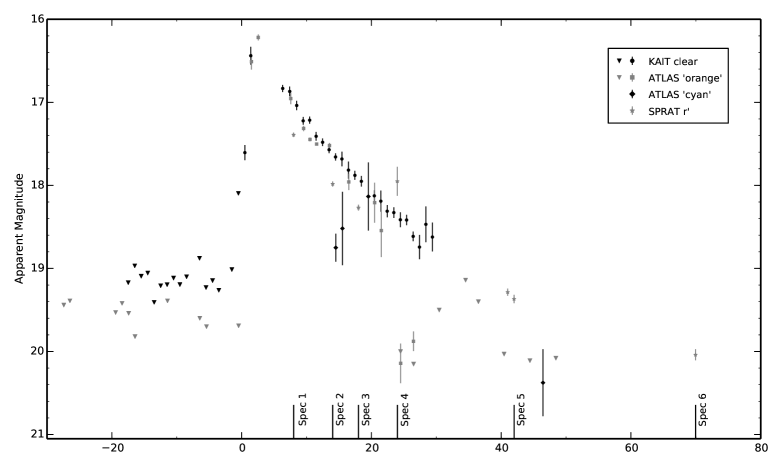
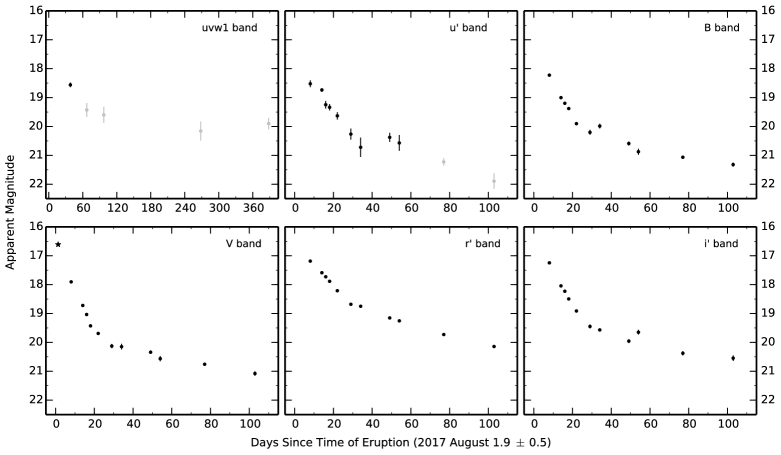
The , , and bands all fade at approximately the same rate from peak until around 40 d, while fades more slowly and even slower owing to the strong influence of the H emission line on the broad-band photometry. We estimated the decline times ( and ) of AT 2017fvz by taking the brightest data point as the peak of the eruption and assuming a power-law decline (in luminosity) (see, e.g., Hachisu & Kato, 2006). The decline times for each filter are recorded in Table 3. If we utilise the decline times with the MMRD relation (Downes & Duerbeck, 2000), then we would expect peak absolute magnitudes of and for and , respectively. It should be noted that this MMRD was derived from Galactic novae and, in addition to other limitations, may not be reliable within the differing environment of NGC 6822 (see Section 4.3).
| Filter | (d) | (d) |
|---|---|---|
Taking the distance modulus of NGC 6822 as mag (Rich et al., 2014), correcting for foreground reddening using mag, we derive a lower limit for the peak absolute magnitude of . Here, we assumed that the peak observed magnitude (ASAS-SN) corresponded to the peak of the eruption. By extrapolating the -band light curve power-law fit back to the final pre-eruption nondetection, we can estimate an upper limit on the peak eruption magnitude. Combining this upper limit with the estimate of the total (foreground and internal) reddening ( mag) yields an upper limit for the peak absolute magnitude of .
There is evidence for a ‘plateau’ in the , , , and -band light curves around d. As such, this nova would belong to the ‘plateau’ class (P-class; Strope et al., 2010), where an otherwise smoothly declining light curve is interrupted by a short period when the optical magnitude remains approximately constant.
3.3 Spectroscopic evolution
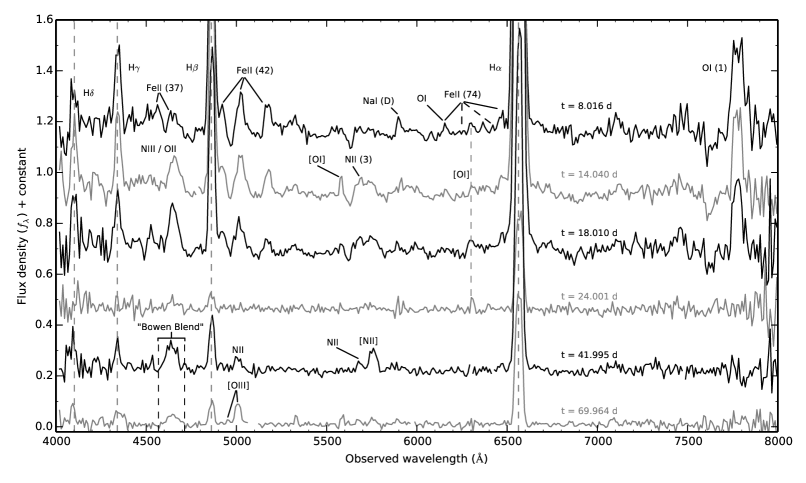
To aid the analysis of the AT 2017fvz spectra, we made extensive use of spectral line data from Moore (1945) and Williams (2012). All of the spectra of AT 2017fvz are plotted in Figure 2. These spectra can be split into three groups: the first contains the first four spectra that are within a -day-long period during early decline; the fifth spectrum was taken at d during the plateau, and the sixth was taken at d during the nebular phase. The spectra are presented in the rest frame of the observer. The average radial velocity of NGC 6822 is km s-1 (Koribalski et al., 2004). The flux and full width at half-maximum intensity (FWHM) velocity were calculated by fitting Gaussian profiles to the emission lines using the SPLAT package in STARLINK; the fluxes and velocities are reported in Tables 4 and 5, respectively.
| Line identification | |||||
|---|---|---|---|---|---|
| (rest wavelength [Å]) | d | d | d | d | d |
| H (4102) | 6 3 | 8 2 | 7 3 | 2 1 | 1.7 0.4 |
| H (4341) | 12 1 | 9 1 | 7 1 | 2.4 0.5 | 2.0 0.6 |
| H (4861) | 30 3 | 31 4 | 27 2 | 6.8 0.5 | 2.4 0.5 |
| [O iii] (5007) | – | – | – | – | 2.6 0.4 |
| Fe ii (5018) | 4.6 0.7 | 5 1 | – | – | – |
| H (6563) | 139 6 | 210 10 | 230 10 | 61 3 | 24 2 |
| O i (7773) | 28 4 | 22 3 | 16 2 | – | – |
-
•
We have not included the spectrum from 24.001 d after eruption because the fluxes are not reliable.
| Line identification | ||||||
|---|---|---|---|---|---|---|
| (rest wavelength [Å]) | d | d | d | d | d | d |
| H (4102) | 2600 900 | 2100 300 | 2100 600 | – | 900 50 | 1500 300 |
| H (4341) | 2500 200 | 2000 200 | 2200 300 | – | 1400 200 | 3500 800 |
| H (4861) | 2300 200 | 2100 200 | 1900 100 | – | 1800 100 | 1600 200 |
| [O iii] (5007) | – | – | – | – | – | 1900 200 |
| Fe ii (5018) | 1900 200 | 2200 200 | – | – | – | – |
| H (6563) | 2430 70 | 2300 100 | 2070 70 | 2000 90 | 1840 60 | 1900 100 |
| O i (7773) | 2800 300 | 2200 200 | 2000 200 | – | – | – |
-
•
a This velocity is an upper limit as the H line is blended with other lines around this wavelength.
3.3.1 Early Decline
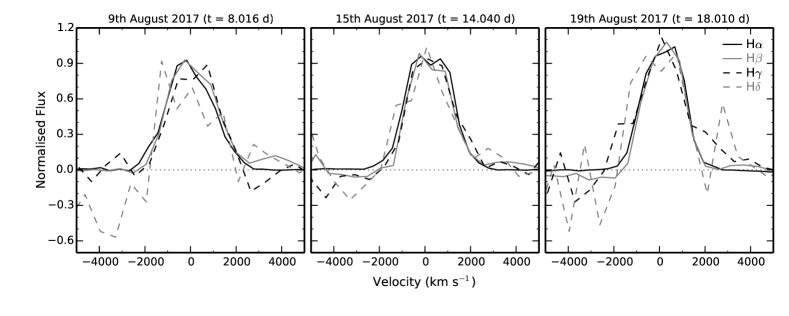
The first spectrum was taken at d when the nova was in the early decline phase (Williams & Darnley, 2017). By this time, we have missed the optically thick ‘fireball’ stage which occurs on the rise until around peak brightness. We may have caught the very end of this transition with some of the Fe ii lines and the H emission line still showing tentative signs of P Cygni profiles. The H line has a small blueshifted absorption component with a midpoint of Å and an equivalent width of Å. Also, the emission component may have a different profile than the other Balmer lines with a FWHM of km s-1. In Figure 3 we show the Balmer lines from the first three spectra to illustrate the tentative evidence for an H P Cygni profile.
As the predominant non-Balmer emission lines are those of iron, AT 2017fvz is consistent with the Fe ii class. The broad Balmer lines lie close to the border value of km s-1 which defines the broad-lined Fe ii novae class (Fe iib; Shafter et al., 2009).
The other prominent features of this first spectrum are the H, H, and H emission lines and the double-peaked O i (1) emission line at 7773 Å, all of which have FWHM velocities of km s-1. There is an Fe ii (42) triplet redward of H at 4924, 5018, and 5169 Å, as well as a fairly strong Na i D emission line at Å. There may be a weak Fe ii (74) multiplet blueward of H with 6148 Å and 6456 Å lines visible. However, with the 6248 Å and 6417 Å lines clearly absent, the feature at 6456 Å is more likely to be associated with nitrogen. Another explanation for this line at 6148 Å could be O i 6158. Between these lines, there is a feature at around 6300 Å, which is almost certainly [O i], that persists until the ‘plateau’ phase. We also see tentative evidence for Fe ii (37) lines at 4556 Å and 4629 Å.
The second AT 2017fvz spectrum, taken 14.040 d post-eruption, maintains all aforementioned emission lines including the H i lines, which show slightly lower FWHM velocities of km s-1, and many Fe ii lines. In addition, a prominent feature has developed at around 4640 Å which may be a blend of N iii and O ii emission lines at 4638 Å and 4676 Å, respectively (see Section 3.3.2). Other emission lines could be present at this location including C iv 4658, [Fe iii] 4658, or O i (18) at 4655 Å. The [O i] 5577 line can be seen alongside the N ii (3) line at 5679 Å, similar to V1494 Aquilæ (Nova Aql 1999) d post-maximum (Iijima & Esenoglu, 2003, see their Figure 6) and to SN 2010U777Not a supernova (Czekala et al., 2013)!, 15.3 d post-maximum (Czekala et al., 2013, see their Figure 11).
The third spectrum ( d) is similar to the previous two, with all lines except H (see Section 3.3.4), H, and the blend at Å having weakened. Unfortunately, the fourth spectrum ( d) has low signal-to-noise ratio owing to poor observing conditions, and only Balmer and [O i] 6300 lines are apparent.
3.3.2 ‘Plateau’ Phase
The fifth spectrum was taken 41.995 d post-eruption during the apparent plateau phase. The H i emission lines still dominate, but these are joined by nitrogen emission lines such as N ii (24) at 5001 Å, N ii (3) at 5679 Å, and [N ii] 5755. During this evolutionary phase, we might expect to see a considerable enhancement of nitrogen lines — the so-called ‘nitrogen flaring’ — caused by the Bowen fluorescence mechanism whereby N iii is ‘pumped’ by the UV resonance lines of O iii (Bowen, 1934, 1935). Harvey et al. (2018) suggested that this ‘Bowen Blend’ ( Å) may be more naturally explained by ‘oxygen flaring,’ whereby there is flaring of the O ii multiplet (V1) in the range 4638–4696 Å.
Such N- or O-flaring may manifest in the spectrum of AT 2017fvz through a broad amalgamation of lines at approximately 4640 Å, where it is difficult to distinguish the individual lines owing to the low spectral resolution. We assume that they are the N ii (5) multiplet at 4614 Å, 4621 Å, and 4630 Å, and the C iii (1) multiplet at 4647 Å, 4650 Å, and 4651 Å, as well as other nitrogen species.
3.3.3 Nebular Phase
The final spectrum was taken 69.964 d post-eruption. Here, there is evidence for the [O iii] nebular lines at 4959 and 5007 Å. Only a handful of novae beyond the Magellanic Clouds have been observed spectroscopically during this phase (Williams et al., 2017). The appearance of [O iii] often roughly coincides with the beginning of the SSS phase when the ejecta from the nova are becoming optically thin to UV radiation and collisions are still occurring owing to the sufficiently high density providing a cooling mechanism (Mason et al., 2018). Additionally, the ‘Bowen Blend’ is still visible but has broadened and taken on a ‘dome-like’ appearance.
At this time, the density of the ejecta must be less than the critical density ( cm-3) for the collisional de-excitation of [O iii]. One might also expect the [O iii] auroral line at 4363 Å; however, as this is a relatively weak line, it is most likely blended with H or hidden by the Hg i night-sky line at 4358 Å. Even so, we can use the ratio of these three emission lines to estimate an upper limit for the electron temperature within this part of the ejecta of 5000 K (see Figure 5.1 in Osterbrock & Ferland, 2006).
3.3.4 H evolution
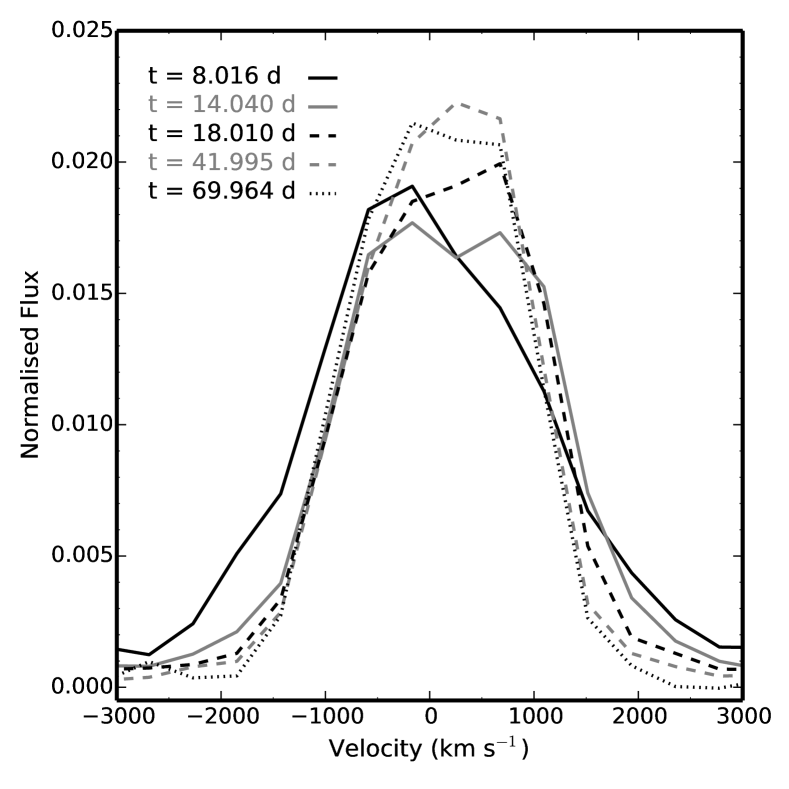
The evolution of the H emission-line profile is shown in Figure 4. After the first spectrum at d, when the line has a FWHM of km s-1, the line progressively narrows from km s-1 to km s-1 and then km s-1 at d, d, and d, respectively. The line width then remains constant between the fifth and sixth spectra with the FWHM being km s-1 at d and km s-1 at d. With no evidence for substantial circumbinary material, such line narrowing is probably due to decreasing emissivity as the ejecta expand, rather than a deceleration.
3.4 X-rays
Utilising the -band decline time ( d; see Table 3), we used the correlations presented by Henze et al. (2014) to predict the expected SSS properties of AT 2017fvz. These indicate that a SSS with blackbody temperature eV should have appeared at d and turned off at d.
A Galactic foreground column density of cm-2 toward AT 2017fvz was derived from the HEASARC tool based on the Galactic neutral hydrogen map by Kalberla et al. (2005). We used the PIMMS software (v4.8f) with this column and the estimated SSS temperature to convert from counts to unabsorbed flux. We then derived X-ray luminosities by assuming a distance of 476 kpc to NGC 6822; these are presented in Table 2.
We do not detect any X-ray emission from AT 2017fvz in any of the five visits between 38 d and 388 d post-eruption. The luminosity upper limits, calculated from the X-ray count limits (0.3–1 keV), assuming eV in Table 2, are all below erg s-1. The assumed temperature is low compared in particular to fast RNe such as M31N 2008-12a ( eV; Darnley et al., 2016) and RS Oph ( eV; Osborne et al., 2011); therefore, AT 2017fvz must not have had a bright SSS phase during our observational window.
3.5 The nova progenitor
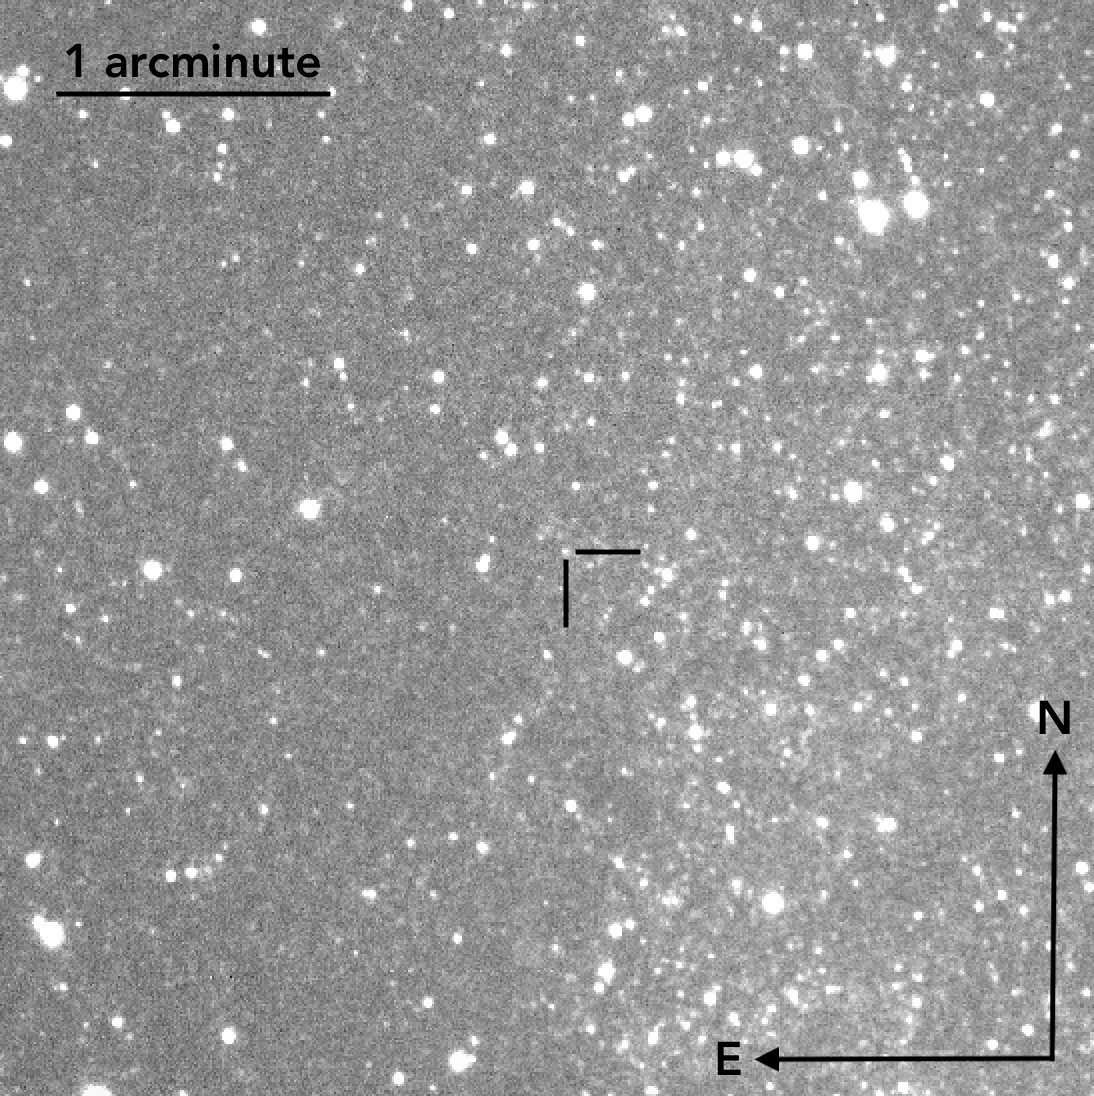
A nova system may harbour either a main sequence, subgiant, or red giant donor. If AT 2017fvz hosted a red giant or a luminous accretion disk then it could have been detectable with Hubble Space Telescope (HST) owing to the proximity of NGC 6822 (Williams et al., 2014). AT 2017fvz is located within archival HST Wide-Field Planetary Camera 2 (WFPC2) images (GO-11079) taken through the F170W, F255W, F336W, F439W, F555W, and F814W filters.
As described by Bode et al. (2009), Darnley et al. (2014), and in detail by Williams et al. (2014), we used reference stars in the LT images and an F814W HST image to compute a precise astrometric transformation between the datasets. We extended the technique by employing all 18 of the -band and -band LT images of AT 2017fvz to calculate the average nova position (and subsequent scatter) to more precisely and accurately constrain the nova position in the HST data, as shown in Figure 5.
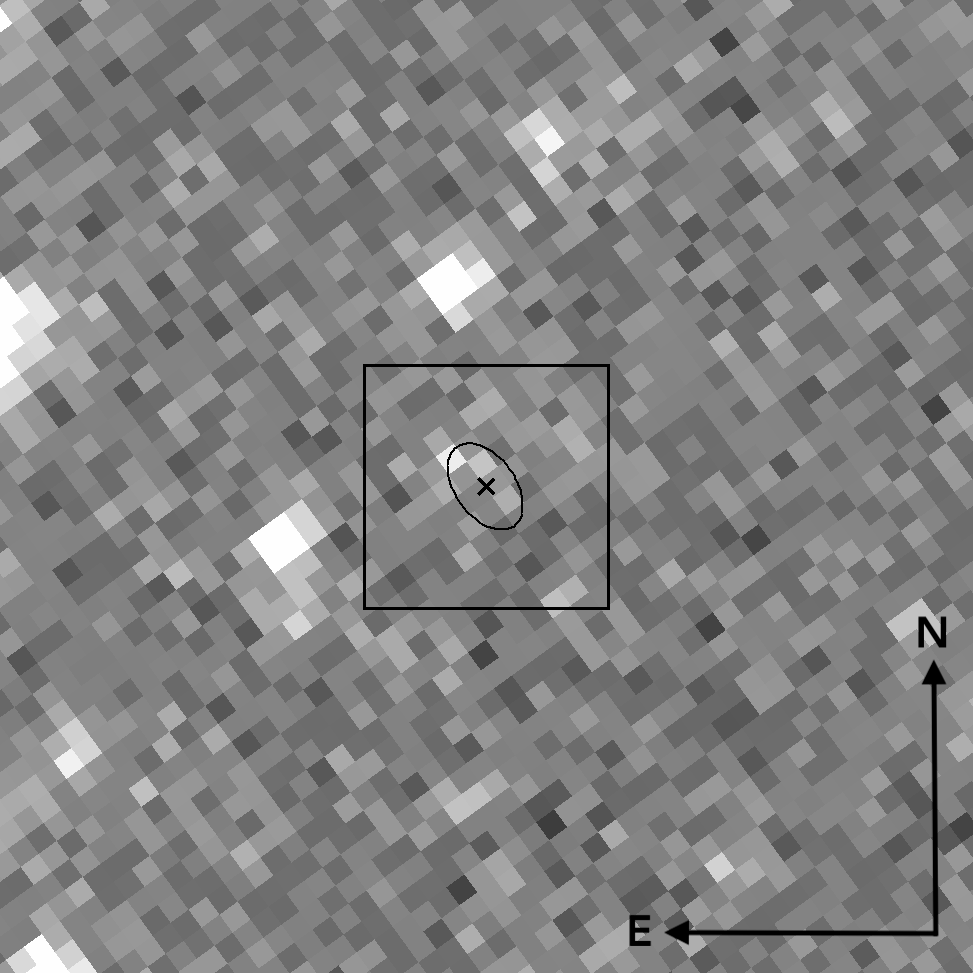
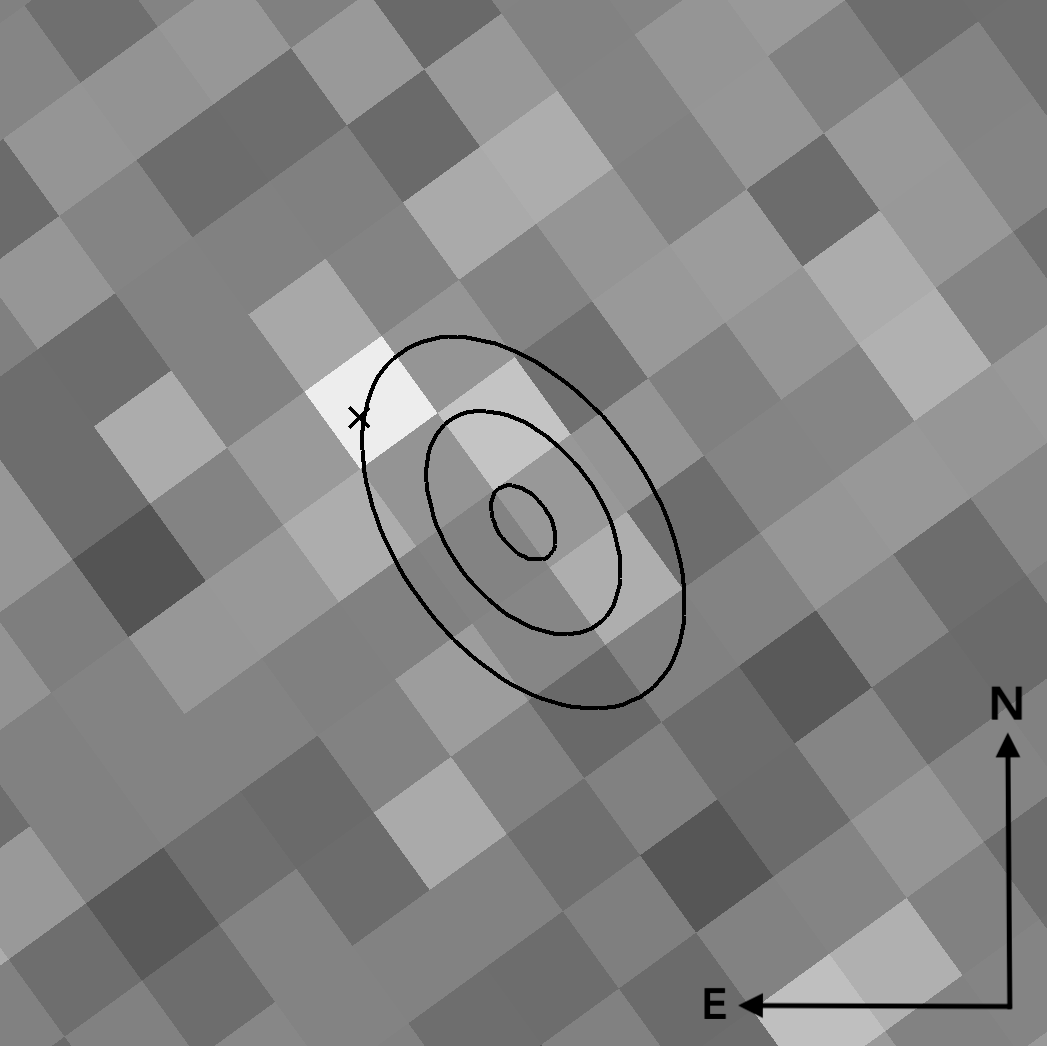
We performed crowded-field PSF fitting photometry with DOLPHOT (v2.0; Dolphin, 2000, using standard WFPC2 parameters) on all detected objects in the HST image, recovering a source that is within (2.05 WFPC2/PC pixels) of AT 2017fvz, an angular separation of , or a projected distance of 0.21 pc (see Figure 5 for the position and Table 6 for the photometry of the source). While seemingly close, we have no knowledge of the line-of-sight separation of the two objects. A colour-magnitude diagram based on these HST data was used to determine a limiting magnitude of . Using the method described by Williams et al. (2016), the probability of a coincidental alignment between AT 2017fvz and this source is 18%. This does not meet the criterion () employed by Williams et al. (2016) to confirm a likely nova candidate. The astrometric separation indicates with high confidence that this is indeed a chance alignment. The absence of a detected progenitor within the HST data indicates that the system is highly likely to harbour a main sequence or subgiant donor, and that the mass accretion rate is modest at best.
| Filter | Photometry (mag) |
|---|---|
| F170W | |
| F255W | – |
| F336W | |
| F439W | – |
| F555W | |
| F814W |
-
•
aNo source was detected in the F255W or F439W data.
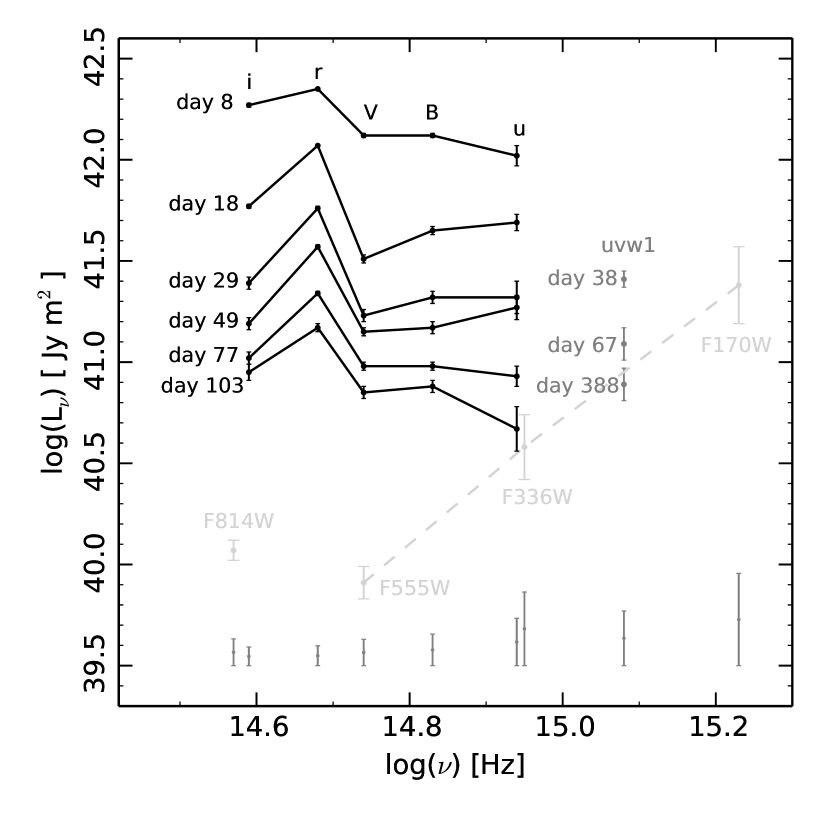
The proximity of this bright source to the nova () may have contaminated the ground-based and Swift photometry. Therefore, we determined this source’s luminosity in the F814W, F555W, F336W, and F170W filters. Its spectral energy distribution (SED) is shown in Figure 6 and compared to the SED evolution of AT 2017fvz. The source is extremely bright in the NUV, indicating that it is most likely to be an O or B star. The AT 2017fvz SEDs clearly illustrate the influence that the H emission of the nova has on the -band photometry. The final AT 2017fvz -band observation ( d post-eruption) is consistent with the HST F336W photometry (similar wavelengths), indicating that the late-time photometry is contaminated by this nearby source. The Swift photometry is similarly adversely affected.
A fit to the SED (HST plus Swift data) of the nearby source is consistent with the Rayleigh-Jeans tail of a blackbody with K and mag (), at the distance of NGC 6822 and assuming mag. Such a temperature and luminosity are consistent with an O-star. However, the F814W photometry is significantly brighter than would be expected for such a star.
4 Discussion
4.1 The previous nova in NGC 6822
There has only been one previous observed nova in NGC 6822, which was discovered independently by King & Li (1999) and Wei et al. (1999). That nova, located at , (J2000), was discovered by KAIT in unfiltered images taken on 1999 June 23.40 and 23.44 with mag, and by the Beijing Astronomical Observatory Supernova Survey on June 23.69 and 24.72 with an unfiltered magnitude of 18. The nova was then imaged on June 24.38 by LOSS with an unfiltered apparent magnitude of and by the 1 m telescope at Sutherland Observatory on June 26.08 and 28.07 with -band apparent magnitudes of and , respectively (Bakos & PLANET Collaboration, 1999).
This nova was spectroscopically confirmed on 1999 July 9 using the Kast spectrograph on the 3 m Shane telescope at Lick Observatory (Filippenko, 1999). If we assume that the optical peak occurred at discovery, then this spectrum was taken on d, roughly comparable to the d and d spectra of AT 2017fvz. This spectrum is published for the first time in Figure 7 alongside a stacked spectrum of AT 2017fvz from d, d, and d for comparative purposes.
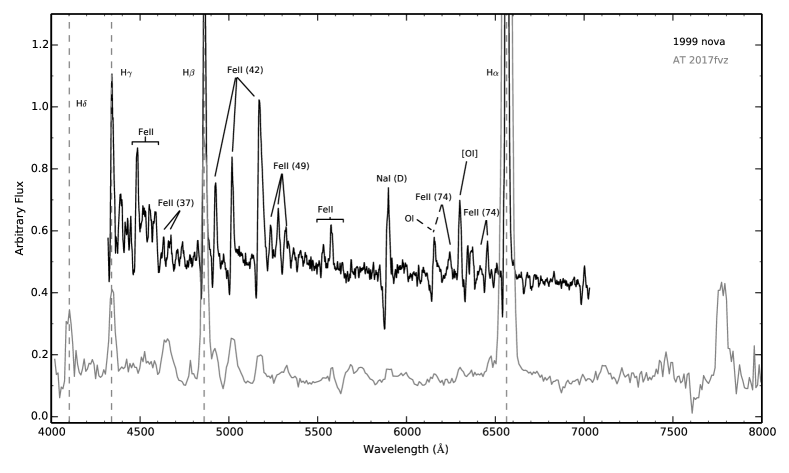
Just as we see in the spectra of AT 2017fvz, there are prominent Balmer lines and many of the same Fe ii lines. Blueward of H there is Fe ii (37) at 4629 Å and 4666 Å and redward there is Fe ii (42) at 4924 Å, 5018 Å, and 5169 Å. The Fe ii (74) multiplet is located to the blue of H at 6148 Å, 6248 Å, 6417 Å, and 6456 Å, and again O i 6158 may contribute to the emission line at 6156 Å. The Na i D and [O i] emission lines at 5892 Å and 6300 Å (respectively) are also present and much more apparent. As well as the large number of Fe ii lines between H and H that were not clearly visible in the AT 2017fvz spectrum, we see the Fe ii (49) multiplet at 5235 Å, 5276 Å, and 5326 Å to the red of the Fe ii (42) multiplet. There is a feature in the spectrum at approximately 5533 Å which may also be Fe ii and a feature at 5573 Å which is likely to be [O i] 5577 given the prominence of the [O i] 6300 emission line.
Many of the lines, such as Na i D, Fe ii (42), and the Balmer lines have P Cygni profiles indicating that this spectrum was taken as the nova transitioned from the fireball stage. Comparing directly to the evolution of AT 2017fvz implies that the 1999 nova evolved more slowly, which is consistent with the much narrower emission lines. See Table 7 for the emission-line velocities of many of the prominent emission lines with the corresponding velocities for AT 2017fvz.
| Line | Wavelength | 1999 nova | AT 2017fvz |
|---|---|---|---|
| identification | (Å) | (NGC 6822) | ( d) |
| H | 4341 | 900 120 | 2000 200 |
| Fe ii (37) | 4491 | 910 60 | – |
| H | 4861 | 970 50 | 2100 210 |
| Fe ii (42) | 4924 | 840 50 | – |
| Fe ii (42) | 5018 | 840 80 | 2200 230 |
| Fe ii (42) | 5169 | 1500 110 | – |
| Fe ii (49) | 5235 | 860 30 | – |
| Fe ii (49) | 5276 | 1120 50 | – |
| Fe ii (49) | 5326 | 1600 150 | – |
| Fe ii | 5533 | 840 90 | – |
| [O i] | 5577 | 850 60 | – |
| Na i D | 5892 | 800 130 | – |
| [O i] | 6300 | 650 40 | – |
| H | 6563 | 830 20 | 2300 100 |
4.2 The lack of X-rays
We do not detect X-ray emission from AT 2017fvz in any of the five Swift observations. This presents two scenarios: either the emission was not detectable, or it was detectable but we did not observe the system at the correct time.
There are two reasons why the X-rays emanating from the WD surface may not have been detectable. One option is that the X-ray emission may have ceased before the ejecta surrounding the nova were sufficiently diffuse to permit observation — that is, .
The alternative is that the SSS may have been too faint to be detected, below the X-ray luminosity upper limit of erg s-1. A number of SSSs in M 31 have been particularly faint, but these have been limited to (suspected) slow novae. M31N 2003-08c had a luminosity of erg s-1 when it was first detected d post-eruption and M31N 2006-09c had a luminosity erg s-1 d post-eruption (Henze et al., 2011). Both lacked photometric data to compute decline times, but we can reasonably assume that they are slow novae owing to their low ejecta velocities. The FWHM of the H emission line in M31N 2003-08c is 900 km s-1 (di Mille et al., 2003) and M31N 2006-09c has an expansion velocity of km s-1 (Henze et al., 2011). Given their low ejection velocities, the observed turn-on times for these novae are fairly consistent with estimates determined from Henze et al. (2014) for . As such, we would not expect such a late for AT 2017fvz. As AT 2017fvz does not belong to the slow speed class, a faint X-ray luminosity is potentially explained by the low-metallicity environment of NGC 6822. Depending upon the amount of mixing between the accreted envelope and the underlying WD, the metallicity of the accreted shell will either only weakly (strong mixing) or strongly (little mixing) depend upon the metallicity of the donor. As the TNR operates via the hot-CNO cycle, a lower metallicity shell might therefore be expected to produce a lower luminosity, but a longer lived SSS phase. In such a scenario, low metallicity alone might explain the lack of any X-ray detection. Orio (2013) provides further discussion about SSS populations within the SMC, a possibly similar environment to that of NGC 6822.
Alternatively, if the X-ray emission was in principle detectable, then the reasons for not observing this SSS phase revolve around the timing of the observations. It may also indicate that the Henze et al. (2014) correlations used to predict and (derived from CNe in M 31) are not valid in the lower metallicity environment of NGC 6822 (see, e.g., Williams et al., 2017). Firstly, the supersoft X-ray source may occur after 388 d (our last Swift observation), so we have simply observed too early, indicative of high-mass ejecta and also a low-mass WD. Secondly, the whole SSS phase may have taken place within one of the observing gaps, either between 38 d and 67 d, between 67 d and 97 d, between 97 d and 268 d, or between 243 d and 388 d. Though unlikely, there are examples of very short SSS phases in fast novae such as M31N 2007-12d, which had an extremely short SSS phase of d (Henze et al., 2011). Finally, the most tantalising option is that the entire SSS phase took place before our first Swift observation, 38 d post-eruption. This would imply low-mass ejecta and a high-mass WD, and potentially a recurrent nova.
4.3 A possibly ‘faint and fast’ or recurrent nova?
With d, AT 2017fvz is a ‘very-fast’ fading nova. We calculated from the MMRD relations of Downes & Duerbeck (2000) an expected peak -band absolute magnitude of , but with a peak absolute magnitude in the range mag AT 2017fvz may be substantially fainter than ‘expected.’ Given this range, and after accounting for expected differences between the -band and filters (see Shafter et al., 2009), AT 2017fvz would lie below the MMRD (broadly consistent with the position of M31N 2008-11a) as presented by Kasliwal et al. (2011, see their Figure 12), which plots six ‘faint and fast’ novae by their and their peak absolute -band magnitude. Here we suggest caution, as the upper end of this range (high internal extinction contribution and missed light-curve peak) is marginally consistent with the MMRD. We also note that Kasliwal et al. (2011) employed the Balmer decrement to correct for extinction toward many of their M 31 novae; however, Case B recombination is not valid in the early stages of nova evolution (see Williams et al., 2017, for a discussion).
The ‘faint and fast’ region of the MMRD phase space is populated by a number of Galactic (Kasliwal et al., 2011, see their Figure 13) and M 31 RNe. Pagnotta & Schaefer (2014) defined a number of key indicators for a RN masquerading as a CN (i.e., only one observed eruption). AT 2017fvz satisfies some of these; for example the short implies the presence of a high-mass WD. The high ejecta velocities (for an Fe ii nova) inferred from the H emission line ( km s-1) further reinforce this suggestion.
Additionally, there is a plateau in the optical light curve from around day 25 to day 45. It has been proposed that such plateaus are produced by the SSS irradiating a reformed, or surviving, accretion disk and the donor. The subsequent reprocessed optical light then dominates the light emitted by the nova ejecta, temporarily halting the decline of the light curve (Hachisu et al., 2000; Evans et al., 2008; Darnley et al., 2016). This could indicate that the accretion disk survived the eruption, pointing to a high accretion rate and/or low ejected mass — a reasonable indicator of a RN. However, it does not provide strong evidence in isolation. Additionally, the spectrum obtained during the plateau shows no evidence for narrow (or any) He ii lines, a key signature of a hot disk (as in seen during the plateau phase of known recurrent novae; e.g., Henze et al., 2018).
The other criteria suggested by Pagnotta & Schaefer (2014) require either far superior spectroscopy or identification of the quiescent system. AT 2017fvz matches all of their RN indicators that we can reasonably test. The lack of a detected progenitor also indicates the absence of a luminous accretion disk, therefore at most only a modest accretion rate. Even if this system were a RN, it certainly would not be a short-cycle recurrent system.
5 Summary and Conclusions
In this paper we present observations and analysis of AT 2017fvz, the second nova observed in the Local Group dwarf irregular galaxy NGC 6822. We carried out detailed photometric and spectroscopic observations of the nova from its initial rise through to the nebular phase. We summarise as follows.
-
(1)
AT 2017fvz was spectroscopically confirmed as an Fe ii nova, but exhibited broader than typical emission lines.
-
(2)
The light-curve evolution indicates that AT 2017fvz may belong to the P-class (plateau) novae, a proposed indication of a surviving or reformed accretion disk.
-
(3)
As a ‘very fast’ nova with a decline time d, the MMRD predicted peak magnitude is . Yet we estimate the observed peak is in the range .
-
(4)
The rapid decline and possible low luminosity suggest that AT 2017fvz may be a ‘faint and fast’ nova.
-
(5)
No X-rays were detected between 38 and 388 days post-eruption, therefore the SSS must have occurred within the first d, been fully obscured by the ejecta, or simply been too faint to be detectable — a possible metallicity effect.
-
(6)
The progenitor system was not recoverable from HST data, indicating a main sequence or subgiant donor.
We have also included, for the first time, the sparse available data for the other confirmed nova in NGC 6822. Although currently limited in number, the study of novae across a range of galaxy types will permit systematic studies of how environment — particularly metallicity — can affect the properties of novae.
Acknowledgements
The authors would like to thank Mike Shara for his role in refereeing the manuscript, and all those that have contributed to the discussion about this object. M.W.H. acknowledges a PhD studentship from the UK Science and Technology Facilities Council (STFC). M.J.D. received funding from STFC. K.L.P. received funding from the UK Space Agency. The work of A.V.F.’s group at UC Berkeley has been generously supported by the TABASGO Foundation, the Christopher R. Redlich Fund, and the Miller Institute for Basic Research in Science (UC Berkeley); additional funding was provided by NASA/HST grant AR-14295 from the Space Telescope Science Institute (STScI), which is operated by the Association of Universities for Research in Astronomy (AURA), Inc., under NASA contract NAS5-26555. We thank the staff of the various observatories at which data were obtained. This work made extensive use of the Liverpool Telescope, which is operated by LJMU on the island of La Palma in the Spanish Observatorio del Roque de los Muchachos of the Instituto de Astrofisica de Canarias with financial support from STFC. This work has made use of data from the Asteroid Terrestrial-impact Last Alert System (ATLAS) project. ATLAS is primarily funded to search for new near-Earth asteroids, through NASA grant NN12AR55G issued under the guidance of Lindley Johnson and Kelly Fast. A byproduct of this search is a collection of images and catalogs of the survey area. The ATLAS science products have been made possible through the contributions of the Institute for Astronomy, the University of Hawaii, the Queen’s University Belfast, STScI, and Harvard University. KAIT and its ongoing operation were made possible by donations from Sun Microsystems, Inc., the Hewlett-Packard Company, AutoScope Corporation, Lick Observatory, the NSF, the University of California, the Sylvia & Jim Katzman Foundation, and the TABASGO Foundation. Research at Lick Observatory is partially supported by a generous gift from Google. This research has made use of the APASS database, located at the AAVSO web site. Funding for APASS has been provided by the Robert Martin Ayers Sciences Fund. PyRAF is a product of STScI, which is operated by AURA for NASA.
References
- Arp (1956) Arp H. C., 1956, AJ, 61, 15
- Aydi et al. (2018) Aydi E., et al., 2018, MNRAS, 474, 2679
- Bakos & PLANET Collaboration (1999) Bakos G., PLANET Collaboration 1999, IAU Circ., 7211
- Blackburn (1995) Blackburn J. K., 1995, in Shaw R. A., Payne H. E., Hayes J. J. E., eds, Astronomical Society of the Pacific Conference Series Vol. 77, Astronomical Data Analysis Software and Systems IV. p. 367
- Bode (2010) Bode M. F., 2010, Astronomische Nachrichten, 331, 160
- Bode et al. (2009) Bode M. F., Darnley M. J., Shafter A. W., Page K. L., Smirnova O., Anupama G. C., Hilton T., 2009, ApJ, 705, 1056
- Bowen (1934) Bowen I. S., 1934, PASP, 46, 146
- Bowen (1935) Bowen I. S., 1935, ApJ, 81, 1
- Burrows et al. (2005) Burrows D. N., et al., 2005, Space Sci. Rev., 120, 165
- Czekala et al. (2013) Czekala I., et al., 2013, ApJ, 765, 57
- Darnley et al. (2012) Darnley M. J., Ribeiro V. A. R. M., Bode M. F., Hounsell R. A., Williams R. P., 2012, ApJ, 746, 61
- Darnley et al. (2014) Darnley M. J., Williams S. C., Bode M. F., Henze M., Ness J.-U., Shafter A. W., Hornoch K., Votruba V., 2014, A&A, 563, L9
- Darnley et al. (2016) Darnley M. J., et al., 2016, ApJ, 833, 149
- Dolphin (2000) Dolphin A. E., 2000, PASP, 112, 1383
- Downes & Duerbeck (2000) Downes R. A., Duerbeck H. W., 2000, AJ, 120, 2007
- Evans et al. (2008) Evans A., Bode M. F., O’Brien T. J., Darnley M. J., eds, 2008, RS Ophiuchi (2006) and the Recurrent Nova Phenomenon Astronomical Society of the Pacific Conference Series Vol. 401
- Evans et al. (2009) Evans P. A., et al., 2009, MNRAS, 397, 1177
- Filippenko (1999) Filippenko A. V., 1999, IAU Circ., 7220
- Filippenko et al. (2001) Filippenko A. V., Li W. D., Treffers R. R., Modjaz M., 2001, in Paczynski B., Chen W.-P., Lemme C., eds, Astronomical Society of the Pacific Conference Series Vol. 246, IAU Colloq. 183: Small Telescope Astronomy on Global Scales. p. 121
- Gaia Collaboration et al. (2018) Gaia Collaboration et al., 2018, A&A, 616, A1
- Gallart et al. (1996) Gallart C., Aparicio A., Vilchez J. M., 1996, AJ, 112, 1928
- Ganeshalingam et al. (2010) Ganeshalingam M., et al., 2010, ApJS, 190, 418
- Gehrels et al. (2004) Gehrels N., et al., 2004, ApJ, 611, 1005
- Gieren et al. (2006) Gieren W., Pietrzyński G., Nalewajko K., Soszyński I., Bresolin F., Kudritzki R.-P., Minniti D., Romanowsky A., 2006, ApJ, 647, 1056
- Green et al. (2018) Green G. M., et al., 2018, MNRAS, 478, 651
- Hachisu & Kato (2006) Hachisu I., Kato M., 2006, ApJS, 167, 59
- Hachisu et al. (2000) Hachisu I., Kato M., Kato T., Matsumoto K., 2000, ApJ, 528, L97
- Harvey et al. (2018) Harvey E. J., Redman M. P., Darnley M. J., Williams S. C., Berdyugin A., Piirola V. E., Fitzgerald K. P., O’Connor E. G. P., 2018, A&A, 611, A3
- Heinze et al. (2018) Heinze A. N., et al., 2018, AJ, 156, 241
- Henden et al. (2009) Henden A. A., Welch D. L., Terrell D., Levine S. E., 2009, in American Astronomical Society Meeting Abstracts #214. p. 669
- Henze et al. (2011) Henze M., et al., 2011, A&A, 533, A52
- Henze et al. (2014) Henze M., et al., 2014, A&A, 563, A2
- Henze et al. (2018) Henze M., et al., 2018, ApJ, 857, 68
- Hestenes et al. (2017) Hestenes J. C., Zheng W., Filippenko A. V., 2017, Transient Name Server Discovery Report, 831
- Iijima & Esenoglu (2003) Iijima T., Esenoglu H. H., 2003, A&A, 404, 997
- Jester et al. (2005) Jester S., et al., 2005, AJ, 130, 873
- Kalberla et al. (2005) Kalberla P. M. W., Burton W. B., Hartmann D., Arnal E. M., Bajaja E., Morras R., Pöppel W. G. L., 2005, A&A, 440, 775
- Kasliwal et al. (2011) Kasliwal M. M., Cenko S. B., Kulkarni S. R., Ofek E. O., Quimby R., Rau A., 2011, ApJ, 735, 94
- Kayser (1967) Kayser S. E., 1967, AJ, 72, 134
- King & Li (1999) King J. Y., Li W. D., 1999, IAU Circ., 7208
- Koribalski et al. (2004) Koribalski B. S., et al., 2004, AJ, 128, 16
- Landsman (1993) Landsman W. B., 1993, in Hanisch R. J., Brissenden R. J. V., Barnes J., eds, Astronomical Society of the Pacific Conference Series Vol. 52, Astronomical Data Analysis Software and Systems II. p. 246
- Larsen et al. (2018) Larsen S. S., Brodie J. P., Wasserman A., Strader J., 2018, A&A, 613, A56
- Mason et al. (2018) Mason E., Shore S. N., De Gennaro Aquino I., Izzo L., Page K., Schwarz G. J., 2018, ApJ, 853, 27
- Massey et al. (1995) Massey P., Armandroff T. E., Pyke R., Patel K., Wilson C. D., 1995, AJ, 110, 2715
- Massey et al. (2007) Massey P., Olsen K. A. G., Hodge P. W., Jacoby G. H., McNeill R. T., Smith R. C., Strong S. B., 2007, AJ, 133, 2393
- Mateo (1998) Mateo M. L., 1998, ARA&A, 36, 435
- McAlary et al. (1983) McAlary C. W., Madore B. F., McGonegal R., McLaren R. A., Welch D. L., 1983, ApJ, 273, 539
- Mclaughlin (1945) Mclaughlin D. B., 1945, PASP, 57, 69
- Moore (1945) Moore C. E., 1945, Contributions from the Princeton University Observatory, 21, 1
- Orio (2013) Orio M., 2013, The Astronomical Review, 8, 71
- Osborne et al. (2011) Osborne J. P., et al., 2011, ApJ, 727, 124
- Osterbrock & Ferland (2006) Osterbrock D. E., Ferland G. J., 2006, Astrophysics of gaseous nebulae and active galactic nuclei. CA: University Science Books
- Pagnotta & Schaefer (2014) Pagnotta A., Schaefer B. E., 2014, ApJ, 788, 164
- Payne-Gaposchkin (1957) Payne-Gaposchkin C., 1957, The Galactic Novae. Amsterdam, North-Holland Pub. Co.
- Piascik et al. (2014) Piascik A. S., Steele I. A., Bates S. D., Mottram C. J., Smith R. J., Barnsley R. M., Bolton B., 2014, in Ground-based and Airborne Instrumentation for Astronomy V. p. 91478H, doi:10.1117/12.2055117
- Rich et al. (2014) Rich J. A., Persson S. E., Freedman W. L., Madore B. F., Monson A. J., Scowcroft V., Seibert M., 2014, ApJ, 794, 107
- Roming et al. (2005) Roming P. W. A., et al., 2005, Space Sci. Rev., 120, 95
- Schaefer (2018) Schaefer B. E., 2018, MNRAS, 481, 3033
- Selvelli & Gilmozzi (2019) Selvelli P., Gilmozzi R., 2019, A&A, 622, A186
- Shafter (2013) Shafter A. W., 2013, AJ, 145, 117
- Shafter et al. (2009) Shafter A. W., Rau A., Quimby R. M., Kasliwal M. M., Bode M. F., Darnley M. J., Misselt K. A., 2009, ApJ, 690, 1148
- Shafter et al. (2011) Shafter A. W., et al., 2011, ApJ, 734, 12
- Shafter et al. (2012) Shafter A. W., Darnley M. J., Bode M. F., Ciardullo R., 2012, ApJ, 752, 156
- Shafter et al. (2014) Shafter A. W., Curtin C., Pritchet C. J., Bode M. F., Darnley M. J., 2014, in Woudt P. A., Ribeiro V. A. R. M., eds, Astronomical Society of the Pacific Conference Series Vol. 490, Stellar Novae: Past and Future Decades. p. 77 (arXiv:1307.2296)
- Shappee et al. (2014) Shappee B. J., et al., 2014, ApJ, 788, 48
- Shara et al. (2016) Shara M. M., et al., 2016, ApJS, 227, 1
- Shara et al. (2017) Shara M. M., et al., 2017, ApJ, 839, 109
- Stalder et al. (2017) Stalder B., et al., 2017, ApJ, 850, 149
- Starrfield et al. (1976) Starrfield S., Sparks W. M., Truran J. W., 1976, in Eggleton P., Mitton S., Whelan J., eds, IAU Symposium Vol. 73, Structure and Evolution of Close Binary Systems. pp 155–172
- Steele et al. (2004) Steele I. A., et al., 2004, in Oschmann Jr. J. M., ed., Proc. SPIEVol. 5489, Ground-based Telescopes. pp 679–692, doi:10.1117/12.551456
- Stetson (1987) Stetson P. B., 1987, PASP, 99, 191
- Strope et al. (2010) Strope R. J., Schaefer B. E., Henden A. A., 2010, AJ, 140, 34
- Tonry et al. (2018) Tonry J. L., et al., 2018, PASP, 130, 064505
- Walker (1954) Walker M. F., 1954, PASP, 66, 230
- Warner (1995) Warner B., 1995, Cambridge Astrophysics Series, 28
- Wei et al. (1999) Wei J. Y., Xu D. W., Qiao Q. Y., Qiu Y. L., Hu J. Y., 1999, IAU Circ., 7209
- Weldrake et al. (2003) Weldrake D. T. F., de Blok W. J. G., Walter F., 2003, MNRAS, 340, 12
- Williams (1992) Williams R. E., 1992, AJ, 104, 725
- Williams (1994) Williams R. E., 1994, ApJ, 426, 279
- Williams (2012) Williams R., 2012, AJ, 144, 98
- Williams & Darnley (2017) Williams S. C., Darnley M. J., 2017, The Astronomer’s Telegram, 10630
- Williams et al. (2014) Williams S. C., Darnley M. J., Bode M. F., Keen A., Shafter A. W., 2014, ApJS, 213, 10
- Williams et al. (2016) Williams S. C., Darnley M. J., Bode M. F., Shafter A. W., 2016, ApJ, 817, 143
- Williams et al. (2017) Williams S. C., Darnley M. J., Henze M., 2017, MNRAS, 472, 1300
- Yaron et al. (2005) Yaron O., Prialnik D., Shara M. M., Kovetz A., 2005, ApJ, 623, 398
- Zwicky (1936) Zwicky F., 1936, PASP, 48, 191
- di Mille et al. (2003) di Mille F., Ciroi S., Botte V., Boschetti C. S., 2003, IAU Circ., 8231
- van den Heuvel et al. (1992) van den Heuvel E. P. J., Bhattacharya D., Nomoto K., Rappaport S. A., 1992, A&A, 262, 97
Appendix A Photometry of AT 2017fvz
In Table 8 we provide the optical photometry of AT 2017fvz from the Liverpool Telescope and ASAS-SN. Table 9 lists the photometry of AT 2017fvz from KAIT. Table 10 presents the ATLAS photometry of AT 2017fvz.
| UT Date | MJD (d) | (d) | Telescope & instrument | Exposure time (s) | Filter | Photometry (mag) |
|---|---|---|---|---|---|---|
| 2017-08-09.916 | 57974.916 | 8.032 | LT IO:O | 60 | 18.522 0.118 | |
| 2017-08-15.908 | 57980.908 | 14.024 | LT IO:O | 60 | 18.737 0.063 | |
| 2017-08-17.894 | 57982.894 | 16.010 | LT IO:O | 60 | 19.248 0.131 | |
| 2017-08-19.910 | 57984.910 | 18.026 | LT IO:O | 60 | 19.337 0.111 | |
| 2017-08-23.889 | 57988.889 | 22.005 | LT IO:O | 60 | 19.633 0.127 | |
| 2017-08-30.883 | 57995.883 | 28.999 | LT IO:O | 120 | 20.265 0.191 | |
| 2017-09-04.939 | 58000.939 | 34.055 | LT IO:O | 120 | 20.722 0.335 | |
| 2017-09-19.936 | 58015.936 | 49.052 | LT IO:O | 120 | 20.378 0.158 | |
| 2017-09-24.896 | 58020.896 | 54.012 | LT IO:O | 120 | 20.571 0.274 | |
| 2017-10-17.842 | 58043.842 | 76.958 | LT IO:O | 120 | 21.228 0.131 | |
| 2017-11-12.822 | 58098.822 | 102.938 | LT IO:O | 120 | 21.895 0.270 | |
| 2017-08-09.917 | 57974.917 | 8.033 | LT IO:O | 60 | 18.224 0.019 | |
| 2017-08-15.910 | 57980.910 | 14.026 | LT IO:O | 60 | 19.003 0.025 | |
| 2017-08-17.895 | 57982.895 | 16.011 | LT IO:O | 60 | 19.198 0.032 | |
| 2017-08-19.911 | 57984.911 | 18.027 | LT IO:O | 60 | 19.380 0.038 | |
| 2017-08-23.890 | 57988.890 | 22.006 | LT IO:O | 60 | 19.903 0.049 | |
| 2017-08-30.885 | 57995.885 | 29.001 | LT IO:O | 120 | 20.204 0.086 | |
| 2017-09-04.941 | 58000.941 | 34.057 | LT IO:O | 120 | 19.987 0.081 | |
| 2017-09-19.941 | 58015.941 | 49.057 | LT IO:O | 120 | 20.591 0.072 | |
| 2017-09-24.901 | 58020.901 | 54.017 | LT IO:O | 120 | 20.875 0.106 | |
| 2017-10-17.847 | 58043.847 | 76.963 | LT IO:O | 120 | 21.066 0.059 | |
| 2017-11-12.827 | 58098.827 | 102.943 | LT IO:O | 120 | 21.321 0.071 | |
| 2017-08-03.190 | 57968.190 | 1.306 | ASAS-SN | 270 | 16.654 | |
| 2017-08-09.918 | 57974.918 | 8.034 | LT IO:O | 60 | 17.905 0.017 | |
| 2017-08-15.911 | 57980.911 | 14.027 | LT IO:O | 60 | 18.722 0.017 | |
| 2017-08-17.896 | 57982.896 | 16.012 | LT IO:O | 60 | 19.035 0.029 | |
| 2017-08-19.912 | 57984.912 | 18.028 | LT IO:O | 60 | 19.428 0.045 | |
| 2017-08-23.891 | 57988.891 | 22.007 | LT IO:O | 60 | 19.691 0.048 | |
| 2017-08-30.887 | 57995.887 | 29.003 | LT IO:O | 120 | 20.128 0.073 | |
| 2017-09-04.943 | 58000.943 | 34.059 | LT IO:O | 120 | 20.148 0.097 | |
| 2017-09-19.946 | 58015.946 | 49.062 | LT IO:O | 120 | 20.341 0.061 | |
| 2017-09-24.906 | 58020.906 | 54.022 | LT IO:O | 120 | 20.565 0.092 | |
| 2017-10-17.852 | 58043.852 | 76.968 | LT IO:O | 120 | 20.758 0.056 | |
| 2017-11-12.832 | 58098.832 | 102.948 | LT IO:O | 120 | 21.079 0.077 | |
| 2017-08-09.919 | 57974.919 | 8.035 | LT IO:O | 60 | 17.186 0.011 | |
| 2017-08-15.912 | 57980.912 | 14.028 | LT IO:O | 60 | 17.589 0.009 | |
| 2017-08-17.897 | 57982.897 | 16.013 | LT IO:O | 60 | 17.729 0.010 | |
| 2017-08-19.913 | 57984.913 | 18.029 | LT IO:O | 60 | 17.886 0.011 | |
| 2017-08-23.892 | 57988.892 | 22.008 | LT IO:O | 60 | 18.212 0.013 | |
| 2017-08-30.889 | 57995.889 | 29.005 | LT IO:O | 120 | 18.681 0.023 | |
| 2017-09-04.944 | 58000.944 | 34.060 | LT IO:O | 120 | 18.750 0.024 | |
| 2017-09-19.951 | 58015.951 | 49.067 | LT IO:O | 60 | 19.153 0.028 | |
| 2017-09-24.911 | 58020.911 | 54.027 | LT IO:O | 60 | 19.255 0.038 | |
| 2017-10-17.857 | 58043.857 | 76.973 | LT IO:O | 60 | 19.729 0.030 | |
| 2017-11-12.837 | 58098.837 | 102.953 | LT IO:O | 60 | 20.143 0.046 | |
| 2017-08-09.890 | 57974.890 | 8.006 | LT SPRAT | 10 | 17.391 0.027 | |
| 2017-08-15.915 | 57980.915 | 14.031 | LT SPRAT | 10 | 17.983 0.031 | |
| 2017-08-19.886 | 57984.886 | 18.002 | LT SPRAT | 10 | 18.268 0.035 | |
| 2017-08-25.874 | 57990.874 | 23.990 | LT SPRAT | 10 | 17.951 0.174 | |
| 2017-09-11.884 | 58007.884 | 41.000 | LT SPRAT | 10 | 19.286 0.043 | |
| 2017-09-12.865 | 58008.865 | 41.981 | LT SPRAT | 10 | 19.368 0.050 | |
| 2017-10-10.834 | 58036.834 | 69.950 | LT SPRAT | 10 | 20.040 0.067 | |
| 2017-08-09.920 | 57974.920 | 8.036 | LT IO:O | 60 | 17.246 0.021 | |
| 2017-08-15.913 | 57980.913 | 14.029 | LT IO:O | 60 | 18.044 0.017 | |
| 2017-08-17.898 | 57982.898 | 16.014 | LT IO:O | 60 | 18.230 0.023 | |
| 2017-08-19.914 | 57984.914 | 18.030 | LT IO:O | 60 | 18.496 0.026 | |
| 2017-08-23.893 | 57988.893 | 22.009 | LT IO:O | 60 | 18.913 0.030 | |
| 2017-08-30.890 | 57995.890 | 29.006 | LT IO:O | 120 | 19.449 0.068 | |
| 2017-09-04.946 | 58000.946 | 34.062 | LT IO:O | 120 | 19.569 0.050 | |
| 2017-09-19.954 | 58015.954 | 49.070 | LT IO:O | 60 | 19.957 0.065 | |
| 2017-09-24.914 | 58020.914 | 54.030 | LT IO:O | 60 | 19.649 0.082 | |
| 2017-10-17.860 | 58043.860 | 76.976 | LT IO:O | 60 | 20.378 0.076 | |
| 2017-11-12.840 | 58098.840 | 102.956 | LT IO:O | 60 | 20.547 0.095 |
| UT Date | MJD (d) | (d) | Telescope & instrument | Filter | Photometry (mag) |
|---|---|---|---|---|---|
| 2017-08-02.384 | 57967.384 | 0.500 | KAIT | Clear | 17.61 0.09 |
| 2017-08-03.289 | 57968.289 | 1.405 | KAIT | Clear | 16.44 0.11 |
| 2017-08-08.211 | 57973.211 | 6.327 | KAIT | Clear | 16.83 0.04 |
| 2017-08-09.293 | 57974.293 | 7.409 | KAIT | Clear | 16.87 0.06 |
| 2017-08-10.370 | 57975.370 | 8.486 | KAIT | Clear | 17.04 0.06 |
| 2017-08-11.366 | 57976.366 | 9.482 | KAIT | Clear | 17.22 0.05 |
| 2017-08-12.369 | 57977.369 | 10.485 | KAIT | Clear | 17.22 0.04 |
| 2017-08-13.362 | 57978.362 | 11.478 | KAIT | Clear | 17.41 0.05 |
| 2017-08-14.362 | 57979.362 | 12.478 | KAIT | Clear | 17.48 0.05 |
| 2017-08-15.360 | 57980.360 | 13.476 | KAIT | Clear | 17.57 0.04 |
| 2017-08-16.355 | 57981.355 | 14.471 | KAIT | Clear | 17.66 0.04 |
| 2017-08-17.337 | 57982.337 | 15.453 | KAIT | Clear | 17.68 0.09 |
| 2017-08-18.347 | 57983.347 | 16.463 | KAIT | Clear | 17.82 0.10 |
| 2017-08-19.339 | 57984.339 | 17.455 | KAIT | Clear | 17.88 0.05 |
| 2017-08-20.334 | 57985.334 | 18.450 | KAIT | Clear | 17.95 0.06 |
| 2017-08-22.333 | 57987.333 | 20.449 | KAIT | Clear | 18.13 0.07 |
| 2017-08-23.335 | 57988.335 | 21.451 | KAIT | Clear | 18.19 0.13 |
| 2017-08-24.316 | 57989.316 | 22.432 | KAIT | Clear | 18.31 0.07 |
| 2017-08-25.336 | 57990.336 | 23.452 | KAIT | Clear | 18.33 0.06 |
| 2017-08-26.339 | 57991.339 | 24.455 | KAIT | Clear | 18.41 0.09 |
| 2017-08-27.307 | 57992.307 | 25.423 | KAIT | Clear | 18.42 0.06 |
| 2017-08-28.320 | 57993.320 | 26.436 | KAIT | Clear | 18.61 0.06 |
| 2017-08-29.291 | 57994.291 | 27.407 | KAIT | Clear | 18.74 0.15 |
| 2017-08-30.278 | 57995.278 | 28.394 | KAIT | Clear | 18.47 0.22 |
| 2017-08-31.284 | 57996.284 | 29.400 | KAIT | Clear | 18.62 0.17 |
| UT Date | MJD (d) | (d) | Telescope & instrument | Filter | Photometry (mag) |
| 2017-08-03.389 | 57968.389 | 1.505 0.005 | ATLAS | Orange | 16.511 0.095 |
| 2017-08-04.440 | 57969.440 | 2.556 0.006 | ATLAS | Orange | 16.219 0.036 |
| 2017-08-09.455 | 57974.455 | 7.571 0.005 | ATLAS | Orange | 16.955 0.068 |
| 2017-08-11.436 | 57976.436 | 9.552 0.005 | ATLAS | Orange | 17.315 0.032 |
| 2017-08-12.412 | 57977.412 | 10.528 0.005 | ATLAS | Orange | 17.447 0.023 |
| 2017-08-13.446 | 57978.446 | 11.562 0.005 | ATLAS | Orange | 17.502 0.015 |
| 2017-08-15.424 | 57980.424 | 13.540 0.005 | ATLAS | Orange | 17.520 0.031 |
| 2017-08-18.399 | 57983.399 | 16.515 0.005 | ATLAS | Orange | 17.958 0.098 |
| 2017-08-22.384 | 57987.384 | 20.500 0.005 | ATLAS | Orange | 18.209 0.241 |
| 2017-08-23.405 | 57988.405 | 21.521 0.005 | ATLAS | Orange | 18.544 0.319 |
| 2017-08-26.394 | 57991.394 | 24.510 0.004 | ATLAS | Orange | 20.143 0.239 |
| 2017-08-28.370 | 57993.370 | 26.486 0.004 | ATLAS | Orange | 19.877 0.118 |
| 2017-08-16.394 | 57981.394 | 14.510 0.005 | ATLAS | Cyan | 18.750 0.169 |
| 2017-08-17.417 | 57982.417 | 15.533 0.005 | ATLAS | Cyan | 18.519 0.442 |
| 2017-08-21.411 | 57986.411 | 19.527 0.010 | ATLAS | Cyan | 18.134 0.410 |
| 2017-09-17.329 | 58013.329 | 46.445 0.004 | ATLAS | Cyan | 20.376 0.403 |
-
•
aThe ‘orange’ filter covers the and bands. The ‘cyan’ filter covers the and bands.
-
•
bThe date listed here is the mean time of multiple observations taken on this date.
-
•
cThe magnitude listed here is the mean magnitude calculated from multiple observations taken on this date with the associated standard uncertainty.