Controlling group and phase velocities in bidirectional mode-locked fiber lasers
Abstract
A bidirectional mode-locked fiber laser producing two correlated frequency combs of the same repetition rate is demonstrated. The intensity dependence of pulse and phase velocities are measured simultaneously. As expected, the phase delay is determined by the linear and nonlinear indices of refraction. The nonlinear Kerr effect contribution to the pulse velocity is dwarfed by a contribution from saturable gain dynamics.
1 Introduction
Fiber technology is traditionally used for sensing applications, where a phase shift is measured either in a resonator or through evanescent wave coupling in a tapered fiber. For instance, Sagnac interference in an optical system consisting of a fiber loop with counter-propagating light beams can be used for rotation, temperature, tension, magnetic field sensing [1, 2, 3] and medical applications [4]. Michelson and Fabry-Perot interferometers are also used for temperature sensing [5, 6]. A simple structure based on non-adiabatic tapered optical fiber utilizes the evanescent field of an optical microfiber to enhance the light-biomaterial interaction for biosensing applications [7, 8].
A considerable increase in sensitivity can be achieved in all phase sensing applications by inserting the element to be measured inside an active laser cavity. In the technique of Intracavity Phase Interferometry (IPI), a mode-locked laser with two intracavity counter-propagating pulses produces two correlated frequency combs without need of stabilization. Interfering these two combs produces a beat note frequency proportional to the phase shift per cavity round-trip [9]. The bandwidth of the beat note can be as small as 0.2 Hz [10], even though each comb has a bandwidth larger than 1 MHz, again indicating the correlation between combs. The beat note produced by the interference of the two combs can be expressed as [9]:
| (1) |
where is the optical frequency, is the induced phase shift (to be measured) per cavity round-trip, is the averaged vector over the cavity, is the difference in optical path length that would correspond to the phase shift, and is the optical perimeter of the laser.
The IPI technique has successfully made measurements of nonlinear index, gas flow, electro-optic coefficients, and rotation [10, 11, 12, 13]. These demonstrations used free-space component lasers which do not lend themselves to field applications. Mode-locked fiber lasers are the most promising media to implement IPI due to their ability to produce ultrashort pulses in a compact design.
There is abundant literature on unidirectional mode-locked ring fiber lasers [14, 15, 16, 17, 18, 19]. Stable frequency combs have also been realized with linear lasers [20, 21]. However, achieving colliding pulse mode-locking [22, 23] in bidirectional fiber lasers to realize correlated frequency combs is surprisingly challenging. The difficulties stem from the high gain and loss and large nonlinearities of fiber optics. Pulses circulating in opposite directions in a bidirectional laser traverse the optical components in a different order creating an asymmetry in the cavity. This asymmetry, at the worst, leads to the tendency of the two circulating pulses to unlock from crossing in the saturable absorber. This results in having different repetition rates (pulse velocities) and wavelengths (frequencies); a mode of operation totally inadequate for IPI [24, 25, 26]. Remarkably successful implementations of IPI in passively mode-locked bidirectional fiber lasers, as laser gyros, have been demonstrated by Kieu et al [27], and more recently by Krylov et al [28]. However, a large bias beat note is measured in fiber laser gyros as a result of the asymmetry in phase velocities.
A nearly symmetric design of bidirectional mode-locked fiber laser is presented that has the ability to control the amount of bias beat note (phase velocity) by tuning the pump powers. The phase velocity is determined by the linear and nonlinear refractive indices of the fiber. The measurements confirm the conclusion of prior results obtained with free-space component lasers [29], that the pulse velocity in the cavity is dominated by gain dynamics and it is not simply equal to , generally referred to as group velocity, where is the wave vector and is the optical frequency.
2 Experimental setup
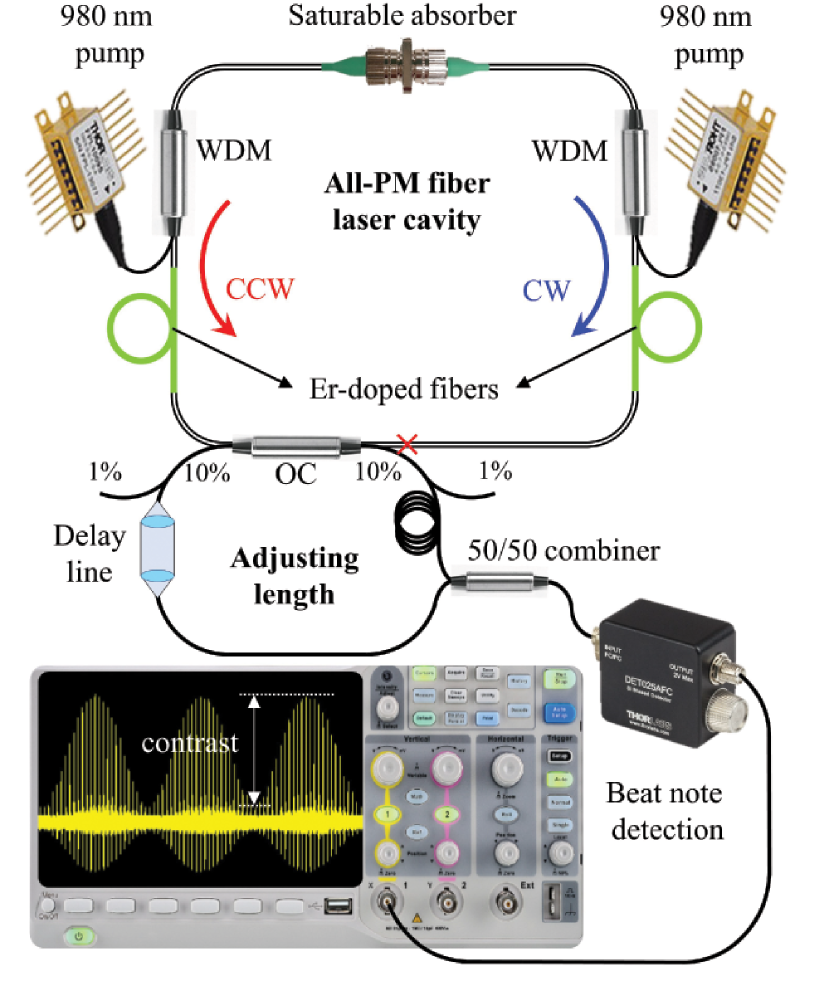
An all-polarization maintaining bidirectional fiber laser is constructed and shown in Fig. 1. Passive Mode-locking is achieved by sandwiching carbon nanotubes (CNTs) between two FC/APC fiber connectors [30] creating two correlated counter-propagating frequency combs. The laser cavity elements are arranged as symmetrically as possible with respect to the saturable absorber (SA), to ensure that counter-circulating pulses of near equal intensities are generated. The SA establishes the crossing point of the counter-circulating pulses. A tapered fiber covered with CNTs [31] fails to stabilize the crossing point possibly because the taper is longer than the pulse length, resulting in the mutual saturation being applied to only a small fraction of the total absorption. An important contribution to minimize the asymmetries in the cavity is to use two portions of Er-doped fibers pumped through two wavelength division multiplexers (WDM) [Fig. 1]. Using WDMs in reflection helps to protect the saturable absorber from overheating by filtering out the extra power from the pump lasers, which also makes the mode-locking more stable [32]. A 2 by 2 output coupler extracts 10% of the light from either direction. The output pulse trains from clockwise (CW) and counter-clockwise (CCW) directions combine through a 50/50 combiner to measure the beat note. As can be seen in the setup, the output coupler is not placed in exactly equal distances from SA, creating some asymmetries which can be compensated by tuning the pump powers of the two gain sections. The near symmetric operation reduces the bias beat note due to creating less differences between phase velocities of the circulating pulses. A minimum bias frequency of 164 kHz could be achieved.
An adjustable delay line ensures temporal overlap of the counter-propagating pulses on the detector. The delay line is made of two collimating lenses with adjustable collimated optical length. 1% of the the output coupler (OC) in either direction is splitted out and monitored for extra measurements such as output power, optical spectrum and pulse train.
3 Experimental and theoretical results
3.1 Bias beat note
Colliding pulse mode-locking in a bidirectional ring fiber laser creates two counter-propagating pulses which meet at the same locations established by the saturable absorber at each round trip. The soliton spectra in CW and CCW directions are shown in Fig. 2 (a) with the same central wavelength of 1565 nm for both directions. Each pulse of intensity circulating in the cavity of perimeter accumulates a large amount of nonlinear phase along the core of the fiber given by:
| (2) |
where is the nonlinear refractive index of the fiber core, and is the operating wavelength. The difference between the accumulated phase in either direction () per cavity round-trip results in a beat note measured by interfering the frequency combs. The frequency of that beat note is found by combining Eqs. (1) and (2):
| (3) |
where is the average linear phase index. As can be seen, the beat note frequency is directly proportional to the difference of pulse intensities of . Thanks to the symmetric design of the laser cavity (Fig. 1), each pulse sees the components in the same order starting from the crossing point in the CNT saturable absorber, resulting in a very small difference in accumulated nonlinear phase. One expects to measure a very small bias beat note for a perfectly symmetric cavity. Unfortunately, making a perfect symmetric cavity is not practical as it needs the 2 2 output coupler (OC) placed at the crossing point (red in Fig. 1) opposite to the saturable absorber. This introduces a large coupling between the counter-circulating pulses, resulting in a large dead band (mutual injection locking). Therefore, the symmetry had to be broken by locating the 2 2 output coupler away from the pulse crossing point (), as shown in Fig. 1.
The difference in intensity between counter-circulating pulses can be modified by tuning the power of the two pump lasers in Fig. 1, resulting in a change of beat note indicated by Eq. (3). Figure 2(b) shows the position of the beat note spectrum on the a radio frequency (RF) spectrum analyzer, as the difference between the pump powers is increased. In this figure, the beat note frequency taken from RF spectrum analyzer shows an increase from 1.1 MHz to 3.9 MHz by increasing the asymmetry in the cavity through changes in pump powers.
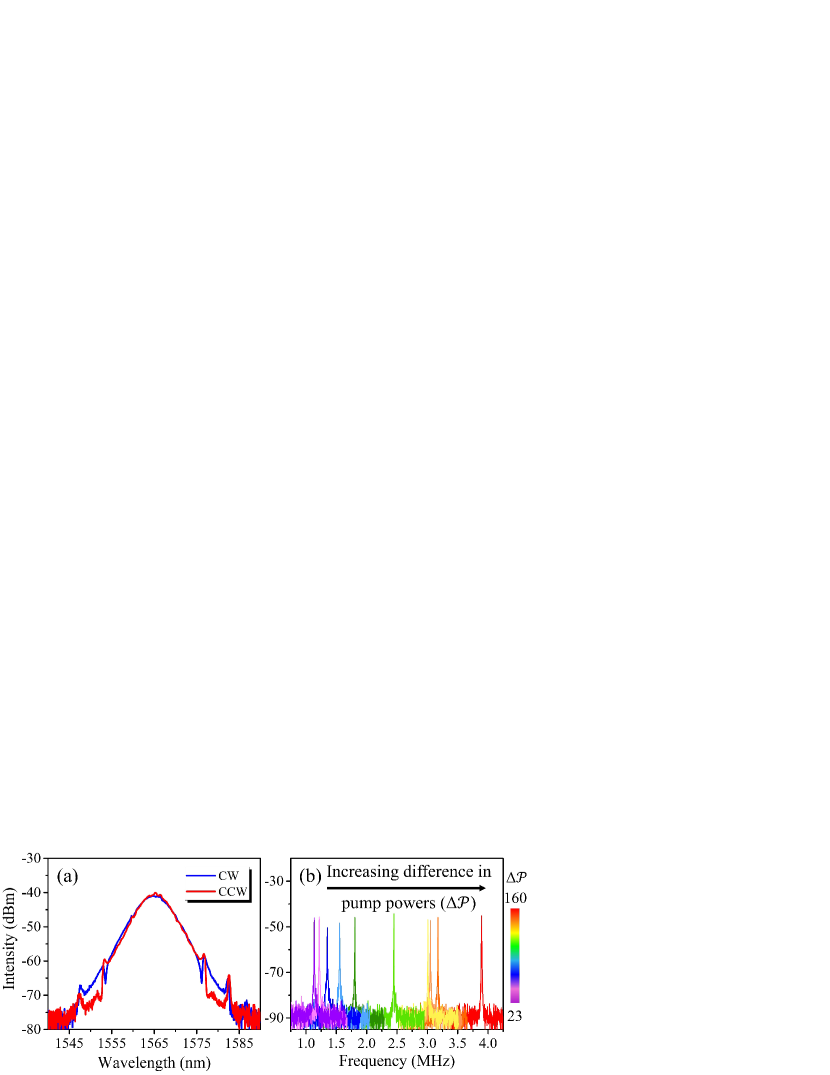
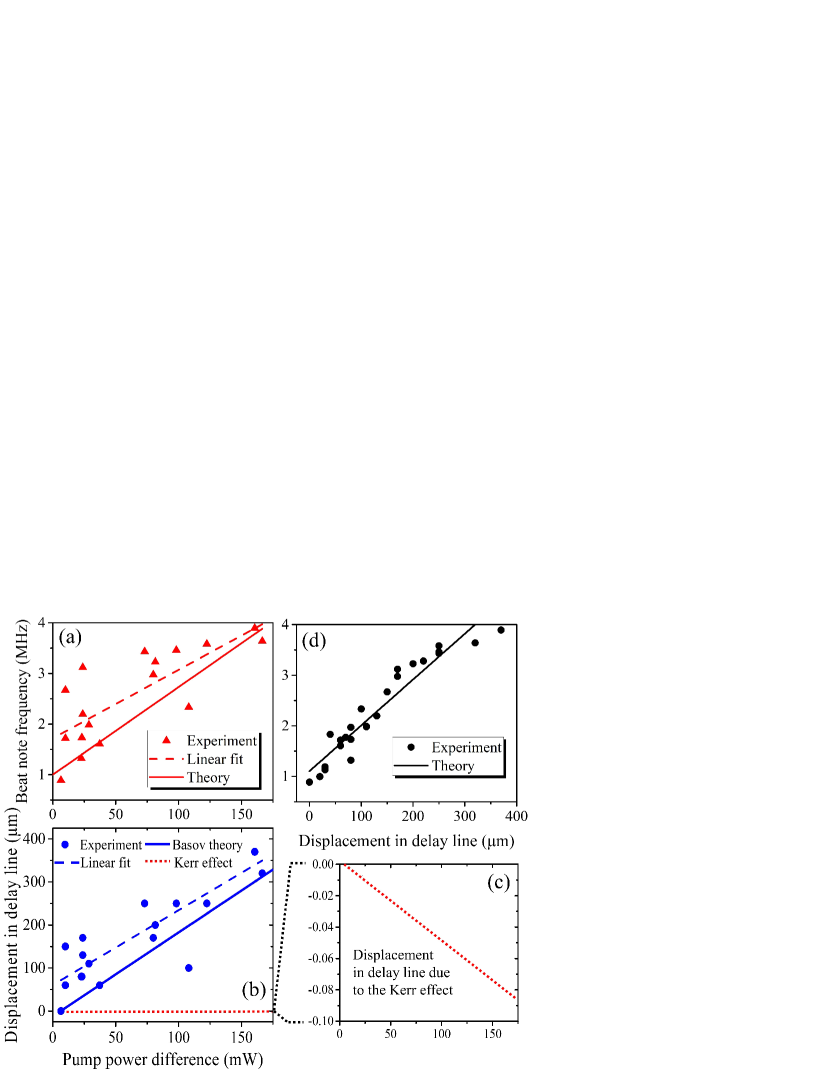
Figure 3 illustrates the power dependence of the beat note (representative of the phase velocity) and the delay adjustment (representative of the pulse velocity) to achieve optimum beat note visibility. The RF bias beat note is plotted in Fig. 3(a) as a function of the difference in pump powers () applied to the two erbium doped fibers. The difference in pump powers is calculated as where and are the pump powers in CW and CCW directions, respectively and .
The change of the bias beat note as a function of intensity can be easily calculated from Eq. (3). A simple one to one correspondence between pump power and peak intensity can be established, under the assumption that the laser generates only a single pulse/cavity round-trip, and that the pump power dependence of the pulse duration can be neglected. The measured pulse width of 0.7 ps, repetition rate of 37.255 MHz, and fiber core area of cm2 (corresponding to mode field diameter of ) have been used for both pulses, as well as a linear dependence of the intracavity power on the pump power to calculate the intensities in either direction. The nonlinear refractive index of cm2/W at a wavelength of = 1565 nm is used to calculate the beat note frequency. The calculated power dependence of the bias beat note under these assumptions is plotted as a red line in Fig. 3(a). A linear fit of the experimental data is shown as dashed line in this figure. The large scatter of the experimental data is a clear indication that the assumptions are not accurate. Indeed, satellite pulses are observed for some values of pump powers proving that the energy of the most intense pulse is less than the ratio of the average power to the repetition rate.
3.2 Delay line adjustment
If the pulses circulating in opposite direction experience a different index of refraction, one would also expect a change in position of the second crossing point (red in Fig. 1), requiring an adjustment of the detection delay line for maximum beat note visibility. Blue circles in Fig. 3(b) show that indeed, the change in delay depends on the power difference applied to the gain fibers. These data were obtained by adjusting the delay line for maximum contrast in the beat note pattern shown in Fig. 1 at each pump powers setting. It should be noted that the plot refers to changes in the delay line which is placed in the CW direction. Here again, we attribute the apparently scattered pattern of the pump power dependence to the fact that an increase in pump power does not imply a proportional pulse intensity increase. The presence of satellite pulses results in an erroneous estimate of the main pulse intensity.
If the observed changes were solely due to the Kerr effect, the more intense pulse would be delayed by:
| (4) |
where and are the pulse intensities, each going through the length of fiber from the saturable absorber (crossing point) to the 10% output coupler in clockwise ( = 2.856 m) and counter-clockwise ( = 2.566 m) directions, respectively. The dotted red line in Fig. 3(b) and its magnified version in Fig. 3(c) shows the amount of delay between counter-circulating pulses due to the Kerr effect. This delay is considerably smaller than the experimental observation, and of opposite sign. Therefore, it can be concluded that the changes in index do not explain the intensity dependence of the pulse velocity. Instead, the much larger delay observed between two pulses can be explained by the fact that the power dependence of the group velocity in an active laser is dominated by gain dynamics [29, 34].
3.2.1 Ratio of beat note to displacement
The surprising observation is that the ratio of the beat note to the change in delay follows a linear dependence depicted as black circles in Fig. 3(d), even though the dependency of the beat note frequency and delay to pump powers are rather scattered. The fact that the bias beat note and the change in delay are so correlated is an indication that both are proportional to the intensity of the two pulses interfering on the detector. The change in delay line is about 370 m for a 3.1 MHz change in beat note. It should be noted that the theory [black line in Fig. 3(d), which is the ratio of the theory lines in Fig. 3(a) and Fig. 3(d)] perfectly fits the experiment.
The phase velocity intensity dependence is well explained by the Kerr effect [Eq. (4)]. It is shown below that propagation in a saturated gain medium explains the sign and magnitude of the intensity dependence of the pulse velocity.
3.2.2 Group velocity modification through gain dynamics
Basov et al [33] showed that the velocity of a pulse in a saturable gain medium fits the expression:
| (5) |
where is the velocity of light in the medium, is the pulse duration, is the small signal gain coefficient, and the loss coefficient (per unit length). We adapt the very simple model of Basov to calculate the asymptotic pulse velocity in our fiber laser. To this effect, circulation of a pulse in a ring fiber laser of perimeter is replaced by pulse propagation through a distributed amplifier of gain and distributed loss of . is the pump power, equal to at threshold, where the gain is calculated from the threshold condition of ; being the total survival factor per round-trip, and the length of the erbium doped fiber. The distributed loss per unit length is calculated from . For our fiber laser, we have m-1 and m-1. Modifying the expression from Basov [Eq. (5)], the superluminal pulse velocity in the fiber is given by:
| (6) |
The calculated delay versus pump power difference based on the theory of Basov is plotted as a solid blue line in Fig. 3(b) which is consistent with the experiment. It should also be mentioned that the zero displacement in the delay line is defined as the position for which the beat note is measured for the minimum difference in pump powers.
3.3 Comparison of theory and experiment
The theoretical curves of Figs. 3(a) and (b) are assuming an ideal world where the pulse intensity varies monotonically and proportionally to the pump power. The experimental beat note plotted as a function of the displacement (black dots) is compared to the theory (black line) in Fig. 3(d). The beat note is proportional to the variation of phase delay in the fiber laser, while the displacement is proportional to the variation of pulse delay. The agreement between theory and experiment in Fig. 3(d) is quite remarkable, considering that there are no adjustable parameters, and given the coarse assumptions (uniform intensity through the fiber and modeling of the ring laser as a uniform amplifier medium). The calculated plot of beat note versus delay adjustment [solid line in Fig. 3(d)] match exactly the best fit line of the experimental data [dashed black line in Fig. 3(d)]. It is often claimed that the pulse velocity is given simply by where is the wave vector and the optical frequency. The measurements presented here clearly demonstrate that this definition applies only to transparent dielectrics. Inside a laser cavity, the pulse velocity differs from this definition by orders of magnitude, as has been shown for free-space component lasers [34].
References
- [1] L.-Y. Shao, X. Zhang, H. He, Z. Zhang, X. Zou, B. Luo, W. Pan, and L. Yan, “Optical fiber temperature and torsion sensor based on lyot-sagnac interferometer,” Sensors 16 (2016).
- [2] K. Naeem, B. H. Kim, B. Kim, and Y. Chung, “Simultaneous multi-parameter measurement using sagnac loop hybrid interferometer based on a highly birefringent photonic crystal fiber with two asymmetric cores,” Opt. Express 23, 3589–3601 (2015).
- [3] F. Lv, C. Han, H. Ding, Z. Wu, and X. Li, “Magnetic field sensor based on microfiber sagnac loop interferometer and ferrofluid,” IEEE Photonics Technology Letters 27, 2327–2330 (2015).
- [4] T. Kumagai, Y. Tottori, R. Miyata, and H. Kajioka, “Glucose sensor with a sagnac interference optical system,” Appl. Opt. 53, 720–726 (2014).
- [5] Z. Li, Y. Wang, C. Liao, S. Liu, J. Zhou, X. Zhong, Y. Liu, K. Yang, Q. Wang, and G. Yin, “Temperature-insensitive refractive index sensor based on in-fiber michelson interferometer,” Sensors and Actuators B: Chemical 199, 31–35 (2014).
- [6] H. Yu, Y. Wang, J. Ma, Z. Zheng, Z. Luo, and Y. Zheng, “Fabry-perot interferometric high-temperature sensing up to 1200 °c based on a silica glass photonic crystal fiber,” Sensors 18 (2018).
- [7] P. Wang, L. Bo, Y. Semenova, G. Farrell, and G. Brambilla, “Optical microfibre based photonic components and their applications in label-free biosensing,” Biosensors 5, 471–499 (2015).
- [8] H.-Y. Lin, C.-H. Huang, G.-L. Cheng, N.-K. Chen, and H.-C. Chui, “Tapered optical fiber sensor based on localized surface plasmon resonance,” Opt. Express 20, 21693–21701 (2012).
- [9] L. Arissian and J.-C. Diels, “Intracavity phase interferometry: frequency comb sensors inside a laser cavity,” Laser Photonics Rev 8, 799–826 (2014).
- [10] A. Velten, A. Schmitt-Sody, and J.-C. Diels, “Precise intracavity phase measurement in an optical parametric oscillator with two pulses per cavity round-trip,” Optics Letters 35, 1181–1183 (2010).
- [11] M. L. Dennis, J.-C. Diels, and M. Lai, “The femtosecond ring dye laser: a potential new laser gyro,” Optics Letters 16, 529–531 (1991).
- [12] M. J. Bohn, J.-C. Diels, and R. K. Jain, “Measuring intracavity phase changes using double pulses in a linear cavity,” Optics Lett. 22, 642–644 (1997).
- [13] M. Lai, J.-C. Diels, and M. Dennis, “Nonreciprocal measurements in fs ring lasers,” Optics Letters 17, 1535–1537 (1992).
- [14] I. N. Duling, “All-fiber ring soliton laser mode locked with a nonlinear mirror,” Opt. Lett. 16, 539–541 (1991).
- [15] N. Nishizawa, Y. Seno, K. Sumimura, Y. Sakakibara, E. Itoga, H. Kataura, and K. Itoh, “All-polarization-maintaining Er-doped ultrashort-pulse fiber laser using carbon nanotube saturable absorber,” Optics Express 16, 9429 (2008).
- [16] S. Y. Set, H. Yaguchi, Y. Tanaka, and M. Jablonski, “Laser mode locking using a saturable absorber incorporating carbon nanotubes,” J. Lightwave Technol. 22, 51 (2004).
- [17] Y.-W. Song, S. Yamashita, C. S. Goh, and S. Y. Set, “Carbon nanotube mode lockers with enhanced nonlinearity via evanescent field interaction in d-shaped fibers,” Opt. Lett. 32, 148–150 (2007).
- [18] Q. Bao, H. Zhang, Y. Wang, Z. Ni, Y. Yan, Z. X. Shen, K. P. Loh, and D. Y. Tang, “Atomic-layer graphene as a saturable absorber for ultrafast pulsed lasers,” Advanced Functional Materials 19, 3077–3083 (2009).
- [19] J. Sotor, G. Sobon, M. Kowalczyk, W. Macherzynski, P. Paletko, and K. M. Abramski, “Ultrafast thulium-doped fiber laser mode locked with black phosphorus,” Opt. Lett. 40, 3885–3888 (2015).
- [20] M. Zhang, L. Chen, C. Zhou, Y. Cai, L. Ren, and Z. Zhang, “Mode-locked ytterbium-doped linear-cavity fiber laser operated at low repetition rate,” Laser Physics Letters 6, 657–660 (2009).
- [21] J. Guo, “Bound-state solitons in a linear-cavity fiber laser mode-locked by single-walled carbon nanotubes,” Journal of Modern Optics 61, 980–985 (2014).
- [22] I. S. Ruddock and D. J. Bradley, “Bandwidth-limited subpicosecond pulse generation in mode-locked cw dye lasers,” Appl. Phys. Lett. 29, 296 (1976).
- [23] R. L. Fork and C. V. Shank, “Generation of optical pulses shorter than 0.1 ps by colliding pulse mode-locking,” Appl. Phys. Lett. 38, 671 (1981).
- [24] C. Zeng, X. Liu, and L. Yun, “Bidirectional fiber soliton laser mode-locked by single-wall carbon nanotubes,” Optics Express 21, 18937–18942 (2013).
- [25] X. Yao, “Generation of bidirectional stretched pulses in a nanotube-mode-locked fiber laser,” Appl. Opt. 53, 27–31 (2014).
- [26] R. Li, H. Shi, H. Tian, Y. Li, B. Liu, Y. Song, and M. Hu, “All-polarization-maintaining dual-wavelength mode-locked fiber laser based on sagnac loop filter,” Opt. Express 26, 28302–28311 (2018).
- [27] K. Kieu and M. Mansuripur, “All-fiber bidirectional passively mode-locked ring laser,” Opt. Lett. 33, 64–66 (2008).
- [28] A. A. Krylov, D. S. Chernykh, and E. D. Obraztsova, “Colliding-pulse hybridly mode-locked erbium-doped all-fiber soliton gyrolaser,” Laser Physics 28, 015103 (2017).
- [29] K. Masuda, J. Hendrie, J.-C. Diels, and L. Arissian, “Envelope, group and phase velocities in a nested frequency comb,” Journal of Physics B 49, 085402 (2016).
- [30] J. W. Nicholson, R. S. Windeler, and D. J. DiGiovanni, “Optically driven deposition of single-walled carbon-nanotube saturable absorbers on optical fiber end-faces,” Opt. Express 15, 9176–9183 (2007).
- [31] H. Afkhamiardakani, B. Kamer, J. C. Diels, and L. Arissian, “Carbon nanotubes for mode-locking: polarization study,” in Proceedings of Photonics West, Conference 9746-19,, , vol. 9746 (SPIE, San Francisco, 2016).
- [32] H. Afkhamiardakani, M. Tehrani, and J.-C. Diels, “Extension of the stable operation of an all polarization maintaining mode-locked fiber laser,” in Conference on Lasers and Electro-Optics, (Optical Society of America, 2018), p. JTh2A.141.
- [33] N. G. Basov, R. V. Ambartsumyan, V. S. Zuev, P. G. Kryukov, and V. S. Letokhov, “Nonlinear amplifications of light pulses,” Soviet Physics JETP 23, 16–22 (1966).
- [34] J. Hendrie, M. Lenzner, H. Afkhamiardakani, J.-C. Diels, and L. Arissian, “Impact of resonant dispersion on the sensitivity of intracavity phase interferometry and laser gyros,” Optics Express 24, 30402–304010 (2016).