11email: claudia.agliozzo@eso.org 22institutetext: European Southern Observatory, Karl-Schwarzschild-Strasse 2, Garching bei München, 85748, Germany 33institutetext: Departamento de Ciencias Fisicas, Universidad Andres Bello, Avda. Republica 252, Santiago, 8320000, Chile 44institutetext: INAF-Osservatorio Astrofisico di Catania, Via S. Sofia 78, 95123 Catania, Italy 55institutetext: Trinity College Dublin, The University of Dublin, College Green, Dublin, Ireland 66institutetext: Space Telescope Science Institute 3700 San Martin Dr., Baltimore, MD, 21218, USA 77institutetext: Joint ALMA Observatory, Alonso de Córdova 3107, Vitacura, Santiago, Chile 88institutetext: Infrared Processing Analysis Center, California Institute of Technology, 770 South Wilson Ave., Pasadena, CA 91125, USA 99institutetext: Millennium Institute of Astrophysics (MAS), Nuncio Monseñor Sótero Sanz 100, Providencia, Santiago, Chile
A massive nebula around the Luminous Blue Variable star RMC 143 revealed by ALMA
The luminous blue variable (LBV) RMC 143 is located in the outskirts of the 30 Doradus complex, a region rich with interstellar material and hot luminous stars. We report the sub-millimetre detection of its circumstellar nebula with ALMA. The observed morphology in the sub-millimetre is different than previously observed with HST and ATCA in the optical and centimetre wavelength regimes. The spectral energy distribution (SED) of RMC 143 suggests that two emission mechanisms contribute to the sub-mm emission: optically thin bremsstrahlung and dust. Both the extinction map and the SED are consistent with a dusty massive nebula with a dust mass of (assuming ). To date, RMC 143 has the most dusty LBV nebula observed in the Magellanic Clouds. We have also re-examined the LBV classification of RMC 143 based on VLT/X-shooter spectra obtained in 2015/16 and a review of the publication record. The radiative transfer code CMFGEN is used to derive its fundamental stellar parameters. We find an effective temperature of K, luminosity of log, and a relatively high mass-loss rate of yr-1. The luminosity is much lower than previously thought, which implies that the current stellar mass of is comparable to its nebular mass of (from an assumed gas-to-dust ratio of 100), suggesting that the star has lost a large fraction of its initial mass in past LBV eruptions or binary interactions. While the star may have been hotter in the past, it is currently not hot enough to ionize its circumstellar nebula. We propose that the nebula is ionized externally by the hot stars in the 30 Doradus star-forming region.
Key Words.:
stars: massive – stars: variables: S Doradus – stars: individual: RMC 143 – stars: evolution – stars: mass-loss – dust, extinction1 Introduction
Luminous blue variables (LBVs), also known as S Doradus variables, are evolved massive stars that exhibit instabilities that are not yet understood (Conti 1984, 1997; Humphreys & Davidson 1994; Nota & Lamers 1997, and references therein). The LBV phenomenon is observed at luminosities above log, corresponding to stars with initial masses of . LBVs experience outbursts with enhanced mass loss during which they appear to make transitions in the Hertzsprung-Russell (HR) diagram from their quiescent hot state ( K) to lower temperatures ( K). Outbursts with visual magnitude variations of 1–2 mag are referred to as classical LBV outbursts. During giant eruptions the visual magnitude increases by more than 2 mag. Examples of stars that have experienced a giant eruption in our Galaxy are P Cygni in the 17th century (e.g. de Groot 1988; Lamers & de Groot 1992) and Car in the 1840s (reaching , e.g. Davidson & Humphreys 1997, 2012; Smith & Frew 2011).
LBVs are considered to be stars in transition to the Wolf-Rayet (WR) stage (e.g. Langer et al. 1994; Groh et al. 2014, and ref. therein). However, recent observational and theoretical work suggests that some LBVs could be the immediate progenitors of supernovae (e.g. Kotak & Vink 2006; Trundle et al. 2008; Gal-Yam & Leonard 2009; Smith et al. 2007, 2008; Groh et al. 2013; Groh 2014; Boian & Groh 2018). Most of the fundamental questions about the physical cause of the LBV instability remain unsolved. Hypotheses for the mechanism involve radiation pressure instabilities, turbulent pressure instabilities, vibrations and dynamical instabilities, and binarity (see Humphreys & Davidson 1994 for an overview). The high stellar luminosities near the Eddington limit probably enable instabilities (several processes in the literature are summarized in Vink & de Koter 2002; Owocki 2015; Guzik & Lovekin 2014). The impact of binarity has received much attention lately (Gallagher 1989; Kashi 2010; Kashi & Soker 2010; Smith 2011; Boffin et al. 2016). Binary scenarios for the formation of LBVs have been proposed. LBVs may be mass gainers that received a kick when the primary exploded or the product of a merger (e.g. Justham et al. 2014; Smith & Tombleson 2015a; Portegies Zwart & van den Heuvel 2016). However, the mass-gainer scenario presented by Smith & Tombleson (2015a), on the basis of the apparent isolation of LBVs relative to massive star clusters, has been highly debated in the literature (e.g. Humphreys et al. 2016).
LBVs are surrounded by massive circumstellar nebulae of dust and gas, rich in processed material, indicative of stellar mass ejected by an evolved object through extensive stellar winds and outbursts. Representative examples in our Galaxy are the enigmatic Car (e.g. Morse et al. 1998; Smith et al. 2003; Smith 2013; Morris et al. 2017), AG Car (e.g. Thackeray 1950; Vamvatira-Nakou et al. 2015), HR Car (Hutsemekers & van Drom 1991; Umana et al. 2009; Buemi et al. 2017), WRAY 15-751 (Hutsemekers & van Drom 1991; Vamvatira-Nakou et al. 2013), AFGL 2298 (Ueta et al. 2001; Umana et al. 2005; Buemi et al. 2010), and the candidate LBVs HD168625 (Umana et al. 2010, and ref. therein), G79.29+0.46 (Rizzo et al. 2008; Umana et al. 2011a; Agliozzo et al. 2014; Rizzo et al. 2014), G26.47+0.02 (Clark et al. 2003; Umana et al. 2012; Paron et al. 2012), and the Pistol Star (Figer et al. 1999; Lang et al. 1999; Lau et al. 2014). The common presence of a N-enriched or dusty circumstellar nebula around LBVs allows the identification of candidate LBVs (e.g. Humphreys & Davidson 1994; Nota et al. 1995; van Genderen 2001; Weis 2003), even if there is a lack of evidence of S Doradus variability. The discovery of an infrared ring nebula around Wray 17-96, identified by Egan et al. (2002) as a candidate LBV based on the mid-IR properties of the ejecta, is particularly important. Subsequently, the number of candidate LBVs increased considerably with mid-IR surveys carried out in the following years (Clark et al. 2005; Gvaramadze et al. 2010; Wachter et al. 2011; Flagey et al. 2014; Nowak et al. 2014).
Kochanek (2011) show that the physical requirement of dust condensation and growth in LBV ejecta (i.e. particle growth rate larger than grain photoevaporation rate) is met only for very high mass-loss rates (). Such high mass-loss rates occur during LBV giant eruptions, when the stars form a cool () and optically thick pseudo-photosphere that shields the dust from the soft UV photons and favours collisional particle growth with its high densities. Dust can also form close to periastron passage in colliding wind WC binaries, like in the case of HD 193793 (see Crowther 2007 for a review on dust formation in WR stars). A signature of wind-wind interaction with a companion star is a dusty ‘pinwheel’ nebula (Tuthill et al. 2008). Interestingly, a dusty spiral nebula has been observed in the binary LBV HR Car (Boffin et al. 2016; Buemi et al. 2017).
In the last few years, Spitzer and Herschel observations have been critical to map the dust distribution in Galactic LBV nebulae, often suggesting episodic mass-loss events or revealing the presence of a photo-dissociation region (e.g. Umana et al. 2009, 2011b). Mapping the dust in LBV nebulae at lower metallicities, such as in the Magellanic Clouds (MCs), has not been possible so far, because of the limited angular resolution of available infrared (IR) instrumentation. With the Atacama Large Millimeter Array (ALMA), we can for the first time map the dust of LBV nebulae in nearby galaxies in the sub-millimetre (sub-mm) bands.
2 The LBV status of RMC 143 and its circumstellar nebula
Is RMC 143 an LBV?
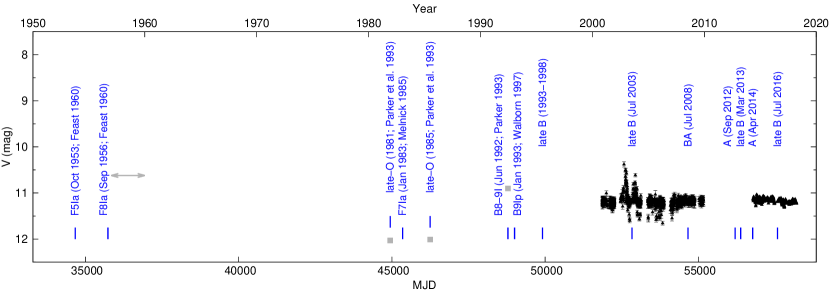
RMC 143 111RA 05:38:51.617, Dec 69:08:07.315 (ICRS coord., epoch=J2000). Alternate identifier: CPD-69 463. is classified as one of only eight confirmed LBVs in the Large Magellanic Cloud (LMC; Richardson & Mehner 2018). The star lies in the outskirts of the 30 Doradus (hereafter 30 Dor) star-forming region (Walborn & Blades 1997). Parker et al. (1993) classified the star as an LBV. The authors note photometric variations of at least 1.4 mag in band. Spectroscopic observations indicate that the star changed from spectral type F5 to F8 in the 1950s, became as hot as an O9.5 star in 1981/85, before moving back to cooler temperatures and appearing as a late-B supergiant in 1992.
The original LBV classification of RMC 143 by Parker et al. (1993) is questionable as the large change in -band photometry reported for 1981/85 and associated change in spectral type to late-O and also the F-type classifications in the 1950s and 1983 may be due to a misidentification of the star (Figure 1):
-
1.
There has been confusion in the literature between RMC 143 and HD 269929222RA 05:39:37.838, Dec 70:39:47.042 (ICRS coord., epoch=J2000).. In particular, Parker et al. (1993) state that HD 269929 is an alternative designation for RMC 143. HD 269929 has a -band magnitude of 12.2 mag and shows no significant brightness variation between 2000-2009 in the All Sky Automated Survey (ASAS; Pojmanski 1997). The star is classified as F8 (SIMBAD; Cannon 1936), which matches the classification of RMC 143 in the 1950s and 1983.
- 2.
-
3.
Clayton & Martin (1985) exclude RMC 143 from their stellar sample to study interstellar dust in the LMC, as they were aware that different observers had observed two or three different stars.
-
4.
The 1992 June International Ultraviolet Explorer (IUE) spectrum is consistent with a B8–9I star (Parker et al. 1993). From the FES image of the IUE a V-band magnitude of 10.9 mag is estimated.
-
5.
Walborn et al. (2017) report spectroscopic changes between the spectral types A and late-B in the time span from 1998 to 2016.
-
6.
Photometry variations on time scales of several weeks and of the order of 0.5 mag are observed in the ASAS lightcurve in the early 2000s. The All-Sky Automated Survey for SuperNovae (ASAS-SN) lightcurve shows no significant variations between 2014–2018 (Kochanek et al. 2017; Jayasinghe et al. 2018).
Unfortunately, the pre-1990 observations are not available to us. The F-type stellar classifications prior to 1990 may be observations of HD 269929 and the O-star classification in the early 1980s may also belong to observations of another star. However, the documented spectroscopic variations in Walborn et al. (2017) and the massive nebula (this work) both support an LBV classification. Given the star’s relatively low luminosity for an LBV, small spectroscopic variabilities would be expected following the amplitude-luminosity relation of S Doradus variables (Wolf 1989).
The circumstellar nebula of RMC 143
The identification of a circumstellar nebula around RMC 143 is difficult due to its location within the 30 Dor HII region. Feast (1961) noticed several nebular filaments, extending to an angular scale of 15″. Smith et al. (1998) analysed the velocity field and abundances of these filaments and attributed them to the 30 Dor complex. Only a compact region up to about from the star has abundances consistent with ejected stellar material during an LBV phase.
High spatial resolution Hubble Space Telescope (HST) images with the F656N filter show that the circumstellar material of RMC 143 is triangular shaped and is located north-west of the star (Weis 2003). The nebula is elongated with an extent of 4.9″ (about 1.2 pc) and oriented north to south-west. Its shape is very unusual and raises the speculation that strong stellar winds or turbulent motion in the HII region caused its disruption. High-dispersion optical spectra confirm the presence of a nebula with two velocity components.
Agliozzo et al. (2012) presented the first radio observations of RMC 143, performed with the Australia Telescope Compact Array (ATCA) in Band 4cm. The resolution with the 6-km array configuration varied between 1.5″ and 2.5″, depending on the central observing frequency (9 GHz and 5.5 GHz, respectively). This allowed to detect the radio counterpart of the optical nebula, which is ionized and emits in the radio by free-free transitions (bremsstrahlung emission). At 9 GHz, an unresolved source at the position of the star was detected. Comparing the radio and H flux densities, which trace the same gas, led to the conclusion that the optical nebula suffers intrinsic extinction due to dust.
In this paper, we present sub-mm/radio observations of RMC 143 with ALMA and ATCA and optical spectra with X-shooter at the Very Large Telescope (VLT). We perform a multiwavelength study and compare our data to archival optical HST Wide Field and Planetary Camera 2 (WFPC2) images and IR photometry. We interpret the nature of the ALMA sub-millimetre emission.
3 Observations
3.1 ALMA
RMC 143 was observed with ALMA on 26 December 2014 as part of a Cycle-2 project (2013.1.00450.S, PI Agliozzo). During the observations, forty 12 m antennas were used with an integration time of 16 min. A standard Band 7 continuum spectral setup was used, resulting in four 2-GHz width spectral windows of 128 channels of XX and YY polarization correlations centred at approximately 336.5 (LSB), 338.5 (LSB), 348.5 (USB), and 350.5 GHz (USB). Atmospheric conditions were marginal for the combination of frequency and high airmass (transit elevation is for RMC 143 at the ALMA site). Non-standard calibration steps were required to minimize image degradation due to phase smearing, to provide correct flux calibration, and to maximize sensitivity by allowing inclusion of shadowed antennas. Further discussion of these techniques and general aspects of observations and data reduction can be found in Agliozzo et al. (2017b). We derived the intensity image from naturally weighted visibilities to maximize sensitivity and image quality (minimize the impact of phase errors on the longer baselines). We imaged all spectral windows together (343.5 GHz average; approximately 7.5 GHz usable bandwidth), yielding an rms noise of .333The originally desired rms noise of was not achieved because only one third of the required observations were completed. In Figure 2 we show the 2, 3, and 4 contour levels of the emission. The lowest contour does not have strong statistical significance, but appears to partially overlap with the H emission. Deeper observations with ALMA would improve the image quality.
3.2 ATCA
| Date | Array | Frequency | LAS | HPBW | PA | ||
|---|---|---|---|---|---|---|---|
| (GHz) | (″) | (″2) | (°) | (mJy beam-1) | (mJy beam-1) | ||
| 2011-04-18/20 | ATCA | 5.5 | 6.5a𝑎aa𝑎afootnotemark: | 1.981.60a𝑎aa𝑎afootnotemark: | |||
| 2011-04-18/20 | ATCA | 9 | 6.5a𝑎aa𝑎afootnotemark: | 1.301.04a𝑎aa𝑎afootnotemark: | |||
| 2012-01-21/23 | ATCA | 17 | 6.5 | 0.840.68 | 8.8 | ||
| 2012-01-21/23 | ATCA | 23 | 4.1 | 0.630.51 | 8.8 | ¡0.15 | – |
| 2014-12-26 | ALMA | 343 | 9.0 | 1.230.95 | 78.7 |
We performed ATCA observations of RMC 143 between 20 and 23 January 2012, using the array in the most extended configuration (6 km) and the Compact Array Broadband Backend (CABB) “15 mm” receiver in continuum mode. RMC 143 was observed at different hour angles distributed over three days, alternating with the phase calibrator ICRF J052930.0724528. The observations were performed in marginal weather conditions, which may have caused a loss of coherence at the long baselines (small angular scales in the sky). For each source we split the receiver bandwidth in two 2-GHz sub-bands, one centred at 17 GHz and one at 23 GHz. The two data sets were reduced separately. Details on the observing strategy and data reduction can be found in Agliozzo et al. (2017a, b). Information on the final images, obtained by adopting the natural weighting scheme of the visibilities, can be found in Table 1. The table also lists information about the synthesized beam (Half Power Beam Width, HPBW), position angle (PA), largest angular scale (LAS), peak flux density, and rms-noise.
At 17 GHz, we detect above the nebular emission in its whole optical extent. At 23 GHz, the map is noisy because of the system response to bad weather at higher frequencies and we did not detect with statistical significance emission associated with RMC 143. We thus do not show the 23 GHz data.
We include in our analysis the 5.5 and 9 GHz data from the ATCA observations performed in 2011 with the CABB “4cm-Band” (4–10.8 GHz) receiver, described in Agliozzo et al. (2012) and shown in Figure 2. At these frequencies the HII region is bright and causes confusion. To mitigate artefacts due to the secondary lobes from bright sources in the region, we reprocessed the data and filtered out the spacings smaller than , in order to match the LAS of the 17-GHz data. This operation degrades the image quality and the rms-noise. In Table 1, the LAS and beam information at 5.5 and 9 GHz refer to the newly processed maps, which are used to derive the spatially-integrated flux density.
3.3 VLT/X-shooter
RMC 143 was observed with X-shooter at the VLT on 2 October 2015 and 12 January 2016 (ESO programme 096.D-0047(A), PI Mehner). X-shooter is a medium-resolution echelle spectrograph that simultaneously observes the wavelength region from – Å with three arms (Vernet et al. 2011). Spectra were obtained with the narrowest available slits of 05 in the UVB arm, 04 in the VIS arm, and 04 in the NIR arm yielding spectral resolving powers of . Spectra obtained with the 5″ slits provide us the means to achieve absolute flux calibrations to % accuracy. However, the large aperture includes nebular reflection. The data were reduced with the ESO X-shooter pipeline version 3.2.0, and the flux normalization was computed using custom IDL routines developed by one of us (JHG). We estimate that the uncertainty in the flux normalization is about 2%.
3.4 HST
The HST images were obtained with the WFPC2 instrument using the H-equivalent filter F656N (proposal ID 6540, PI Schulte-Ladbeck). The images were retrieved from the STScI data archive, combined, and astrometrically recalibrated as described in Agliozzo et al. (2012). These data were first published by Weis (2003).
4 The stellar parameters and atmosphere abundances of RMC 143
| Parameter | Value | Error |
|---|---|---|
| a𝑎aa𝑎afootnotemark: | K | K |
| b𝑏bb𝑏bfootnotemark: | 9 600 K | 1000 K |
| log | ||
| c𝑐cc𝑐cfootnotemark: | yr-1 | yr-1 |
| logd𝑑dd𝑑dfootnotemark: | ||
| 70 km s-1 | 10 km s-1 | |
| 0.42 mag | 0.02 mag | |
| 4.0 | 0.1 |
(b)𝑏(b)(b)𝑏(b)footnotemark: Parameters labelled “*” refer to .
(c)𝑐(c)(c)𝑐(c)footnotemark: The clumping factor , which is unknown, is set to unity.
(d)𝑑(d)(d)𝑑(d)footnotemark: Specified at .
| Species | Number fraction | Mass fractiona𝑎aa𝑎afootnotemark: | Z/Z |
|---|---|---|---|
| (relative to H) | |||
| H | 1.0 | 4.3e-01 | 0.58 |
| He | 3.3e-01 | 5.6e-01 | 2.19 |
| C | 4.0e-05 | 2.0e-04 | 0.20 |
| N | 7.5e-04 | 4.2e-03 | 14.89 |
| O | 1.5e-04 | 1.0e-03 | 0.41 |
C = 9.79e-04, N = 2.82e-04, O = 2.45e-03.
Many emission lines form in the dense stellar winds of LBVs and veil the underlying photospheric spectrum. Complex radiative transfer models, which include the necessary physics to study the radiation transport across the atmosphere and wind, are needed to obtain realistic parameters. We compare the X-shooter spectra of RMC 143 obtained in 2015 with atmosphere models computed with the radiative transfer code CMFGEN (version 5may17, Hillier & Miller 1998), which has been successfully applied to several LBVs (e.g. Hillier et al. 2001; Groh et al. 2006, 2009, 2011; Clark et al. 2009, 2012; Georgiev et al. 2011; Mehner et al. 2017). For a review on the essential properties of the code and the basics of spectroscopic analysis of massive stars using photospheric and wind diagnostics, see Groh (2011) and Martins (2011).
The diagnostics to find the best-fitting stellar model for RMC 143 are similar to those described in Mehner et al. (2017), except for the effective temperature. This quantity is constrained based on the equivalent widths of the Mg II 4481 and Mg I 5183 lines. The value of is supported by He I 4713, He I 5876, photospheric Fe II lines, and the emission components of Fe II lines formed in the wind. The mass-loss rate is constrained based on the emission components of Fe II and H Balmer lines. We note that in this parameter regime, the strength of the H emission lines is extremely sensitive on the effective temperature and temperature structure of the wind. The luminosity of RMC 143 is constrained based on the absolute flux calibration of the X-shooter spectrum used to constrain the other stellar parameters. Since RMC 143 is a variable star, we consider this more reliable than using broad-band photometry obtained at different epochs.
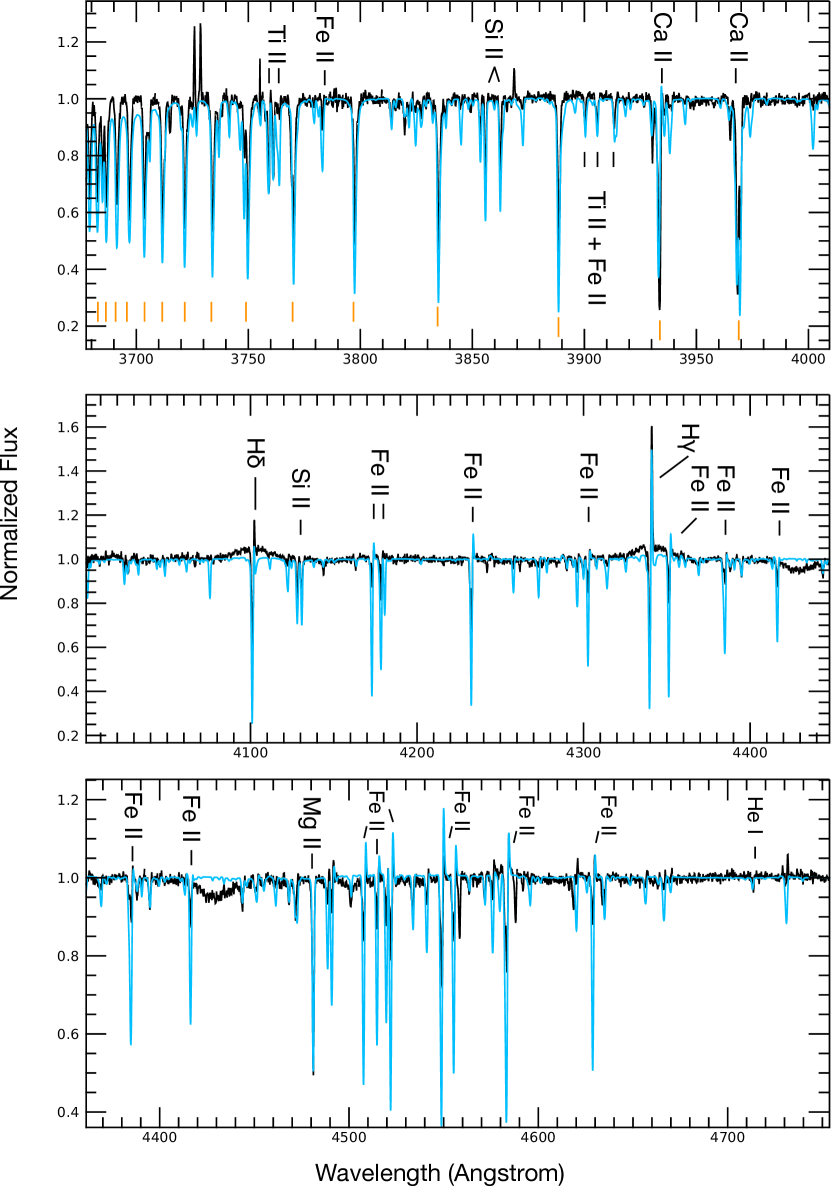
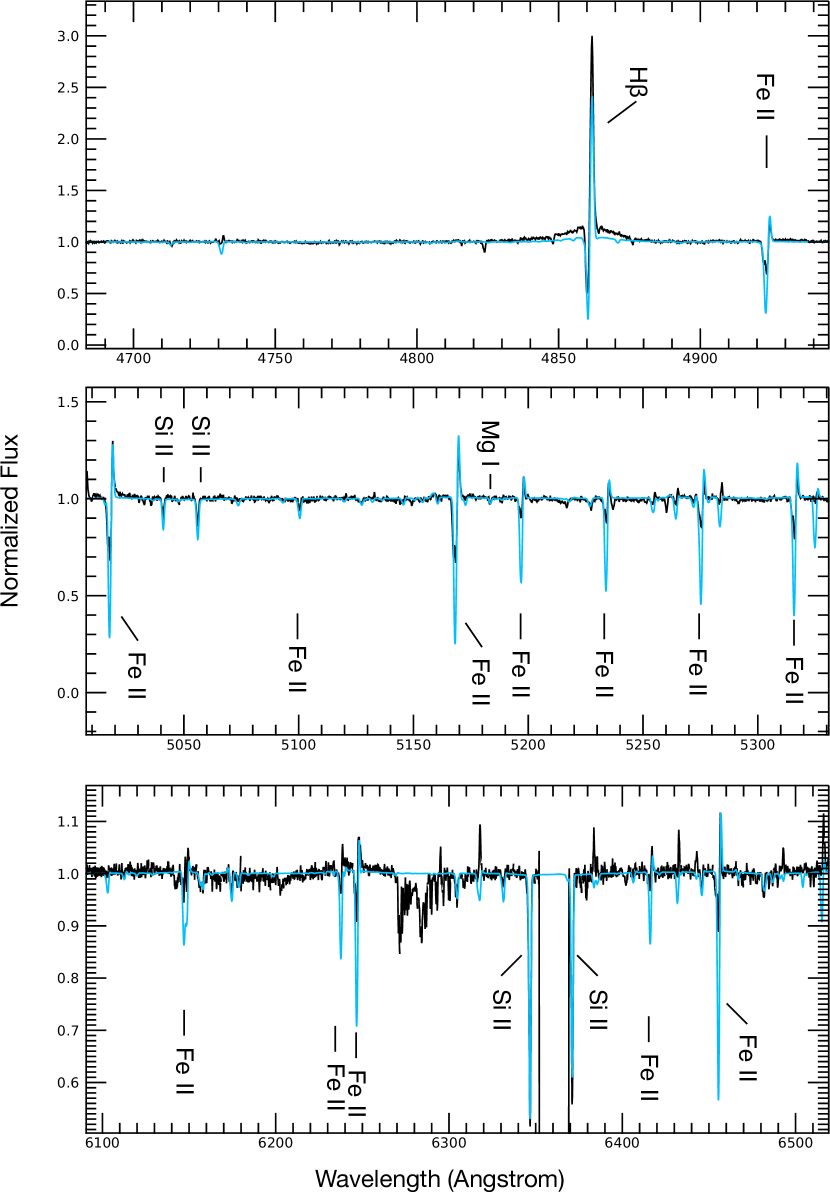
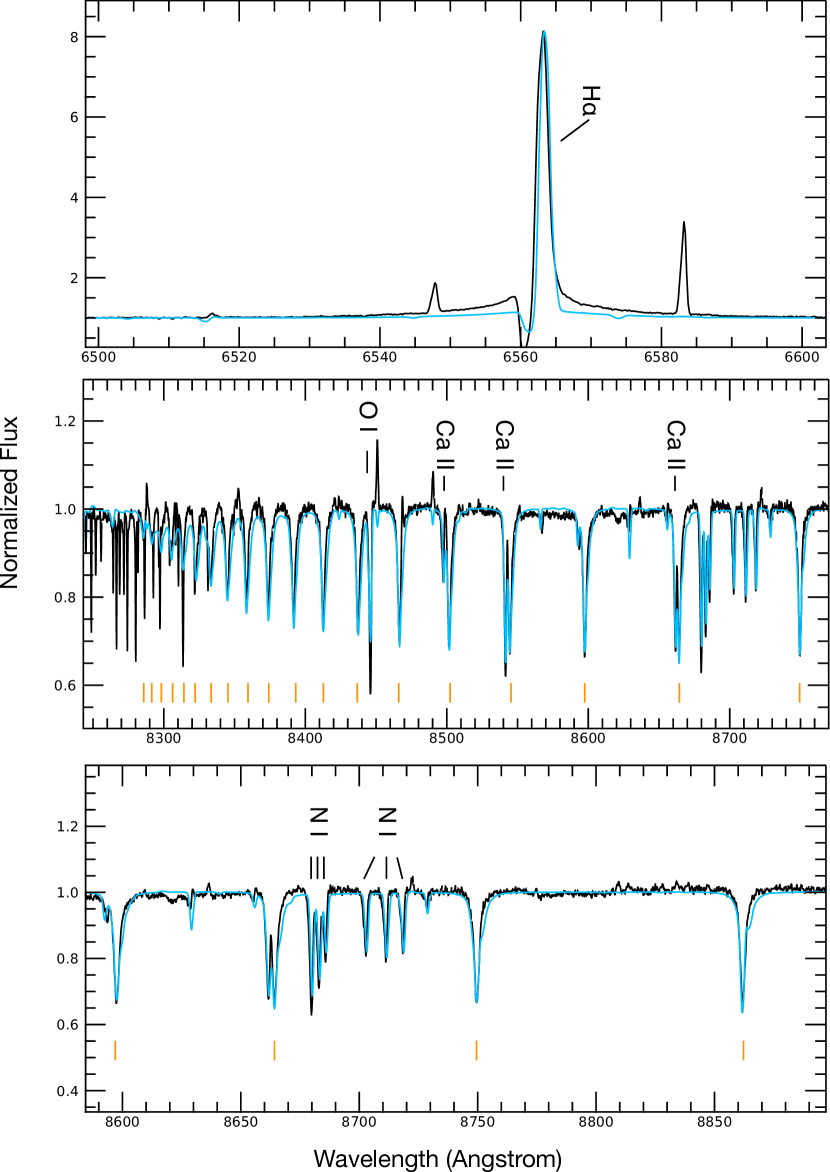
Figures 3, 4, and 5 compare the 2015 X-shooter spectrum of RMC 143 with our best-fit CMFGEN model. The derived stellar parameters for its quiescent state are listed in Table 2. We find an effective temperature of K and a stellar luminosity of log ( mag). We note that the value of derived from the Mg I/Mg II line ratio does not provide enough free electrons in the wind, which are needed for producing the electron scattering wings clearly visible in the H recombination lines. In addition, the H ionization structure seems to require a slightly higher value of . In this parameter range, our models show that a small increase of (by 500-800 K) would be enough for producing stronger H emission and broader electron scattering wings. We still prefer to give higher weight to the Mg I/Mg II, since these lines are formed deeper in the wind. Our interpretation is that the H ionization structure is not fully reproduced by our models, and is likely affected by time-dependent effects that are inherent to LBVs (Groh & Vink 2011).
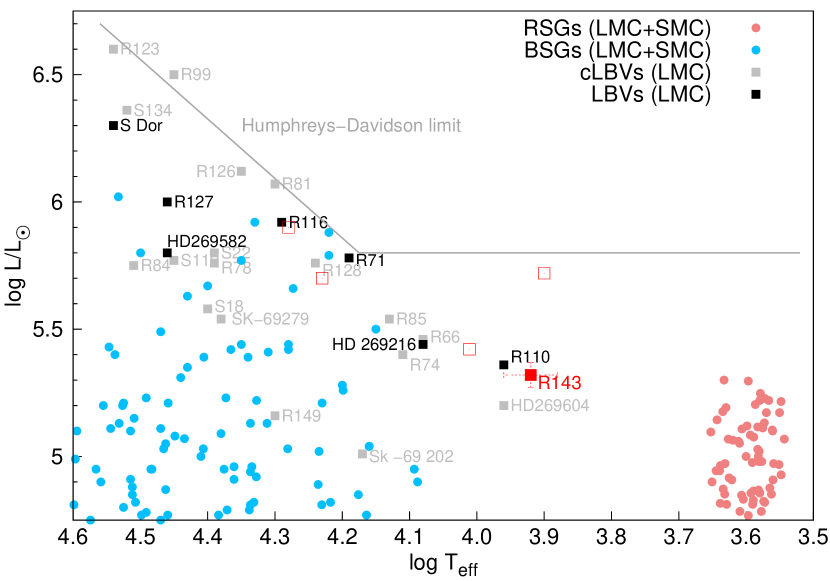
Our derived value of log is lower than the most commonly-used estimate (log), which was suggested by Parker et al. (1993). However, our luminosity value is in line with the estimate from Walborn & Blades (1997), who originally suggested that R143 had an initial single-star mass around . The two most likely possibilities are that (1) Parker et al. (1993) misidentified RMC 143 (see Section 2), or (2) RMC 143 had a different value of luminosity and temperature around the early 1990s. Figure 6 shows the position of RMC 143 in the HR diagram obtained from our CMFGEN modelling.
Extended emission from surrounding material is apparent in the spectra and not all hydrogen and helium lines are matched equally well. The estimation of the effective temperature is not affected by the nebular contamination, while the luminosity may be somewhat overestimated due to inclusion of reflected or scattered nebular continuum. Since the hydrogen absorption lines are filled in with extra emission from the surrounding nebula, we only derive a lower limit of the terminal wind velocity .
The gravity is estimated to be log and the stellar mass to be . A mass-loss rate of yr-1 for a clumping factor equal to 1 fits the hydrogen emission well. The mass-loss rate is more affected by the uncertain ionization structure and time dependence than by nebular contamination since we used mainly Hβ, higher Balmer lines, and Fe II lines to constrain it. For comparison, the LBV W243 with a similar temperature of K but much higher luminosity has a much weaker mass-loss rate of yr-1 (Ritchie et al. 2009).
RMC 143 displays the spectrum of an LBV. In particular, the spectrum displays no [O I] 6300,6364 emission, characteristic of the sgB[e] class (Humphreys et al. 2017). We also detect no CO first-overtone emission at , indicative that RMC 143 has no high density circumstellar disc as is the case for B[e] stars (McGregor et al. 1988b). RMC 143 shows signs of CNO-processed material at the surface (Table 3), with enhanced He and N, and depleted H, C, and O. This confirms the evolved nature of the star, especially given the low current mass ().
5 Morphology of the radio and sub-millimetre emission
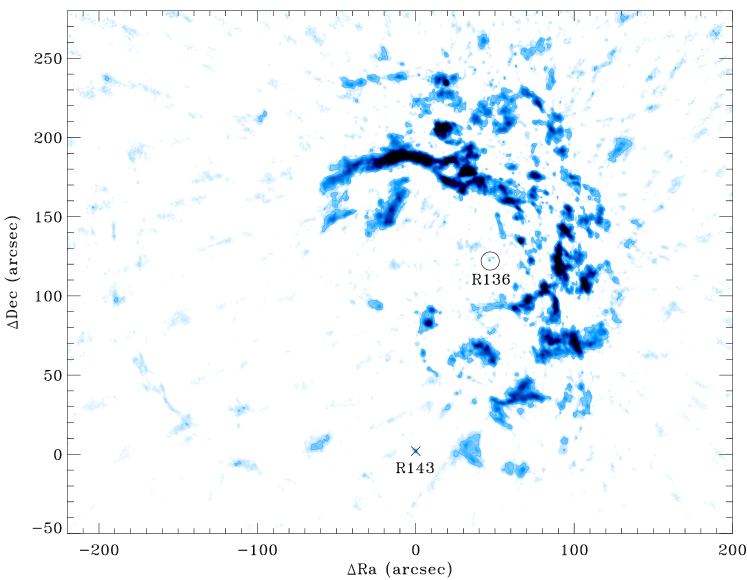
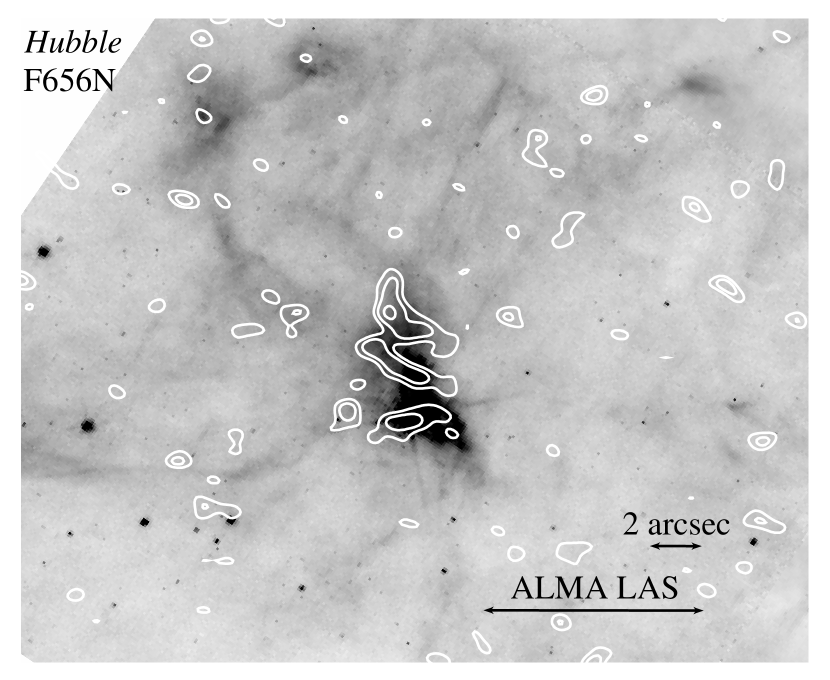
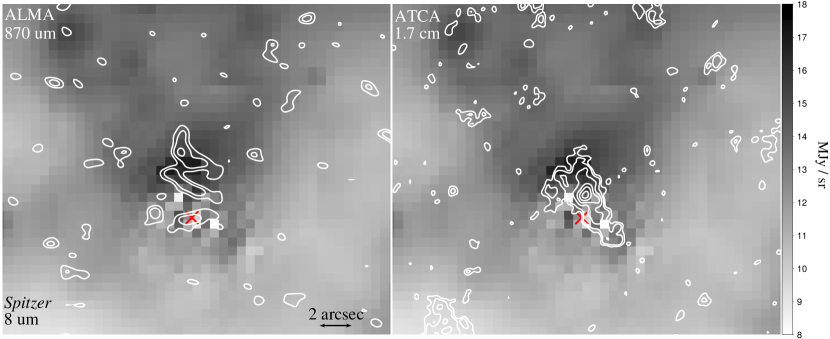
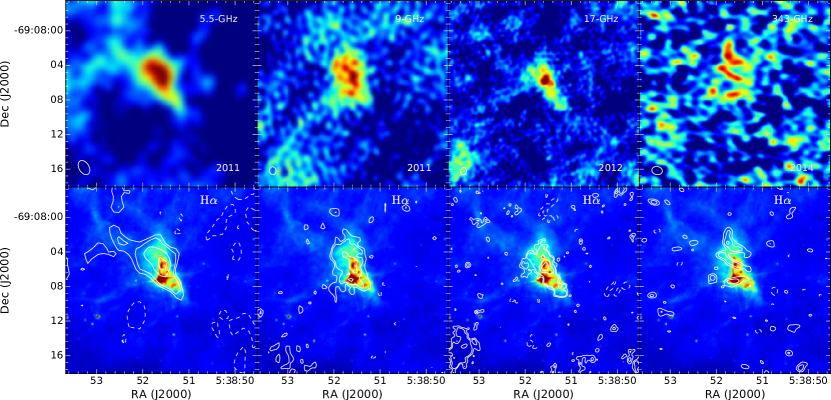
RMC 143 lies south-east from the centre of the 30 Dor star-forming region, the most luminous HII region in the Local Group. The environment around RMC 143 is rich in interstellar material and hot luminous stars and is very bright in the optical, IR, and radio. Figure 7 shows part of the 30 Dor complex as seen by ATCA in the 6-km configuration at 5 GHz. The LAS in this map is , which means that more extended radio emission in the star-forming region is filtered out by the interferometer. The Feast filaments (with an angular scale of ) are not detected at 5 GHz, probably because they are too faint, although the contour elongated toward the N-E side of the nebula suggests a partial detection of one of the filaments. At higher frequencies, the filaments would be filtered out because of the lack of baselines for those angular scales. The Feast filaments and RMC 143’s nebula are illustrated in the H image of Figure 8, with the ALMA contours at 343 GHz overlaid.
As is the case in the optical, the nebula is also triangular-shaped in the radio, with no counterpart in the east and south-east of the star (Figure 2). From the 17 GHz map, which has the highest spatial resolution, we estimate a size (beam convolved) of the radio emission of about 6″ along the largest extension. The point-source detected at 9 GHz at the position of the star is not detected at 17 GHz, most likely because of lack of coherence at the smallest angular scales due to high phase-rms during the observations. The knot of bright emission visible at all radio frequencies corresponds to the nebular material 2″ north of the star, attributed to RMC 143 (Smith et al. 1998).
The sub-mm emission detected by ALMA has an irregular shape and is distributed on one side of the star (Figure 8), similarly to the optical and radio emissions. However, the sub-mm contours suggest a different morphology and thus a different nature of the emission. The sub-mm continuum emission can be due to both free-free emission from the ionized gas and to thermal emission from dust. The slightly curved emission in the sub-mm seems aligned with an “imaginary” extension of at least one of the Feast filaments over RMC 143’s nebula. This is not seen in the radio maps. A compact object at the position of the star is also detected in the ALMA map with a statistical significance of .
Ideally, we would like to compare the sub-mm continuum emission with far-IR images. Unfortunately, the spatial resolution of IR space telescopes is unsuitable for disentangling the contribution of the central star, the circumstellar nebula, and the interstellar dust from the total emission. For example, the Spitzer/MIPS 24 image has a resolution of , too poor for morphological comparison with other wavelengths. We retrieved the 8 IRAC image (Meixner et al. 2006, with a resolution of ) and subtracted the point source at the position of RMC 143 using the tool APEX in the MOPEX package (Makovoz & Marleau 2005; NASA/IPAC Infrared Science Archive et al. 2011). The point-source subtraction worked relatively well considering the high and not uniform background, and the residual image is sufficient for a qualitative comparison with the ALMA and ATCA data. The spatial resolution is still poor and the central part of the nebula may have been subtracted together with the point-source. However, it is possible to recognise an outer asymmetric emission that seems to overlap better with the sub-mm 343 GHz ALMA contours than the cm 17 GHz ATCA contours (Figure 9). Thus, the flux plausibly arises from the same component responsible for the ALMA contours.
6 Ionized matter
The flux density of RMC 143 and the rms-noise is determined from the 17 GHz radio map using the CASA viewer. For the flux density, we integrate the nebular emission of areas above level. The rms-noise is evaluated in regions free of emission and the flux density error is estimated as , where is the number of independent beams in the selected region. Calibration errors are negligible and the uncertainty is dominated by the noise in the maps and possible systematic under-estimated due to the cut. We also estimate the flux densities at 5.5 and 9 GHz from the reprocessed maps (Section 3.2) to reduce the contribution from the HII region extended emission and/or image artefacts due to zero-baseline scale missing (Table 1; compare with Agliozzo et al. 2012). In fact, both can contaminate the nebular emission and eventually falsify the flux density analysis. Because of the inhomogeneous background in the 5.5 and 9 GHz maps, the flux density measurements have a larger uncertainty, especially at 9 GHz.
The total integrated flux density encompassing the nebula and the central object at 343 GHz is (the error also includes 10% flux uncertainty). Part of this emission probably originates from the ionized nebula and is due to bremsstrahlung. In fact, from the flux density at 17 GHz, the extrapolated value at 343 GHz accounting for the free-free emission is , about one third of the observed total flux density at 343 GHz.
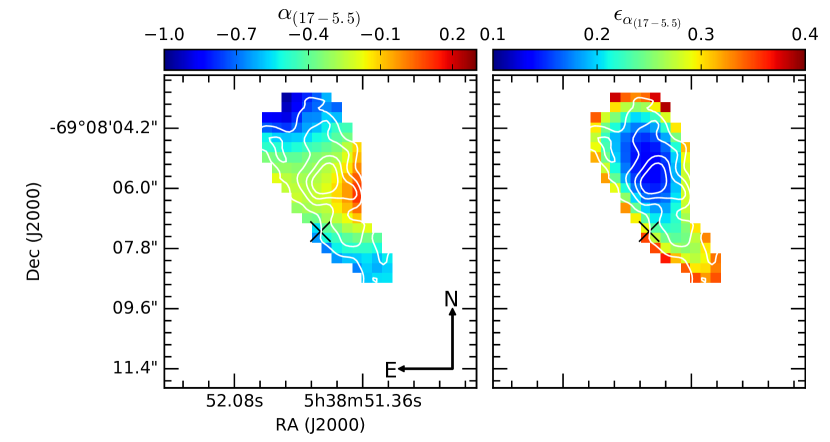
We derived a spectral index map (per-pixel) between 5.5 and 17 GHz, after re-gridding the highest-resolution map (17 GHz) to the same grid of the 5.5 GHz map and re-convolved it with a synthesized beam that matches the resolution at 5.5 GHz, similar to Agliozzo et al. (2017a). Figure 10 shows the spectral index map and its associated error map. Calibration errors are negligible and the error in each pixel is given by the sum in quadrature of the rms-noise in both the maps. The weighted fit of the power-law between the flux densities at 5.5, 9, and 17 GHz gives us a mean spectral index , which is consistent with optically thin free-free emission typical of evolved HII regions (theoretically it is ). The knot visible at all the radio frequencies in the nearly-middle part of the nebula has a flat flux density distribution (spectral index ), typical of optically thin bremsstrahlung emission. This suggests that its large brightness relative to the surrounding nebula is due to additional material along the line of sight rather than a density clump.
The point-source at the position of the star visible at 9 and 343 GHz has peak flux densities of and , respectively. We use the stellar parameters derived in Section 4 and the formulation of the spectrum of free-free radiation from ionized spherical stellar winds by Panagia & Felli (1975) to determine the expected flux density at 9, 17 and 343 GHz, as
where we assume a mean molecular weight per ion equal to 1.33 (adopting the He abundance determined in Section 4), an electron temperature of and an average ionic charge of , accounting for the fact that in such a cool star He should be neutral. Same values for and were used by Leitherer et al. (1995) to model the radio emission of Cygnus OB2 No. 12. We set equal to 1. With these assumptions we find flux densities of , and at 343, 17 and 9 GHz, respectively. The errors were derived taking into account the uncertainties from the CMFGEN model and a uncertainty for and . Based on this model, at 343 GHz we would expect to observe a higher flux density; at 9 GHz the measurement might include some nebular flux; at 17 GHz we might have lost the detection of the point source because of decorrelation during the observations due to unstable weather. However, the terminal velocity determined in Section 4 is a lower limit, thus the above flux densities must be treated as upper limits.
It seems plausible that the sub-mm emission is due to free-free, but such a model of stationary, isothermal and spherically symmetric optically thick ionized wind may not applicable to RMC 143. The ionization fraction in the wind might be lower than assumed, given the low effective temperature and the hydrogen in the wind might recombine at large distances from the surface, among many possible scenarios. For , Agliozzo et al. (2017b) found that a collimated ionized wind model better explains the observed SED from the near-IR to the radio. Other measurements in between the two ALMA and ATCA frequencies and between the near-IR and the sub-mm would be very useful to better understand the nature of the central object emission. Another source of emission in the sub-mm could be dust in the wind or in a shell in front of the star.
7 The spatial distribution of dust
The H emission in the nebula of RMC 143 is due to the de-excitation of the recombined hydrogen atom and the radio centimetric emission is due to free-free transitions. They trace the same gas (Agliozzo et al. 2012) and it is thus possible to determine the extinction of the H line by comparing the surface brightness at optical and radio wavelengths (Pottasch 1984).
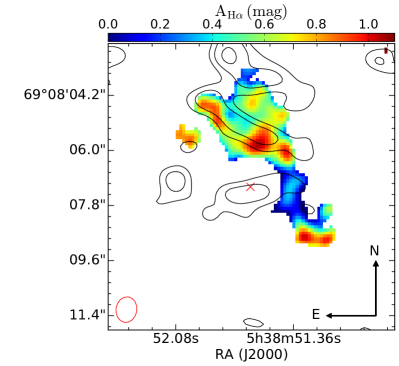
We follow the procedure described in Agliozzo et al. (2017a). An electron temperature of (Smith et al. 1998) is adopted. The extinction map is derived by comparing pixel-by-pixel the highest-resolution radio image (17 GHz) with the HST image as , where is the expected radio emission from the recombination-line emission (see equations 7 and 8 in Agliozzo et al. 2017a). This computation was performed in every common pixel with brightness above 3, where was computed by summing in quadrature the noise in the maps and calibration uncertainties. We mask the emission from the star, keeping in mind that we want to estimate the expected free-free emission from the optical nebular line. The derived extinction map is illustrated in Figure 11.
Relatively small extinction due to dust is evident across the entire region. The maximum value for is 1.06 mag and corresponds to the knot of the radio and optical emission. This knot is not a density clump according to the spectral index analysis and is likely the effect of material along the line of sight. The most extinguished region is in the same direction of the ALMA emission corresponding to the middle part of the nebula. The ALMA emission may arise mostly from a cool dust component that surrounds the ionized gas in the nebula and extinguishes the optical emission.
8 The SED of RMC 143
| Telescope | Instr. | FWHM | ||||
| [] | [′′] | [mJy] | ||||
| Spitzer | MIPS | 23.675 | 5.9 | 482.5 | 96.5a𝑎aa𝑎afootnotemark: | |
| Herschel | PACS | 100 | 6.7 | 636 | 254 | |
| Herschel | PACS | 160 | 11 | 426 | 151 | |
| ALMA | Band 7 | 872.8 | 1.1b𝑏bb𝑏bfootnotemark: | 2.5 | 0.4 | |
(b)𝑏(b)(b)𝑏(b)footnotemark: ALMA measurement is integrated over the nebula.
Our ALMA sub-mm observations can constrain some of the dust properties. To understand the origin of the ALMA sub-mm emission we compare it with the available IR photometry, which were derived from images with different spatial resolutions. We consulted the IR catalogues with the CDS VizieR (Ochsenbein et al. 2000) and IRSA Gator888https://irsa.ipac.caltech.edu/applications/Gator/ tools. For the mid- and far-IR photometry we evaluated the effect of confusion on photometry. We include photometry from the 2MASS Point Source Catalog (Cutri et al. 2003), the Spitzer SAGE legacy survey (Meixner et al. 2006, Data Release 3/final), the AKARI IRC LMC survey (Kato et al. 2012; Ita et al. 2008), WISE (Cutri et al. 2012), and Herschel PACS (Meixner et al. 2013). We include our measurements of the ALMA Band 7 and ATCA Bands 4cm (5.5 and 9 GHz) and 15mm (17GHz).
We have excluded the WISE W3 and W4 band photometry due to confusion in the relatively large effective beams ( for W3 and for W4, larger in Atlas images) and the complication of the very wide W3 spectral response. The W4 band photometry in particular is highly discrepant with the MIPS24 photometry at similar wavelength but much higher spatial resolution ( FWHM). We consider as valid the AKARI S11 and L15 band photometry. Although the AKARI all-sky survey does not have sufficient spatial resolution, the LMC survey was taken in a pointed imaging mode which yields comparable resolution to MIPS24 in the L15 band and even better in the S11 band (FWHM of for L15 and for S11, Onaka et al. 2007). The available Herschel PACS100 and 160 band photometry is somewhat affected by confusion due to the large PSFs ( and FWHM), but this appears to be well accounted for in the large quoted error bars, and they are the only far-IR photometry available. Unfortunately, there is no PACS70 data for RMC 143, which would have had a better spatial resolution and been closer to the peak of the dust emission. There is no detection by MIPS70 due to the very large beam ( FWHM) and confusion. For MIPS24 we take the weighted average of the two SAGE epoch measurements of and , that is, or . Due to the expected confusion we assume a 20% uncertainty on the MIPS24 photometry.
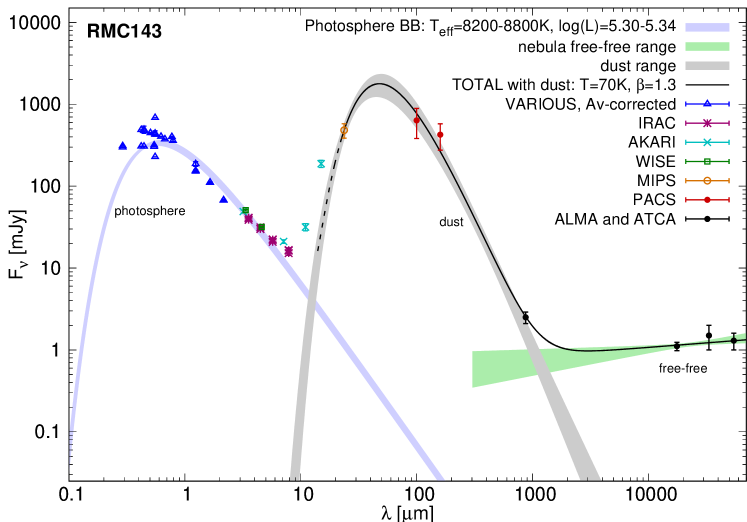
We also include the photometry available in VizieR from the UV and optical catalogues XMM-Newton, AC2000, AAVSO, GAIA, and RAVE (Page et al. 2012; Urban et al. 1998; Henden et al. 2015; Gaia Collaboration et al. 2016; Kunder et al. 2017). We correct these data for interstellar dust extinction, using the extinction curve from Fitzpatrick (1999), and mag, as determined from our CMFGEN modelling (see Table 2). Keeping in mind that the UV to near-IR photometry comes from observations performed at different epochs and the star being likely variable, we can argue that the corrected data (blue triangles in Figure 12) agree with the CMFGEN model of a star with , log at a distance of (Table 2).
The SED of RMC 143’s circumstellar material can be described with two components: 1) the ionized gas in the nebula that can be modelled by optically thin bremsstrahlung dominating the total flux at radio wavelengths (see Section 6); 2) a dust component that peaks in the far-IR, typical for LBV nebulae (e.g. Hutsemekers 1997; Clark et al. 2003).
Given the limitations of the available photometry and lack of a mid-IR spectrum, we fit only a simple single-temperature greybody (power-law opacity index , see e.g. Backman & Paresce 1993) to model the dust and obtain an estimate of the dust mass. As wavelengths shortward of about can deviate strongly from a simple greybody due to PAH and/or silicate spectral features (typically in HII regions, but also in the nebula of the candidate LBV HD 168625, Draine & Li 2007; Compiègne et al. 2010; Umana et al. 2010) or due to several ionized gas forbidden lines (e.g. as seen in Spitzer IRS spectra of HR Car and G79.29+0.46; Umana et al. 2009; Agliozzo et al. 2014), we only fit the greybody to the MIPS24, PACS100+160, and ALMA photometry. Table 4 contains a summary of the photometry used to fit the dust. The best-fit photosphere and ionized gas free-free flux density distributions were added to the greybody for fitting the observed photometry. The free-free contribution to the ALMA measurement is significant at 0.47 to 1.01 mJy (limits of twice minimum of the free-free fit to the ATCA photometry), assuming the free-free power-law spectrum continues without turnover to the ALMA frequency. The uncertainty on the free-free contribution of was added in quadrature with the ALMA measurement error in the fit.
A dust emissivity at of and LMC distance of are assumed. The greybody fit yields representative parameters of , and . The reduced of the fit is 1.44. This somewhat high value appears to be mostly due to the PACS160 measurement, which we do indeed expect to be the most affected by confusion due to having the largest beam size. The greybody flux density distribution region within twice the minimum is shown as the grey band in Figure 12. The total model, including best-fit free-free, dust greybody and photosphere is shown by the black line (solid longward of m where we consider the greybody meaningful). The AKARI S11 and L15 points in Figure 12 have a colour-correction applied appropriate for a , greybody (correction factors are 2.712 and 2.135, respectively, AKARI IRC Data User Manual), but they still lie significantly above the photosphere and the greybody. As previously mentioned, we expect these bands, which have a wide bandwidth, to show evidence of silicate or PAH emission, like in the case of the Galactic candidate LBV HD168625 (Skinner 1997; Umana et al. 2010), or several bright mid-IR ionized gas emission lines, like in the case of HR Car and G79.29+0.46 (Umana et al. 2009, 2011a; Agliozzo et al. 2014), together with a possible hotter thermal component. Another source of excess at the mid-IR wavelengths could be very small grains, typically observed in HII regions and produced by erosion of large grains in the diffuse medium. Contribution from very small grains to the emissivity in the far-IR and sub-mm should be negligible (Compiègne et al. 2010) and we are not aware of their observations in LBV nebulae.
Note the departure of from the interstellar case (): implies either the existence of relatively large grains, a significant optical depth, or a range of physical dust temperatures (studies of Galactic objects showed that the dust temperature decreases with increasing distance from the star, e.g. Hutsemekers 1997; Buemi et al. 2017). Large grains have been found in other LBV nebulae, such as those of AG Car (McGregor et al. 1988a; Vamvatira-Nakou et al. 2015) and Car (Mitchell & Robinson 1986), and in the ejecta of RSGs (e.g. Scicluna et al. 2015). The derived temperatures are higher than typical values of interstellar dust and also dust in evolved HII regions (Paladini et al. 2012). The dust temperature is typical compared to other LBVs (e.g. Hutsemekers 1997). Stars displaying the B[e] phenomenon have higher dust temperatures of about 500–1000 K (Lamers et al. 1998). A detailed modelling of the spatially integrated SED of ’s Homunculus including mid- and far-IR spectroscopy by Morris et al. (2017) shows a very complex chemical composition of the dusty ejecta. Unfortunately, the current data of RMC 143 preclude us to derive a more detailed model. Note that RMC 143 has a significant fraction of ionized gas, while the Homunculus is mostly neutral, so the mid-IR spectrum might be different in the two objects.
9 The nebular mass and initial mass
| Source | Dust Mass | Dust T | Ref. | |
| () | (K) | |||
| RMC 143 | this work | |||
| RMC 127 | 7190 | 1.52.0 | [1] | |
| S 61 | 105145 | 0.551.5 | [2] | |
| RMC 71 | 1 | N/A | N/A | [3] |
| \tablebib [1] Agliozzo et al. (2017b); [2] Agliozzo et al. (2017a); [3] Guha Niyogi et al. (2014). | ||||
The sub-mm emission detected with ALMA presents a different morphology than the optical and radio emission, although the contours have low statistical significance due to the low signal-to-noise ratio. The sub-mm emission on the north-east side of the nebula may be aligned with the interstellar filaments associated with 30 Dor. An analysis of the data shows that: 1) at least two-thirds of the integrated sub-mm flux density is due to dust that extinguishes the H emission in-homogeneously across the nebula; 2) dust temperatures and parameter values are consistent with processed material in LBV nebulae rather than with ISM dust.
The dust mass derived in the previous Section is to date the largest value found in an LBV nebula at sub-solar metallicities. Only a few studies on dust in the MCs LBVs have been performed, see Table 5. A study to address the contribution of LBVs to dust production at the LMC and SMC metallicities is ongoing (Agliozzo et al., in prep).
The gas-to-dust ratio G/D is an unknown parameter in LBVs. Because of favourable physical conditions in LBV eruptions, this parameter may be lower than in the ISM. Roman-Duval et al. (2014) report a G/D of in the LMC diffuse atomic ISM, although they find that in dense regions this might be lower (G/D ). Assuming the lower value as representative of the 30 Dor region and the dust mass derived in this work, we find a total nebular mass for RMC 143 of , and assuming G/D=100 (more representative of our Galaxy) .
In Agliozzo et al. (2012), we derived an approximate ionized mass of . Although the ionized mass estimate is dependent on the assumed volume for the nebula (which is not easy to determine because of the nebula’s irregular shape), it seems plausible that a large gas mass is not ionized and is located in a photo-dissociation region around the ionized nebula, mixed with the dust. The total nebular mass has an order of magnitude uncertainty, due mostly to the uncertainty of the gas to dust ratio and of the assumed dust emissivity, .
The stellar parameters of RMC 143 suggest that the star’s location in the HR diagram is at the lower luminosity end of LBVs. Our derived luminosity (log) suggests a single-star initial mass around . Given that the CMFGEN models suggest a (spectroscopic) current mass of , it appears that RMC 143 has lost a large fraction of its initial mass. RMC 143’s position in the HR diagram is similar to that of the Yellow Hypergiant (YHG) Hen3-1379, a post-Red Supergiant (RSG) star on its way to the LBV phase, as argued by Lagadec et al. (2011) and Hutsemékers et al. (2013). Further analysis would be needed to draw firm conclusions on whether the nebula was ejected during binary interaction, or LBV eruptions, or during a previous RSG phase. In particular, nebular abundances would need to be compared to numerical stellar evolution models of single and binary stars. Beasor & Davies (2018) discussed the uncertainties of RSG mass-loss rates along the evolutionary sequence of a star, showing that such a RSG star loses a small fraction () of its mass through stellar winds. However, no similar observational estimate exists for the more massive RSGs that RMC 143 could have evolved from.
In light of our revised low luminosity of RMC 143, an interesting avenue for future study would be a re-appraisal of the evolutionary status of RMC 143 in comparison to its nearby environment (Smith & Tombleson 2015b; Humphreys et al. 2016; Aadland et al. 2018). Aghakhanloo et al. (2017) developed models of passive dissolution of young stellar clusters, and concluded that LBV environments are inconsistent with them evolving from single stars. It would be interesting to investigate the behaviour of RMC 143 given its relatively low current and initial mass that we derived in this paper.
10 The ionizing source of ’s nebula
The quiescent temperature of RMC 143 over the past yr suggests that the star is not hot enough to ionize its extended nebula. Although we cannot exclude a hotter phase for RMC 143 in the past, the observations suggest that an external ionizing source may be responsible for the ionization of its nebula. This was also proposed for the circumstellar nebulae of the Pistol Star (Figer et al. 1999) and IRAS 185760341 (Buemi et al. 2010).
The nearby star-forming region 30 Dor contains massive stars (Doran et al. 2013), with a large fraction of them forming the well-known RMC 136 cluster. 30 Dor’s giant nebula is ionized and detected at radio wavelengths (Figure 7). Melnick (1985) conclude that a large fraction of the ionization of 30 Dor is provided by the UV photon budget produced by the early-type stars, WR stars, and blue supergiants within 25 pc of the cluster centre. Doran et al. (2013) estimate the feedback of hot luminous stars in 30 Dor from a census of hot stars within 150 pc of RMC 136 obtained by the VLT-FLAMES Tarantula Survey (Evans et al. 2011).
We use the ionizing photon luminosities in Doran et al. to derive an order of magnitude estimate of the Strömgren radius at different distances from RMC 136. In particular, we use the cumulative UV photon fluxes for the sample that includes the Grand Total of stars with spectroscopic classification from their Table 9. We derive the Strömgren radius as , where (for typical ISM electron temperatures of K) and is the UV photon flux per second, in the simplifying assumption that the gas is mostly hydrogen.
Accounting for only the stars within 5 pc from the cluster centre, the integrated UV photon flux in Doran et al. is . The Strömgren radius decreases with the plasma density as . Thus, for two orders of magnitudes of plasma densities in the ISM and in star-forming regions, and , varies between 56 and pc, respectively. The UV photon flux in the 30 Dor region doubles if stars at larger distances from the cluster centre are taken into account (up to a projected distance of 150 pc). For a total of , varies from about 15 pc (for densities of ) to 68 pc (for densities of ). RMC 143 has a projected distance of about 32 pc from RMC 136. Although we are considering projected distances, it seems plausible that RMC 143’s nebula is ionized by an external ionizing source.
In addition, Doran et al. (2013) estimate that about 6% of the ionizing photons escape the region, although with large uncertainty. This implies that all hydrogen inside the region is in ionization equilibrium, including plausibly RMC 143’s circumstellar nebula. A similar scenario (”inverted” photoionization; Schuster et al. 2009) was outlined to explain the asymmetric HII region associated with the Red Supergiant NML Cyg (Habing et al. 1982; Morris & Jura 1983; Schuster et al. 2006). This phenomenon is also found in the YHGs and RSGs of the Westerlund 1 cluster in our Galaxy (Dougherty et al. 2010; Fenech et al. 2018; Andrews et al. 2018).
11 Summary and conclusions
We report the discovery of a massive dusty component in the nebula around LBV RMC 143, through resolved sub-mm observations performed with ALMA. The dust mass inferred from the available space telescope IR photometry and from the ALMA Band 7 observations is assuming , a distance of , and an average dust temperature of . The representative dust temperature is derived from a modified grey-body that best fits the MIPS24, PACS100, PACS160, and ALMA 850 photometry (integrated over the entire nebula). An additional mid-IR excess is seen in the broad-band AKARI S11 and L15 photometry, which could be due to a combination of emission lines from the ionized gas, silicate, and PAH emission bands.
We compare the ALMA dust detection with the Spitzer and the H HST images, and with the 5.5, 9, and 17 GHz ATCA maps. The morphological comparison and the extinction map suggest that the dust is distributed in a photo-dissociation region partially surrounding the ionized nebula.
The historical light curve of RMC 143 and the past literature show that the previous LBV classification was likely the result of a mis-identification with another star. However, despite the possible lack of evidence of S Doradus cycles, the massive circumstellar nebula and the stellar parameters support the LBV classification. RMC 143 is at the lower luminosity end of LBVs (log), with an effective temperature in 2015 of . The star may be in outburst phase for the last three decades, which would also explain the relatively high mass-loss rate of yr-1. The stellar wind is enhanced in He and N, and depleted in H, C, and O, confirming the evolved nature of the star. RMC 143 is currently not hot enough to ionize its circumstellar nebula. While the star may have been hotter in the past, the nebula could be kept in ionization equilibrium by the UV photons escaping the 30 Dor star-forming region.
The current stellar mass in our best-fit CMFGEN model is , which is very low compared to the total nebular mass of , derived assuming a gas-to-dust ratio of 100 and a dust mass value from the best-fit of the mid-IR to sub-mm data. This suggests that the star has already lost a large fraction of its initial mass, through past LBV eruptions or possibly binary interactions.
Because of its brightness across the electromagnetic spectrum, RMC 143 is ideal for detailed studies of its chemical and dust composition and kinematics of its circumstellar nebula. Future integral field unit spectroscopy and continuum high-resolution observations (e.g. with Gemini/GMOS-S, VLT/Muse, ALMA, ELT and the James Webb Space Telescope) will shed light on the formation of RMC 143’s massive circumstellar nebula.
Acknowledgements.
We thank the reviewer, Simon Clark, for their careful review of the manuscript and their constructive remarks. We wish to thank the staff at ALMA, ATCA and ESO who made these observations possible. We also thank Jorge Melnick for trying to find the photographic plates of his observations of RMC 143. CA acknowledges support from FONDECYT grant No. 3150463. Support to CA and GP was provided by the Ministry of Economy, Development, and Tourism’s Millennium Science Initiative through grant IC120009, awarded to The Millennium Institute of Astrophysics, MAS. This paper makes use of the following ALMA data: ADS/JAO.ALMA#2013.1.00450.S. ALMA is a partnership of ESO (representing its member states), NSF (USA) and NINS (Japan), together with NRC (Canada) and NSC and ASIAA (Taiwan) and KASI (Republic of Korea), in cooperation with the Republic of Chile. The Joint ALMA Observatory is operated by ESO, AUI/NRAO and NAOJ. This paper also includes data collected: at the European Organisation for Astronomical Research in the Southern Hemisphere under ESO programme 096.D-0047(A); at the Australia Telescope Compact Array, which is part of the Australia Telescope National Facility which is funded by the Australian Government for operation as a National Facility managed by CSIRO. This work made use of PyAstronomy. This research has made use of the: International Variable Star Index (VSX) database, operated at AAVSO, Cambridge, Massachusetts, USA; VizieR catalogue access tool, CDS, Strasbourg, France. The original description of the VizieR service was published in A&AS 143, 23.References
- Aadland et al. (2018) Aadland, E., Massey, P., Neugent, K. F., & Drout, M. R. 2018, AJ, 156, 294
- Aghakhanloo et al. (2017) Aghakhanloo, M., Murphy, J. W., Smith, N., & Hložek, R. 2017, MNRAS, 472, 591
- Agliozzo et al. (2017a) Agliozzo, C., Nikutta, R., Pignata, G., et al. 2017a, MNRAS, 466, 213
- Agliozzo et al. (2014) Agliozzo, C., Noriega-Crespo, A., Umana, G., et al. 2014, MNRAS, 440, 1391
- Agliozzo et al. (2017b) Agliozzo, C., Trigilio, C., Pignata, G., et al. 2017b, ApJ, 841, 130
- Agliozzo et al. (2012) Agliozzo, C., Umana, G., Trigilio, C., et al. 2012, MNRAS, 426, 181
- Andrews et al. (2018) Andrews, H., Fenech, D., Prinja, R. K., Clark, J. S., & Hindson, L. 2018, MNRAS, 477, L55
- Backman & Paresce (1993) Backman, D. E. & Paresce, F. 1993, in Protostars and Planets III, ed. E. H. Levy & J. I. Lunine, 1253–1304
- Beasor & Davies (2018) Beasor, E. R. & Davies, B. 2018, MNRAS, 475, 55
- Boffin et al. (2016) Boffin, H. M. J., Rivinius, T., Mérand, A., et al. 2016, A&A, 593, A90
- Boian & Groh (2018) Boian, I. & Groh, J. H. 2018, A&A, 617, A115
- Buemi et al. (2017) Buemi, C. S., Trigilio, C., Leto, P., et al. 2017, MNRAS, 465, 4147
- Buemi et al. (2010) Buemi, C. S., Umana, G., Trigilio, C., Leto, P., & Hora, J. L. 2010, ApJ, 721, 1404
- Cannon (1936) Cannon, A. J. 1936, Annals of Harvard College Observatory, 100, 205
- Clark et al. (2012) Clark, J. S., Castro, N., Garcia, M., et al. 2012, A&A, 541, A146
- Clark et al. (2009) Clark, J. S., Crowther, P. A., Larionov, V. M., et al. 2009, A&A, 507, 1555
- Clark et al. (2003) Clark, J. S., Egan, M. P., Crowther, P. A., et al. 2003, A&A, 412, 185
- Clark et al. (2005) Clark, J. S., Larionov, V. M., & Arkharov, A. 2005, A&A, 435, 239
- Clayton & Martin (1985) Clayton, G. C. & Martin, P. G. 1985, ApJ, 288, 558
- Compiègne et al. (2010) Compiègne, M., Flagey, N., Noriega-Crespo, A., et al. 2010, ApJ, 724, L44
- Conti (1984) Conti, P. S. 1984, in IAU Symposium, Vol. 105, Observational Tests of the Stellar Evolution Theory, ed. A. Maeder & A. Renzini, 233
- Conti (1997) Conti, P. S. 1997, in Astronomical Society of the Pacific Conference Series, Vol. 120, Luminous Blue Variables: Massive Stars in Transition, ed. A. Nota & H. Lamers, 387
- Crowther (2007) Crowther, P. A. 2007, ARA&A, 45, 177
- Cutri et al. (2003) Cutri, R. M., Skrutskie, M. F., van Dyk, S., et al. 2003, VizieR Online Data Catalog, 2246
- Cutri et al. (2012) Cutri, R. M., Skrutskie, M. F., van Dyk, S., et al. 2012, VizieR Online Data Catalog, 2281
- Davidson & Humphreys (1997) Davidson, K. & Humphreys, R. M. 1997, ARA&A, 35, 1
- Davidson & Humphreys (2012) Davidson, K. & Humphreys, R. M., eds. 2012, Astrophysics and Space Science Library, Vol. 384, Eta Carinae and the Supernova Impostors
- de Groot (1988) de Groot, M. 1988, Irish Astronomical Journal, 18, 163
- Doran et al. (2013) Doran, E. I., Crowther, P. A., de Koter, A., et al. 2013, A&A, 558, A134
- Dougherty et al. (2010) Dougherty, S. M., Clark, J. S., Negueruela, I., Johnson, T., & Chapman, J. M. 2010, A&A, 511, A58
- Draine & Li (2007) Draine, B. T. & Li, A. 2007, ApJ, 657, 810
- Egan et al. (2002) Egan, M. P., Clark, J. S., Mizuno, D. R., et al. 2002, ApJ, 572, 288
- Evans et al. (2011) Evans, C. J., Taylor, W. D., Hénault-Brunet, V., et al. 2011, A&A, 530, A108
- Feast (1961) Feast, M. W. 1961, MNRAS, 122, 1
- Fenech et al. (2018) Fenech, D. M., Clark, J. S., Prinja, R. K., et al. 2018, A&A, 617, A137
- Figer et al. (1999) Figer, D. F., Morris, M., Geballe, T. R., et al. 1999, ApJ, 525, 759
- Fitzpatrick (1999) Fitzpatrick, E. L. 1999, PASP, 111, 63
- Flagey et al. (2014) Flagey, N., Noriega-Crespo, A., Petric, A., & Geballe, T. R. 2014, AJ, 148, 34
- Gaia Collaboration et al. (2016) Gaia Collaboration, Prusti, T., de Bruijne, J. H. J., et al. 2016, A&A, 595, A1
- Gal-Yam & Leonard (2009) Gal-Yam, A. & Leonard, D. C. 2009, Nature, 458, 865
- Gallagher (1989) Gallagher, J. S. 1989, in Astrophysics and Space Science Library, Vol. 157, IAU Colloq. 113: Physics of Luminous Blue Variables, ed. K. Davidson, A. F. J. Moffat, & H. J. G. L. M. Lamers, 185–192
- Georgiev et al. (2011) Georgiev, L., Koenigsberger, G., Hillier, D. J., et al. 2011, AJ, 142, 191
- Groh (2011) Groh, J. H. 2011, in Journal of Physics Conference Series, Vol. 328, Journal of Physics Conference Series, 012020
- Groh (2014) Groh, J. H. 2014, A&A, 572, L11
- Groh et al. (2006) Groh, J. H., Hillier, D. J., & Damineli, A. 2006, ApJ, 638, L33
- Groh et al. (2011) Groh, J. H., Hillier, D. J., & Damineli, A. 2011, ApJ, 736, 46
- Groh et al. (2009) Groh, J. H., Hillier, D. J., Damineli, A., et al. 2009, ApJ, 698, 1698
- Groh et al. (2013) Groh, J. H., Meynet, G., & Ekström, S. 2013, A&A, 550, L7
- Groh et al. (2014) Groh, J. H., Meynet, G., Ekström, S., & Georgy, C. 2014, A&A, 564, A30
- Groh & Vink (2011) Groh, J. H. & Vink, J. S. 2011, A&A, 531, L10
- Guha Niyogi et al. (2014) Guha Niyogi, S., Min, M., Meixner, M., et al. 2014, A&A, 569, A80
- Guzik & Lovekin (2014) Guzik, J. A. & Lovekin, C. C. 2014, arXiv e-prints [arXiv:1402.0257]
- Gvaramadze et al. (2010) Gvaramadze, V. V., Kniazev, A. Y., & Fabrika, S. 2010, MNRAS, 405, 1047
- Habing et al. (1982) Habing, H. J., Goss, W. M., & Winnberg, A. 1982, A&A, 108, 412
- Henden et al. (2015) Henden, A. A., Levine, S., Terrell, D., & Welch, D. L. 2015, in American Astronomical Society Meeting Abstracts #225, Vol. 225, 336.16
- Hillier et al. (2001) Hillier, D. J., Davidson, K., Ishibashi, K., & Gull, T. 2001, ApJ, 553, 837
- Hillier & Miller (1998) Hillier, D. J. & Miller, D. L. 1998, ApJ, 496, 407
- Humphreys & Davidson (1994) Humphreys, R. M. & Davidson, K. 1994, PASP, 106, 1025
- Humphreys et al. (2017) Humphreys, R. M., Gordon, M. S., Martin, J. C., Weis, K., & Hahn, D. 2017, ApJ, 836, 64
- Humphreys et al. (2016) Humphreys, R. M., Weis, K., Davidson, K., & Gordon, M. S. 2016, ApJ, 825, 64
- Hutsemekers (1997) Hutsemekers, D. 1997, in Astronomical Society of the Pacific Conference Series, Vol. 120, Luminous Blue Variables: Massive Stars in Transition, ed. A. Nota & H. Lamers, 316
- Hutsemékers et al. (2013) Hutsemékers, D., Cox, N. L. J., & Vamvatira-Nakou, C. 2013, A&A, 552, L6
- Hutsemekers & van Drom (1991) Hutsemekers, D. & van Drom, E. 1991, A&A, 248, 141
- Ita et al. (2008) Ita, Y., Onaka, T., Kato, D., et al. 2008, Publications of the Astronomical Society of Japan, 60, S435
- Jayasinghe et al. (2018) Jayasinghe, T., Kochanek, C. S., Stanek, K. Z., et al. 2018, MNRAS, 477, 3145
- Justham et al. (2014) Justham, S., Podsiadlowski, P., & Vink, J. S. 2014, ApJ, 796, 121
- Kashi (2010) Kashi, A. 2010, in American Institute of Physics Conference Series, Vol. 1314, American Institute of Physics Conference Series, ed. V. Kalogera & M. van der Sluys, 55–56
- Kashi & Soker (2010) Kashi, A. & Soker, N. 2010, ApJ, 723, 602
- Kato et al. (2012) Kato, D., Ita, Y., Onaka, T., et al. 2012, AJ, 144, 179
- Kochanek (2011) Kochanek, C. S. 2011, ApJ, 743, 73
- Kochanek et al. (2017) Kochanek, C. S., Shappee, B. J., Stanek, K. Z., et al. 2017, PASP, 129, 104502
- Kotak & Vink (2006) Kotak, R. & Vink, J. S. 2006, A&A, 460, L5
- Kunder et al. (2017) Kunder, A., Kordopatis, G., Steinmetz, M., et al. 2017, AJ, 153, 75
- Lagadec et al. (2011) Lagadec, E., Zijlstra, A. A., Oudmaijer, R. D., et al. 2011, A&A, 534, L10
- Lamers & de Groot (1992) Lamers, H. J. G. L. M. & de Groot, M. J. H. 1992, A&A, 257, 153
- Lamers et al. (1998) Lamers, H. J. G. L. M., Zickgraf, F.-J., de Winter, D., Houziaux, L., & Zorec, J. 1998, A&A, 340, 117
- Lang et al. (1999) Lang, C. C., Figer, D. F., Goss, W. M., & Morris, M. 1999, AJ, 118, 2327
- Langer et al. (1994) Langer, N., Hamann, W.-R., Lennon, M., et al. 1994, A&A, 290, 819
- Lau et al. (2014) Lau, R. M., Herter, T. L., Morris, M. R., & Adams, J. D. 2014, ApJ, 785, 120
- Leitherer et al. (1995) Leitherer, C., Chapman, J. M., & Koribalski, B. 1995, ApJ, 450, 289
- Makovoz & Marleau (2005) Makovoz, D. & Marleau, F. R. 2005, PASP, 117, 1113
- Martins (2011) Martins, F. 2011, Bulletin de la Societe Royale des Sciences de Liege, 80, 29
- McGregor et al. (1988a) McGregor, P. J., Finlayson, K., Hyland, A. R., et al. 1988a, ApJ, 329, 874
- McGregor et al. (1988b) McGregor, P. J., Hillier, D. J., & Hyland, A. R. 1988b, ApJ, 334, 639
- Mehner et al. (2017) Mehner, A., Baade, D., Groh, J. H., et al. 2017, A&A, 608, A124
- Meixner et al. (2006) Meixner, M., Gordon, K. D., Indebetouw, R., et al. 2006, AJ, 132, 2268
- Meixner et al. (2013) Meixner, M., Panuzzo, P., Roman-Duval, J., et al. 2013, AJ, 146, 62
- Melnick (1985) Melnick, J. 1985, A&A, 153, 235
- Mitchell & Robinson (1986) Mitchell, R. M. & Robinson, G. 1986, MNRAS, 222, 347
- Morris & Jura (1983) Morris, M. & Jura, M. 1983, ApJ, 267, 179
- Morris et al. (2017) Morris, P. W., Gull, T. R., Hillier, D. J., et al. 2017, ApJ, 842, 79
- Morse et al. (1998) Morse, J. A., Davidson, K., Bally, J., et al. 1998, AJ, 116, 2443
- NASA/IPAC Infrared Science Archive et al. (2011) NASA/IPAC Infrared Science Archive, JPL, Caltech, & NASA. 2011, MOPEX: MOsaicker and Point source EXtractor, Astrophysics Source Code Library
- Nota & Lamers (1997) Nota, A. & Lamers, H., eds. 1997, Astronomical Society of the Pacific Conference Series, Vol. 120, Luminous Blue Variables: Massive Stars in Transition
- Nota et al. (1995) Nota, A., Livio, M., Clampin, M., & Schulte-Ladbeck, R. 1995, ApJ, 448, 788
- Nowak et al. (2014) Nowak, M., Flagey, N., Noriega-Crespo, A., et al. 2014, ApJ, 796, 116
- Ochsenbein et al. (2000) Ochsenbein, F., Bauer, P., & Marcout, J. 2000, A&AS, 143, 23
- Onaka et al. (2007) Onaka, T., Matsuhara, H., Wada, T., et al. 2007, PASJ, 59, S401
- Owocki (2015) Owocki, S. P. 2015, in Astrophysics and Space Science Library, Vol. 412, Very Massive Stars in the Local Universe, ed. J. S. Vink, 113
- Page et al. (2012) Page, M. J., Brindle, C., Talavera, A., et al. 2012, MNRAS, 426, 903
- Paladini et al. (2012) Paladini, R., Umana, G., Veneziani, M., et al. 2012, ApJ, 760, 149
- Panagia & Felli (1975) Panagia, N. & Felli, M. 1975, A&A, 39, 1
- Parker et al. (1993) Parker, J. W., Clayton, G. C., Winge, C., & Conti, P. S. 1993, ApJ, 409, 770
- Paron et al. (2012) Paron, S., Combi, J. A., Petriella, A., & Giacani, E. 2012, A&A, 543, A23
- Pojmanski (1997) Pojmanski, G. 1997, Acta Astron., 47, 467
- Portegies Zwart & van den Heuvel (2016) Portegies Zwart, S. F. & van den Heuvel, E. P. J. 2016, MNRAS, 456, 3401
- Pottasch (1984) Pottasch, S. R. 1984, S&T, 67, 527
- Richardson & Mehner (2018) Richardson, N. D. & Mehner, A. 2018, RNAAS, 2, 121
- Ritchie et al. (2009) Ritchie, B. W., Clark, J. S., Negueruela, I., & Najarro, F. 2009, A&A, 507, 1597
- Rizzo et al. (2008) Rizzo, J. R., Jiménez-Esteban, F. M., & Ortiz, E. 2008, ApJ, 681, 355
- Rizzo et al. (2014) Rizzo, J. R., Palau, A., Jiménez-Esteban, F., & Henkel, C. 2014, A&A, 564, A21
- Roman-Duval et al. (2014) Roman-Duval, J., Gordon, K. D., Meixner, M., et al. 2014, ApJ, 797, 86
- Schuster et al. (2006) Schuster, M. T., Humphreys, R. M., & Marengo, M. 2006, AJ, 131, 603
- Schuster et al. (2009) Schuster, M. T., Marengo, M., Hora, J. L., et al. 2009, ApJ, 699, 1423
- Scicluna et al. (2015) Scicluna, P., Siebenmorgen, R., Wesson, R., et al. 2015, A&A, 584, L10
- Skinner (1997) Skinner, C. J. 1997, in Astronomical Society of the Pacific Conference Series, Vol. 120, Luminous Blue Variables: Massive Stars in Transition, ed. A. Nota & H. Lamers, 322
- Smith et al. (1998) Smith, L. J., Nota, A., Pasquali, A., et al. 1998, ApJ, 503, 278
- Smith (2011) Smith, N. 2011, MNRAS, 415, 2020
- Smith (2013) Smith, N. 2013, MNRAS, 429, 2366
- Smith et al. (2008) Smith, N., Chornock, R., Li, W., et al. 2008, ApJ, 686, 467
- Smith & Frew (2011) Smith, N. & Frew, D. J. 2011, MNRAS, 415, 2009
- Smith et al. (2003) Smith, N., Gehrz, R. D., Hinz, P. M., et al. 2003, AJ, 125, 1458
- Smith et al. (2007) Smith, N., Li, W., Foley, R. J., et al. 2007, ApJ, 666, 1116
- Smith & Tombleson (2015a) Smith, N. & Tombleson, R. 2015a, MNRAS, 447, 598
- Smith & Tombleson (2015b) Smith, N. & Tombleson, R. 2015b, MNRAS, 447, 598
- Thackeray (1950) Thackeray, A. D. 1950, MNRAS, 110, 343
- Trundle et al. (2008) Trundle, C., Kotak, R., Vink, J. S., & Meikle, W. P. S. 2008, A&A, 483, L47
- Tuthill et al. (2008) Tuthill, P. G., Monnier, J. D., Lawrance, N., et al. 2008, ApJ, 675, 698
- Ueta et al. (2001) Ueta, T., Meixner, M., Dayal, A., et al. 2001, ApJ, 548, 1020
- Umana et al. (2009) Umana, G., Buemi, C. S., Trigilio, C., et al. 2009, ApJ, 694, 697
- Umana et al. (2005) Umana, G., Buemi, C. S., Trigilio, C., & Leto, P. 2005, A&A, 437, L1
- Umana et al. (2011a) Umana, G., Buemi, C. S., Trigilio, C., et al. 2011a, ApJ, 739, L11
- Umana et al. (2010) Umana, G., Buemi, C. S., Trigilio, C., Leto, P., & Hora, J. L. 2010, ApJ, 718, 1036
- Umana et al. (2011b) Umana, G., Buemi, C. S., Trigilio, C., et al. 2011b, Bulletin de la Societe Royale des Sciences de Liege, 80, 335
- Umana et al. (2012) Umana, G., Ingallinera, A., Trigilio, C., et al. 2012, MNRAS, 427, 2975
- Urban et al. (1998) Urban, S. E., Corbin, T. E., Wycoff, G. L., et al. 1998, AJ, 115, 1212
- Vamvatira-Nakou et al. (2015) Vamvatira-Nakou, C., Hutsemékers, D., Royer, P., et al. 2015, A&A, 578, A108
- Vamvatira-Nakou et al. (2013) Vamvatira-Nakou, C., Hutsemékers, D., Royer, P., et al. 2013, A&A, 557, A20
- van Genderen (2001) van Genderen, A. M. 2001, A&A, 366, 508
- Vernet et al. (2011) Vernet, J., Dekker, H., D’Odorico, S., et al. 2011, A&A, 536, A105
- Vink & de Koter (2002) Vink, J. S. & de Koter, A. 2002, A&A, 393, 543
- Wachter et al. (2011) Wachter, S., Mauerhan, J., van Dyk, S., Hoard, D. W., & Morris, P. 2011, Bulletin de la Societe Royale des Sciences de Liege, 80, 291
- Walborn & Blades (1997) Walborn, N. R. & Blades, J. C. 1997, ApJS, 112, 457
- Walborn et al. (2017) Walborn, N. R., Gamen, R. C., Morrell, N. I., et al. 2017, AJ, 154, 15
- Weis (2003) Weis, K. 2003, A&A, 408, 205
- Wolf (1989) Wolf, B. 1989, A&A, 217, 87