Ionising the Intergalactic Medium by Star Clusters: The first empirical evidence
Abstract
We present a VLT/X-Shooter spectroscopy of the Lyman continuum (LyC) emitting galaxy Ion2 at z=3.2121 and compare it to that of the recently discovered strongly lensed LyCemitter at z=2.37, known as the Sunburst arc. Three main results emerge from the X-Shooter spectrum: (a) the Ly has three distinct peaks with the central one at the systemic redshift, indicating a ionised tunnel through which both Ly and LyC radiation escape; (b) the large O32 oxygen index ([O iii] / [Oii]) of is compatible to those measured in local (z ) LyC leakers; (c) there are narrow nebular high-ionisation metal lines with km s-1, which confirms the presence of young hot, massive stars. The Heii appears broad, consistent with a young stellar component including WolfRayet stars. Similarly, the Sunburst LyCemitter shows a triplepeaked Ly profile and from VLT/MUSE spectroscopy the presence of spectral features arising from young hot and massive stars. The strong lensing magnification, (), suggests that this exceptional object is a gravitationallybound star cluster observed at a cosmological distance, with a stellar mass M M⊙ and an effective radius smaller than pc. Intriguingly, sources like Sunburst but without lensing magnification might appear as Ion2like galaxies, in which unresolved massive star clusters dominate the ultraviolet emission. This work supports the idea that dense young star clusters can contribute to the ionisation of the IGM through holes created by stellar feedback.
keywords:
galaxies: formation – galaxies: starburst – gravitational lensing: strong1 Introduction
Recently, extensive surveys attempting to identify and study galaxies emitting Lyman continuum (LyC) radiation across a large range of cosmic time have yielded several low-redshift cases whose properties are believed to be representative of the galaxies at redshift that contributed the radiation that has re-ionised the Universe. Since the direct detection of ionising radiation from the epoch of re-ionisation (EoR) is not possible because of the cosmic opacity, the low-redshift “analogs” of the distant galaxies play a key role in understanding the mechanisms that allow the escape of ionising radiation from star-forming galaxies.
The census of LyC-galaxies is growing fast, both in the nearby Universe (Izotov et al., 2018, and references therein) and at high-redshitf, i.e. , (Vanzella et al., 2018, 2016b; de Barros et al., 2016; Shapley et al., 2016; Bian et al., 2017), and relevant progress has recently been made in a statistical sense by analysing dozens of high redshift galaxies with dedicated HST imaging (e.g., Fletcher et al., 2018; Japelj et al., 2017) and deep spectroscopy (e.g., Steidel et al., 2018; Marchi et al., 2018). In particular, a positive correlation among LyC escape and Ly equivalent width has been inferred, as well as an apparently higher fesc at fainter ultraviolet magnitudes, such that galaxies might account to more than 50% of the ionising budget at (Steidel et al., 2018). Spectral features like the profile of the escaping Ly line, the strength of the low-ionisation interstellar absorption lines tracing the covering fractions of neutral gas (e.g., [Cii], [Siii]) the line ratios tracing the ionisation or densitybounded conditions in the interstellar medium (like the O32 index, [O iii] / [Oii]), hold the promise to provide useful diagnostics of the mechanisms that govern the escape of ionising radiation, although we currently do not yet know which properties provide necessary and/or sufficient conditions for this to happen (e.g., Schaerer et al., 2016; Verhamme et al., 2017; Izotov et al., 2018; Jaskot & Oey, 2013; McKinney et al., 2019; Gazagnes et al., 2018; Chisholm et al., 2018; Reddy et al., 2016, 2018; Steidel et al., 2018; Grazian et al., 2017).
While the current growing samples serve as a reference for the identification of cosmic reionisers, the physical processes that made these galaxies transparent to LyC radiation are yet to be understood. The way ionised channels are carved in the interstellar medium is under continuous investigation, especially in the local Universe (Herenz et al., 2017; Micheva et al., 2017, 2019; Bik et al., 2018; Kehrig et al., 2018) where the detection of LyC radiation is instrumental to catch such episodes in the act (e.g., Heckman et al., 2011). It remains unclear what is the spatial distribution of the escaping ionising radiation, the porosity and the kinematics of the neutral gas, and the role the internal constituents of high-z LyCgalaxies (namely, the star-forming complexes, OB-associations, young massive clusters and massive stars) have in carving such ionised regions. In general, the small physical scales, likely of the order of a few ten pc and in which such constituents originate, are still unreachable at cosmological distances (e.g., a typical HST pixel of 30 milli-arcsecond subtends 250-300 pc at , encompassing one or more star-forming complexes). This limitation is even worse when ground-based seeing-limited spectroscopy is performed.
This work presents new VLT/X-Shooter spectroscopy of a LyCgalaxy dubbed Ion2 (Vanzella et al., 2016b), and VLT/MUSE observation of the recently discovered strongly lensed LyC emitter at z=2.37 (known as Sunburst arc, Dahle et al., 2016; Rivera-Thorsen et al., 2017, 2019). The similarity between the exceptional stronglylensed Sunburst and Ion2 sheds light on the possible “engine” behind the spatially unresolved high-z LyC leakers, like Ion2. We make use of archival VLT/MUSE and HST/ACS data targeting the Sunburst object with the aim to emphasise and explore this connection.
We assume a flat cosmology with = 0.3, = 0.7 and km s-1 Mpc-1.
2 The Lyman continuum galaxy Ion2
Ion2 is a well known LyC emitter at z=3.2121 lying in the CDFS showing an escape fraction higher than 50% (Vanzella et al., 2015, 2016b). Here we present new VLT/X-Shooter observations that improve (in terms of depth, spectral resolution and wavelength coverage) our previous analysis (de Barros et al., 2016).
2.1 X-Shooter observations
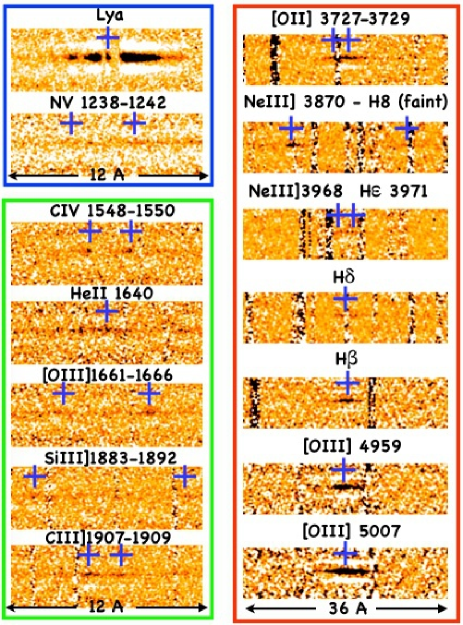
Ion2 was observed during November 2018 for a total integration time of 5 hours under optimal seeing conditions, typically arcsec. The slit widths were 1.0′′, 0.9′′, 0.9′′, corresponding to a spectral resolution of R=5400, 8900 and 5600 in the UVB, VIS and NIR arms, respectively (Prog. 0102.A-0391(A), P.I. Vanzella). Given the good seeing, the aforementioned resolution values must be considered as lower limits. The data reduction was carried on as described in several previous works (we refer the reader to Vanzella et al. 2016a, 2017b), in which the AB-BA sky subtraction scheme was implemented with single exposures of 915s, 946s and 900s on each of the three UVB, VIS and NIR arms, respectively. The target was dithered along the slit. The spectral range from the U to the K-band covers the rest-frame wavelengths which include the Ly and the optical lines [O iii]. The continuum is barely detected, from which a dozen of emission lines emerge with S/N ratio spanning the interval (see Figure 1 and Table 1). A careful analysis of the statistical significance of the spectral features is reported in the Appendix 9.
2.2 Results
The X-Shooter spectrum shows at least three features not observed with previous spectroscopy (de Barros et al., 2016): a multi-peaked Ly profile, the presence of narrow ultraviolet high ionisation lines and the new detection of [Oii] and H optical rest-frame lines. Below we summarise these new results.
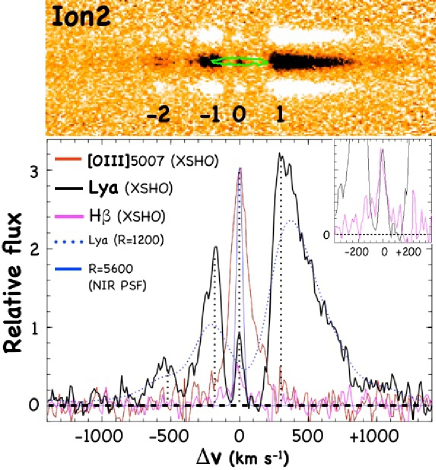
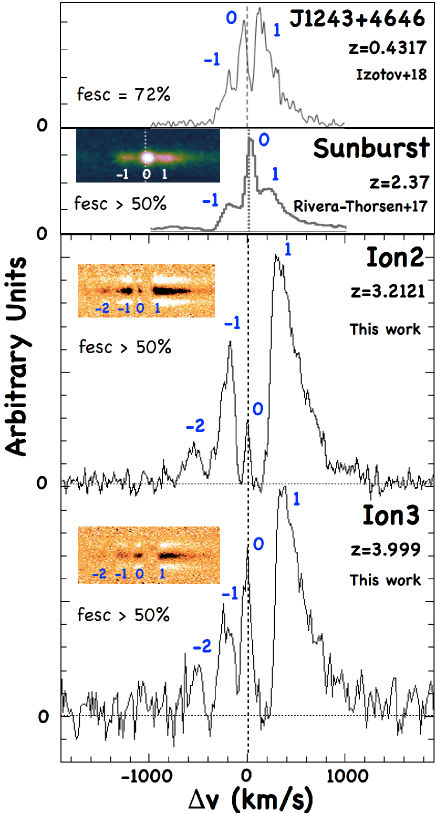
The Ly profile shows three peaks with the central one placed exactly at the systemic redshift (z=3.2121, see Figure 2), resembling the same Ly structure observed in another LyCgalaxy discovered at z=4.0 (dubbed Ion3, Vanzella et al., 2018). This is the fourth confirmed LyC emitter showing a Ly-peak emerging at the systemic velocity. The four objects are also characterised by a quite large escape fraction of ionising radiation, fesc > 50% (Vanzella et al. 2018; Rivera-Thorsen et al. 2019; Izotov et al. 2018). Figure 3 shows a comparison of the Ly shapes, and includes Ion2, Ion3, a high-surface density LyC emitter at z=0.4317 with a very large escape fraction (fesc %) from the Izotov et al. (2018) sample and Sunburst. In the LyC emitters shown in Figure 3 the positions of the peaks at the two sides of the central one are different, reflecting different kinematical features characterising each system. The same line shape has been investigated by Rivera-Thorsen et al. (2017) performing radiative transfer (RT) calculations in the framework of three different scenarios including the expanding shell models (Schaerer et al., 2011; Gronke et al., 2015): a density-bounded medium, picket fence medium and the presence of a ionised channel embedded in the Hi shell. Only the last case suitably reproduces the triple-peaked Ly profile: a significant amount of Hi gas with a perforated channel accounts for both the typical Ly broadening by frequency diffusion (peaks far from the resonance frequency, e.g., ‘-2,-1,+1’) and the superimposed Ly emission at zero velocity (peak ‘0’). Additionally, as discussed by Rivera-Thorsen et al. (2017), the profile of the non-scattered Ly photons escaping through an optically thin tunnel would resemble the width of the Balmer emission lines, that would represent a proxy of the intrinsic Ly shape before undergoing any RT effect. The brightest Balmer emission we have in the spectrum is the H line detected with S/N=6. Figure 2 superimposes the central Ly peak (‘0’) and the H, that show compatible widths (being both marginally resolved, see Table 1). This is fully in line with what was predicted by Behrens et al. (2014) (see their Figure 7). It is also worth stressing that the detection of the above narrow Ly features has been possible only thanks to the high spectral resolution () achievable with X-Shooter (see the case R=1200 in Figure 2), underlying the fact that the Ly line can be a powerful probe of optically thin media up to z=4 (and possibly up to z=6.5 in the case of transparent IGM, e.g., Matthee et al. 2018).
The Civ, Oiii], Heii and the Ciii] high-ionisation emission lines have been detected (see Figure 1 and Table 1), with the doublets being well separated. It is worth noting that all the nebular metal lines appear very narrow and possibly not resolved ( km s-1), whilst the Heii emission, despite a relatively low S/N, is clearly broader. To emphasise such a difference, Figure 4 shows the portion of the X-Shooter two-dimensional spectrum containing the Civ doublet, the Heii and Oiii] emission lines. The S/N of the Heii (3.5) is sufficient to appreciate its broadness, plausibly encompassing a velocity interval up to 500 km s-1, marked in Figure 4 with a segment (see also appendix 9 for more details). It is worth noting that in other cases the Heii emission is as narrow as the other high-ionisation metal lines (e.g., Vanzella et al., 2016a, 2017c) in which the nebular origin dominates or is better captured and other cases in which both nebular and broader stellar components are measured (Erb et al., 2010; Senchyna et al., 2017, 2019). In the case of Ion2 the relative contribution of nebular and stellar components is not measurable. However, the presence of a broad Heii emission profile suggests a spectrum dominated by a young stellar population containing hot Wolf-Rayet stars with main-sequence lifetimes less than 5 Myr (Chisholm et al., 2019).
Differently from the previous analysis based on a much shallower Keck/MOSFIRE spectrum in which the optical [Oii] and H lines were not detected (de Barros et al., 2016), here we measure a rest-frame equivalent width (EW) of EW(H) Å, O32 and [Oiii]/ H= (see Table 1). Such O32 value is in line with the necessary condition of having a large O32 index in LyC leakers (Jaskot & Oey, 2013; Izotov et al., 2018). It is worth noting that the rest-frame EW of [O iii] is 1300Å, not dissimilar from the strong oxygen emitters found at (e.g., Castellano et al., 2017; Roberts-Borsani et al., 2016). This also suggests a relatively large ionising photon production efficiency (), defined as the production rate of H-ionising photons per unit intrinsic monochromatic UV luminosity (, following Chevallard et al. 2018).111Note that the H line is not accessible and the H is detected at low S/N and affected by dust extinction and possibly damped by the LyC leakage.
While the Ly profile further confirms Ion2 to be a genuine LyC emitter, the detailed geometry of the LyC emission and the origin of the ionising radiation is still unknown (Vanzella et al., 2016b). Not surprisingly, if the ionised channel and/or the size of the source emitting LyC radiation (namely, the region including O-type stars) is confined within a few tens pc or less (see Sect. 3.3), the WFC3/F336W spatial resolution would be insufficient to resolve the source (1 pix pc). Any further detailed investigation in the rest-frame ultraviolet/optical bands would therefore be postponed to future studies with larger telescopes. Before the advent of EELT-like telescopes that will provide a spatial resolution lower than 10 mas (corresponding to 75 pc at the redshift of Ion2), the only way to address individual star-forming complexes of a few tens pc require strong gravitational lensing (e.g., Vanzella et al., 2019, 2017c; Cava et al., 2018; Rigby et al., 2017; Johnson et al., 2017). Even more valuable would be the identification of strongly lensed galaxies showing escaping LyC radiation emerging from some of their internal constituents. This happened recently with the discovery of the Sunbust arc and is the argument of the next section.
Before discussing it, it is worth stressing that the requirement of having the simultaneous alignment of the ionised channel, the observer, the presence of shot-lived O-type stars and the transparent IGM along the line of sight implies that the visibility of the LyC radiation from high redshift sources is affected by severe view-angle and l.o.s. effects (e.g., Trebitsch et al. 2017; Cen & Kimm 2015; Wise et al. 2014), not to mention the insidious foreground contamination mimicking false LyC radiation (e.g., Vanzella et al., 2010, 2012; Siana et al., 2015). Altogether, these effects make the detection of LyCgalaxies at high redshift still elusive and suggest that a significant fraction of them might be hidden by the aforementioned effects. Moreover, if we require that the source is also strongly magnified by an intervening gravitational lens, then the event would be extremely rare.222The lensing cross section for events with magnification exceeding the threshold decreases rapidly with the square of the magnification itself: . The identification of a few LyCgalaxies either in non lensed or lensed fields therefore makes the current detections extremely precious, especially if we focus on the spectral similarities among these uncorrelated objects.
3 Discussion
To shed more light on the nature of Ion2, key information might be extracted by comparing its X-Shooter spectrum to the strongly magnified LyC emitter at z=2.37, dubbed Sunburst arc (Dahle et al., 2016; Rivera-Thorsen et al., 2017, 2019). In this work we highlight the similarities between such systems arguing that what is observed in Sunburst is compatible with what is currently hidden by the limited spatial resolution.
3.1 The Sunburst arc
Sunburst is an exceptionally bright (R-band magnitude ) gravitationally lensed arc in which the galaxy cluster PSZ1-G311 produces a magnification of the order of or even larger (Dahle et al., 2016). Specifically, four multiple arcs are generated by the galaxy cluster, and in the most magnified ones additional amplification is generated by individual galaxy cluster members. One of the star-forming knots of the arcs has also been detected in the LyC (hereafter dubbed LyC-knot) with the unprecedented record of 12 multiple images (Rivera-Thorsen et al., 2019) with a measured magnitude in the interval F814W = [] and detected with S/N for the most magnified ones.333The magnitudes reported by Rivera-Thorsen et al. (2019) are about half a magnitude fainter than our estimates, while the magnitude contrast among the multiple images is fully consistent with their estimates. As shown in the appendix A this difference is mainly due to the small aperture they used ( diameter), motivated by the need to measure the ratio between the ionising and non-ionising fluxes of a non-spatially resolved source.
We present for the first time VLT/MUSE observations targeting the Sunburst and based on the DDT programme 297.A-5012(A) (PI. Aghanim). The data were acquired during May-August 2016 with seeing for a total integration of 1.2h (three exposures of 1483s each). The data reduction has been performed as described in Caminha et al. (2017, 2019), and we refer the reader to those works for details.
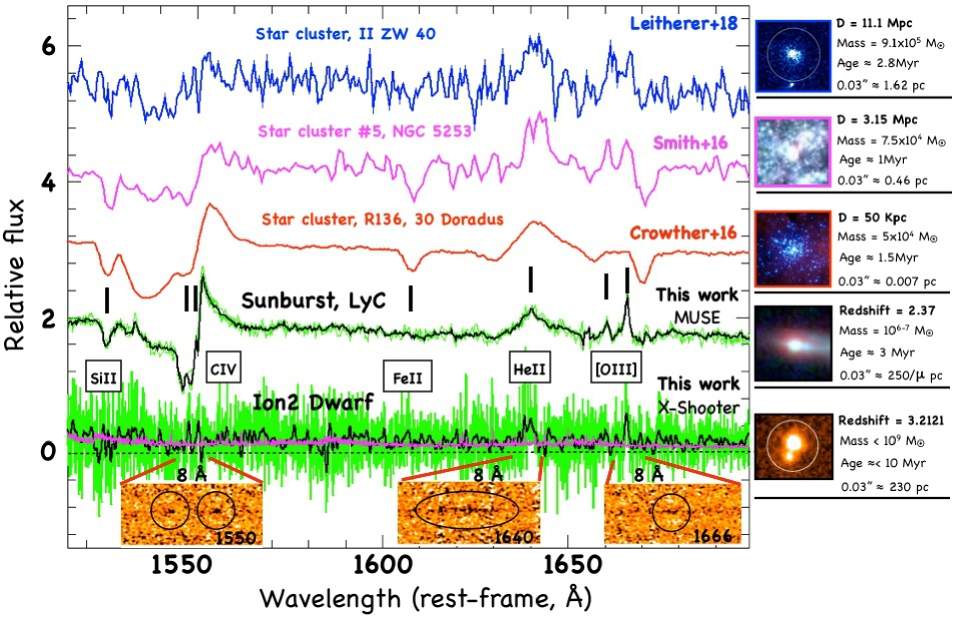
A stacked MUSE spectrum obtained from seven multiple images is presented in Figure 5. In the same figure, some high-quality spectra of local star clusters are shown for comparison (for further details, see the caption of Figure 5). The ultraviolet emission of the LyCknot resembles those of local super star clusters in which the signatures of massive stars are clearly imprinted in the spectrum, like the prominent P-Cygni profiles of the Civ doublet and a broad Heii ascribed to the presence of Wolf-Rayet stars. The similarity with the ultraviolet spectra of a few well studied local young massive clusters is remarkable, namely R136 (Crowther et al., 2016), II Z40 (Leitherer et al., 2018) and cluster #5 of NG5253 (Smith et al. 2016, see also Calzetti et al. 2015), as well as the analogy with the nearby star forming regions collected by Senchyna et al. (2017, 2019) and showing high ionisation metal lines and in some cases broad Heii emission of low metallicity massive stars. The same spectral features, though at slightly lower S/N ratios, have been identified and accurately modelled by Chisholm et al. (2019), providing a stellar age of Myr and subsolar stellar metallicity Z = Z⊙, with an inferred dust extinction E(B-V) 0.15.
While these are very precious quantities and independent from the lensing magnification, it is now natural to try addressing intrinsic quantities such as the stellar mass, the luminosity and the physical size of such LyC emitter. This will be the argument of the next section.
3.2 The Sunburst LyC-knot as a possible gravitationally bound system
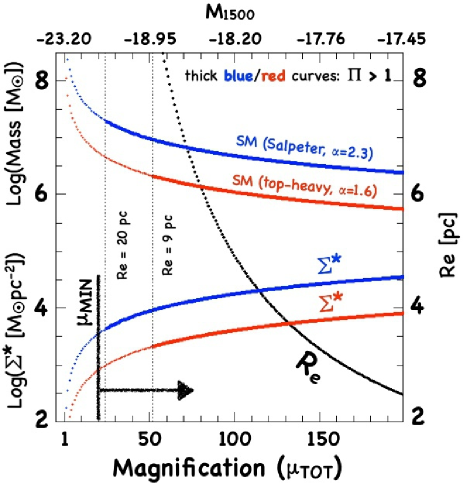
We express the most relevant physical quantities, namely the effective radius, the stellar mass, and the stellar mass surface density (), as a function of magnification , adopting pix, e.g., 60 mas along the tangential direction as derived by performing GALFIT fitting (see Appendix A and Figure 8). The stellar mass is estimated assuming an instantaneous burst with the aforementioned age of 3.0 Myr and sub-solar metallicity Z = 0.6 Z⊙, and adopting Starburst99 models (Leitherer et al., 2014) with a Salpeter initial stellar mass function (IMF, ), including stars with masses in the range [1-100] M⊙. Similarly, we derive the stellar mass using a top-heavy initial stellar mass function with a slope , following Jeřábková et al. (2017), with masses in the range [0.1-120] M⊙. The two IMFs should embrace two extreme cases with the aim to provide a lower and an upper limit to the stellar mass.
As shown in Figure 6, an effective radius () smaller than pc is found if , and it decreases below 9 pc if . The stellar mass ranges between M⊙ depending on the IMF and magnification, with a that enters the regime of the densest objects known (e.g., the globular clusters, e.g., Hopkins et al. 2010) or similar to the values of young massive star clusters (Bastian et al., 2006; Östlin et al., 2007; Bastian et al., 2013).
Combining with the age of 3.0 Myr, and the stellar mass, we can infer the dynamical age as Age/ Tcr (where Tcr is the crossing time: 10(/GM)0.5, Gieles & Portegies Zwart, 2011). Interestingly, as highlighted in Figure 6, the system enters the regime of a gravitationally bound object () if in the case of Salpeter(top-heavy) IMF. Such magnification values are within the expected magnification regime (e.g., Dahle et al., 2016). In particular, a minimum model-independent estimate of the magnification of 20 is derived and discussed in the appendix A, based on empirical geometrical constraints. Therefore, the LyCknot might be the first example of a gravitationally-bound star cluster discovered at cosmological distance.
3.3 Is also the LyCgalaxy Ion2 powered by star clusters?
The discovery of a very likely gravitationally bound star cluster at z=2.37 leaking LyC radiation is intriguing because it would imply that the contribution by such systems to the meta-galactic ionising background is substantial, if not dominant, depending on the UV luminosity function of such objects.
Observationally, Sunburstlike objects in which the LyC leakage emerges from a single massive star cluster of a few pc cannot be spatially resolved even in moderately lensed fields, e.g. . Compact SFclumps at high redshift, either spatially resolved or not, may be dominated by single young massive star clusters (e.g., Zanella et al., 2015; Johnson et al., 2017; Rigby et al., 2017).
Any seeing-limited spectrum would be the luminosity-weighted average of multiple unresolved starforming complexes, as for the case of Ion2 in which structures smaller than 200 pc cannot be resolved. However, the similitude among the spectral properties of Ion2 and Sunburst is intriguing and might offer new clues, beyond the limitation due to the spatial resolution. The ionised channels traced by the triplepeaked Ly profiles especially the narrow peak at systemic velocity of Ion2, Ion3 and Sunburst (including the local system of Izotov et al. 2018) might suggest a common origin related to the presence of young massive star clusters and/or dense star-forming regions. The HST imaging of Ion2 shows a quite nucleated morphology (the LyC emission is spatially unresolved, Vanzella et al., 2016b), as well as the triplepeaked Ly object of Izotov et al. (2018) that shows the highest star formation rate surface density ( M⊙ yr-1kpc-2) in their sample. Currently, the Sunburst LyC-knot seems to be the densest stellar LyC leaker with also emergent Ly at systemic velocity. In addition, the broad Heii emission observed in Ion2 (possibly with FWHM km s-1, see appendix B) and the well detected Nv P-Cygni profile of Ion3 (Vanzella et al., 2018) suggest a radiation leakage through one or more channels carved by massive stars promoted by their energetic feedback might be in place, as observed in the Sunburst.
4 Conluding remarks
In this paper we have presented new VLT/X-Shooter observations of the LyC emitting galaxy Ion2 and VLT/MUSE spectrum of a strongly lensed LyC emitter, dubbed Sunburst. The results can be summarised as follows:
-
•
Ion2: the spectral resolution and wavelength coverage provided by X-Shooter have improved the previous analysis presented in de Barros et al. (2016), including the detection of new spectral features. First, a multi-peaked Ly profile is evident from the new spectrum, showing a clear emission at the systemic redshift. Second, several high ionisation ultraviolet nebular narrow lines (FWHM 50 km s-1, including Civ, Oiii], Ciii]) have been detected for the first time, some of which with well separated doublets. Only the Heii is detected as a broad emission (FWHM 400 km s-1) and ascribed to the presence of Wolf-Rayet stars. Third, a large value for the O32 index of has been derived, together with the large equivalent width of 1300Å rest-frame of [O iii], as found in other LyC leakers (Jaskot & Oey, 2013; Izotov et al., 2018) and typical of systems with a large ionising photon production efficiency (e.g., Chevallard et al., 2018).
-
•
Sunburst: we inferred for the first time the stellar mass (a few M⊙), luminosity () and size ( pc) of the LyC-knot of the Sunburst arc, that coupled with the young age of 3 Myr (Chisholm et al., 2019) provides constraints on its dynamical age, suggesting that the LyC-knot is a gravitationallybound young massive stellar cluster at cosmological distance, whose ultraviolet spectrum is also fully comparable to those of local young clusters (Figure 5). In addition, as the Figure 6 shows, the stellar mass surface density is intriguingly large if the magnification factor exceeds 50, approaching the values observed in the densest objects, such as globular clusters and local young massive clusters (Hopkins et al., 2010; Bastian et al., 2006; Östlin et al., 2007; Bastian et al., 2013). Remarkably, Sunburst might also be considered a forming globular cluster, caught when the Universe was 2.7 Gyr old. This will be investigated in a future work.
The LyC-knot of the Sunburst arc might very well represent the Rosetta stone of stellar ionisation at high redshift and it is an unprecedented discovery in its own right for two reasons: (1) it is a unique laboratory where the escaping LyC from a high redshift stellar system can be investigated in detail and (2) without any lensing effect, the LyC-knot (the star cluster) would have appeared like a non-spatially resolved LyCemitter lying somewhere within its hosting galaxy, e.g., like Ion2.
Interesting enough, the star cluster formation efficiency, namely the star formation occurring in gravitationally bound star clusters, increases with redshift (e.g., Pfeffer et al., 2018), possibly reaching values higher than % at . This might suggest that star clusters could have played a significant role during reionisation (Ricotti, 2002; Ricotti et al., 2016), especially if the LyC leakage is more efficient for that population. The idea that such young massive star clusters (or a fraction of them) were also globular cluster precursors is currently matter of investigation (e.g., Vanzella et al. 2019; Renzini 2017; Pozzetti et al. 2019; Bouwens et al. 2017; Pfeffer et al. 2018; Elmegreen 2018; Kruijssen 2019; Reina-Campos et al. 2019; Calura et al. 2015, 2019; Li, & Gnedin 2019).
While the direct detection of LyC radiation at is challenging and requires that special conditions are realised in the source, with current sensitivity, the effect that the transverse LyC leakage has on the surrounding medium might be easily detectable. Objects like Ion2/Ion3 or Sunburst having transverse leakage of LyC radiation could induce spatially offset Ly or Balmer series fluorescence (e.g., Mas-Ribas et al., 2017). Spatially offset Ly emission/nebulae routinely detected with integral field spectrographs (like MUSE) might represent a viable tool to search for possible local escaping ionising radiation around star-forming galaxies (e.g., Vanzella et al., 2017a, c; Wisotzki et al., 2018; Gallego et al., 2018).
Finally, the prospects for future investigations of star-formation at very small scales down to single star clusters at cosmological distance appear very promising. In particular objects like Sunburst LyC-knot stretched by magnification factors larger than 30 will be probed down to FWHM(or pixel-scale) of 6(2) and 3(0.4) pc by VLT/MAVIS and ELT MAORY-MICADO, respectively. These two MCAOassisted444MCAO = Multi Conjugate Adaptive Optics. instruments will be also complementary in terms of wavelength coverage, probing the ultraviolet and optical rest-frame wavelengths. Integral field spectroscopy at VLT or ELT will also probe the spatial distribution of nebular high ionisation lines, as a signature of possible stellar mass segregation in star complexes and providing maps at pc scale opening for two-dimensional studies of feedback mechanisms and star formation processes (e.g., James et al., 2016), at cosmological distances.
| Line/ | Flux()(FWHM)(EW) | Redshift() |
|---|---|---|
| Ly(-2) 1215.7 | 1.68(8.0)(141)(5.7) | 3.2044(3) |
| Ly(-1) 1215.7 | 5.28(29.0)(146)(18.0) | 3.2096(1) |
| Ly(0) 1215.7 | 0.96(10.5)()(3.3) | 3.2121(2) |
| Ly(1) 1215.7 | 20.25(110)(298)(69.1) | 3.2164(1) |
| Ly(total) | 28.16()()(97.6) | |
| Nv | 0.12(1.0)()() | (3.2121)fixed |
| Nv | 0.12(1.0)()() | (3.2121)fixed |
| Civ | 0.28(5.2)(Narrow)(1.5) | (3.2121)fixed |
| Civ | 0.20(4.8)(Narrow)(1.1) | (3.2121)fixed |
| [Heii] | 0.45(5.0)(Broad)(2.8) | (3.2121)fixed |
| [Oiii] | 0.40(3.5)(Narrow)(2.5) | (3.2121)fixed |
| [Oiii] | 0.65(5.4)(Narrow)(4.2) | (3.2121)fixed |
| [Siiii] | 0.30(2.0)(Narrow)(2.4) | (3.2121)fixed |
| [Siiii] | 0.15(1.5)(Narrow)(1.2) | (3.2121)fixed |
| Ciii] | 0.44(6.7)(Narrow)(4.1) | 3.2127(5) |
| Ciii] | 0.35(4.9)(Narrow)(3.2) | (3.2121)fixed |
| [Oii] | 3.5(6.0)()(81) | 3.2122(3) |
| NeIII] | 1.8(4.0)()(45) | 3.2119(4) |
| NeIII] | 1.2(1.5)()(32) | (3.2121)fixed |
| H | 1.1(2.0)()(31) | (3.2121)fixed |
| H | 2.9(6.0)()(114) | 3.2120(3) |
| [Oiii] | 7.4(22.0)()(304) | 3.2121(2) |
| [Oiii] | 24.8(65.0)(146)(1040) | 3.2121(1) |
Acknowledgments
We thank the referees for providing detailed comments and suggestions about the reorganisation of the manuscript. We thank C. Leitherer, L. Smith and P. Crowther for providing the ultraviolet spectra of the star clusters shown in Figure 5. We thank A. Renzini, A. Adamo for stimulating discussions about the possible origin of the LyC-knot. EV also thank J. Chisholm and E. Rivera-Thorsen for stimulating discussions about the Sunburst system. EV thanks T. Jerabkova for fruitful interaction about the IMF used in this work. EV also thank M. Gronke for useful discussions about the Ly profile. AM acknowledges funding from the INAF PRIN-SKA 2017 programme 1.05.01.88.04. KC acknowledges funding from the European Research Council through the award of the Consolidator Grant ID 681627-BUILDUP. We also acknowledge funding from the INAF for “interventi aggiuntivi a sostegno della ricerca di main-stream dell’INAF”.
References
- Bastian et al. (2006) Bastian, N., Saglia, R. P., Goudfrooij, P., et al. 2006, A&A, 448, 881
- Bastian et al. (2013) Bastian, N., Schweizer, F., Goudfrooij, P., Larsen, S. S., & Kissler-Patig, M. 2013, MNRAS, 431, 1252
- Behrens et al. (2014) Behrens, C., Dijkstra, M., & Niemeyer, J. C. 2014, A&A, 563,77
- Bian et al. (2017) Bian, F., Fan, X., McGreer, I., Cai, Z., & Jiang, L. 2017, ApJ, 837, L12
- Bik et al. (2018) Bik, A., Östlin, G., Menacho, V., et al. 2018, A&A, 619, A131
- Bouwens et al. (2017) Bouwens, R. J., Illingworth, G. D., Oesch, P. A., et al. 2017, arXiv:1711.02090
- Calura et al. (2015) Calura, F., Few, C. G., Romano, D., & D’Ercole, A. 2015, ApJ, 814, L14
- Calura et al. (2019) Calura, F., D’Ercole, A., Vesperini, E., et al. 2019, arXiv e-prints, arXiv:1906.09137
- Calzetti et al. (2015) Calzetti, D., Johnson, K. E., Adamo, A., et al. 2015, ApJ, 811, 75
- Caminha et al. (2017) Caminha, G. B., Grillo, C., Rosati, P., et al. 2017, A&A, 600, A90
- Caminha et al. (2019) Caminha, G. B., Rosati, P., Grillo, C., et al. 2019, arXiv:1903.05103
- Cen & Kimm (2015) Cen, R., & Kimm, T. 2015, ApJ, 801, L25
- Castellano et al. (2017) Castellano, M., Pentericci, L., Fontana, A., et al. 2017, ApJ, 839, 73
- Cava et al. (2018) Cava, A., Schaerer, D., Richard, J., et al. 2018, Nature Astronomy, 2, 76
- Chevallard et al. (2018) Chevallard, J., Charlot, S., Senchyna, P., et al. 2018, MNRAS, 479, 3264
- Chisholm et al. (2018) Chisholm, J., Gazagnes, S., Schaerer, D., et al. 2018, A&A, 616, A30
- Chisholm et al. (2019) Chisholm, J., Rigby, J. R., Bayliss, M., et al. 2019, arXiv:1905.04314
- Crowther et al. (2016) Crowther, P. A., et al. 2016, MNRAS, 458, 624
- Dahle et al. (2016) Dahle, H., Aghanim, N., Guennou, L., et al. 2016, A&A, 590, L4
- de Barros et al. (2016) de Barros, S., et al. 2016, A&A, 585, A51
- Elmegreen (2018) Elmegreen, B. G. 2018, ApJ, 869, 119
- Erb et al. (2010) Erb, D. K., Pettini, M., Shapley, A. E., et al. 2010, ApJ, 719, 1168
- Fletcher et al. (2018) Fletcher, T. J., Robertson, B. E., Nakajima, K., et al. 2018, arXiv:1806.01741
- Gallego et al. (2018) Gallego, S. G., Cantalupo, S., Lilly, S., et al. 2018, MNRAS, 475, 3854
- Gazagnes et al. (2018) Gazagnes, S., Chisholm, J., Schaerer, D., et al. 2018, A&A, 616, A29
- Gieles & Portegies Zwart (2011) Gieles, M., & Portegies Zwart, S. F. 2011, MNRAS, 410, L6
- Grazian et al. (2017) Grazian, A., Giallongo, E., Paris, D., et al. 2017, A&A, 602, A18
- Gronke et al. (2015) Gronke, M., Bull, P., & Dijkstra, M. 2015, ApJ, 812, 123
- Heckman et al. (2011) Heckman, T. M., et al. 2011, ApJ, 730, 5.
- Herenz et al. (2017) Herenz, E. C., Hayes, M., Papaderos, P., et al. 2017, A&A, 606, L11
- Hopkins et al. (2010) Hopkins, P. F., Murray, N., Quataert, E., & Thompson, T. A. 2010, MNRAS, 401, L19
- Li, & Gnedin (2019) Li, H., & Gnedin, O. Y. 2019, MNRAS, 486, 4030
- Izotov et al. (2018) Izotov, Y. I., Worseck, G., Schaerer, D., et al. 2018, MNRAS, 478, 4851
- James et al. (2016) James, B. L., Auger, M., Aloisi, A., Calzetti, D., & Kewley, L. 2016, ApJ, 816, 40
- Japelj et al. (2017) Japelj, J., Vanzella, E., Fontanot, F., et al. 2017, MNRAS, 468, 389
- Jaskot & Oey (2013) Jaskot, A. E., & Oey, M. S. 2013, ApJ, 766, 91
- Jeřábková et al. (2017) Jeřábková, T., Kroupa, P., Dabringhausen, J., Hilker, M., & Bekki, K. 2017, A&A, 608, A53
- Johnson et al. (2017) Johnson, T. L., Rigby, J. R., Sharon, K., et al. 2017, ApJ, 843, L21
- Kehrig et al. (2018) Kehrig, C., Vílchez, J. M., Guerrero, M. A., et al. 2018, MNRAS, 480, 1081
- Kneib & Natarajan (2011) Kneib, J.-P., & Natarajan, P. 2011, A&ARv, 19, 47
- Kruijssen (2019) Kruijssen, J. M. D. 2019, MNRAS, 486, L20
- Leitherer et al. (2014) Leitherer, C., Ekström, S., Meynet, G., et al. 2014, ApJS, 212, 14
- Leitherer et al. (2018) Leitherer, C., Byler, N., Lee, J. C., & Levesque, E. M. 2018, ApJ, 865, 55
- Marchi et al. (2018) Marchi, F., Pentericci, L., Guaita, L., et al. 2018, A&A, 614, A11
- Mas-Ribas et al. (2017) Mas-Ribas, L., Hennawi, J. F., Dijkstra, M., et al. 2017, ApJ, 846, 11
- Matthee et al. (2018) Matthee, J., Sobral, D., Gronke, M., et al. 2018, A&A, 619, A136
- McKinney et al. (2019) McKinney, J. H., Jaskot, A. E., Oey, M. S., et al. 2019, arXiv:1902.08204
- Micheva et al. (2017) Micheva, G., Oey, M. S., Jaskot, A. E., & James, B. L. 2017, ApJ, 845, 165
- Micheva et al. (2019) Micheva, G., Herenz, E. C., Roth, M. M., Östlin, G., & Girichidis, P. 2019, arXiv:1902.03952
- Östlin et al. (2007) Östlin, G., Cumming, R. J., & Bergvall, N. 2007, A&A, 461, 471
- Pfeffer et al. (2018) Pfeffer, J., Kruijssen, J. M. D., Crain, R. A., & Bastian, N. 2018, MNRAS, 475, 4309
- Pozzetti et al. (2019) Pozzetti, L., Maraston, C., & Renzini, A. 2019, MNRAS,
- Reddy et al. (2016) Reddy, N. A., Steidel, C. C., Pettini, M., et al. 2016, ApJ, 828, 107
- Reddy et al. (2018) Reddy, N. A., Shapley, A. E., Sanders, R. L., et al. 2018, ApJ, 869, 92
- Reina-Campos et al. (2019) Reina-Campos, M., Kruijssen, J. M. D., Pfeffer, J. L., et al. 2019, MNRAS, 486, 5838
- Renzini (2017) Renzini, A. 2017, MNRAS, 469, L63
- Ricotti (2002) Ricotti, M. 2002, MNRAS, 336, L33
- Ricotti et al. (2016) Ricotti, M., Parry, O. H., & Gnedin, N. Y. 2016, ApJ, 831, 204
- Rigby et al. (2017) Rigby, J. R., Johnson, T. L., Sharon, K., et al. 2017, ApJ, 843, 79
- Rivera-Thorsen et al. (2017) Rivera-Thorsen, T. E., et al. 2017, arXiv:1710.09482
- Rivera-Thorsen et al. (2019) Rivera-Thorsen, T. E., Dahle, H., Chisholm, J., et al. 2019, arXiv:1904.08186
- Roberts-Borsani et al. (2016) Roberts-Borsani, G. W., Bouwens, R. J., Oesch, P. A., et al. 2016, ApJ, 823, 143
- Schaerer et al. (2011) Schaerer, D., Hayes, M., Verhamme, A., & Teyssier, R. 2011, A&A, 531, A12
- Schaerer et al. (2016) Schaerer, D., Izotov, Y. I., Verhamme, A., et al. 2016,A&A, 591,8
- Senchyna et al. (2017) Senchyna, P., Stark, D. P., Vidal-García, A., et al. 2017, MNRAS, 472, 2608
- Senchyna et al. (2019) Senchyna, P., Stark, D. P., Chevallard, J., et al. 2019, arXiv:1904.01615
- Shapley et al. (2016) Shapley, A., Steidel, C. C., Strom, A. L., et al. 2016, ApJ, 826,24
- Siana et al. (2015) Siana, B., et al. 2015, ApJ, 804, 17.
- Smith et al. (2016) Smith, L. J., Crowther, P. A., Calzetti, D., & Sidoli, F. 2016, ApJ, 823, 38
- Steidel et al. (2018) Steidel, C. C., Bogosavljević, M., Shapley, A. E., et al. 2018, ApJ, 869, 123
- Trebitsch et al. (2017) Trebitsch, M., Blaizot, J., Rosdahl, J., Devriendt, J., & Slyz, A. 2017, MNRAS, 470, 224
- Vanzella et al. (2010) Vanzella, E., Siana, B., Cristiani, S., & Nonino, M. 2010, MNRAS, 404, 1672
- Vanzella et al. (2012) Vanzella, E., et al. 2012, ApJ, 751, 70
- Vanzella et al. (2015) Vanzella, E., et al. 2015, A&A, 576, A116
- Vanzella et al. (2016b) Vanzella, E., et al. 2016b, ApJ, 825, 41
- Vanzella et al. (2016a) Vanzella, E., De Barros, S., Cupani, G., et al. 2016a, ApJ, 821, L27
- Vanzella et al. (2017b) Vanzella, E., et al. 2017b, MNRAS, 467, 4304
- Vanzella et al. (2017c) Vanzella, E., et al. 2017c, ApJ, 842, 47
- Vanzella et al. (2017a) Vanzella, E., et al. 2017a, MNRAS, 465, 3803
- Vanzella et al. (2018) Vanzella, E., et al. 2018, MNRAS, 476, L15
- Vanzella et al. (2019) Vanzella, E., et al. 2019, MNRAS, 483, 3618
- Verhamme et al. (2017) Verhamme, A., Orlitová, I., Schaerer, D., et al. 2017, A&A, 597,13
- Wise et al. (2014) Wise, J. H., Demchenko, V. G., Halicek, M. T., et al. 2014, MNRAS, 442, 2560
- Wisotzki et al. (2018) Wisotzki, L., Bacon, R., Brinchmann, J., et al. 2018, Nature, 562, 229
- Zanella et al. (2015) Zanella, A., Daddi, E., Le Floc’h, E., et al. 2015, Nature, 521, 54
Appendix A An empirical minimum magnification for the Sunburst LyC-knot
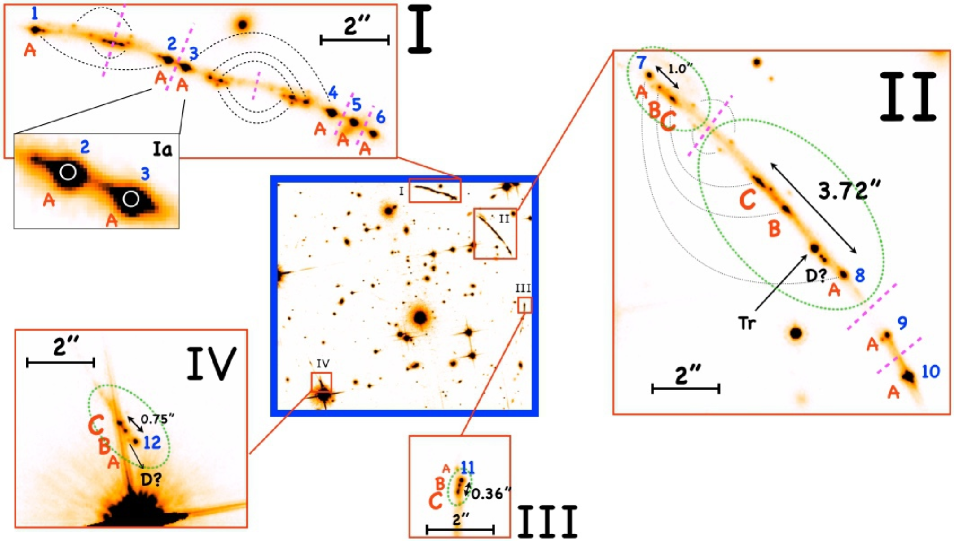
The sub-structures and star-forming knots present in the Sunburst arcs allow us to set empirical constraints on the minimum (average) magnification among the recognised multiple patterns. Figure 7 shows the four arcs labeled I, II, II and IV, within which 12 multiple images of the LyC-knot (indicated with ‘A’) have been discovered by Rivera-Thorsen et al. (2019) and are marked with increasing numbers 1-12. In particular the least magnified arcs provide the less distorted version of the high-z SF complex. Starting from the smallest arc III the knots A, B, C are identified in the counter arc IV, with the inverse order (mirroring) of the SF knots as expected in strongly lensed multiple images. In this case the identification is further facilitated by the fact that the knot A has the distinctive LyC feature and the image C is the most elongated among the three objects. Such features must follow the aforementiond flipped behaviour, accordingly to the parity of the images introduced by the strong lensing (Kneib & Natarajan, 2011). Other two triplets A, B, C appear in the arc II where the mirrored groups are circled with green dotted ellipses. The triplet separated by is 10 times more elongated than the triplet in the arc III, that means the average tangential magnification for the widest arc is larger than 10, being the magnification of arc III larger than 1.
The situation of arc I is different because not all images (A,B,C) are present, i.e. only a part of the source is multiply lensed in this merging arc. However, six multiple images of knot A (the LyC emitter) are clearly identified (images 1-6 of Figure 7). The proximity of some of the images to the critical lines, like images 2 and 3, suggest the magnification is large (see, e.g., Figure 4 of Rivera-Thorsen et al., 2019). In particular the measured flux ratio between images 2 (or equivalently 3) and 8 is (Rivera-Thorsen et al., 2019), suggesting images 2,3 have a minimum magnification of (). This happens for the brightest image 10, that is 2.2 times brighter than image 8. Until this point we did not invoke any lens model. The true magnification is higher since we are assuming arc IV is not magnified (). However, arc IV is subjected by strong lensing as well (being one of the multiple images of the system) and its magnification is certainly higher than 1. For example, assuming a magnification 2 for arc IV, following the aforementioned considerations the magnification for images 2,3 jumps to values of 40. This provides an average magnification, and as discussed above the proximity to the critical lines suggests the lensing amplification at the position of, e.g., images 2-3, could be be much higher, even above 50 as discussed by Dahle et al. (2016). A careful modelling of the lens, including the aforementioned empirical constraints, will shed more light on this.
However, the minimum magnification of 20 derived above is already relevant in our study, implying an effective radius smaller than 20 pc and a stellar mass in the range M⊙, depending on the IMF (see Figure 6), with the system entering the range of massive, gravitationally-bound, star clusters in the case of Salpeter IMF.
It is worth noting the presence of a bright and point-like object with F814W = 22.02 and at the same redshift of the Sunburst (marked with ‘Tr’ and an arrow in Figure 7). Such an object is presumably a transient for two reasons: (1) it is not identified in any of the other arcs and (2) it shows unique spectral properties in the MUSE spectrum not observed in any of the other knots populating the rest of the arcs (the ongoing X-Shooter programme555VLT/X-Shooter, P103.A-0688(A-C), PI Vanzella. will investigate ‘Tr’ and the results presented elsewhere). The characterisation of such a transient (like the absolute magnitude), will provide a unique constraint for the lens model.
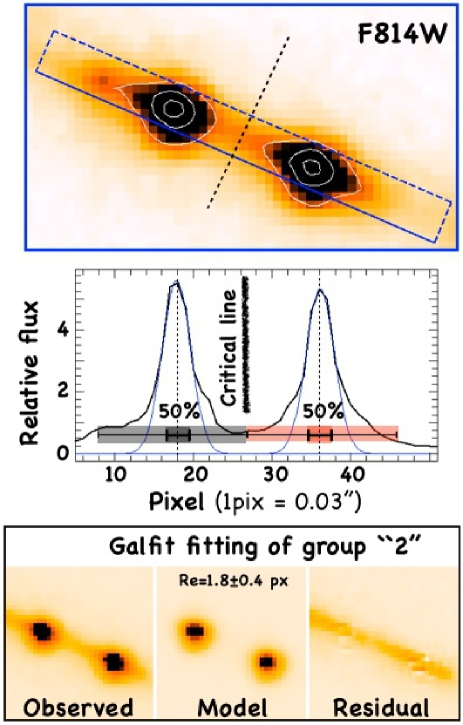
Figure 8 shows the two multiple images “2” and “3”, each one located away from the critical line, that necessarily falls between them. The giant arclike shape also implies the magnification is mainly tangential, such that the total magnification is close to the tangential one, (see discussion in Vanzella et al. 2017b). Despite the knots lie in a region with a potentially steep tangential magnification gradient, the light profiles along the same direction are symmetric (see Figure 8, middle panel), strongly supporting the fact that the object is intrinsically compact (see also discussion by Vanzella et al. 2016a on another similar case). As shown in the middle panel of the same figure, the LyCknot is marginally resolved in the HST/F814W image, close to the resolution in that band, in which the PSF FWHM is (though it is not a point-like source). Indeed, specific Galfit-based deconvolution analysis (as similarly performed in Vanzella et al. 2016a, 2017b) produces effective radii () of the order of pixel, for a Sersic index in the range n = . It is worth noting, however, that a large n and would produce non symmetric tangential profiles, as mentioned above. This will be fully investigated with dedicated simulations of all the knots and the emerging light profiles by placing objects with known structural parameters in the source plane close to the caustics (see appendix A of Vanzella et al. 2017b), once the lens model will be developed.
Appendix B Measuring the significance of the emission lines detected in the X-Shooter spectrum
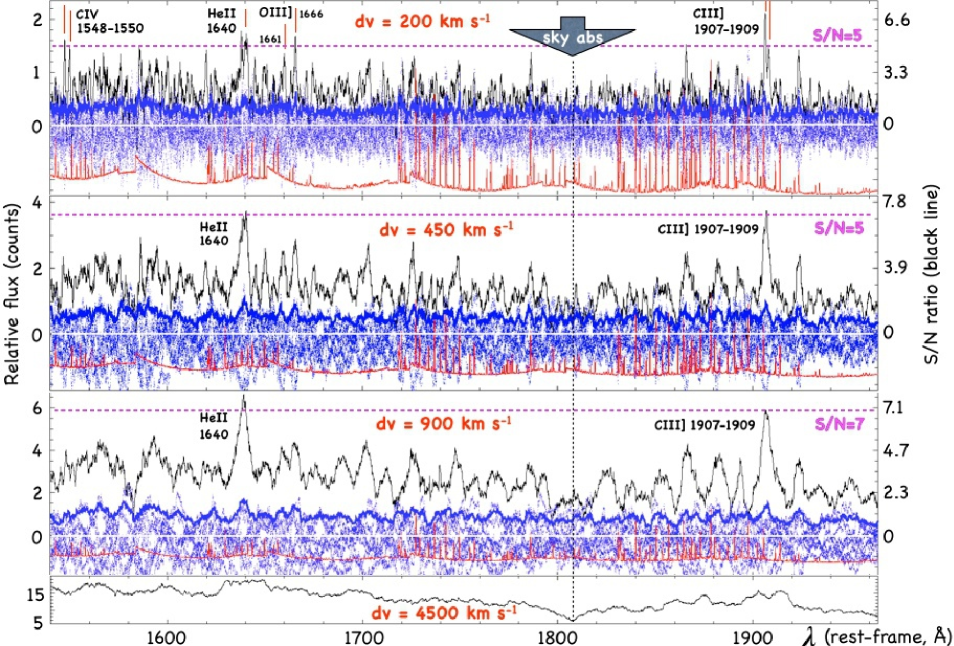
The statistical significance of the emission lines reported in Table 1 has been calculated performing spectral scans over the reduced spectra in the UVB, VIS and NIR arms. In particular, we describe here the case of the VIS arm, in which we explore the presence and broadness of the Heii line.
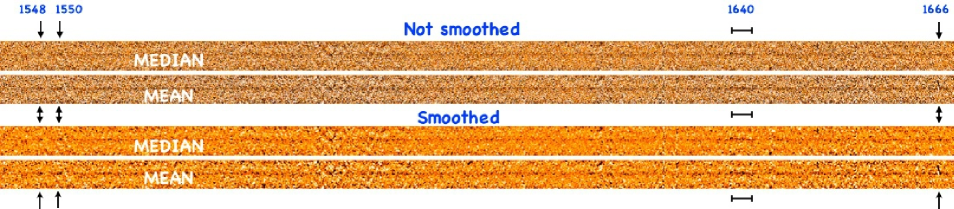
A spectral scan over the two-dimensional reduced spectrum is performed by using a widow with spatial scale ds and velocity dv. ds has been fixed to , slightly larger than the mean seeing during the observations (the spatial scale in the VIS arm is /pix). Thee velocity widths have been used, dv = 200, 450 and 900 km s-1. Small(large) dv captures small(large) spectral features. The scan has been performed pixel by pixel in the wavelength direction (0.2Å/pix), while the spatial direction windows do not overlap to each other (they are independent). Moreover, we distinguished between the position of the target (that lies at a fixed position) and the rest of the slit. After excluding the target and the edges of the slit we end up with 10 independent windows corresponding to each wavelength position. Figure 9 shows the results of this exercise. The black line in each panel shows the scan performed at the position of the target. The scan with small dv recovers the narrow features and doublets discussed in the text, like the Civ, Oiii], Heii and the Ciii] lines. The results of the same scan avoiding the target is shown with blue dots which are more distributed around the zero value and follow the spectral pattern of the sky emission (shown with red line and rescaled as a guidance). The thick blue line represents the standard deviation of the cloud of blue points calculated over the 10 windows available at each wavelength position. The black and the thick blue line are the signal and the error, respectively. The S/N ratios reported in Table 1 are inferred from this analysis.
The same spectral scan has been computed by enlarging dv. Figure 9 clearly shows that as dv increases the tiny spectral features disappear, hidden by the continuum fluctuation. The continuum shows a small (but wide) dip at Å, that corresponds to 7620Å at the observed frame, due to the well known sky absorption band (7600-7640Å). Two main spectral features associated to Ion2 stand out from the continuum: the Ciii] doublet that is detected as a single entity and the broad emission identified at the position of Heii, with a S/N .