A Standard Ruler at Cosmic Dawn
Abstract
The matter in our Universe comes in two flavors: dark and baryonic. Of these, only the latter couples to photons, giving rise to the well-known baryon acoustic oscillations and, in the process, generating supersonic relative velocities between dark matter and baryons. These velocities—imprinted with the acoustic scale in their genesis—impede the formation of the first stars during cosmic dawn (), modulating the expected 21-cm signal from this era. In a companion paper we showed, combining numerical simulations and analytic models, that this modulation takes the form of robust velocity-induced acoustic oscillations (VAOs), with a well-understood shape that is frozen at recombination, and unaffected by the unknown astrophysics of star formation. Here we propose using these VAOs as a standard ruler at cosmic dawn. We find that three years of 21-cm power-spectrum data from the upcoming HERA interferometer should be able to measure the Hubble expansion rate at to percent-level precision, ranging from 0.3% to 11% depending on the strength of astrophysical feedback processes and foregrounds. This would provide a new handle on the expansion rate of our Universe during an otherwise unprobed epoch, opening a window to the mysterious cosmic-dawn era.
The 21-cm line of neutral hydrogen is set to revolutionize our understanding of the Universe, providing access to a large cosmic volume unobservable by other probes. Of particular interest is the cosmic-dawn era, spanning the redshift range , which saw the formation of the first stars. These stars filled the Universe with ultraviolet (UV) photons, exciting the hyperfine transition in neutral hydrogen and allowing it to efficiently absorb 21-cm photons from the cosmic microwave background (CMB) [1, 2, 3]. In addition, hydrogen was later reheated by the abundant X-rays produced by stellar formation, eventually sourcing 21-cm emission against the CMB [4, 5, 6]. These two effects allow us to indirectly map the distribution of the first star-forming galaxies during cosmic dawn through the 21-cm hydrogen line.
The first galaxies formed out of matter overdensities at small scales [7, 8, 9], where baryons and dark matter (DM) do not behave identically. After matter-radiation equality the DM started clustering efficiently under its own gravity. Baryons, on the other hand, were impeded to do so by their interactions with photons, producing the well-known baryon acoustic oscillations (BAOs) [10, 11]. This discrepancy also generated relative velocities between the two fluids [12], which strongly suppress the formation of the first stars due to their supersonic nature. Physically, this suppression arises from three sources. First, large relative velocities damp matter fluctuations at small scales, thus lowering the amount of haloes that can form [12, 13, 14]. Second, they allow baryons to stream away from each halo, reducing the amount of gas available for star formation [15, 16, 17]. Last, they smear overdense gas cores, impeding said gas to cool and form stars [18, 19, 20, 21, 22, 23].
The fluctuations of the DM-baryon relative velocities show marked acoustic oscillations at large scales, due to their BAO origin [12]. As a consequence of the three effects outlined above, these oscillations are imprinted into the distribution of the first stars, and thus into the 21-cm power spectrum during cosmic dawn [24, 25, 26, 27, 28]. In Ref. [28] we showed, via seminumerical simulations with 21cmvFAST (a publicly available version of 21cmFAST [29, 30] modified to include streaming velocities), that these unique velocity-induced acoustic oscillations (VAOs) follow a simple analytic shape, which is established at recombination [16, 31, 32]. This shape is largely impervious to the complex astrophysics of star formation, as the power spectrum of nonlinear functions of the relative velocity is proportional to that of the velocity itself [28]. This makes VAOs a powerful probe of acoustic oscillations at high redshifts.
In this Letter we propose employing a prospective detection of VAOs in the 21-cm power spectrum as a standard ruler to the enigmatic cosmic-dawn era. The procedure to use VAOs as a standard ruler is similar to regular BAO analyses of galaxy surveys, with two major differences. First, while matter overdensities are affected by both gravity and the BAOs, relative velocities are only sourced by the latter. Thus, even though the matter density fluctuates only at the percent level due to the acoustic oscillations [33, 34], the relative velocities fluctuate by order unity at acoustic scales [12], which simplifies the task of modeling the VAOs. Second, galaxy surveys detect roughly isotropically in Fourier space whereas, due to their foreground structure, 21-cm observations are heavily biased towards -modes along the line of sight [35, 36, 37, 38]. This hampers a detection of the angular-diameter distance with VAOs, although we will show that it allows for a percent-level measurement of the Hubble expansion rate of our Universe during cosmic dawn ().
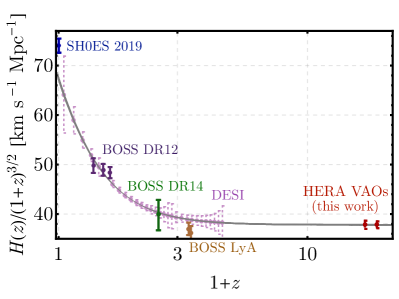
Such a measurement would allow us to probe the state of our Universe at an earlier cosmic epoch than any BAO survey. We illustrate this in Fig. 1, where we show measurements of through regular BAOs with current datasets [39, 40, 41, 42], as well as with the future Dark Energy Spectroscopic Instrument (DESI) [43], which in no case can reach redshifts farther than . VAOs, on the other hand, allow us to probe the era, deep into the matter-dominated regime, providing a useful test of exotic physics, such as early dark energy [44, 45, 46, 47] and decaying DM [48]. Even within the standard cosmological model, a percent-level measurement of could help ascertain the origin of the tension between CMB [49] and supernovae observables [50, 51, 52] (see also [53]), or act as an independent measurement of the acoustic scale . Furthermore, VAOs can help constrain the masses of the elusive neutrinos, as these contribute to but not to the growth of fluctuations at small scales [54]. These examples show the potential of VAOs for the study of cosmology.
VAOs arise from the suppression of the first stellar formation due to the DM-baryon relative velocities (). These first stars are expected to form in molecular-cooling haloes (with masses ) [55, 56, 57], where the suppressive effect of is most sizable. Nevertheless, the UV background accumulated through gradual stellar emission dissociates molecular hydrogen, so that eventually only atomic-cooling haloes (with ) form stars [58], lowering the expected VAO amplitude. This well-known process of Lyman-Werner (LW) feedback on star formation has been extensively studied in the literature [59, 60, 61], albeit always in the absence of streaming velocities. Therefore, it is not known whether LW feedback acts coherently with the -induced suppression. To parametrize the large uncertainties in this process, we consider three possible LW-feedback strengths. Our default scenario is that of “regular” feedback, where the velocities are assumed to add coherently to the LW feedback, as in Ref. [21]. We also consider a case of “low” feedback strength, with a lower overall impact of the LW flux; and a “high” feedback strength, where velocities and LW feedback are incoherent, as in Ref. [25].
We will use the 21-cm hydrogen line to indirectly probe the distribution of star-forming galaxies at cosmic dawn.
Our observable will be the dimensionless 21-cm power spectrum ,
which we obtain via semi-numerical simulations with 21cmvFAST222https://github.com/JulianBMunoz/21cmvFAST. See also
https://github.com/andreimesinger/21cmFAST
[28].
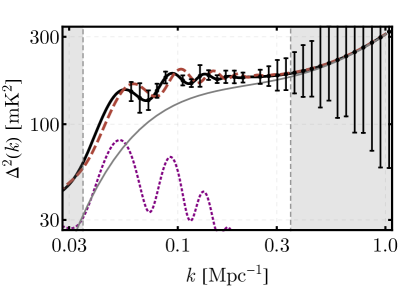
We show the predicted 21-cm power spectrum at in Fig. 2 for our default scenario, where the power is generated by the inhomogeneous X-ray heating of the hydrogen gas.
Here the relative velocities produce fluctuations in the X-ray flux from the first galaxies, generating clearly visible VAOs in the 21-cm power spectrum.
The acoustic origin of the VAOs imprints the scale onto the observable 21-cm signal, where Mpc is the comoving sound horizon at the baryon drag era () [49]. This is apparent, for instance, from the separation between the VAO maxima of Mpc-1 in Fig. 2. Therefore, the presence of VAOs provides us with a well-known distance scale at cosmic dawn. We use it as a standard ruler by performing an Alcock-Paczynsky (AP) test on our data [62]: A feature at some wavenumber , where the subscripts and represent the perpendicular and line-of-sight (LoS) directions, is shifted to when assuming the wrong fiducial cosmology. The two AP parameters are
| (1) |
where is the Hubble expansion rate and the angular-diameter distance, and the superscript “fid” stands for fiducial. Then, by searching for shifts in the VAO peaks we can constrain both and , thus measuring and at the observation redshift. As an example, in Fig. 2 we show the 21-cm power spectrum that would be inferred if were 10% smaller than our fiducial value (corresponding to ), which would clearly shift the VAO peaks to smaller scales. Note that here we work in -space for simplicity, although it would be equivalent to work directly in visibility space [63].
We make use of two facts that vastly simplify the use of VAOs as a standard ruler. First, to a good approximation the fluctuations of any smooth function of are proportional to
| (2) |
where is the root-mean-square value of . We denote the power spectrum of this quantity as , which defines the shape of the VAOs [28]. Second, VAOs are uncorrelated with the usual 21-cm fluctuations sourced by overdensities [16, 31, 32], and so they can be linearly added to the usual (no-) 21-cm power spectrum to obtain the total signal. Consequently, we model the 21-cm power spectrum as
| (3) |
where (with units of mK2) is the VAO amplitude, and is a window function accounting for the nonlocal propagation of X-ray photons from the first stars [16] (which only produces a modest suppression in power within the range of interest [28]). We use an -th order polynomial,
| (4) |
to parametrize the smooth nonoscillatory part of the 21-cm signal, where are nuisance parameters to be determined from data. We show in Fig. 2 the VAO-only contribution to the 21-cm power spectrum, with the expected large acoustic oscillations at Mpc-1, as well as the smooth component, both at . We note, in passing, that the power at large scales ( Mpc-1) increases when including VAOs.
In all of our simulations the X-ray heating era roughly starts at (where the global 21-cm signal is minimum), and lasts until (where the global signal crosses zero, transitioning into emission), so in this work we consider two redshift bins, centered at and , encompassing a above and below their centers. These bins are only meant to be illustrative, since the heating era can be shifted to earlier or later times by altering the (unconstrained) X-ray luminosity, as further explored in Ref. [28], which however does not alter the main results of this work.
Whether we can detect the predicted shift in the VAO peaks—and thus measure —depends not only on the sensitivity of the experiment at hand, but also on the severity of the foregrounds. These are expected to contaminate a large region of the observable Fourier space, usually termed the “wedge” [35, 36, 37, 38], which is deemed irretrievable for cosmological studies (as the foregrounds outweigh the cosmic signal roughly to 1 [64, 65]). We follow Refs. [66, 67] in parametrizing the extent of the foreground wedge by assuming that all wavenumbers with below
| (5) |
are contaminated, where accounts for the chromaticity of the antennae, and is a constant superhorizon buffer [38]. Given the large foreground uncertainties, we study three cases based on (but not identical to) those of Ref. [67]. In the pessimistic- and moderate-foreground cases we take the usual determined by the horizon limit, with buffers of , respectively. In the optimistic case we set and given by the primary beam [67], and in all cases we assume that different baselines can be added coherently.
For concreteness we focus on the Hydrogen Epoch of Reionization Array (HERA)333reionization.org [68], for which we obtain sensitivity curves using the publicly available code 21cmSense444https://github.com/jpober/21cmSense [66, 67], with two minor modifications. First, we bin the -modes logarithmically, instead of linearly, to better resolve the VAOs. Second, at each redshift we split the available data between different bandwidths. This is designed to observe a larger amount of wavenumbers, as the foreground wedge only allows a small range of modes to be observable around each , and the fast Fourier transform (FFT) performed within each bandwidth determines which modes can be observed (through for integers ). While this splitting will allow us to better probe the shape of the 21-cm power spectrum (and thus more clearly characterize the oscillations), it will also reduce the sensitivity at each individual wavenumber. We only consider bandwidths below 8 MHz, to keep each redshift slice roughly in the co-evaluation regime. Thus, we use three bands at each redshift, with widths MHz both for MHz (corresponding to ) and MHz (corresponding to ), where each band uses data from 180 observation days (totaling 540 days). The resulting HERA error bars are shown in Fig. 2.
Given our model, from Eq. (3); the mock data , from 21cmvFAST; and its error bars , from projected HERA observations, we define our likelihood at each redshift bin through
| (6) |
where is a parameter vector that we will specify. We employ data in the range (as lower wavenumbers are contaminated, and higher ones do not show VAOs), which we divide into bins, and sample the likelihood with the Python package emcee [69]. Note that, as a consequence of the foreground wedge, we will likely only be able to measure wavenumbers with . In that case, we can disregard variations in the AP parameter , as they are negligible compared to those in the LoS parameter . Under this approximation, our parameter vector for each redshift bin will be , where is a vector of length , containing the (nuisance) coefficients of the smooth polynomial . We impose a prior of to avoid unphysical values [70] (such as ), as well as and , which are broad enough to fit the 21-cm power spectrum in all of our simulations. Additionally, we determine the order of the nonoscillatory polynomial () by finding the first coefficient that is consistent with zero, given our predicted uncertainties. These depend on the foreground severity, and we find that for the case of pessimistic and moderate foregrounds suffices to properly fit the non-VAO power spectrum within the range that we are interested in, whereas when considering optimistic foregrounds the expected noise level is lower, and is required.
| Foregrounds | |||
|---|---|---|---|
| Feedback strength | Pessimistic | Moderate | Optimistic |
| High | 8.5% | 6.9% | |
| Regular | 11% | 2.2% | 0.6% |
| Low | 3.1% | 1.1% | 0.4% |
| Feedback strength | Pessimistic | Moderate | Optimistic |
|---|---|---|---|
| High | 8.9% | 2.8% | |
| Regular | 4.1% | 1.8% | 0.7% |
| Low | 1.7% | 0.7% | 0.3% |
We show our forecasted marginalized sensitivities to (obtained from ) in Table 1, both at and , for each of our feedback and foreground assumptions. This Table is the main result of this work. In all cases but one it is possible to detect the VAOs with enough significance to obtain a measurement of , with precision ranging from sub-percent (competing with current determinations of from Planck [49]) under optimistic assumptions, to 11% for the most pessimistic cases. Focusing on our default scenario of moderate foregrounds and regular feedback, we put our VAO projections in context by comparing them with regular BAO measurements of in Fig. 1, where the unique large- reach of the VAOs is apparent. In all of our results we have assumed 540 days of HERA data, albeit in most cases a third of that is sufficient to detect the VAOs, which, however degrades the precision on by with respect to Table 1.
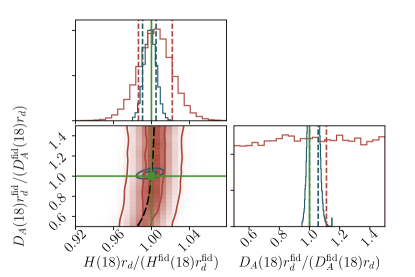
Before concluding, let us briefly study what constraints could be placed on through a fully anisotropic AP test of the VAOs. For this, we extend our likelihood to depend on and independently, where now our vector parameter contains both and , and given the typical small range of observable we assume that both the signal and our model are not explicitly anisotropic (see, however, Refs. [72, 73]). We obtain the noise in each bin through a modified version of 21cmSense, and show our projected confidence ellipses for and (both normalized to their fiducial values) at in Fig. 3, assuming regular feedback, using the corner package [74]. From this figure we see how, as predicted, moderate foregrounds do not allow for a meaningful measurement of the angular-diameter distance. Indeed, we find at 68% C. L. for this case, although the relative error projected for is 1.8%, unaffected by the inclusion of . The situation is more promising under optimistic foregrounds, where we can measure to 2.8% and to 0.7% precision, with small correlation between them. A measurement of would place strong constraints on both the curvature of our Universe and the evolution of dark energy [75], showing that foreground removal is critical to fully exploit the information in 21-cm observables during cosmic dawn, akin to lower- analyses [76].
In addition to VAOs, the 21-cm signal is affected by the “regular” (density-induced) BAOs [77, 78, 79, 80, 81, 76, 82], which however are much smaller in amplitude. Although BAOs are a promising standard ruler for 21-cm surveys at lower redshifts [75, 83, 84], the complicated mapping between densities and 21-cm signal at cosmic dawn hinders their use during this era. The VAOs sidestep this issue, as they produce large oscillations with a well-understood shape [28]. Moreover, while here we have only studied the epoch of X-ray heating, a similar analysis could be carried out during the preceding Lyman- coupling era, which lasts from for our fiducial parameters.
There are some caveats about our analysis worth mentioning. We have considered a broad range of feedback and foreground assumptions, and found that VAOs are observable in almost all cases. Nevertheless, there might be additional sources of feedback (such as mechanical or radiative [85, 86, 87, 9]) that conspire to hide the VAO signal, preventing the formation of even atomic-cooling haloes during cosmic dawn. Similarly, the spectrum of the first X-ray sources can affect the detectability of VAOs, as higher-energy photons have longer mean-free paths [88, 89], damping small-scale fluctuations [28, 16, 90]. We have tested our method assuming a higher X-ray cutoff energy keV, as described in Ref. [28], and found very similar results to those with our fiducial cutoff at keV (both with and without updating the window function in Eq. (3)), as the damping of VAOs is compensated by a lower nonoscillatory signal. Nonetheless, for cutoffs above keV it might become impossible to detect the VAOs, and thus to measure . We emphasize, however, that different astrophysical effects can alter the observability of the VAOs but not their unique acoustic shape. So, while detecting VAOs is not guaranteed, such a detection would provide a robust standard ruler at cosmic dawn.
In summary, the DM-baryon relative velocities are predicted to leave striking VAOs on the 21-cm power spectrum at . We have shown how, by using the acoustic scale imprinted by these VAOs as a standard ruler, the HERA interferometer should be able to measure the cosmological expansion rate at cosmic dawn, casting light onto the properties of our Universe during this mysterious era.
Acknowledgements.
It is our pleasure to thank Yacine Ali-Haïmoud, Marc Kamionkowski, David Pinner, and Matias Zaldarriaga for enlightening discussions; Jonathan Pober for help with the HERA noise; and Cora Dvorkin, Abraham Loeb, and especially Ely Kovetz for comments on a previous version of this manuscript. Some computations in this Letter were run on the Odyssey cluster supported by the FAS Division of Science, Research Computing Group at Harvard University. This work was supported by the Department of Energy (DOE) grant DE-SC0019018.References
- Wouthuysen [1952] S. A. Wouthuysen, On the excitation mechanism of the 21-cm (radio-frequency) interstellar hydrogen emission line., Astronomical Journal 57, 31 (1952).
- Field [1959] G. B. Field, The Spin Temperature of Intergalactic Neutral Hydrogen., Astrophys. J. 129, 536 (1959).
- Hirata [2006] C. M. Hirata, Wouthuysen-Field coupling strength and application to high-redshift 21 cm radiation, Mon. Not. Roy. Astron. Soc. 367, 259 (2006), arXiv:astro-ph/0507102 .
- Furlanetto et al. [2006] S. Furlanetto, S. P. Oh, and F. Briggs, Cosmology at Low Frequencies: The 21 cm Transition and the High-Redshift Universe, Phys. Rept. 433, 181 (2006), arXiv:astro-ph/0608032 .
- Pritchard and Loeb [2012] J. R. Pritchard and A. Loeb, 21-cm cosmology, Rept. Prog. Phys. 75, 086901 (2012), arXiv:1109.6012 .
- Pritchard and Loeb [2010] J. R. Pritchard and A. Loeb, Constraining the unexplored period between the dark ages and reionization with observations of the global 21 cm signal, Phys. Rev. D82, 023006 (2010), arXiv:1005.4057 .
- Loeb and Furlanetto [2013] A. Loeb and S. R. Furlanetto, The first galaxies in the universe (Princeton University Press, 2013).
- Barkana and Loeb [2001] R. Barkana and A. Loeb, In the beginning: The First sources of light and the reionization of the Universe, Phys. Rept. 349, 125 (2001), arXiv:astro-ph/0010468 .
- Springel and Hernquist [2003] V. Springel and L. Hernquist, The history of star formation in a lcdm universe, Mon. Not. Roy. Astron. Soc. 339, 312 (2003), arXiv:astro-ph/0206395 .
- Peebles and Yu [1970] P. J. E. Peebles and J. T. Yu, Primeval adiabatic perturbation in an expanding universe, Astrophys. J. 162, 815 (1970).
- Sunyaev and Zeldovich [1970] R. A. Sunyaev and Ya. B. Zeldovich, Small scale fluctuations of relic radiation, Astrophys. Space Sci. 7, 3 (1970).
- Tseliakhovich and Hirata [2010] D. Tseliakhovich and C. Hirata, Relative velocity of dark matter and baryonic fluids and the formation of the first structures, Phys. Rev. D82, 083520 (2010), arXiv:1005.2416 .
- Naoz et al. [2012] S. Naoz, N. Yoshida, and N. Y. Gnedin, Simulations of Early Baryonic Structure Formation with Stream Velocity: I. Halo Abundance, Astrophys. J. 747, 128 (2012), arXiv:1108.5176 .
- Bovy and Dvorkin [2013] J. Bovy and C. Dvorkin, Low-mass suppression of the satellite luminosity function due to the supersonic baryon–cold-dark-matter relative velocity, Astrophys. J. 768, 70 (2013), arXiv:1205.2083 .
- Tseliakhovich et al. [2011] D. Tseliakhovich, R. Barkana, and C. Hirata, Suppression and Spatial Variation of Early Galaxies and Minihalos, Mon. Not. Roy. Astron. Soc. 418, 906 (2011), arXiv:1012.2574 .
- Dalal et al. [2010] N. Dalal, U.-L. Pen, and U. Seljak, Large-scale BAO signatures of the smallest galaxies, JCAP 1011, 007, arXiv:1009.4704 .
- Naoz et al. [2013] S. Naoz, N. Yoshida, and N. Y. Gnedin, Simulations of Early Baryonic Structure Formation with Stream Velocity: II. The Gas Fraction, Astrophys. J. 763, 27 (2013), arXiv:1207.5515 .
- O’Leary and McQuinn [2012] R. M. O’Leary and M. McQuinn, The formation of the first cosmic structures and the physics of the z 20 Universe, Astrophys. J. 760, 4 (2012), arXiv:1204.1344 .
- Stacy et al. [2011] A. Stacy, V. Bromm, and A. Loeb, Effect of Streaming Motion of Baryons Relative to Dark Matter on the Formation of the First Stars, Astrophys. J. 730, L1 (2011), arXiv:1011.4512 .
- Greif et al. [2011] T. Greif, S. White, R. Klessen, and V. Springel, The Delay of Population III Star Formation by Supersonic Streaming Velocities, Astrophys. J. 736, 147 (2011), arXiv:1101.5493 .
- Fialkov et al. [2012] A. Fialkov, R. Barkana, D. Tseliakhovich, and C. M. Hirata, Impact of the Relative Motion between the Dark Matter and Baryons on the First Stars, Mon. Not. Roy. Astron. Soc. 424, 1335 (2012), arXiv:1110.2111 .
- Schauer et al. [2019] A. T. P. Schauer, S. C. O. Glover, R. S. Klessen, and D. Ceverino, The Influence of Streaming Velocities on the Formation of the First Stars, Mon. Not. Roy. Astron. Soc. 484, 3510 (2019), arXiv:1811.12920 .
- Hirano et al. [2018] S. Hirano, N. Yoshida, Y. Sakurai, and M. S. Fujii, Formation of the first star clusters and massive star binaries by fragmentation of filamentary primordial gas clouds, Astrophys. J. 855, 17 (2018), arXiv:1711.07315 .
- Visbal et al. [2012] E. Visbal, R. Barkana, A. Fialkov, D. Tseliakhovich, and C. Hirata, The signature of the first stars in atomic hydrogen at redshift 20, Nature 487, 70 (2012), arXiv:1201.1005 .
- McQuinn and O’Leary [2012] M. McQuinn and R. M. O’Leary, The impact of the supersonic baryon-dark matter velocity difference on the z 20 21cm background, Astrophys. J. 760, 3 (2012), arXiv:1204.1345 .
- Fialkov et al. [2013] A. Fialkov, R. Barkana, E. Visbal, D. Tseliakhovich, and C. M. Hirata, The 21-cm signature of the first stars during the Lyman-Werner feedback era, Mon. Not. Roy. Astron. Soc. 432, 2909 (2013), arXiv:1212.0513 .
- Fialkov et al. [2014a] A. Fialkov, R. Barkana, A. Pinhas, and E. Visbal, Complete history of the observable 21-cm signal from the first stars during the pre-reionization era, Mon. Not. Roy. Astron. Soc. 437, 36 (2014a), arXiv:1306.2354 .
- Muñoz [2019] J. B. Muñoz, Robust Velocity-induced Acoustic Oscillations at Cosmic Dawn, Phys. Rev. D100, 063538 (2019), arXiv:1904.07881 .
- Mesinger et al. [2011] A. Mesinger, S. Furlanetto, and R. Cen, 21cmFAST: A Fast, Semi-Numerical Simulation of the High-Redshift 21-cm Signal, Mon. Not. Roy. Astron. Soc. 411, 955 (2011), arXiv:1003.3878 .
- Greig and Mesinger [2015] B. Greig and A. Mesinger, 21CMMC: an MCMC analysis tool enabling astrophysical parameter studies of the cosmic 21 cm signal, Mon. Not. Roy. Astron. Soc. 449, 4246 (2015), arXiv:1501.06576 .
- Ali-Haïmoud et al. [2014] Y. Ali-Haïmoud, P. D. Meerburg, and S. Yuan, New light on 21 cm intensity fluctuations from the dark ages, Phys. Rev. D89, 083506 (2014), arXiv:1312.4948 .
- Muñoz et al. [2018] J. B. Muñoz, C. Dvorkin, and A. Loeb, 21-cm Fluctuations from Charged Dark Matter, Phys. Rev. Lett. 121, 121301 (2018), arXiv:1804.01092 .
- Ma and Bertschinger [1995] C.-P. Ma and E. Bertschinger, Cosmological perturbation theory in the synchronous and conformal Newtonian gauges, Astrophys. J. 455, 7 (1995), arXiv:astro-ph/9506072 .
- Eisenstein and Hu [1998] D. J. Eisenstein and W. Hu, Baryonic features in the matter transfer function, Astrophys. J. 496, 605 (1998), arXiv:astro-ph/9709112 .
- Parsons et al. [2012a] A. Parsons, M. McQuinn, D. Jacobs, J. Aguirre, and J. Pober, A Sensitivity and Array-Configuration Study for Measuring the Power Spectrum of 21cm Emission from Reionization, Astrophys. J. 753, 81 (2012a), arXiv:1103.2135 .
- Morales et al. [2012] M. F. Morales, B. Hazelton, I. Sullivan, and A. Beardsley, Four Fundamental Foreground Power Spectrum Shapes for 21 cm Cosmology Observations, Astrophys. J. 752, 137 (2012), arXiv:1202.3830 .
- Datta et al. [2010] A. Datta, J. D. Bowman, and C. L. Carilli, Bright Source Subtraction Requirements For Redshifted 21 cm Measurements, Astrophys. J. 724, 526 (2010), arXiv:1005.4071 .
- Parsons et al. [2012b] A. R. Parsons, J. C. Pober, J. E. Aguirre, C. L. Carilli, D. C. Jacobs, and D. F. Moore, A Per-Baseline, Delay-Spectrum Technique for Accessing the 21cm Cosmic Reionization Signature, Astrophys. J. 756, 165 (2012b), arXiv:1204.4749 .
- Alam et al. [2016] S. Alam et al. (BOSS), The clustering of galaxies in the completed SDSS-III Baryon Oscillation Spectroscopic Survey: cosmological analysis of the DR12 galaxy sample, Submitted to: Mon. Not. Roy. Astron. Soc. (2016), arXiv:1607.03155 .
- du Mas des Bourboux et al. [2017] H. du Mas des Bourboux et al., Baryon acoustic oscillations from the complete SDSS-III Ly-quasar cross-correlation function at , Astron. Astrophys. 608, A130 (2017), arXiv:1708.02225 .
- Bautista et al. [2017] J. E. Bautista et al., Measurement of baryon acoustic oscillation correlations at with SDSS DR12 Ly-Forests, Astron. Astrophys. 603, A12 (2017), arXiv:1702.00176 .
- Zarrouk et al. [2018] P. Zarrouk et al., The clustering of the SDSS-IV extended Baryon Oscillation Spectroscopic Survey DR14 quasar sample: measurement of the growth rate of structure from the anisotropic correlation function between redshift 0.8 and 2.2, Mon. Not. Roy. Astron. Soc. 477, 1639 (2018), arXiv:1801.03062 .
- Aghamousa et al. [2016] A. Aghamousa et al. (DESI), The DESI Experiment Part I: Science,Targeting, and Survey Design, (2016), arXiv:1611.00036 .
- Karwal and Kamionkowski [2016] T. Karwal and M. Kamionkowski, Dark energy at early times, the Hubble parameter, and the string axiverse, Phys. Rev. D94, 103523 (2016), arXiv:1608.01309 .
- Hill and Baxter [2018] J. C. Hill and E. J. Baxter, Can Early Dark Energy Explain EDGES?, JCAP 1808 (08), 037, arXiv:1803.07555 .
- Poulin et al. [2018] V. Poulin, T. L. Smith, T. Karwal, and M. Kamionkowski, Early Dark Energy Can Resolve The Hubble Tension, (2018), arXiv:1811.04083 .
- Agrawal et al. [2019] P. Agrawal, F.-Y. Cyr-Racine, D. Pinner, and L. Randall, Rock ’n’ Roll Solutions to the Hubble Tension, (2019), arXiv:1904.01016 .
- Poulin et al. [2016] V. Poulin, P. D. Serpico, and J. Lesgourgues, A fresh look at linear cosmological constraints on a decaying dark matter component, JCAP 1608 (08), 036, arXiv:1606.02073 .
- Aghanim et al. [2018] N. Aghanim et al. (Planck), Planck 2018 results. VI. Cosmological parameters, (2018), arXiv:1807.06209 .
- Riess et al. [2019] A. G. Riess, S. Casertano, W. Yuan, L. M. Macri, and D. Scolnic, Large Magellanic Cloud Cepheid Standards Provide a 1% Foundation for the Determination of the Hubble Constant and Stronger Evidence for Physics Beyond LambdaCDM, (2019), arXiv:1903.07603 .
- Riess et al. [2016] A. G. Riess et al., A 2.4% Determination of the Local Value of the Hubble Constant, Astrophys. J. 826, 56 (2016), arXiv:1604.01424 .
- Rigault et al. [2015] M. Rigault et al., Confirmation of a Star Formation Bias in Type Ia Supernova Distances and its Effect on Measurement of the Hubble Constant, Astrophys. J. 802, 20 (2015), arXiv:1412.6501 .
- Wong et al. [2019] K. C. Wong et al., H0LiCOW XIII. A 2.4% measurement of from lensed quasars: tension between early and late-Universe probes, (2019), arXiv:1907.04869 [astro-ph.CO] .
- Lesgourgues and Pastor [2006] J. Lesgourgues and S. Pastor, Massive neutrinos and cosmology, Phys. Rept. 429, 307 (2006), arXiv:astro-ph/0603494 .
- Abel et al. [2002] T. Abel, G. L. Bryan, and M. L. Norman, The formation of the first star in the Universe, Science 295, 93 (2002), arXiv:astro-ph/0112088 .
- Bromm and Larson [2004] V. Bromm and R. B. Larson, The First stars, Ann. Rev. Astron. Astrophys. 42, 79 (2004), arXiv:astro-ph/0311019 [astro-ph] .
- Haiman and Bryan [2006] Z. Haiman and G. L. Bryan, Was Star-Formation Suppressed in High-Redshift Minihalos?, Astrophys. J. 650, 7 (2006), arXiv:astro-ph/0603541 .
- Oh and Haiman [2002] S. P. Oh and Z. Haiman, Second-generation objects in the universe: radiative cooling and collapse of halos with virial temperatures above 104 kelvin, Astrophys. J. 569, 558 (2002), arXiv:astro-ph/0108071 .
- Machacek et al. [2001] M. E. Machacek, G. L. Bryan, and T. Abel, Simulations of pregalactic structure formation with radiative feedback, Astrophys. J. 548, 509 (2001), arXiv:astro-ph/0007198 .
- O’Shea and Norman [2006] B. W. O’Shea and M. L. Norman, Population III star formation in a lambda-CDM Universe. 1. The effect of formation redshift and environment on protostellar accretion rate, Astrophys. J. 654, 66 (2006), arXiv:astro-ph/0607013 .
- Wise and Abel [2008] J. H. Wise and T. Abel, Resolving the Formation of Protogalaxies. 3. Feedback from the First Stars, Astrophys. J. 685, 40 (2008), arXiv:0710.3160 .
- Alcock and Paczynski [1979] C. Alcock and B. Paczynski, An evolution free test for non-zero cosmological constant, Nature 281, 358 (1979).
- Mao et al. [2008] Y. Mao, M. Tegmark, M. McQuinn, M. Zaldarriaga, and O. Zahn, How accurately can 21 cm tomography constrain cosmology?, Phys. Rev. D78, 023529 (2008), arXiv:0802.1710 .
- Pober et al. [2013] J. C. Pober et al., Opening the 21cm EoR Window: Measurements of Foreground Isolation with PAPER, Astrophys. J. 768, L36 (2013), arXiv:1301.7099 .
- Liu et al. [2014] A. Liu, A. R. Parsons, and C. M. Trott, Epoch of reionization window. II. Statistical methods for foreground wedge reduction, Phys. Rev. D90, 023019 (2014), 1404.4372 .
- Pober et al. [2013] J. C. Pober, A. R. Parsons, D. R. DeBoer, P. McDonald, M. McQuinn, J. E. Aguirre, Z. Ali, R. F. Bradley, T.-C. Chang, and M. F. Morales, The Baryon Acoustic Oscillation Broadband and Broad-beam Array: Design Overview and Sensitivity Forecasts, The Astronomical Journal 145, 65 (2013), arXiv:1210.2413 .
- Pober et al. [2014] J. C. Pober et al., What Next-Generation 21 cm Power Spectrum Measurements Can Teach Us About the Epoch of Reionization, Astrophys. J. 782, 66 (2014), arXiv:1310.7031 .
- DeBoer et al. [2017] D. R. DeBoer et al., Hydrogen Epoch of Reionization Array (HERA), Publ. Astron. Soc. Pac. 129, 045001 (2017), arXiv:1606.07473 .
- Foreman-Mackey et al. [2013] D. Foreman-Mackey, D. W. Hogg, D. Lang, and J. Goodman, emcee: The MCMC Hammer, Publ. Astron. Soc. Pac. 125, 306 (2013), arXiv:1202.3665 .
- Gil-Marín et al. [2016] H. Gil-Marín et al., The clustering of galaxies in the SDSS-III Baryon Oscillation Spectroscopic Survey: BAO measurement from the LOS-dependent power spectrum of DR12 BOSS galaxies, Mon. Not. Roy. Astron. Soc. 460, 4210 (2016), arXiv:1509.06373 .
- Ross et al. [2015] A. J. Ross, W. J. Percival, and M. Manera, The Information Content of Anisotropic Baryon Acoustic Oscillation Scale Measurements, Mon. Not. Roy. Astron. Soc. 451, 1331 (2015), arXiv:1501.05571 .
- Datta et al. [2012] K. K. Datta, G. Mellema, Y. Mao, I. T. Iliev, P. R. Shapiro, and K. Ahn, Light cone effect on the reionization 21-cm power spectrum, Mon. Not. Roy. Astron. Soc. 424, 1877 (2012), arXiv:1109.1284 .
- Greig and Mesinger [2018] B. Greig and A. Mesinger, 21CMMC with a 3D light-cone: the impact of the co-evolution approximation on the astrophysics of reionization and cosmic dawn, Mon. Not. Roy. Astron. Soc. 477, 3217 (2018), arXiv:1801.01592 .
- Foreman-Mackey [2016] D. Foreman-Mackey, corner.py: Scatterplot matrices in python, The Journal of Open Source Software 1, 24 (2016).
- Kovetz et al. [2017] E. D. Kovetz et al., Line-Intensity Mapping: 2017 Status Report, (2017), arXiv:1709.09066 .
- Obuljen et al. [2018] A. Obuljen, E. Castorina, F. Villaescusa-Navarro, and M. Viel, High-redshift post-reionization cosmology with 21cm intensity mapping, JCAP 1805 (05), 004, arXiv:1709.07893 .
- Barkana and Loeb [2005a] R. Barkana and A. Loeb, Probing the epoch of early baryonic infall through 21cm fluctuations, Mon. Not. Roy. Astron. Soc. 363, L36 (2005a), arXiv:astro-ph/0502083 .
- Barkana [2006] R. Barkana, Separating out the Alcock-Paczynski effect on 21cm fluctuations, Mon. Not. Roy. Astron. Soc. 372, 259 (2006), arXiv:astro-ph/0508341 .
- Chang et al. [2008] T.-C. Chang, U.-L. Pen, J. B. Peterson, and P. McDonald, Baryon Acoustic Oscillation Intensity Mapping as a Test of Dark Energy, Phys. Rev. Lett. 100, 091303 (2008), arXiv:0709.3672 .
- Wyithe et al. [2008] S. Wyithe, A. Loeb, and P. Geil, Baryonic Acoustic Oscillations in 21cm Emission: A Probe of Dark Energy out to High Redshifts, Mon. Not. Roy. Astron. Soc. 383, 1195 (2008), arXiv:0709.2955 .
- Kashlinsky et al. [2015] A. Kashlinsky, R. G. Arendt, F. Atrio-Barandela, and K. Helgason, Lyman-tomography of cosmic infrared background fluctuations with Euclid: probing emissions and baryonic acoustic oscillations at z ¿ 10, Astrophys. J. 813, L12 (2015), arXiv:1510.01620 .
- Ansari et al. [2018] R. Ansari et al. (Cosmic Visions 21 cm), Inflation and Early Dark Energy with a Stage II Hydrogen Intensity Mapping experiment, (2018), arXiv:1810.09572 .
- Barkana and Loeb [2005b] R. Barkana and A. Loeb, A Method for separating the physics from the astrophysics of high-redshift 21 cm fluctuations, Astrophys. J. 624, L65 (2005b), arXiv:astro-ph/0409572 .
- Pober [2015] J. C. Pober, The Impact of Foregrounds on Redshift Space Distortion Measurements With the Highly-Redshifted 21 cm Line, Mon. Not. Roy. Astron. Soc. 447, 1705 (2015), arXiv:1411.2050 .
- Barkana and Loeb [1999] R. Barkana and A. Loeb, The photoevaporation of dwarf galaxies during reionization, Astrophys. J. 523, 54 (1999), arXiv:astro-ph/9901114 .
- Mesinger and Dijkstra [2008] A. Mesinger and M. Dijkstra, UV Radiative Feedback During the Advanced Stages of Reionization, Mon. Not. Roy. Astron. Soc. 390, 1071 (2008), arXiv:0806.3090 .
- Okamoto et al. [2008] T. Okamoto, L. Gao, and T. Theuns, Massloss of galaxies due to a UV-background, Mon. Not. Roy. Astron. Soc. 390, 920 (2008), arXiv:0806.0378 .
- Pacucci et al. [2014] F. Pacucci, A. Mesinger, S. Mineo, and A. Ferrara, The X-ray spectra of the first galaxies: 21 cm signatures, Mon. Not. Roy. Astron. Soc. 443, 678 (2014), arXiv:1403.6125 .
- Fialkov et al. [2014b] A. Fialkov, R. Barkana, and E. Visbal, The observable signature of late heating of the Universe during cosmic reionization, Nature 506, 197 (2014b), arXiv:1402.0940 .
- Fialkov et al. [2015] A. Fialkov, R. Barkana, and A. Cohen, Reconstructing the nature of the first cosmic sources from the anisotropic 21-cm signal, Phys. Rev. Lett. 114, 101303 (2015), arXiv:1502.02731 .