Discovery of an intermediate-luminosity red transient in M51 and its likely dust-obscured, infrared-variable progenitor
Abstract
We present the discovery of an optical transient (OT) in Messier 51, designated M51 OT2019-1 (also ZTF 19aadyppr, AT 2019abn, ATLAS19bzl), by the Zwicky Transient Facility (ZTF). The OT rose over 15 days to an observed luminosity of (), in the luminosity gap between novae and typical supernovae (SNe). Spectra during the outburst show a red continuum, Balmer emission with a velocity width of km s-1, Ca II and [Ca II] emission, and absorption features characteristic of an F-type supergiant. The spectra and multiband light curves are similar to the so-called “SN impostors” and intermediate-luminosity red transients (ILRTs). We directly identify the likely progenitor in archival Spitzer Space Telescope imaging with a m luminosity of mag and a color redder than mag, similar to those of the prototype ILRTs SN 2008S and NGC 300 OT2008-1. Intensive monitoring of M51 with Spitzer further reveals evidence for variability of the progenitor candidate at [4.5] in the years before the OT. The progenitor is not detected in pre-outburst Hubble Space Telescope optical and near-IR images. The optical colors during outburst combined with spectroscopic temperature constraints imply a higher reddening of mag and higher intrinsic luminosity of mag () near peak than seen in previous ILRT candidates. Moreover, the extinction estimate is higher on the rise than on the plateau, suggestive of an extended phase of circumstellar dust destruction. These results, enabled by the early discovery of M51 OT2019-1 and extensive pre-outburst archival coverage, offer new clues about the debated origins of ILRTs and may challenge the hypothesis that they arise from the electron-capture induced collapse of extreme asymptotic giant branch stars.
1 Introduction
Searches for transients in the nearby universe have uncovered a diverse array of hydrogen-rich stellar events occupying the luminosity range between that of novae and supernovae (SNe). As more well-characterized events have been found, some defined classes are beginning to emerge. Distinguishing among these classes, however, can be challenging as there is significant overlap in their observed properties. These include events often associated with luminous blue variables (LBVs; Humphreys & Davidson, 1994; Smith & Owocki, 2006) variably referred to as “SN impostors,” “ Carinae variables,” or “giant eruptions” (Humphreys et al., 1999; Van Dyk et al., 2000; Pastorello et al., 2010; Smith et al., 2010; Smith, 2014). The “luminous red novae” (LRNe) are believed to be associated with stellar mergers or common-envelope ejections, including the 1–3 contact-binary merger V1309 Sco (Tylenda et al., 2011) and the B-type stellar merger V838 Mon (Bond et al., 2003; Sparks et al., 2008). Several extragalactic events are also suggested to be members of this class, e.g., M31 RV (Rich et al., 1989; Bond & Siegel, 2006; Bond, 2011), M85 OT2006-1 (Kulkarni et al., 2007), NGC 4490 OT2011-1 (Smith et al., 2016), and M101 OT2015-1 (Blagorodnova et al., 2017).
We adopt the term “intermediate-luminosity red transient” (ILRT), originally suggested by Bond et al. (2009), to refer to the class of SN impostors similar to two well-characterized prototypes: SN 2008S (Prieto et al., 2008; Botticella et al., 2009; Smith et al., 2009) and the 2008 optical transient (OT) in NGC 300 (NGC 300 OT2008-1; Berger et al., 2009; Bond et al., 2009; Humphreys et al., 2011). As the name suggests, these events reach peak luminosities ( to ) fainter than those of typical core-collapse SNe, but comparable to those of other impostors. The peak is followed by the monotonic decline of their optical light curves, and they also show reddened spectra suggestive of strong internal extinction from the immediate circumburst environment. Their spectra are similar to some LBV-related transients and LRNe, showing strong H, Ca II, and rare [Ca II] emission features superimposed on an absorption spectrum characteristic of an F-type supergiant. The intermediate-width H features indicate relatively low ejection velocities of a km s-1. Both NGC 300 OT2008-1 and SN 2008S had densely self-obscured progenitor stars detected in archival imaging with the Spitzer Space Telescope, whose luminosities and inferred masses (–; Prieto, 2008; Prieto et al., 2008; Thompson et al., 2009; Kochanek, 2011) are lower than those of classical LBVs. Both events have now faded below their pre-explosion luminosities in the IR (Adams et al., 2016), suggesting that the explosions may have been terminal. Other proposed members of this class discovered in the past decade include PTF 10fqs (Kasliwal et al., 2011), SN 2010dn (Smith et al., 2011), and AT 2017be (Cai et al., 2018), although their larger distances prevented the direct identification of progenitors.
Here, we present the discovery by the Zwicky Transient Facility (ZTF; Bellm et al., 2019b; Graham et al., 2019) of an OT in M51 with similar properties to those of previously observed ILRTs and other SN impostors. At a distance of only Mpc (McQuinn et al., 2016, 2017), this is the closest such event in over a decade, allowing us to identify and characterize a candidate progenitor star in archival Spitzer images. In this Letter, we describe the discovery and early observations (Section 2), our analysis of available archival imaging and identification of the likely progenitor (Section 3.1), the early photometric evolution (Section 3.2), and spectroscopic properties (Section 3.3). In Section 4, we discuss the properties of the OT and its progenitor in the context of similar transients, and suggest it is a member of the ILRT class offering new insights on their origins.
2 Discovery and data collection
2.1 Discovery in M51
On UT 2019 January 22.6 (MJD = 58505.6), ZTF 19aadyppr was detected as a new OT source in the nearby galaxy M51 by ZTF with the 48 inch Samuel Oschin Telescope (P48) at Palomar Observatory as part of the public ZTF 3 day cadence survey of the visible Northern Sky. The detection passed significance (Masci et al., 2019) and machine-learning thresholds (Tachibana & Miller, 2018; Mahabal et al., 2019), and was released as a public alert (Patterson et al., 2019). We refer to the phase, , as the number of days since the first ZTF detection throughout this work. Located at an R.A. and decl. of (J2000.0), the source had an -band AB magnitude at first detection of . The source was not detected in an earlier image taken on 2019 January 19.6, to a limiting magnitude of , at days. After a second detection on 2019 January 25.5 (MJD = 58508.5), ZTF 19aadyppr was autonomously selected as a high-quality transient by the AMPEL analysis framework (Nordin et al., 2019b). The discovery was submitted to the Transient Name Server and provided the IAU designation AT 2019abn (Nordin et al., 2019a). The source passed several ZTF science-program filters and was saved by human scanners for follow-up on the GROWTH Marshal (Kasliwal et al., 2019). Early spectroscopic observations reported by De et al. (2019) on 2019 January 26 were characterized by a red continuum and strong, intermediate-width ( km s-1) H emission, consistent with a classification of SN impostor or young ILRT. An independent detection was reported to TNS on 2019 January 26 by the the ATLAS survey (Tonry et al., 2018), and the Las Cumbres Observatory (LCO) Global SN Project reported an additional spectrum taken on 2019 March 2 (Burke et al., 2019) and ILRT classification. We use the name M51 OT2019-1 for this event hereafter.
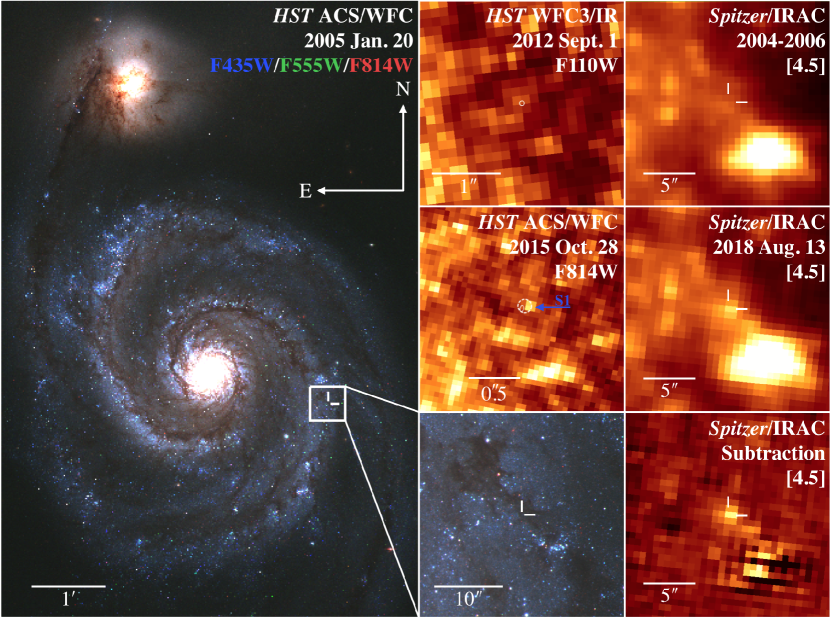
As shown in Figure 1, the transient was located in a star-forming spiral arm of M51, from the galaxy’s center. There is a prominent dust lane at the site, indicating the source may be subject to significant host extinction. Notably, M51 has a high rate of core-collapse SNe, with three known events discovered in the last 25 yr: SN 1994I (type Ic; Schmidt et al., 1994), SN 2005cs (type II; Modjaz et al., 2005), and SN 2011dh (type IIb; Silverman et al., 2011). The NASA/IPAC Extragalactic Database111NED is operated by the Jet Propulsion Laboratory, California Institute of Technology, under contract with the National Aeronautics and Space Administration. (NED) lists 50 individual distance measurements to M51, with a median value in distance modulus of 29.5 mag and a large standard deviation of mag. Throughout this work we assume a distance modulus for M51 from McQuinn et al. (2016, 2017) of (statistical) (systematic; Rizzi et al., 2007) mag based on the luminosity of the tip of the red giant branch (TRGB) method, and that the systematic uncertainties associated with calibrating this method dominate over the statistical measurement uncertainties. We adopt the value from NED for the Galactic extinction toward M51 of mag, based on the Schlafly & Finkbeiner (2011) recalibration of Schlegel et al. (1998), and assuming a standard (Fitzpatrick, 1999) reddening law with .
2.2 Imaging observations
The field containing M51 OT2019-1 was regularly observed at many epochs with the ZTF camera on P48 in the , , and bands. The P48 images were reduced with the ZTF Science Data System pipelines (Masci et al., 2019), which perform image subtraction based on the Zackay et al. (2016) algorithm and point-spread-function (PSF) photometry on the reference-subtracted images. We utilize this photometry for data from the public ZTF survey taken after 2019 January 1. For images taken as part of the ZTF Collaboration surveys and the Caltech surveys (Bellm et al., 2019a), and images taken prior to 2019 January 1 from the first ZTF Public Data Release222https://www.ztf.caltech.edu/page/dr1 (ZTF-DR1), we subsequently performed forced PSF-fitting photometry at the location of M51 OT2019-1, adopting a linear model for pixel values in the difference images as a function of the normalized PSF-model image values and use a Markov Chain Monte Carlo simulation to estimate the photometric uncertainties (Y. Yao et al. 2019, in preparation). Measurements for a given filter taken the same night were then averaged.
Follow-up images in the , , , and bands were obtained with the Sinistro cameras on the Las Cumbres Observatory (LCO; Brown et al., 2013) 1 m telescopes under the program NOAO2019A-011 (PI: N. Blagorodnova). The data were reduced at LCO using the Beautiful Algorithms to Normalize Zillions of Astronomical Images (BANZAI) pipeline (McCully et al., 2018). Photometry from the LCO -band images were computed with the image-subtraction pipeline described in Fremling et al. (2016), with template images from the Sloan Digital Sky Survey (SDSS; Ahn et al., 2014). The pipeline performs PSF-fitting photometry calibrated against several SDSS stars in the field. We performed aperture photometry on M51 OT2019-1 in the LCO -band, with the aperture radius set by the typical full width at half maximum (FWHM) of stars in the images, calibrated against several stars in the Pan-STARRS1 (PS1; Chambers et al., 2016) DR2 catalog (Flewelling et al., 2016).
Additional ground-based follow-up images were obtained in the optical and near-IR at several epochs using the Astrophysical Research Consortium Telescope Imaging Camera (ARCTIC; Huehnerhoff et al., 2016) and Near-Infrared Camera and Fabry-Perot Spectrometer (NICFPS; Vincent et al., 2003) on the Astrophysical Research Consortium (ARC) 3.5 m Telescope at Apache Point Observatory (APO), and the Wide Field Infrared Camera (WIRC; Wilson et al., 2003) on the 200 inch Hale Telescope (P200) at Palomar Observatory. Imaging of M51 at APO was obtained as part of a program to monitor 24 galaxies in the SPitzer Infrared Intensive Transients Survey (SPIRITS; PI: M. Kasliwal; PIDs 10136, 11063, 13053). Optical images were reduced in the standard fashion using bias, dark, and twilight flat-field frames. Our near-IR imaging employed large dithers alternating between the target and a blank sky field approximately every minute to allow for accurate subtraction of the bright near-IR sky background, and individual frames were flat-fielded, background-subtracted, astrometrically aligned with a catalog of Two Micron All Sky Survey (2MASS; Skrutskie et al., 2006) sources, and stacked. We performed aperture photometry at the location of the transient, and used the or magnitudes of several isolated stars in SDSS or 2MASS to measure the photometric zero-points in the optical and near-IR images, respectively.
We also present photometry from CCD images obtained by F. Sims, R. Buchheim, W. Green, M. Hanson, and S. Watson, in the and -bands, and by K. Quin and M. Kendurkar in the Astrodon LRGB filters333Astrodon filter information is available here: https://astrodon.com/products/astrodon-lrgb-gen2-i-series-tru-balance-filters/. For the LRGB frames, we performed aperture photometry on the OT calibrated to standard magnitudes in , , , and , respectively, using SDSS stars in the field and adopting the conversions of Jordi et al. (2006). Observations were obtained in the 3.6 and 4.5 m imaging channels, [3.6] and [4.5], of the Infrared Array Camera (IRAC; Fazio et al., 2004) on board Spitzer (Werner et al., 2004; Gehrz et al., 2007) on 2019 April 7.6 as part of regular monitoring of M51 as part of SPIRITS. We performed image subtraction and aperture photometry as described in more detail for the archival Spitzer/IRAC imaging in Section 3.1.2.
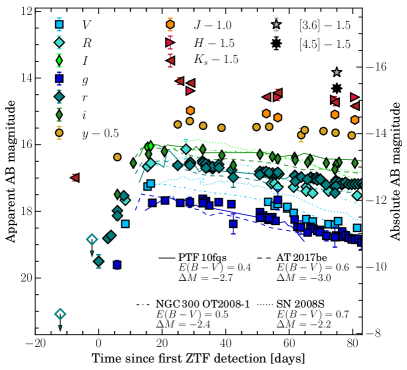
Our photometry of M51 OT2019-1 is shown in Figure 2 on the AB magnitude system, corrected for Galactic extinction. Where appropriate we have converted magnitudes on the Vega system to AB magnitudes using the conversions of Blanton & Roweis (2007).
We also obtained high-resolution, adaptive-optics -band imaging of the transient on 2019 February 16.6, using the near-IR camera (NIRC2; PI: K. Matthews) on the 10 m Keck II Telescope on Maunakea. Further high-resolution imaging was obtained on 2019 March 5.0 with the Hubble Space Telescope (HST) WFC3 camera in the F275W, F336W, and F814W filters as the first target in a test program proposing a new method of HST observing (PI: A. Fruchter; PID SNAP-15675). This new method, called “Rolling Snapshots,” allows fairly rapid response by updating a list of snapshot targets weekly; however, due to present limitations in the Astronomer’s Proposal Tool (APT), the observing is done in a custom subarray mode. Data were reduced using the standard pipelines at STScI, adding a charge-transfer-efficiency (CTE) correction (which was not done by the pipeline due to the use of the custom subarray). CTE-corrected frames were then combined into image mosaics for each filter using AstroDrizzle within PyRAF to attempt to flag cosmic-ray hits. We performed PSF-fitting photometry for the transient using DOLPHOT (Dolphin, 2000, 2016) and obtained , , and mag (Vega scale) for F275W, F336W, and F814W, respectively.
2.3 Spectroscopic observations
We obtained a sequence of optical spectra of M51 OT2019-1 using several instruments covering phases from to days. This includes four spectra with the Alhambra Faint Object Spectrograph and Camera (ALFOSC) on the 2.56 m Nordic Optical Telescope (NOT) at the Spanish Observatorio del Roque de los Muchachos on La Palma, including two low-resolution spectra with the 300 lines mm-1 grism (Gr4) and an epoch of intermediate-resolution spectra using two 600 lines mm-1 grisms (Gr7 and Gr8), five spectra with the Double Beam Spectrograph (DBSP; Oke & Gunn 1982) on P200, one spectrum with the Gemini Multi-Object Spectrograph (GMOS; Hook et al. 2004) on the Gemini North Telescope through our Target of Opportunity program (PI: A. Miller; PID GN-2018B-Q-132), one spectrum with the Spectral Energy Distribution Machine (SEDM; Blagorodnova et al., 2018) on the Palomar 60 inch Telescope (P60), and one spectrum with the Low Resolution Imaging Spectrometer (LRIS; Goodrich & Cohen, 2003) on the Keck I Telescope. The spectra were reduced using standard techniques including wavelength calibration with arc-lamp spectra and flux calibration using spectrophotometric standard stars. In particular, we made use of a custom PyRAF-based reduction pipeline444https://github.com/ebellm/pyraf-dbsp (Bellm & Sesar, 2016) for DBSP spectra, the IDL-based reduction and pipeline LPipe555http://www.astro.caltech.edu/~dperley/programs/lpipe.html (Perley, 2019) for the LRIS spectrum, the fully automated Python-based reduction pipeline pysedm666https://github.com/MickaelRigault/pysedm (Rigault et al., 2019) for the SEDM spectra, and standard tasks in Gemini IRAF package777http://www.gemini.edu/sciops/data-and-results/processing-software for the GMOS spectrum following procedures provided in the GMOS Data Reduction Cookbook888http://ast.noao.edu/sites/default/files/GMOS_Cookbook/.
We also obtained an epoch of near-IR spectroscopy of M51 OT2019-1 with the TripleSpec spectrograph (Herter et al., 2008) on P200. We obtained four exposures of the transient (300 s each) while nodding the transient along the slit between exposures to allow sky subtraction. The data were reduced with a modified version of the IDL-based data reduction package Spextool999http://irtfweb.ifa.hawaii.edu/~cushing/spextool.html (Cushing et al., 2004) for P200/TripleSpec. Corrections for the strong near-IR telluric absorption features and flux calibrations were performed with observations of the A0 V standard star HIP 61471, using the method developed by Vacca et al. (2003) implemented in the IDL tool xtellcor as part of Spextool.
A complete log of our spectroscopic observations is provided in Table 1, and a representative set of our spectral sequence is shown in Figure 3. All of our spectra will be made publicly available at the Weizmann Interactive Supernova Data Repository101010https://wiserep.weizmann.ac.il (WISeREP; Yaron & Gal-Yam, 2012).
| UT Date | MJD | Phase | Tel./Instr. | Range | Resolution |
|---|---|---|---|---|---|
| (days) | (Å) | () | |||
| 2019 Jan 26 | 58509 | 4 | NOT/ALFOSC | 4000–9000 | 280 |
| 2019 Jan 26 | 58509 | 4 | P200/DBSP | 3500–10000 | 700 |
| 2019 Jan 27 | 58510 | 5 | Gemini N/GMOS | 5000–10000 | 1000 |
| 2019 Feb 6 | 58520 | 15 | NOT/ALFOSC | 3650–7110 | 500 |
| 2019 Feb 6 | 58520 | 15 | NOT/ALFOSC | 5680–8580 | 700 |
| 2019 Feb 8 | 58522 | 17 | P60/SEDM | 3650–10000 | 100 |
| 2019 Feb 12 | 58526 | 21 | P200/DBSP | 3500–10000 | 1000 |
| 2019 Feb 20 | 58534 | 29 | P200/TripleSpec | 10000–24000 | 2600 |
| 2019 Feb 23 | 58537 | 32 | NOT/ALFOSC | 3200–9600 | 280 |
| 2019 Mar 7 | 58549 | 44 | Keck I/LRIS | 3500–10300 | 600/1000aaValues given for the blue and red sides of LRIS, respectively. |
| 2019 Mar 16 | 58558 | 53 | P200/DBSP | 3500–10000 | 1000 |
| 2019 Apr 13 | 58586 | 81 | P200/DBSP | 3500–10000 | 1000 |
| 2019 May 13 | 58616 | 111 | P200/DBSP | 3500–10000 | 1000 |
3 Analysis
3.1 Archival imaging and progenitor constraints
3.1.1 Progenitor candidate identification
We searched for the presence of a progenitor star in archival imaging taken with HST and Spitzer/IRAC. To determine the precise position of the transient in the archival HST imaging, we registered the NIRC2 -band image of the transient with the 2015 ACS/WFC F814W image (PID: GO-13804; PI: K. McQuinn) and 2012 WFC3/IR F110W image (PID: 12490; PI: J. Koda). Using several stars and compact background galaxies in common between the new and archival frames, we achieved rms astrometric uncertainties on the position of the transient of 0.44 ACS pixels () in the F814W image and 0.12 WFC3/IR pixels () in the F110W image. We identified an apparent point source at the edge of our 3 error circle in the F814W image (object S1 in Figure 1), but the precision of our registration was insufficient to establish or rule out coincidence with the transient. We thus triggered the new HST observations with WFC3/UVIS, described above in Section 2.2, in order to obtain a more precise position.
We repeated the registrations as above, now using the new WFC3/UVIS F814W image and obtained improved rms astrometric uncertainties on the position of the transient of ACS pixels or in the archival F814W image and 0.1 WFC3/IR pixels () in the F110W image. We show the 3 error ellipses on the position of the transient in each of these images in Figure 1. We performed PSF-fitting photometry on the archival HST images used for registration using DOLPHOT. The nearest star detected in the 2015 F814W frame (object S1; from the transient location) is firmly outside the 3 error ellipse. We note that there is an apparent source at the location of the transient in the archival F110W images, but it appears spatially extended and was not detected by DOLPHOT. Furthermore, the precise position of the transient is offset from the apparent centroid of this source. We thus find it is unlikely that the emission at the location is primarily due to the progenitor, and is more likely a blend of nearby, contaminating sources.
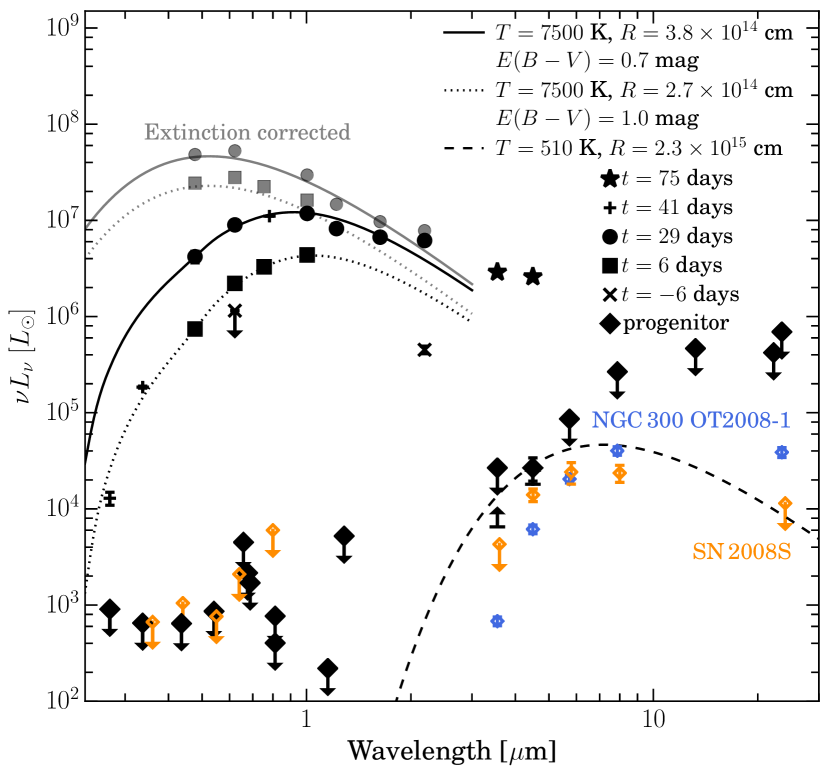
We then used DOLPHOT to obtain limits on the progenitor flux in the extensive archival coverage of the site with HST, including the images from 2005 with ACS/WFC in F435W, F555W, F814W, and F658N (PID: GO-10452; PI: S. Beckwith), 2012 with WFC3/UVIS in F689M and F673N (PID: GO-12762; PI: K. Kuntz), 2012 with WFC3/IR in F110W and F128N (PID: GO-12490; PI: J. Koda), 2014 with WFC3/UVIS in F275W and F336W (PID: GO-13340; PI: S. van Dyk), and 2015 with ACS/WFC in F606W and F814W (PID: GO-13804, PI: K. McQuinn). We adopt 5 limiting magnitudes based on the detection significance of the faintest sources from DOLPHOT within a 100 pixel radius of the transient position. Our full set limits on the progenitor from HST are shown in Figure 4, converted to band luminosities () at the assumed distance to M51 and correcting for Galactic extinction.
Utilizing the extensive archival coverage in the four imaging channels of Spitzer/IRAC, we created deep stacks of all available images and registered them to the new HST imaging with an astrometric rms of . A source consistent with the position of M51 OT2019-1 ( away) is clearly detected in the [4.5] stack. We do not see a clear point source at the location in the other channel stacks. Based on aperture photometry the source has a [4.5] flux of mJy and 3- limiting fluxes of , , and mJy in [3.6], [5.8], and [8.0], respectively. Given the high degree of crowding/blending with nearby emission at [4.5], our measurement of the flux of the putative progenitor may suffer contamination, but as we argue in more detail below and in Section 3.1.2, the majority of the flux is likely attributable to a single source.
We also examined archival imaging coverage of the site with the Multiband Imaging Photometer for Spitzer (MIPS) including 24 m Super Mosaic (2004–2008 stack), and the 70 and 160 m images from 2004 (PID: 159; PI: R. Kennicutt). We derive 3- limiting fluxes from aperture photometry of , , and mJy in the three MIPS imaging bands, respectively. Similarly, we derived limits on the flux of the progenitor from the available imaging coverage with the Wide-field Infrared Survey Explorer (WISE; Wright et al., 2010) from the AllWISE Image Atlas111111Images are available here: https://irsa.ipac.caltech.edu/applications/wise/ at 3.4, 4.6, 12, and 22 m. Our limits of , , , and mJy in the four WISE channels, respectively, are typically less constraining than the corresponding limits from Spitzer largely due to the coarser spatial resolution in WISE imaging.
Using zero-magnitude fluxes (Vega system) given in the Spitzer/IRAC Handbook121212https://irsa.ipac.caltech.edu/data/SPITZER/docs/irac/iracinstrumenthandbook/, we find the precursor source to have mag and mag. Sources with these IR properties are exceptionally rare (Thompson et al., 2009; Khan et al., 2010), indicating that the [4.5] emission is likely associated with a single star, and furthermore the spatial coincidence with M51 OT2019-1 strongly suggests a physical association. The spectral energy distribution (SED) is markedly similar to those of the self-obscured progenitors of SN 2008S and NGC 300 OT2008-1 (see Figure 4). The best-fit blackbody, incorporating the [4.5] detection and [3.6], [5.8], and [8.0] limits, has a temperature of K and luminosity of , though there is significant uncertainty in these parameters. Our constraints at wavelengths m are also relatively weak. Thus, we are unable to rule out emission from cooler circumstellar dust that would indicate a more luminous (and hence more massive) progenitor.
3.1.2 Pre-explosion variability
We examined the considerable coverage of the location with Spitzer/IRAC at [3.6] and [4.5] for historical variability of the progenitor, including regular monitoring since 2014 as part of SPIRITS. The post-basic calibrated data (PBCD) level images were downloaded from the Spitzer Heritage Archive131313https://sha.ipac.caltech.edu/applications/Spitzer/SHA/ and Spitzer Early Release Data Service141414http://ssc.spitzer.caltech.edu/warmmission/sus/mlist/archive/2015/msg007.txt and processed through an automated image-subtraction pipeline (for details see Kasliwal et al., 2017). For reference images, we used the Super Mosaics151515Super Mosaics are available as Spitzer Enhanced Imaging Products through the NASA/IPAC Infrared Science Archive: https://irsa.ipac.caltech.edu/data/SPITZER/Enhanced/SEIP/overview.html consisting of stacks of images obtained between 2004 May 18 and 2006 January 29. In addition to the single epoch images, we performed image subtraction using the same references on our deep [3.6] and [4.5] stacks of all available pre-explosion imaging (described above in Section 3.1.1).
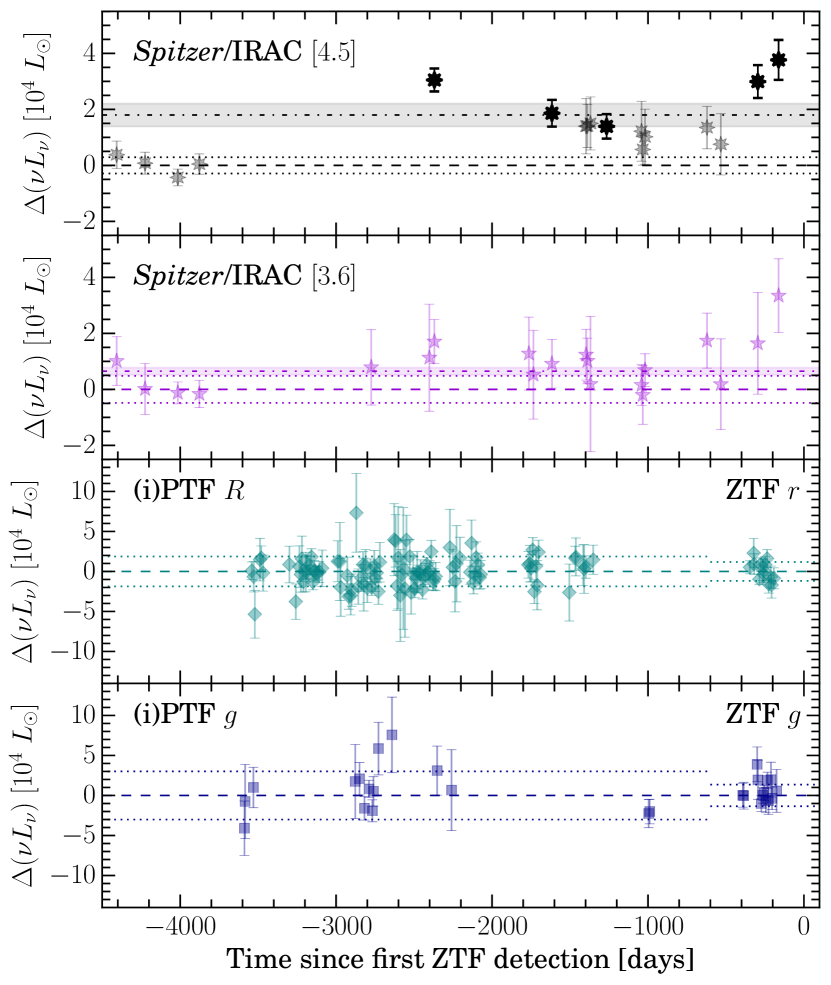
Aperture photometry was performed at the location of M51 OT2019-1 in the difference images, and our resulting differential light curves are shown in Figure 5, converted to band luminosities in . During the years 2006–2008 (– days before discovery), our measurements are consistent with no change compared to the reference level within . In 2012 ( days before discovery), we detect a significant, 4-level increase of . Following this, in the time between 2014 and 2017 (– days before discovery), we note a consistently elevated [4.5] flux at the location at . In the final two epochs of Spitzer coverage, we detect a significant pre-explosion brightening starting sometime between and 300 days before discovery, and rising to the level of at days. At [3.6], the same trends in pre-explosion variability are evident, but at a lower level of significance. In the subtraction of our deep stacks, we detect significant excess flux compared to the reference level of at [3.6] and at [4.5], shown as the dashed–dotted lines and shaded regions in Figure 5.
While the [4.5] flux of the coincident precursor source measured in our deep pre-explosion stack may contain contamination from nearby sources (Section 3.1.1), the variable fluxes detected with image subtraction can be unambiguously attributed to a single source. Associating the variable precursor with the OT, these measurements are thus robust lower limits on the average, pre-explosion flux of the progenitor at [3.6] and [4.5] since 2004. We add these constraints on the progenitor SED to Figure 4.
We obtained constraints on pre-explosion optical variability at the location using the available coverage by the Palomar Transient Factory (Law et al., 2009; Rau et al., 2009) and its successor, the intermediate Palomar Transient Factory, (i)PTF (Cao et al., 2016), and ZTF on P48. For (i)PTF and Mould- band data taken between 2009 and 2016, we utilized forced PSF-fitting photometry at the transient location on the reference-subtracted difference images (Masci et al., 2017). The same procedure as described in Section 2.2 was used to obtain photometry from ZTF difference images for the entire set of - and -band images covering the site from the publicaly available ZTF-DR1, and the Caltech and Partnership surveys since the start of full operations in 2018 March. To obtain deeper limits, we stacked our measurements from (i)PTF and ZTF within 10 day windows, and show the resulting differential optical light curves along with the IR measurements in Figure 5. We see no evidence for significant optical variability at the location in any of the archival P48 coverage at the level of and in the or and -bands, respectively, including during the 2012 and 2017–2018 [4.5] brightening episodes.
3.2 Photometric properties
The multiband optical and near-IR light curves of M51 OT2019-1 are shown in Figure 2. We observe a rise in the optical light curves over a time of days after the first detection by ZTF, after which the source exhibits a relatively flat plateau in the , and bands to at least days. By days, the light curves begin to decline, particularly noticeable in the band. In the band, the source is observed to peak at (Galactic extinction correction only). The optical colors are remarkably red, with values on the rise of , , and mag at days. On the plateau at days, we observe bluer optical colors of , , and mag. In the near-IR, the source was detected 6.5 days before the earliest ZTF detection at , before rising to at days.
Given its red optical colors and location in a dark dust lane, it is likely that M51 OT2019-1 is subject to significant extinction. High amounts of optical extinction have also been inferred for similar transients of the ILRT class, but even among these, M51 OT2019-1 is exceptionally red. As shown in Figure 2, we estimate the excess reddening present in M51 OT2019-1 by comparing its optical light curves to those of the well-studied ILRTs SN 2008S (Botticella et al., 2009), NGC 300 OT2008-1 (Humphreys et al., 2011), PTF 10fqs (Kasliwal et al., 2011), and AT 2017be (Cai et al., 2018). After correcting the light curves for Galactic extinction, we require excess reddening of , 0.5, 0.4, and 0.6 mag for each of those objects, respectively, to match the optical colors of M51 OT2019-1 near peak on the plateau.
The total extinction to M51 OT2019-1 at a given phase is likely due to a combination of attenuation by foreground dust in the host interstellar medium (ISM) as well as internal extinction by dust in the circumstellar medium (CSM). For NGC 300 OT2008-1, Humphreys et al. (2011) estimated the total extinction near the peak of the transient as mag based on comparing its optical colors to those expected for a temperature K inferred from the presence of F-type absorption features in the spectrum. A similar argument was made by Smith et al. (2009) to estimate a total host/CSM extinction to SN 2008S of mag.
As described below in Section 3.3, we observe similar absorption features in the spectra of M51 OT2019-1 throughout its evolution, and thus infer a similar temperature for the continuum emission. Our analysis of the SED derived from photometry at several phases in the evolution of the transient is shown in Figure 4. We observed an early brightening at days in the near-IR band to with a constraining -band nondetection a few days later that suggests the explosion is heavily obscured at early times. At days as the transient rises in the optical, comparing the SED to a reddened blackbody spectrum with K provides a good approximation to the data and suggests mag and a blackbody radius of cm. Near the optical peak on the plateau at days, the SED appears less reddened, and can be approximated by K with mag and cm. The inferred expansion velocity from the evolution of the blackbody radius of km s-1 is notably similar to the observed velocities widths of the H emission lines ( km s-1; Section 3.3). While some amount of extinction can likely be attributed to foreground host extinction, the variable extinction estimate from evolution of the SED indicates a significant contribution from internal CSM dust. In particular, we suggest the color evolution of the SED from rise to peak may be attributed to the continued destruction of CSM dust as the explosion emerges from the dense obscuring wind of the progenitor.
The luminosity of the corresponding unreddened blackbody is , which we adopt as a crude estimate of the intrinsic bolometric luminosity of the explosion at peak. In comparison, the most luminous classical novae reached peak luminosities from – (Gallagher & Ney, 1976; Gehrz et al., 2015), while typical CCSNe reach to (e.g., Valenti et al., 2016). We note, however, the reddened blackbody model significantly overpredicts the observed -band flux at this epoch. We also see evidence for an IR excess in the near-IR -band measurement at days and the later [3.6] and [4.5] measurements from Spitzer at days, suggesting emission from dust is an important component of the SED. Finally, in the SED at days from our HST observations (plus symbols in Figure 4), the measurement in F814W lies near the expectation from the reddened blackbody approximation to the day SED, consistent with the flat evolution of the -band light curves between these epochs; however, the F336W and F275W points are significantly below this expectation, suggesting that there may be additional suppression of the flux in the blue and UV (e.g., line blanketing and/or Balmer continuum absorption) and/or that the assumed Fitzpatrick (1999) extinction law for the diffuse Milky Way ISM may not applicable for heavy internal extinction by circumstellar dust, especially at bluer wavelengths. Additional longer wavelength measurements from ongoing monitoring with Spitzer and self-consistent modeling of the time evolution of the SED will be necessary to better constrain the intrinsic properties of the explosion and the CSM dust.
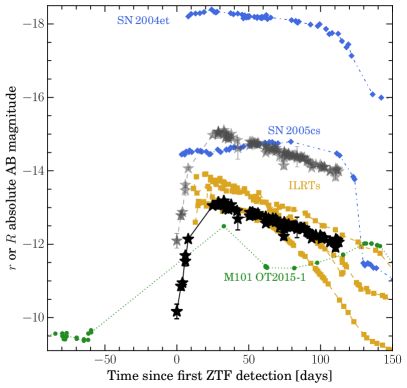
In the right panel of Figure 2, we compare the -band light curve of M51 OT2019-1 to other hydrogen-rich transients. For the sample of ILRTs, we correct for an estimate of the total extinction based on the SED near peak as described above. Assuming mag for M51 OT2019-1, the peak absolute magnitude is . This is notably more luminous than the other proposed members of this class, which fall between to , and is near the range more typical of Type II core-collapse SNe. In fact, with our assumed extinction, M51 OT2019-1 is even more luminous than some low-luminosity Type IIP SNe, e.g., SN 2005cs (Pastorello et al., 2006).
3.3 Spectroscopic properties
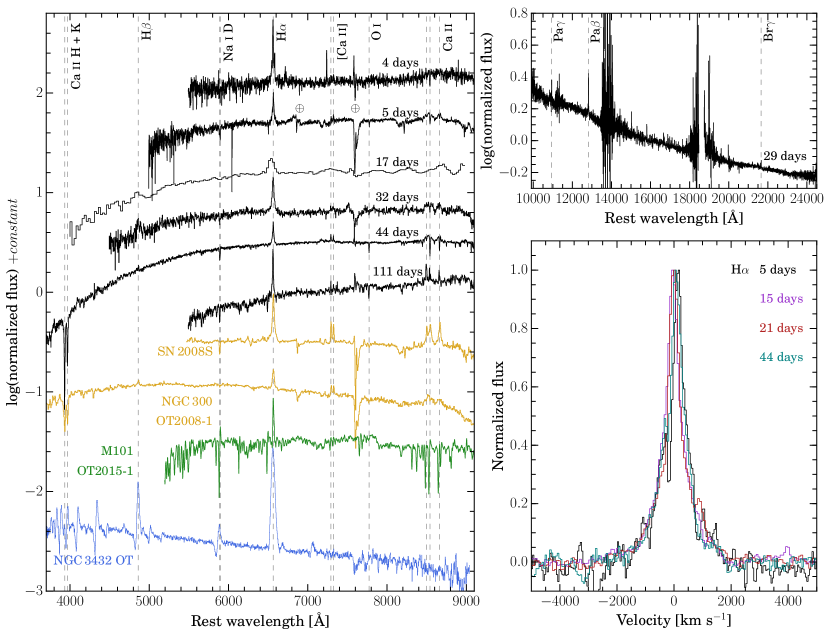
Our spectroscopic observations of M51 OT2019-1 from to 111 days are shown in Figure 3. Here, we briefly describe the important spectral properties and features observed in this event, but reserve a detailed analysis of their evolution to future, more comprehensive studies. The spectra are characterized by a very red continuum, and display prominent H emission along with emission features of the Ca II IR triplet () and [Ca II] (). We detect the Ca II H and K lines (), the Na I D doublet (), and a strong O I blend near 7773 Å in absorption. Superimposed on the broader emission features, we also detect a narrower absorption component for each of the lines of the Ca II triplet. In the near-IR spectrum at days (top right panel of Figure 3), we see additional recombination lines of H in emission including Pa and weaker Pa. In our latest spectrum at days, the continuum has grown notably redder, and the Ca II triplet features have transitioned to predominantly narrower emission features.
These features indicate a wide range of densities in the gas producing the spectrum—reminiscent of a wind or ejected envelope with large inhomogeneities. The observed [Ca II] 7291, 7324 lines have a critical density of cm-3 (Ferland & Persson, 1989) and are strongly suppressed at higher densities. On the other hand, the O I 7773 transition, a quintet frequently observed in transients, is normally populated by collisional transfer from the O I 3p 3P level, which is itself strongly excited by a wavelength coincidence between the H I Ly and O I 1026 transitions (Bowen, 1947). The triplet-to-quintet collisional transfer is only effective at densities cm-3 (Williams, 2012), thus demonstrating a wide range of densities in the gas ejected by the outburst.
Furthermore, as discussed by Humphreys et al. (2011) for NGC 300 OT2008-1, the Ca II and [Ca II] emission lines are sensitive to conditions in the ejecta and clearly evolve with time. The triplet emission lines are formed in the ejecta by radiative de-excitation of electrons in upper levels of the Ca II H and K absorption transitions, leaving the electrons in the upper levels of the [Ca II] lines (Ferland & Persson, 1989). Typically, these electrons are collisionally de-excited to the ground state, unless the densities are low enough. Following Humphreys et al. (2011, 2013), we can estimate the fraction of photons that are radiatively de-excited from the ratio of the equivalent widths of the [Ca II] lines to the Ca II triplet, times the ratio of the expected fluxes for the continuum emission at the corresponding wavelengths of 7300 and 8600 Å. Assuming a K blackbody for the continuum, we estimate photon fractions of and in our and day spectra, respectively, but find a lower value of at days. This is remarkably similar to the evolution for NGC 300 OT2008-1. As suggested by Humphreys et al. (2011), the decline in the photon ratio at later times may indicate an increase in the density where the [Ca II] lines are formed in the ejecta.
The H velocity profiles (bottom right panel of Figure 3) appear symmetric about their peaks, which are consistent with zero velocity in the rest frame of M51. The profiles are characterized by a FWHM velocity of km s-1, much lower than typical velocities observed in CCSNe of km s-1, with broader Thomson-scattering wings extending to km s-1, similar to those seen in NGC 300 OT2008-1 (Humphreys et al., 2011). The days GMOS spectrum shows an apparent absorption feature near km s-1, but we attribute this to a data reduction artifact from oversubtraction of unrelated, background H emission and difficultly in finding a suitably clean region for background subtraction along the slit. We do not see any evidence for significant evolution in the line profile shape or width for the duration of the observations presented here.
The observed absorption spectrum is reminiscent of an F-supergiant. This is expected for an eruption that produces an extended, optically thick wind (Davidson, 1987), and is seen in LBVs/S Doradus variables in their cool, outburst state at maximum (Humphreys & Davidson, 1994), some SN impostors and LBV giant eruptions (e.g. Smith et al., 2011), and is very similar to that of NGC 300 OT2008-1 (Bond et al., 2009; Humphreys et al., 2011) and SN 2008S (Smith et al., 2009). This suggests a temperature of K. The red continuum is therefore suggestive of significant extinction, and we apply this temperature estimate to our SED analysis in Section 3.2 to obtain mag near the peak at days. Overall, the spectral features described above are generally similar to some previously observed SN impostors and ILRTs.
4 Discussion and Conclusions
From our early observations of M51 OT2019-1, we find that the transient is characterized by a day rise in the optical to an observed plateau luminosity of (Galactic extinction correction only). Its spectrum shows strong H emission with FWHM velocities of km s-1. These basic properties are similar to those of multiple classes of transients with luminosities intermediate between those of novae and supernovae, including ILRTs, LRNe, and giant eruptions of LBVs. The photometric evolution of M51 OT2019-1 has transitioned smoothly from the rise to a plateau and subsequent smooth decline after days, consistent with ILRTs and also similar to some SN impostors. It is more dissimilar to LRNe whose light curves are typically irregular and multi-peaked (Sparks et al., 2008; Smith et al., 2016; Blagorodnova et al., 2017) and some other LBV eruptions that may show multiple outbursts or erratic variability (Pastorello et al., 2010; Smith et al., 2010). Our optical spectra show several additional features, including Ca II and [Ca II] in emission, F-type absorption features indicating the light is escaping an optically thick wind at K, and a red continuum indicative of significant extinction. These features are characteristic of ILRTs, but may also be seen in LRNe and giant LBV eruptions. For example, while some LBV eruptions show bluer continua and H lines with strong P Cygni profiles (e.g., NGC 3432 OT; Pastorello et al., 2010), others are indistinguishable from ILRTs (Smith et al., 2010, 2011; Rest et al., 2012; Prieto et al., 2014). We identify a likely progenitor star in archival Spitzer imaging with mag and mag, but there is no detected optical counterpart in archival HST imaging. This is reminiscent of properties of the obscured progenitors of SN 2008S and NGC 300 OT2008-1. We thus suggest M51 OT2019-1 is an ILRT, but with only weak archival constraints at longer wavelengths, we cannot rule out that the progenitor of M51 OT2019-1 is more luminous and massive than the – stars inferred for the ILRT prototypes.
The nature of ILRTs, the mechanism behind their outbursts, and their relation to other impostors and LBV-related transients are debated. One proposed physical scenario involves a weak explosion, possibly the electron-capture-induced collapse of an extreme asymptotic giant branch (AGB) star. In this scenario, an initial flash rapidly destroys the enshrouding circumstellar dust, which later reforms and re-obscures the optical transient (Thompson et al., 2009; Kochanek, 2011; Szczygieł et al., 2012). Thanks to the early discovery of M51 2019OT-1, we find evidence for continued dust destruction during the rise of the transient as our estimate of the reddening evolves from to mag between and days, posing a challenge to such interpretations for this event. Alternatively, Humphreys et al. (2011) suggested that the progenitors of NGC 300 OT2008-1 and, by extension, SN 2008S may have been post-AGB stars in transition to warmer temperatures, thus near their Eddington limits and subject to a range of instabilities. Adopting mag at peak for M51 OT2019-1, the intrinsic luminosity is mag, higher than previously observed ILRTs, though not unusual for some LBV-related SN impostors (Smith et al., 2011), possibly suggesting that these events may represent a continuum of related, explosive phenomena arising from evolved progenitors spanning a wide range of masses. Finally, the observed IR variability of the likely progenitor may be consistent with a long-period ( days), thermally pulsing super-AGB (see the candidate super-AGB MSX SMC 055; Groenewegen et al., 2009), or may hint at eruptive, self-obscuring episodes occurring in the years before the explosion. A complete picture of the event awaits continued monitoring, including ongoing Spitzer observations, to characterize the full SED, dust properties, and energetics. Longer-term, mid-IR spectroscopic observations with the James Webb Space Telescope will disentangle the chemistry, and late-time imaging after the explosion fades away will provide definitive evidence on whether the explosion was terminal.
References
- Adams et al. (2016) Adams, S. M., Kochanek, C. S., Prieto, J. L., et al. 2016, MNRAS, 460, 1645
- Ahn et al. (2014) Ahn, C. P., Alexandroff, R., Allende Prieto, C., et al. 2014, ApJS, 211, 17
- Bellm & Sesar (2016) Bellm, E. C., & Sesar, B. 2016, pyraf-dbsp: Reduction pipeline for the Palomar Double Beam Spectrograph, Astrophysics Source Code Library, ascl:1602.002
- Bellm et al. (2019a) Bellm, E. C., Kulkarni, S. R., Barlow, T., et al. 2019a, PASP, 131, 068003
- Bellm et al. (2019b) Bellm, E. C., Kulkarni, S. R., Graham, M. J., et al. 2019b, PASP, 131, 018002
- Berger et al. (2009) Berger, E., Soderberg, A. M., Chevalier, R. A., et al. 2009, ApJ, 699, 1850
- Blagorodnova et al. (2017) Blagorodnova, N., Kotak, R., Polshaw, J., et al. 2017, ApJ, 834, 107
- Blagorodnova et al. (2018) Blagorodnova, N., Neill, J. D., Walters, R., et al. 2018, PASP, 130, 035003
- Blanton & Roweis (2007) Blanton, M. R., & Roweis, S. 2007, AJ, 133, 734
- Bond (2011) Bond, H. E. 2011, ApJ, 737, 17
- Bond et al. (2009) Bond, H. E., Bedin, L. R., Bonanos, A. Z., et al. 2009, ApJ, 695, L154
- Bond & Siegel (2006) Bond, H. E., & Siegel, M. H. 2006, AJ, 131, 984
- Bond et al. (2003) Bond, H. E., Henden, A., Levay, Z. G., et al. 2003, Nature, 422, 405
- Botticella et al. (2009) Botticella, M. T., Pastorello, A., Smartt, S. J., et al. 2009, MNRAS, 398, 1041
- Bowen (1947) Bowen, I. S. 1947, PASP, 59, 196
- Brown et al. (2013) Brown, T. M., Baliber, N., Bianco, F. B., et al. 2013, PASP, 125, 1031
- Burke et al. (2019) Burke, J., Howell, D. A., Arcavi, I., et al. 2019, Transient Name Server Classification Report, 328
- Cai et al. (2018) Cai, Y.-Z., Pastorello, A., Fraser, M., et al. 2018, MNRAS, 480, 3424
- Cao et al. (2016) Cao, Y., Nugent, P. E., & Kasliwal, M. M. 2016, PASP, 128, 114502
- Chambers et al. (2016) Chambers, K. C., Magnier, E. A., Metcalfe, N., et al. 2016, arXiv e-prints, arXiv:1612.05560 [astro-ph.IM]
- Cushing et al. (2004) Cushing, M. C., Vacca, W. D., & Rayner, J. T. 2004, PASP, 116, 362
- Davidson (1987) Davidson, K. 1987, ApJ, 317, 760
- De et al. (2019) De, K., Tartaglia, L., Andreoni, I., et al. 2019, The Astronomer’s Telegram, 12433
- Dolphin (2016) Dolphin, A. 2016, DOLPHOT: Stellar photometry, Astrophysics Source Code Library, ascl:1608.013
- Dolphin (2000) Dolphin, A. E. 2000, PASP, 112, 1383
- Fazio et al. (2004) Fazio, G. G., Hora, J. L., Allen, L. E., et al. 2004, ApJS, 154, 10
- Ferland & Persson (1989) Ferland, G. J., & Persson, S. E. 1989, ApJ, 347, 656
- Fitzpatrick (1999) Fitzpatrick, E. L. 1999, PASP, 111, 63
- Flewelling et al. (2016) Flewelling, H. A., Magnier, E. A., Chambers, K. C., et al. 2016, arXiv e-prints, arXiv:1612.05243 [astro-ph.IM]
- Fremling et al. (2016) Fremling, C., Sollerman, J., Taddia, F., et al. 2016, A&A, 593, A68
- Gallagher & Ney (1976) Gallagher, J. S., & Ney, E. P. 1976, ApJ, 204, L35
- Gehrz et al. (2007) Gehrz, R. D., Roellig, T. L., Werner, M. W., et al. 2007, Review of Scientific Instruments, 78, 011302
- Gehrz et al. (2015) Gehrz, R. D., Evans, A., Helton, L. A., et al. 2015, ApJ, 812, 132
- Goodrich & Cohen (2003) Goodrich, R., & Cohen, M. 2003, in Proc. SPIE, Vol. 4843, Polarimetry in Astronomy, ed. S. Fineschi, 146
- Graham et al. (2019) Graham, M. J., Kulkarni, S. R., Bellm, E. C., et al. 2019, PASP, 131, 078001
- Groenewegen et al. (2009) Groenewegen, M. A. T., Sloan, G. C., Soszyński, I., & Petersen, E. A. 2009, A&A, 506, 1277
- Hack et al. (2012) Hack, W. J., Dencheva, N., Fruchter, A. S., et al. 2012, in American Astronomical Society Meeting Abstracts, Vol. 220, American Astronomical Society Meeting Abstracts #220, 135.15
- Herter et al. (2008) Herter, T. L., Henderson, C. P., Wilson, J. C., et al. 2008, in Proc. SPIE, Vol. 7014, Ground-based and Airborne Instrumentation for Astronomy II, 70140X
- Hook et al. (2004) Hook, I. M., Jørgensen, I., Allington-Smith, J. R., et al. 2004, PASP, 116, 425
- Huehnerhoff et al. (2016) Huehnerhoff, J., Ketzeback, W., Bradley, A., et al. 2016, in Proc. SPIE, Vol. 9908, Ground-based and Airborne Instrumentation for Astronomy VI, 99085H
- Humphreys et al. (2011) Humphreys, R. M., Bond, H. E., Bedin, L. R., et al. 2011, ApJ, 743, 118
- Humphreys & Davidson (1994) Humphreys, R. M., & Davidson, K. 1994, PASP, 106, 1025
- Humphreys et al. (2013) Humphreys, R. M., Davidson, K., Grammer, S., et al. 2013, ApJ, 773, 46
- Humphreys et al. (1999) Humphreys, R. M., Davidson, K., & Smith, N. 1999, PASP, 111, 1124
- Jordi et al. (2006) Jordi, K., Grebel, E. K., & Ammon, K. 2006, A&A, 460, 339
- Kasliwal et al. (2011) Kasliwal, M. M., Kulkarni, S. R., Arcavi, I., et al. 2011, ApJ, 730, 134
- Kasliwal et al. (2017) Kasliwal, M. M., Bally, J., Masci, F., et al. 2017, ApJ, 839, 88
- Kasliwal et al. (2019) Kasliwal, M. M., Cannella, C., Bagdasaryan, A., et al. 2019, PASP, 131, 038003
- Khan et al. (2010) Khan, R., Stanek, K. Z., Prieto, J. L., et al. 2010, ApJ, 715, 1094
- Kochanek (2011) Kochanek, C. S. 2011, ApJ, 741, 37
- Kulkarni et al. (2007) Kulkarni, S. R., Ofek, E. O., Rau, A., et al. 2007, Nature, 447, 458
- Law et al. (2009) Law, N. M., Kulkarni, S. R., Dekany, R. G., et al. 2009, PASP, 121, 1395
- Maguire et al. (2010) Maguire, K., Di Carlo, E., Smartt, S. J., et al. 2010, MNRAS, 404, 981
- Mahabal et al. (2019) Mahabal, A., Rebbapragada, U., Walters, R., et al. 2019, PASP, 131, 038002
- Masci et al. (2017) Masci, F. J., Laher, R. R., Rebbapragada, U. D., et al. 2017, PASP, 129, 014002
- Masci et al. (2019) Masci, F. J., Laher, R. R., Rusholme, B., et al. 2019, PASP, 131, 018003
- McCully et al. (2018) McCully, C., Volgenau, N. H., Harbeck, D.-R., et al. 2018, in Society of Photo-Optical Instrumentation Engineers (SPIE) Conference Series, Vol. 10707, Software and Cyberinfrastructure for Astronomy V, 107070K
- McQuinn et al. (2016) McQuinn, K. B. W., Skillman, E. D., Dolphin, A. E., Berg, D., & Kennicutt, R. 2016, ApJ, 826, 21
- McQuinn et al. (2017) —. 2017, AJ, 154, 51
- Modjaz et al. (2005) Modjaz, M., Kirshner, R., Challis, P., & Hutchins, R. 2005, IAU Circ., 8555
- Nordin et al. (2019a) Nordin, J., Brinnel, V., Giomi, M., et al. 2019a, Transient Name Server Discovery Report, 141
- Nordin et al. (2019b) Nordin, J., Brinnel, V., van Santen, J., et al. 2019b, arXiv e-prints, arXiv:1904.05922 [astro-ph.IM]
- Oke & Gunn (1982) Oke, J. B., & Gunn, J. E. 1982, PASP, 94, 586
- Pastorello et al. (2006) Pastorello, A., Sauer, D., Taubenberger, S., et al. 2006, MNRAS, 370, 1752
- Pastorello et al. (2010) Pastorello, A., Botticella, M. T., Trundle, C., et al. 2010, MNRAS, 408, 181
- Patterson et al. (2019) Patterson, M. T., Bellm, E. C., Rusholme, B., et al. 2019, PASP, 131, 018001
- Perley (2019) Perley, D. A. 2019, PASP, 131, 084503
- Pessev et al. (2019) Pessev, P., Jones, D., Pejcha, O., et al. 2019, The Astronomer’s Telegram, 12506
- Prieto (2008) Prieto, J. L. 2008, The Astronomer’s Telegram, 1550
- Prieto et al. (2008) Prieto, J. L., Kistler, M. D., Thompson, T. A., et al. 2008, ApJ, 681, L9
- Prieto et al. (2014) Prieto, J. L., Rest, A., Bianco, F. B., et al. 2014, ApJ, 787, L8
- Rau et al. (2009) Rau, A., Kulkarni, S. R., Law, N. M., et al. 2009, PASP, 121, 1334
- Rest et al. (2012) Rest, A., Prieto, J. L., Walborn, N. R., et al. 2012, Nature, 482, 375
- Rich et al. (1989) Rich, R. M., Mould, J., Picard, A., Frogel, J. A., & Davies, R. 1989, ApJ, 341, L51
- Rigault et al. (2019) Rigault, M., Neill, J. D., Blagorodnova, N., et al. 2019, A&A, 627, A115
- Rizzi et al. (2007) Rizzi, L., Tully, R. B., Makarov, D., et al. 2007, ApJ, 661, 815
- Schlafly & Finkbeiner (2011) Schlafly, E. F., & Finkbeiner, D. P. 2011, ApJ, 737, 103
- Schlegel et al. (1998) Schlegel, D. J., Finkbeiner, D. P., & Davis, M. 1998, ApJ, 500, 525
- Schmidt et al. (1994) Schmidt, B., Kirshner, R., Peters, J., & Bernstein, G. 1994, IAU Circ., 5962
- Silverman et al. (2011) Silverman, J. M., Filippenko, A. V., & Cenko, S. B. 2011, The Astronomer’s Telegram, 3398
- Skrutskie et al. (2006) Skrutskie, M. F., Cutri, R. M., Stiening, R., et al. 2006, AJ, 131, 1163
- Smith (2014) Smith, N. 2014, ARA&A, 52, 487
- Smith et al. (2011) Smith, N., Li, W., Silverman, J. M., Ganeshalingam, M., & Filippenko, A. V. 2011, MNRAS, 415, 773
- Smith & Owocki (2006) Smith, N., & Owocki, S. P. 2006, ApJ, 645, L45
- Smith et al. (2009) Smith, N., Ganeshalingam, M., Chornock, R., et al. 2009, ApJ, 697, L49
- Smith et al. (2010) Smith, N., Miller, A., Li, W., et al. 2010, AJ, 139, 1451
- Smith et al. (2016) Smith, N., Andrews, J. E., Van Dyk, S. D., et al. 2016, MNRAS, 458, 950
- Sparks et al. (2008) Sparks, W. B., Bond, H. E., Cracraft, M., et al. 2008, AJ, 135, 605
- Szczygieł et al. (2012) Szczygieł, D. M., Prieto, J. L., Kochanek, C. S., et al. 2012, ApJ, 750, 77
- Tachibana & Miller (2018) Tachibana, Y., & Miller, A. A. 2018, PASP, 130, 128001
- Thompson et al. (2009) Thompson, T. A., Prieto, J. L., Stanek, K. Z., et al. 2009, ApJ, 705, 1364
- Tody (1986) Tody, D. 1986, in Proc. SPIE, Vol. 627, Instrumentation in astronomy VI, ed. D. L. Crawford, 733
- Tody (1993) Tody, D. 1993, in Astronomical Society of the Pacific Conference Series, Vol. 52, Astronomical Data Analysis Software and Systems II, ed. R. J. Hanisch, R. J. V. Brissenden, & J. Barnes, 173
- Tonry et al. (2018) Tonry, J. L., Denneau, L., Heinze, A. N., et al. 2018, PASP, 130, 064505
- Tylenda et al. (2011) Tylenda, R., Hajduk, M., Kamiński, T., et al. 2011, A&A, 528, A114
- Vacca et al. (2003) Vacca, W. D., Cushing, M. C., & Rayner, J. T. 2003, PASP, 115, 389
- Valenti et al. (2016) Valenti, S., Howell, D. A., Stritzinger, M. D., et al. 2016, MNRAS, 459, 3939
- Van Dyk et al. (2000) Van Dyk, S. D., Peng, C. Y., King, J. Y., et al. 2000, PASP, 112, 1532
- Vincent et al. (2003) Vincent, M. B., Morse, J. A., Beland, S., et al. 2003, in Proc. SPIE, Vol. 4841, Instrument Design and Performance for Optical/Infrared Ground-based Telescopes, ed. M. Iye & A. F. M. Moorwood, 367
- Werner et al. (2004) Werner, M. W., Roellig, T. L., Low, F. J., et al. 2004, ApJS, 154, 1
- Williams (2012) Williams, R. 2012, AJ, 144, 98
- Wilson et al. (2003) Wilson, J. C., Eikenberry, S. S., Henderson, C. P., et al. 2003, in Proc. SPIE, Vol. 4841, Instrument Design and Performance for Optical/Infrared Ground-based Telescopes, ed. M. Iye & A. F. M. Moorwood, 451
- Wright et al. (2010) Wright, E. L., Eisenhardt, P. R. M., Mainzer, A. K., et al. 2010, AJ, 140, 1868
- Yaron & Gal-Yam (2012) Yaron, O., & Gal-Yam, A. 2012, PASP, 124, 668
- Zackay et al. (2016) Zackay, B., Ofek, E. O., & Gal-Yam, A. 2016, ApJ, 830, 27