Now at ]Department of Chemistry and Chemical Technology, Bronx Community College, Bronx, New York 10453
The Daya Bay Collaboration
Extraction of the 235U and 239Pu Antineutrino Spectra at Daya Bay
Abstract
This Letter reports the first extraction of individual antineutrino spectra from 235U and 239Pu fission and an improved measurement of the prompt energy spectrum of reactor antineutrinos at Daya Bay. The analysis uses inverse beta-decay candidates in four near antineutrino detectors in 1958 days. The individual antineutrino spectra of the two dominant isotopes, 235U and 239Pu, are extracted using the evolution of the prompt spectrum as a function of the isotope fission fractions. In the energy window of 4–6 MeV, a 7% (9%) excess of events is observed for the 235U (239Pu) spectrum compared with the normalized Huber-Mueller model prediction. The significance of discrepancy is for 235U spectral shape compared with the Huber-Mueller model prediction. The shape of the measured inverse beta-decay prompt energy spectrum disagrees with the prediction of the Huber-Mueller model at . In the energy range of 4–6 MeV, a maximal local discrepancy of is observed.
Nuclear reactors are powerful sources of electron antineutrinos () and have played an important role in neutrino physics. Most recently, Daya Bay An et al. (2012, 2013, 2014, 2015, 2017a); Adey et al. (2018a), RENO Ahn et al. (2012); Bak et al. (2018), and Double Chooz Abe et al. (2012); De Kerret et al. (2019) Collaborations reported observations of neutrino oscillation induced by a nonzero mixing angle . In addition, these experiments also provided measurements of reactor flux and spectrum An et al. (2016a, 2017b); Seo (2015); Abe et al. (2014) at distances of 300–500 m from the reactors. The flux measurements confirmed the 6% deficit found in the 2011 reevaluation Mueller et al. (2011); Huber (2011) of the reactor flux (“reactor antineutrino anomaly” Mention et al. (2011)). The spectral measurements indicated a new anomaly (“5-MeV bump”) when compared with theoretical calculations, an observation further confirmed by the NEOS Collaboration Ko et al. (2017), and by reexamination of earlier reactor antineutrino data Zacek et al. (2018). Observation of the evolution of the reactor spectrum from commercial reactors Klimov et al. (1994); An et al. (2017c); Bak et al. (2019); Danilov (2018) and measurement of the 235U spectrum from highly enriched uranium research reactors Kwon et al. (1981); Ashenfelter et al. (2019) have also been performed, providing first glimpses at the dependence of spectral features on reactor fuel content. Interpretations of the reactor flux and spectrum anomalies reveal the complexes in the fission beta spectrum conversion and nuclear databases Hayes et al. (2014); Dwyer and Langford (2015); Fang and Brown (2015); Hayes et al. (2015); Sonzogni et al. (2016, 2017); Gebre et al. (2018). Additional precision measurements are essential to fully investigate the origins of the reactor flux and spectrum anomalies, and provide crucial inputs to future reactor neutrino experiments An et al. (2016b).
This Letter reports the extracted individual prompt energy spectra of two dominant isotopes (235U and 239Pu) for the first time by fitting the evolution of the prompt energy spectrum as a function of fission fractions from commercial reactors. In addition, an improved measurement of the prompt energy spectrum of reactor is reported with three times more events and reduced systematic uncertainties compared with previous results An et al. (2017b).
The Daya Bay Reactor Neutrino Experiment is located near the Daya Bay nuclear power plant, which hosts six commercial pressurized-water reactors (2.9 GW maximum thermal power). Identically designed detectors (ADs) are deployed in two near halls (EH1 and EH2) containing two ADs each and in the far hall (EH3) with four ADs. The analysis uses 1958 days of data from four near ADs. Details about the experiment and the data set are given in Refs. An et al. (2016c); Adey et al. (2018a).
In a typical commercial reactor, antineutrinos are produced from thousands of beta-decay branches of the fission products from four major isotopes, 235U, 239Pu, 238U, and 241Pu. The spectrum is measured with inverse beta-decay (IBD) reactions: . The predicted energy spectrum in a detector at a given time is calculated as
| (1) |
where is the energy, is the detector index, is the reactor index, is the target proton number, is the detection efficiency, is the distance from detector to reactor , is the survival probability in the standard three-neutrino model, and is the IBD cross section. The energy spectrum of antineutrinos from one reactor is
| (2) |
where is the thermal power of reactor , is the energy released per fission for isotope , is the fission fraction, is the energy spectrum per fission for each isotope, is a function of the order of unity absorbing the correction due to nonequilibrium effects, and are contributions from spent nuclear fuel (SNF) and from nuclides with flux with a nonlinear dependence on reactor neutron flux Huber and Jaffke (2016), respectively.
For in Eq. 2, the 235U, 239Pu, and 241Pu spectra from Huber Huber (2011) and 238U spectrum from Mueller Mueller et al. (2011) are used in the prediction (Huber-Mueller model). Thermal power and fission fraction data are provided by the Daya Bay nuclear power plant with uncertainties of 0.5% and 5% An et al. (2017b), respectively. The correlations of fission fractions among the four isotopes are taken from Ref. An et al. (2017b). The energies released per fission () are taken from Ref. Ma et al. (2013).
In contrast to previous Daya Bay analyses, the nonequilibrium correction and contributions from SNF and nonlinear nuclides are estimated and added to the flux prediction with time evolution. The nonequilibrium effect exists for ILL measurements Schreckenbach et al. (1985); Von Feilitzsch et al. (1982); Hahn et al. (1989), which are the basis of the Huber-Mueller model, due to a limited irradiation time. The correction of the nonequilibrium effect () for each batch of fuel elements is calculated daily based on the irradiation time Mueller et al. (2011). The SNF (), including contribution from the storage water pool and the shutdown reactor core, is calculated daily using the refueling history provided by the power plant. The flux from some nuclides has a nonlinear dependence on the neutron flux in a reactor core Huber and Jaffke (2016). The correction for these nonlinear nuclides is obtained as a function of time and contributes of the total flux.
The IBD candidates in the four near ADs and the expected backgrounds from Ref. Adey et al. (2018a) are used in this analysis. The accidental and Am-C correlated backgrounds are estimated daily in each AD. The cosmogenic 9Li/8He, fast neutron, and 13C(, n)16O backgrounds are treated as constants in time. The IBD detection efficiency is 80.25% with a correlated uncertainty of 1.19% Adey et al. (2018b) and an uncorrelated uncertainty of 0.13% among ADs. The oscillation parameters and eV2 from Ref. Adey et al. (2018a) are used to correct for the oscillation effect, namely in Eq. 1.
The predicted prompt energy spectrum is determined from the spectrum taking into account the effects of IBD kinematics, energy leakage, and energy resolution. A model of the nonlinear energy response is used to correct the measured prompt energy spectrum of the IBD candidates Adey et al. (2019) to facilitate the comparison of spectra between different experiments 111In the previous spectrum measurements An et al. (2016a, 2017b), the energy response was not corrected in the measured prompt energy spectrum, but it was applied to the predicted energy spectrum.. The magnitude of the nonlinear correction is 10% at maximum with a 0.5% uncertainty at 3 MeV Adey et al. (2019), improved from 1% previously An et al. (2017b).
The evolution of fission fractions of the four major isotopes in multiple refueling cycles is shown in Fig. 1 for the six reactors during operation. The dominant isotopes contributing to the prompt spectrum are 235U and 239Pu, as their fission fractions add up to 87%.

Each isotope produces a unique spectrum depending on its fission products and corresponding beta-decay spectra Fallot et al. (2012); Hayes and Vogel (2016). Since the observed prompt energy spectrum in one AD is a combination of the individual spectra of four isotopes, it evolves as a function of fission fractions An et al. (2017c); Bak et al. (2019); Hayes et al. (2018); Huber (2017). In order to describe the relative contribution of each isotope in one AD from the six reactors, we define an effective fission fraction for isotope observed by detector as
| (3) |
The variation of detectorwise effective fission fraction of 235U (239Pu) is 50%–65% (24%–35%), smaller than the variation of reactorwise fission fraction shown in Fig. 1.
The 1958 days of data are divided into 20 groups ordered by the 239Pu effective fission fraction in each week for each AD. The evolution of the prompt energy spectrum is dominated by 235U and 239Pu, while it is less sensitive to 238U and 241Pu due to smaller fission fractions. To extract the individual spectra of the 235U and 239Pu isotopes, and , respectively, from the prompt energy spectrum, a function in the Poisson-distributed form is constructed as
| (4) |
where is the detector index, is the index of the data groups, is the prompt energy bin, is the measured prompt energy spectrum of each data group, is a set of nuisance parameters, is the term to constrain the nuisance parameters incorporating systematic uncertainties and their correlations () among the reactors, detectors, and data groups, and
| (5) |
is the corresponding expected prompt energy spectrum without normalization, [] is the element of extracted 235U (239Pu) spectrum at energy bin , [] is the corresponding coefficient for the 235U (239Pu) taking into account the detector target mass, detection efficiency, baseline, and number of fissions, is the expected prompt energy spectra contributed from 238U and 241Pu, and includes contributions from the SNF, nonlinear nuclides, and backgrounds. The Huber-Mueller flux model is used to calculate the initial prompt energy spectrum for the four isotopes. Two sets of free parameters, and , are applied to the 26 energy bins correcting the initial 235U and 239Pu spectra, respectively. As a result, the individual 235U and 239Pu spectra corrected with the best fit values of and do not depend on the input of the initial spectra. For the 238U and 241Pu spectra, nuisance parameters are incorporated in each energy bin to vary the initial spectra within their uncertainties. We conservatively enlarge the uncertainties of the 238U and 241Pu spectra quoted in the Huber-Mueller model based on the investigations of the antineutrino spectrum evaluations from nuclear databases Mueller et al. (2011); Mention et al. (2011). For the 238U spectrum, the uncertainty is 15% in 0.7–4.5 MeV, 20% in 4.5–6 MeV, 30% in 6–7 MeV, and 60% in 7–8 MeV, and for 241Pu it is 10% in 0.7–7 MeV and 50% in 7–8 MeV. Additional normalization uncertainties of 15% and 10% An et al. (2017c) are assigned to the 238U and 241Pu spectra, respectively.
The time dependence of reactor antineutrino production and detector response, and their impact on the 235U and 239Pu spectra, are examined. The drift of the energy scale is controlled to and the relative variation of energy resolution in the 20 data groups is 3%. Therefore, the detector energy response An et al. (2017b) is treated as stable with its uncertainty treated as time independent. The uncertainties of reactor power and fission fractions are treated as correlated between the data groups, and treating them as uncorrelated has a negligible effect in this analysis.
Performing the fit with one energy bin covering the whole spectrum (0.7–8 MeV), we obtain the IBD yields of cm2/fission and cm2/fission for 235U and 239Pu, respectively, with a . The ratios to the expected IBD yield from the Huber-Mueller model are and for 235U and 239Pu, respectively, consistent with the previous analysis An et al. (2017c). Removing the time dependence of the nonequilibrium effect, SNF, and nonlinear nuclides produces a shift of less than 0.7% in the IBD yields of 235U and 239Pu.
The top panel of Fig. 2 shows the extracted 235U and 239Pu spectra together with their Huber-Mueller predictions normalized to the best-fit numbers of events for 235U (0.920) and 239Pu (0.990), respectively. In the middle panel, the ratios of the extracted spectra to the corresponding predicted spectra are shown. An edge around 4 MeV is found in the 239Pu spectrum compared to the prediction. Analysis with a different data grouping, or analysis with only EH1 or EH2 data shows a similar edge. In the energy window of 4–6 MeV, a 7% (9%) excess of events is observed for 235U (239Pu) spectrum compared with the normalized Huber-Mueller model prediction. A test is performed to quantify the local discrepancy between the extracted 235U and 239Pu spectra and their corresponding predicted spectra following the method in Ref. An et al. (2017b). As shown in the bottom panel of Fig. 2, the features of the 239Pu in 3–4 MeV show a 1 local discrepancy. The maximum local discrepancy is for the 235U spectrum, and only for the 239Pu spectrum because of larger uncertainties. If the 239Pu spectrum is fixed to have the same spectral shape discrepancy as the 235U spectrum in 4–6 MeV, we obtain a change in the value, = 4.0/8, corresponding to a 0.2 inconsistency. Thus, the Daya Bay data indicate an incorrect prediction of the 235U spectrum, but such a conclusion cannot be drawn for the other primary fission isotopes. Combining the results of IBD yield and spectral shape, we deduce that the 8% deficit of 235U IBD yield is dominated by the deficit in the energy range below 4 MeV with a significance of 4 with respect to the Huber-Mueller model prediction without normalization.
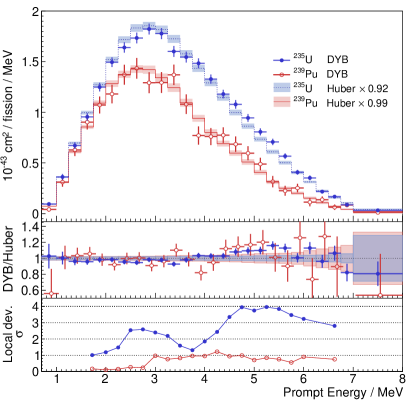
The fractional size of the diagonal elements of the covariance matrix is shown in the bottom panel of Fig. 3, which is for 235U and for 239Pu around 3 MeV. The statistical uncertainty contributes to about 55% (60%) of the total uncertainty of 235U (239Pu). The uncertainties from the input 238U and 241Pu spectra and rates contribute about 35% for both 235U and 239Pu. The other uncertainties contribute to about (5%) for 235U (239Pu). The spectral uncertainties of 235U and 239Pu are anticorrelated with correlation coefficients between and . The 235U and 239Pu spectra as well as their associated covariance matrix are provided in the Supplemental Material bib . An independent analysis based on Bayesian inference using Markov Chain Monte Carlo calculations with different data grouping obtains consistent results.
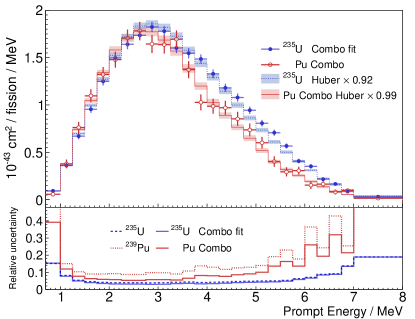
The extracted spectra of 235U and 239Pu have a certain dependence on the inputs of the 238U and 241Pu spectra. The fission fraction of 241Pu is approximately proportional to 239Pu as shown in Fig. 1, thus, they can be treated as one component in the contribution to the prompt energy spectrum. A combination of 239Pu and 241Pu spectra ( and ), as an invariant spectrum independent of the fission fractions, is defined as . The coefficient of 0.183 is the average fission fraction ratio of 241Pu to 239Pu in 1958 days, shown as a line in Fig. 1. The residual contribution of 241Pu spectrum is corrected using the Huber-Mueller model for some data groups when the fission fraction ratios of 241Pu to 239Pu deviate from 0.183. With this combination of 239Pu and 241Pu, the dependence on the input 241Pu spectrum is largely removed. The top panel of Fig. 3 shows the extracted 235U spectrum and compared with the normalized Huber-Mueller model predictions. The bottom panel shows the uncertainties of extracted spectra. The uncertainty of is 6% around 3 MeV, improved from 9% in the case of no combination. The extracted can be used to predict the spectrum in experiments with a similar fission fraction ratio of 241Pu to 239Pu.
The time-averaged IBD yield is measured to be cm2/fission, where the statistical uncertainty is 0.05% and the systematic uncertainty is 1.5% taken from Table 1 in Ref. Adey et al. (2018b). The corresponding average fission fractions for the four major isotopes 235U, 239Pu, 238U, and 241Pu are 0.564, 0.304, 0.076, 0.056, respectively. The ratio of the measured IBD yield to the Huber-Mueller model prediction is (exp.) (model).
Figure 4 shows the spectrum comparison of the measurement with the Huber-Mueller model prediction normalized to the measured number of events. The measurement and prediction show a large discrepancy particularly near 5 MeV. With a sliding 2-MeV window scanning following Ref. An et al. (2017b), the largest local discrepancy is found in 4–6 MeV, with a significance of 6.3. The global discrepancy of the entire spectrum in 0.7–8 MeV has a significance of 5.3.
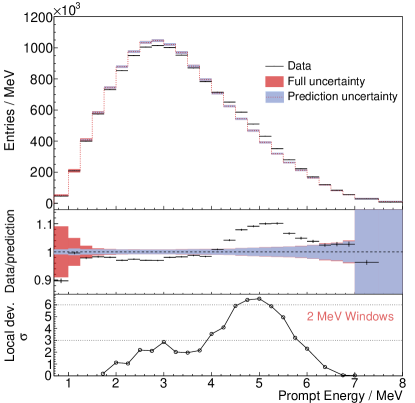
In summary, the IBD yields and prompt energy spectra of 235U and 239Pu as the two dominant components in commercial reactors are obtained for the first time using the evolution of the prompt spectrum as a function of fission fractions. The spectral shape comparison shows similar excesses of events in 4–6 MeV for both 235U (7%) and 239Pu (9%). The significance of discrepancy for the 235U spectral shape is 4.0 while it is 1.2 for the 239Pu spectrum due to a larger uncertainty. In addition, an improved measurement of the prompt energy spectrum of reactor is reported with a more precise energy response model and 1958 days of data. The discrepancy between the measured spectrum shape and the prediction is found to be 5.3 and 6.3 in the entire energy range of 0.7–8 MeV and in a local energy range of 4–6 MeV, respectively. These discrepancies suggest incorrect spectrum prediction in the Huber-Mueller model, as has been indicated in other theoretical works Hayes et al. (2014); Fang and Brown (2015); Sonzogni et al. (2017). Direct measurements of the antineutrino flux and spectrum, and the extraction of the 235U and 239Pu spectra provide alternative reference spectra for other reactor antineutrino experiments.
This work was supported in part by the Ministry of Science and Technology of China, the U.S. Department of Energy, the Chinese Academy of Sciences, the CAS Center for Excellence in Particle Physics, the National Natural Science Foundation of China, the Guangdong provincial government, the Shenzhen municipal government, the China General Nuclear Power Group, the Research Grants Council of the Hong Kong Special Administrative Region of China, the Ministry of Education in Taiwan, the U.S. National Science Foundation, the Ministry of Education, Youth, and Sports of the Czech Republic, the Charles University Research Centre UNCE, the Joint Institute of Nuclear Research in Dubna, Russia, the National Commission of Scientific and Technological Research of Chile, We acknowledge Yellow River Engineering Consulting Co., Ltd., and China Railway 15th Bureau Group Co., Ltd., for building the underground laboratory. We are grateful for the ongoing cooperation from the China Guangdong Nuclear Power Group and China Light & Power Company.
References
- An et al. (2012) F. P. An et al. (Daya Bay Collaboration), Phys. Rev. Lett. 108, 171803 (2012).
- An et al. (2013) F. P. An et al. (Daya Bay Collaboration), Chin. Phys. C 37, 011001 (2013).
- An et al. (2014) F. P. An et al. (Daya Bay Collaboration), Phys. Rev. Lett. 112, 061801 (2014).
- An et al. (2015) F. P. An et al. (Daya Bay Collaboration), Phys. Rev. Lett. 115, 111802 (2015).
- An et al. (2017a) F. P. An et al. (Daya Bay Collaboration), Phys. Rev. D 95, 072006 (2017a).
- Adey et al. (2018a) D. Adey et al. (Daya Bay Collaboration), Phys. Rev. Lett. 121, 241805 (2018a).
- Ahn et al. (2012) J. Ahn et al. (RENO Collaboration), Phys. Rev. Lett. 108, 191802 (2012).
- Bak et al. (2018) G. Bak et al. (RENO Collaboration), Phys. Rev. Lett. 121, 201801 (2018).
- Abe et al. (2012) Y. Abe et al. (Double Chooz Collaboration), Phys. Rev. Lett. 108, 131801 (2012).
- De Kerret et al. (2019) H. De Kerret et al. (Double Chooz Collaboration), (2019), arXiv:1901.09445 [hep-ex] .
- An et al. (2016a) F. P. An et al. (Daya Bay Collaboration), Phys. Rev. Lett. 116, 061801 (2016a).
- An et al. (2017b) F. P. An et al. (Daya Bay Collaboration), Chin. Phys. C 41, 013002 (2017b).
- Seo (2015) S. H. Seo (RENO Collaboration), Proceedings, 26th International Conference on Neutrino Physics and Astrophysics (Neutrino 2014), AIP Conf. Proc. 1666, 080002 (2015).
- Abe et al. (2014) Y. Abe et al. (Double Chooz Collaboration), JHEP 10, 086 (2014).
- Mueller et al. (2011) T. A. Mueller et al., Phys. Rev. C 83, 054615 (2011).
- Huber (2011) P. Huber, Phys. Rev. C 84, 024617 (2011).
- Mention et al. (2011) G. Mention et al., Phys. Rev. D 83, 073006 (2011).
- Ko et al. (2017) Y. J. Ko et al. (NEOS Collaboration), Phys. Rev. Lett. 118, 121802 (2017).
- Zacek et al. (2018) V. Zacek, G. Zacek, P. Vogel, and J. L. Vuilleumier, (2018), arXiv:1807.01810 [hep-ex] .
- Klimov et al. (1994) Y. V. Klimov, V. I. Kopeikin, L. A. Mika lyan, K. V. Ozerov, and V. V. Sinev, At. Energy 76, 123 (1994).
- An et al. (2017c) F. P. An et al. (Daya Bay Collaboration), Phys. Rev. Lett. 118, 251801 (2017c).
- Bak et al. (2019) G. Bak et al. (RENO), Phys. Rev. Lett. 122, 232501 (2019).
- Danilov (2018) M. Danilov (DANSS), in 32nd Rencontres de Physique de La Vall e d’Aoste (La Thuile 2018) La Thuile, Aosta, Italy, February 25-March 3, 2018 (2018) [Nuovo Cim.C41,162(2019)].
- Kwon et al. (1981) H. Kwon, F. Boehm, A. A. Hahn, H. E. Henrikson, J. L. Vuilleumier, J. F. Cavaignac, D. H. Koang, B. Vignon, F. Von Feilitzsch, and R. L. Mossbauer, Phys. Rev. D 24, 1097 (1981).
- Ashenfelter et al. (2019) J. Ashenfelter et al. (PROSPECT Collaboration), Phys. Rev. Lett. 122, 251801 (2019).
- Hayes et al. (2014) A. C. Hayes, J. L. Friar, G. T. Garvey, G. Jungman, and G. Jonkmans, Phys. Rev. Lett. 112, 202501 (2014).
- Dwyer and Langford (2015) D. A. Dwyer and T. J. Langford, Phys. Rev. Lett. 114, 012502 (2015).
- Fang and Brown (2015) D.-L. Fang and B. A. Brown, Phys. Rev. C 91, 025503 (2015).
- Hayes et al. (2015) A. C. Hayes, J. L. Friar, G. T. Garvey, D. Ibeling, G. Jungman, T. Kawano, and R. W. Mills, Phys. Rev. D 92, 033015 (2015).
- Sonzogni et al. (2016) A. A. Sonzogni, E. A. McCutchan, T. D. Johnson, and P. Dimitriou, Phys. Rev. Lett. 116, 132502 (2016).
- Sonzogni et al. (2017) A. A. Sonzogni, E. A. McCutchan, and A. C. Hayes, Phys. Rev. Lett. 119, 112501 (2017).
- Gebre et al. (2018) Y. Gebre, B. R. Littlejohn, and P. T. Surukuchi, Phys. Rev. D 97, 013003 (2018).
- An et al. (2016b) F. An et al. (JUNO Collaboration), J. Phys. G 43, 030401 (2016b).
- An et al. (2016c) F. P. An et al. (Daya Bay Collaboration), Nucl. Instrum. Methods Phys. Res., Sect. A 811, 133 (2016c).
- Huber and Jaffke (2016) P. Huber and P. Jaffke, Phys. Rev. Lett. 116, 122503 (2016).
- Ma et al. (2013) X. Ma et al., Phys. Rev. C 88, 014605 (2013).
- Schreckenbach et al. (1985) K. Schreckenbach, G. Colvin, W. Gelletly, and F. Von Feilitzsch, Phys. Lett. B 160, 325 (1985).
- Von Feilitzsch et al. (1982) F. Von Feilitzsch, A. A. Hahn, and K. Schreckenbach, Phys. Lett. B 118, 162 (1982).
- Hahn et al. (1989) A. A. Hahn et al., Phys. Lett. B 218, 365 (1989).
- Adey et al. (2018b) D. Adey et al. (Daya Bay Collaboration), (2018b), arXiv:1808.10836 [hep-ex] .
- Adey et al. (2019) D. Adey et al. (Daya Bay), Nucl. Instrum. Methods Phys. Res., Sect. A 940, 230 (2019).
- Note (1) In the previous spectrum measurements An et al. (2016a, 2017b), the energy response was not corrected in the measured prompt energy spectrum, but it was applied to the predicted energy spectrum.
- Fallot et al. (2012) M. Fallot et al., Phys. Rev. Lett. 109, 202504 (2012).
- Hayes and Vogel (2016) A. C. Hayes and P. Vogel, Ann. Rev. Nucl. Part. Sci. 66, 219 (2016).
- Hayes et al. (2018) A. C. Hayes, G. Jungman, E. A. McCutchan, A. A. Sonzogni, G. T. Garvey, and X. B. Wang, Phys. Rev. Lett. 120, 022503 (2018).
- Huber (2017) P. Huber, Phys. Rev. Lett. 118, 042502 (2017).
- (47) See Supplemental Material at [URL will be inserted by publisher] for the following tabulated data: the effective fission fractions of four isotopes in 20 data groups for 4 ADs, the 235U and 239Pu spectra and their covariance matrix, the 235U and the combined 239Pu and 241Pu spectra and their covariance matrix, the correction of SNF, nonequilibrium, and nonlinear nuclides in 20 data groups for 4 ADs, the 235U and 239Pu spectra and their covariance matrix in the case of without any correction of SNF, nonequilibrium and nonlinear nuclides, the 238U and 241Pu spectra and uncertainties used in the fit, the detector response matrix.