The rare extended radio-loud narrow-line Seyfert 1 galaxy SDSS J1030+5516 at high resolution
Abstract
Recently, Rakshit et al. (2018) reported the discovery of SDSS J103024.95551622.7, a radio-loud narrow-line Seyfert 1 galaxy having a kpc scale double-lobed radio structure. Here we analyse archival radio interferometric imaging data taken with the Very Large Array (VLA) at 5 GHz, and with the Very Long Baseline Array (VLBA) at 4.3 and 7.6 GHz. Two hotspots and a compact core are detected with the VLA at arcsec scale, while a single milliarcsec-scale compact radio core is seen with the highest resolution VLBA observations. The Fermi Large Area Telescope did not detect -ray emission at the position of this source. In the mid-infrared, the Wide-field Infrared Survey Explorer satellite light curve, covering more than 7 years and including the most recent data points, hints on flux density variability at 3.4 m. Our findings support the notion that this source is a young version of Fanaroff–Riley type II radio galaxies.
Keywords galaxies: active; galaxies: Seyfert; galaxies: individual: SDSS J103024.95551622.7
1 Introduction
Narrow-line Seyfert 1 galaxies (NLS1) form a peculiar subclass of active galactic nuclei (AGN). They are defined by their narrow permitted optical lines (the full width at half maximum, FWHM, of H line is below km s-1, Goodrich, 1989), a flux ratio of [O III] to H smaller than 3 (Osterbrock and Pogge, 1985), and the strong emission of the Fe II multiplets. However, Cracco et al. (2016) showed that having strong iron lines may not be a distinctive property of NLS1 sources in accordance with the study of quasar emission lines of Boroson and Green (1992), which showed the anticorrelation between the strength of Fe II and O III lines.
The narrow permitted lines of NLS1 sources are explained with their relatively lower-mass central black holes, M⊙ (Mathur, 2000), which consequently means high accretion rates close to the Eddington limit (Boroson and Green, 1992). Based upon these, Mathur (2000) proposed that NLS1 sources can be young AGN residing in rejuvenated galaxies. Alternatively, the narrow H lines of NLS1 sources can be due to orientation effect, if their disk-like broad-line regions are seen pole-on (Decarli et al., 2008).
Similarly to AGN in general, a small fraction, % of NLS1 sources are radio-loud (Komossa et al., 2006; Zhou et al., 2006), where radio-loudness is determined by the ratio of the cm radio to the Å optical flux density following Kellermann et al. (1989). Singh and Chand (2018) studied the radio properties of a large sample of optically-selected NLS1 sources, and found that the radio-detected ones have small sizes, kpc. The most radio-loud NLS1 sources (and the ones with the highest radio luminosity investigated by Singh and Chand, 2018) show blazar-like properties: flat radio spectrum, compact radio cores, high brightness temperatures, significant variability, flat X-ray spectra, and altogether blazar-like spectral energy distribution (SED; e.g. Yuan et al., 2008). Several of them were also detected in -rays with the Fermi satellite (for a full list, see Romano et al., 2018), and in a few of them superluminally moving radio jet components were imaged with very long baseline interferometry (VLBI) technique (Lister et al., 2016). Therefore these sources, similarly to blazars, are thought to possess relativistic radio jets inclined at small angle to the line of sight.
Few of the radio-loud NLS1 sources have kpc-scale (from a few tens of kpc to kpc) radio structures. Doi et al. (2012) found that the detection rate of extended radio emission in NLS1 sources is lower than in broad-line AGN. This is confirmed more recently by Berton et al. (2018). They observed NLS1 sources and found that the majority of flat-spectrum radio-loud NLS1 sources have compact morphology on kpc scale. In most of the extended radio-loud NLS1 sources, the radio emission is two-sided (Doi et al., 2012; Richards and Lister, 2015; Congiu et al., 2017; Gabányi et al., 2018b).
Recently, Rakshit et al. (2018) reported the discovery of a radio-loud NLS1 source,
SDSS J103024.95551622.7 (hereafter J10305516) with arcsec-scale structure similar to those of Fanaroff–Riley type II radio galaxies (FR II, Fanaroff and Riley, 1974). The projected linear size, kpc is among the largest values in radio-loud NLS1 sources. Using low-resolution () radio data of J10305516 from the Faint Images of the Radio Sky at Twenty-Centimeters (FIRST) survey (Becker et al., 1995), Rakshit et al. (2018) argue that the inclination angle of the jet in the core region is with respect to the line of sight.
Here we present sub-arcsec resolution archival Very Large Array (VLA) A-configuration data, and milli-arcsec (mas) resolution VLBI data of J10305516, which support the claims of Rakshit et al. (2018). Additionally, we analysed more than yr of Fermi Large Area Telescope (LAT; Acero et al., 2015, and references therein) data to constrain the high-energy properties of the source. We also re-evaluated the mid-infrared light curves covering more than 7 yr, obtained with the Wide-field Infrared Survey Explorer (WISE, Wright et al., 2010) satellite.
In the following, we assume a flat CDM cosmological model with km s-1 Mpc-1 and . At the redshift of J10305516, , angular size corresponds to a projected linear size of kpc.
2 Observing data
2.1 Archival VLA radio data
J10305516 was observed at GHz with the VLA in its most extended A configuration on 1992 October 20 (project code: AF233). The raw data were obtained from the US National Radio Astronomy Observatory (NRAO) archive111https://archive.nrao.edu/. The on-source integration time was 1 min, the total bandwidth was 100 MHz. Phases and amplitudes were calibrated in the NRAO Astronomical Image Processing System (AIPS, Greisen, 2003) in a standard way. The flux density scale was set using the amplitude calibrator source 3C286. We used the Difmap (Shepherd et al., 1994) software for imaging and for fitting Gaussian brightness distribution model components directly to the interferometer visibility data.
2.2 Archival VLBA radio data
J10305516 was observed with the Very Long Baseline Array (VLBA) on 2016 May 28 at and GHz (project code: BP192, PI: L. Petrov) in the framework of the wide-field VLBA calibrator survey (L. Petrov 2019, in preparation). Nine (Brewster, Fort Davis, Hancock, Kitt Peak, Los Alamos, North Liberty, Owens Valley, Pie Town, St. Croix) and eight (all the above but Hancock) antennas of the array were used at the lower and higher frequency, respectively. The bandwidth was 256 MHz and the integration time was nearly 1 min at both frequencies. The calibrated visibilities were obtained from the Astrogeo website222http://astrogeo.org/vlbi˙images, maintained by L. Petrov.
2.3 Archival Fermi/LAT -ray data
We analysed the archival Fermi/LAT data of J10305516. We looked for -ray signals in the available -year data which cover the time range between 2008 August 4 and 2018 November 26. We derived Fermi/LAT upper limits using the routines included in the fermipy package (Wood et al., 2017). We selected a 15∘ circular region around the position of J1030+5516, and an energy range of GeV. We used Pass 8, SOURCE type photons, with P8R2_SOURCE_V6 responses. The fit included a diffuse galactic foreground (gll_iem_v6) and an isotropic component (iso_P8R2_SOURCE_V6_v06).
2.4 WISE data
The mid-infrared WISE satellite scanned the whole sky in four bands at , , , and m (referred as W1, W2, W3, and W4) during its original mission phase in 2010 (Wright et al., 2010). Afterwards, the satellite measurements are continued within the framework of the NEOWISE (Near-Earth Object WISE) project (Mainzer et al., 2014). After four months of NEOWISE observations, the satellite was hibernated for 34 months. Then the NEOWISE Reactivation Mission continued. In this currently on-going phase, observations are conducted only at the two shorter wavelength bands, since the cooling material required for W3 and W4 receivers has been depleted. The WISE satellite observes the same regions of the sky in every days.
We downloaded the WISE single exposure data333http://irsa.ipac.caltech.edu/Missions/wise.html up until 2017 November, and followed the procedure as in Gabányi et al. (2018a). We adapted the guidelines in the Explanatory Supplement Series444http://wise2.ipac.caltech.edu/docs/release/allwise/expsup/sec3˙2.html to discard bad quality data points. None of the measurements were affected by the South-Atlantic Anomaly, or scattered light from the Moon. We used only those measurements for which the frame image quality score (‘qi_fact’) was , since values less than mark data where residual light system motion may degrade the flux measurements. Ten per cent of data were discarded because of this effect. The contamination and confusion flags (‘cc_flags’) did not indicate problems for any of the measurements.
The final light curve contains points grouped into ten mission phases both in W1 and W2 bands. Each mission phase lasted usually for days and contains points, except for one mission phase, which is the combination of two -day long observations separated by days and contains data points.
3 Results
3.1 VLA data

| ID | Flux density | Relative RA | Relative Dec. | FWHM size |
| (mJy) | (arcsec) | (arcsec) | (mas) | |
| C | – | – | ||
| SW | ||||
| NE |
Notes: component name in Col. 1, flux density in Col. 2, offset in right ascension and declination with respect to the central component C in Cols. 3 and 4, and the FWHM size in Col. 5
The -GHz VLA-A observation revealed three distinct features, the core, the southwest (SW) and the northeast (NE) lobes (Fig. 1). This structure is in good agreement with the lower-resolution FIRST image presented by Rakshit et al. (2018). Three circular Gaussian model components can adequately describe the radio structure. Their parameters are given in Table 1. The distance between the components fitted to the hotspots in the SW and NE lobes is , which agrees well with the source size at GHz, as derived by Rakshit et al. (2018) from the FIRST image.
Using the overall spectral index value (defined as , where is the flux density and the frequency) and the integrated flux density mJy derived from the -GHz FIRST data by Rakshit et al. (2018), the flux density at GHz can be expected as mJy. The sum of flux densities of the fitted components (Table 1), mJy, is well below this value, indicating that a significant amount of diffuse radio emission was resolved out in the 5-GHz VLA-A observation.
3.2 VLBA data
At both frequencies, a single unresolved component was detected with the VLBA. There was no additional radio-emitting feature down to mJy beam-1 within the undistorted field of view with a radius of at GHz, and down to mJy beam-1 within the undistorted field of view with a radius of at GHz.
We used the Difmap (Shepherd et al., 1994) software to fit the visibilities with a circular Gaussian brightness distribution. At GHz, the radio emission can be best described by a point source model. During model-fitting using a Gaussian brightness distribution as a starting model, the FWHM size of the feature converged to an unrealistically small value ( mas), indicating the unresolved nature of the detected component. The flux density of the point source model component is mJy.
At GHz, a stable fit could be reached with using a single circular Gaussian component. Its parameters are: flux density mJy, FWHM diameter mas. However, this size is still smaller than the minimum resolvable angular size of the interferometer array, mas, calculated following the formula of Kovalev et al. (2005). Therefore J10305516 remained unresolved with VLBI at GHz as well.
Using the mas upper limit to the source size, we can calculate a lower limit to the brightness temperature:
| (1) |
where is the redshift, is the flux density in Jy, is the observing frequency in GHz, and is the FWHM size of the Gaussian component in mas. Thus, the lower limit to the brightness temperature of J10305516 is K. This value is below the equipartition brightness temperature limit ( K; Readhead, 1994) by an order of magnitude. However, since it is a lower limit only, it does not exclude the possibility of Doppler boosting caused by relativistic beaming in the jet. More sensitive and higher-resolution VLBI data would be needed to place tighter constraints on the angular size of the compact central source in J10305516 and thus on the brightness temperature.
Using these simultaneous dual-frequency VLBA observations, we can derive the two-point spectral index of the core, indicating an inverted radio spectrum of the most compact component. This is not in contrast with the spectral index derived by Rakshit et al. (2018) (), since that value was obtained using low-resolution radio observations. Those measure the total flux density of J10305516 which is dominated by the steep-spectrum lobes and diffuse emission, completely resolved out on the long baselines of the VLBA.
3.3 Fermi/LAT data
| Energy range | Flux |
|---|---|
| (GeV) | (MeV cm-2 s-1) |
No -ray emitting source was detected in the available Fermi/LAT data at the position of J10305516. The upper limits of the -ray fluxes in six energy ranges are given in Table 2.
3.4 WISE mid-infrared lightcurve
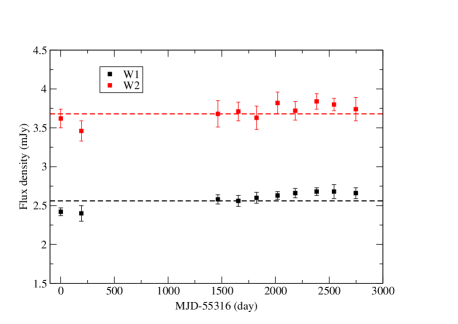
We converted the WISE magnitudes to flux densities, following the description in the Explanatory Supplement Series.555http://wise2.ipac.caltech.edu/docs/release/allsky/expsup/sec4˙4h.html To investigate the variability, we calculated the reduced for all the data in a given band, and for each mission phase, separately. For every single mission phase, the reduced , indicating no variability on a few-day long time scale. The reduced values for all measurements are at m and at m, showing a hint of variability at the shorter wavelength.
Rakshit et al. (2018) also analysed the infrared light curve of J10305516 measured with the WISE satellite. At the time of their publication only eight mission phases were available, until 2016 November. They found that the object is not variable at m and m. We also calculated the reduced using the first eight mission phases used by Rakshit et al. (2018). We found that the reduced are lower for both bands, at m and at m.
In Fig. 2, we plot the weighted average flux densities and the standard deviations for each mission phase in both bands.
4 Discussion
The obtained lower limit of the brightness temperature of the mas-scale radio emitting core of J10305516 agrees well with the values derived by Gu et al. (2015) for a sample of radio-loud NLS1 sources, . These low values compared to powerful blazar jets are explained by intrinsically low jet power by Gu et al. (2015). The brightness temperature measured in J10305516 is also similar to another NLS1 source with a radio structure extended to kpc, SDSS J110006.07442144.3 (Gabányi et al., 2018b). Richards and Lister (2015) investigated three radio-loud NLS1 galaxies with kpc-scale radio structures and found mildly relativistic jets. Comparing the mas-scale structures, J10305516 is more compact and its brightness temperature is times larger than the three NLS1 sources studied by Richards and Lister (2015).
The flux density of the core component measured at GHz with the VLA at arcsec scale ( mJy) is below the value measured at mas-scale resolution with the VLBA at a slightly lower frequency of GHz ( mJy). As this cannot be explained by resolution effect, it is more likely related to variability of the radio flux density.
In the standard picture of expanding radio galaxies, the lobe located closer to the observer is seen farther away from the host galaxy in projection (Longair and Riley, 1979), thus the arm-length ratio of the brighter to the fainter lobe is larger than one. In J10305516, the distance between the brighter NE lobe and the central compact radio feature, C is , while the fainter SW lobe is at . Therefore, it is most likely that the NE feature is at the approaching side of the source.
The arm-length ratio of the approaching to the receding lobes can be used to estimate the inclination angle () of the source, assuming there is no significant difference in the medium surrounding the jets on the two sides of the host galaxy. Using the equation of Taylor and Vermeulen (1997), the arm-length ratio can be given as
| (2) |
From the VLA data of J10305516, the arm-length ratio is , thus , which gives a lower limit for the jet speed , and an upper limit for the inclination angle . Similar equation describes the flux density ratio of the jet and counter-jet side (Taylor and Vermeulen, 1997):
| (3) |
where equals for continuous jet, and for discrete jet components. Rakshit et al. (2018) using the FIRST data obtained a flux density ratio of , from which using the spectral index they derived , and , which agree with our values obtained from the arm-length ratio. The higher resolution 5-GHz VLA data give a flux density ratio of the approaching and receding lobe of , which agrees within the errors with the value Rakshit et al. (2018) used. (Since we have no information on the spectral index of these radio features, we did not use it further to calculate the value.)
The Doppler factor is defined as,
| (4) |
where is the Lorentz factor. Using the value , and the lower limit on , , one can obtain an upper limit on the Doppler factor, .
Doi et al. (2012) estimated the Doppler factor of a few radio-loud NLS1 sources by comparing the observed and intrinsic core powers. Fitting the VLA data we obtained the core flux density at GHz. Assuming the spectral index of the core derived from the VLBA data (), the observed -GHz power of the core is W Hz-1. The intrinsic core power can be estimated using the empirical correlation found for radio galaxies, , where is the source’s total power at MHz (Giovannini et al., 2001). The closest frequency where the flux density of J10305516 was measured is MHz within the framework of the Texas survey (Douglas et al., 1996). We used that value ( Jy) and the spectral index of the whole source derived by Rakshit et al. (2018) to calculate . The corresponding intrinsic -GHz core power is W Hz-1. Following Doi et al. (2012), if the difference between the observed and intrinsic core power is caused by relativistic beaming, their ratio can be given as . This implies a . However, the uncertainty of the estimation of intrinsic core power allows for lower values and as high as . Rakshit et al. (2018) also used the above argument to estimate a Doppler factor. Instead of the core power, they used the intrinsic and observed core dominance parameter and obtained . The derived values do not contradict the result of the VLBA observation which gave a lower limit of the brightness temperature. On the other hand, cannot be accommodated with the derived from the kpc-scale structure. Thus, if we accept the higher Doppler factors derived from the power of the core component, either the jet direction, , or the jet speed, , or both of them change significantly between the kpc and pc scale. The fact that only a single, compact radio-emitting feature was detected at mas-scale resolution indicates that the jet is not oriented close to the plane of the sky at pc scales.
The -GHz radio power of the source calculated from the flux density detected in the FIRST survey ( mJy) is W Hz-1. An and Baan (2012) studied the evolutionary sequence of symmetric extragalactic radio sources. On their radio power versus projected linear size diagram, J10305516 is among the large symmetric objects and the low-power FR II radio galaxies.
The projected linear size of the source is kpc. Assuming a constant expansion velocity and using the limit derived from the kpc-scale radio structure, the kinematic age of the source can be estimated as
| (5) |
where is the full (deprojected) size of the radio source. Using the upper limit on the inclination angle (), the lower limit on the age of the kpc-scale radio structure is yr. The inclination angle of J10305516 should be below to obtain an age yr and its age would reach yr, if the inclination angle would be , which is not consistent with a nearly symmetric kpc-scale structure. Thus, J10305516 seems to be younger than typical FRII radio galaxies whose lifetimes are estimated to be yr (O’Dea et al., 2009).
Rakshit et al. (2019) investigated the infrared properties of NLS1 sources using WISE data. They found that more than % of the sources classified as variable in the AllWISE Source Catalog (Cutri et al., 2014) fall within a specific region in the WISE color–color diagram, the ‘WISE Gamma-ray strip’ (WGS). The WGS is defined by D’Abrusco et al. (2012) and Massaro et al. (2012) as a distinct region where blazars are located. The infrared colors of J10305516 place this source within the WGS as well. Based upon this and its radio-loudness, D’Abrusco et al. (2014) included J10305516 in the list of -ray emitting blazar candidates. They defined three classes of blazar candidate sources based on their decreasing likeliness of being blazars. J10305516 fell into the second class. This motivated us to analyse the available Fermi/LAT data to look for evidence of -ray emission. However, no -ray emission was found at the position of J10305516.
Rakshit et al. (2018) reported that J10305516 did not show variability in infrared at the wavelengths m and m measured with the WISE satellite. Since their publication, data from two additional epochs of WISE measurements became public. Our analysis of ten mission phases of the WISE data indicate a slight hint of long-term variability at the shorter wavelength due to the two additional epochs. There is no sign of short time scale (few day long) flux density changes neither in W1 nor in W2 bands.
Contrary to the finding of Rakshit et al. (2018), Graham et al. (2015) detected optical variability in J10305516. Graham et al. (2015) studied the optical light curves measured by the Catalina Real-time Transient Survey (Drake et al., 2009) to look for periodic variability in quasars, which they interpreted as induced by a closely separated binary supermassive black hole in those sources. They list J10305516 among the binary candidates with a period of days, a separation of pc and a rest-frame merger time of yr (assuming a mass ratio of ). However, Vaughan et al. (2016) called for cautious approach when only a few cycles are used to assess periodic variability. In any case, whether periodic or not, J10305516 seems to show some variability in optical and infrared bands on time scales of years, as suggested by Graham et al. (2015) and perhaps also by our light curve compiled from WISE data (Fig. 2).
5 Summary and conclusion
To reveal its structural properties at high resolution, we analysed archival radio interferometric observations of J10305516, a recently discovered rare radio-loud NLS1 source (Rakshit et al., 2018) having kpc-scale extended structure reminiscent of FR II radio galaxies. The compact central core and the nearly symmetric hotspots on its two sides seen in our 5-GHz VLA A-configuration image (Fig. 1) are consistent with the lower-resolution 1.4-GHz VLA FIRST survey image. A large fraction, more than a half of the radio emission originates from diffuse structures related to the two lobes, and is resolved out with the VLA at GHz. At even higher, mas-scale resolution, the and GHz VLBA observations show a single, unresolved core feature, with a brightness temperature K. The observed high-resolution radio morphology and the derived parameters of J10305516 make it similar to the few known NLS1 sources with large-scale extended radio emission (Richards and Lister, 2015; Gabányi et al., 2018b).
Using the arm-length ratio, we derived a lower limit for the kpc-scale jet speed (), and a corresponding upper limit of the inclination angle, , which are slightly more stringent than the ones given by Rakshit et al. (2018). The lack of complex radio morphology at mas scale indicates that the inner jet of J10305516 is not oriented close to the plane of the sky at pc scales.
The WISE infrared colors of the source place it in the WGS. However, our analysis of all available Fermi/LAT data did not reveal any -ray emission at the position of J10305516. There is indication of at least some variability on a multi-year time scale, both in the mid-infrared based on the most complete WISE light curve (Fig. 2), and in the optical according to monitoring observations analysed by Graham et al. (2015). Based on two epochs of radio observations, we also found indication of flux density variability.
Our results support the conclusion of Rakshit et al. (2018) that the NLS1 galaxy J10305516 is likely a low-power and young version of an FR II radio galaxy with a double-lobed structure. There is no indication of relativistic boosting in J10305516, neither from radio imaging, nor from variability or -ray data, however it cannot be completely ruled out either.
Acknowledgements
This project received support from the Hungarian Research, Development and Innovation Office (OTKA NN110333). K.É.G. was supported by the János Bolyai Research Scholarship of the Hungarian Academy of Sciences. P.V. acknowledges support from Fermi grant NNM11AA01A. We used in our work VLBA data from project BP192F7 provided by the National Radio Astronomy Observatory that is a facility of the National Science Foundation operated under cooperative agreement by Associated Universities, Inc. We thank Leonid Petrov for providing results of data analysis prior to publication. This publication makes use of data products from the Wide-field Infrared Survey Explorer, which is a joint project of the University of California, Los Angeles, and the Jet Propulsion Laboratory/California Institute of Technology, funded by the National Aeronautics and Space Administration.
Conflict of Interest: The authors declare that they have no conflict of interest.
References
- Acero et al. (2015) Acero, F., Ackermann, M., Ajello, M., Albert, A., Atwood, W.B., Axelsson, M., Baldini, L., Ballet, J., Barbiellini, G., Bastieri, D., Belfiore, A., Bellazzini, R., Bissaldi, E., Blandford, R.D., Bloom, E.D., Bogart, J.R., Bonino, R., Bottacini, E., Bregeon, J., Britto, R.J., Bruel, P., Buehler, R., Burnett, T.H., Buson, S., Caliandro, G.A., Cameron, R.A., Caputo, R., Caragiulo, M., Caraveo, P.A., Casandjian, J.M., Cavazzuti, E., Charles, E., Chaves, R.C.G., Chekhtman, A., Cheung, C.C., Chiang, J., Chiaro, G., Ciprini, S., Claus, R., Cohen-Tanugi, J., Cominsky, L.R., Conrad, J., Cutini, S., D’Ammando, F., de Angelis, A., DeKlotz, M., de Palma, F., Desiante, R., Digel, S.W., Di Venere, L., Drell, P.S., Dubois, R., Dumora, D., Favuzzi, C., Fegan, S.J., Ferrara, E.C., Finke, J., Franckowiak, A., Fukazawa, Y., Funk, S., Fusco, P., Gargano, F., Gasparrini, D., Giebels, B., Giglietto, N., Giommi, P., Giordano, F., Giroletti, M., Glanzman, T., Godfrey, G., Grenier, I.A., Grondin, M.-H., Grove, J.E., Guillemot, L., Guiriec, S., Hadasch, D., Harding, A.K., Hays, E., Hewitt, J.W., Hill, A.B., Horan, D., Iafrate, G., Jogler, T., Jóhannesson, G., Johnson, R.P., Johnson, A.S., Johnson, T.J., Johnson, W.N., Kamae, T., Kataoka, J., Katsuta, J., Kuss, M., La Mura, G., Landriu, D., Larsson, S., Latronico, L., Lemoine-Goumard, M., Li, J., Li, L., Longo, F., Loparco, F., Lott, B., Lovellette, M.N., Lubrano, P., Madejski, G.M., Massaro, F., Mayer, M., Mazziotta, M.N., McEnery, J.E., Michelson, P.F., Mirabal, N., Mizuno, T., Moiseev, A.A., Mongelli, M., Monzani, M.E., Morselli, A., Moskalenko, I.V., Murgia, S., Nuss, E., Ohno, M., Ohsugi, T., Omodei, N., Orienti, M., Orlando, E., Ormes, J.F., Paneque, D., Panetta, J.H., Perkins, J.S., Pesce-Rollins, M., Piron, F., Pivato, G., Porter, T.A., Racusin, J.L., Rando, R., Razzano, M., Razzaque, S., Reimer, A., Reimer, O., Reposeur, T., Rochester, L.S., Romani, R.W., Salvetti, D., Sánchez-Conde, M., Saz Parkinson, P.M., Schulz, A., Siskind, E.J., Smith, D.A., Spada, F., Spandre, G., Spinelli, P., Stephens, T.E., Strong, A.W., Suson, D.J., Takahashi, H., Takahashi, T., Tanaka, Y., Thayer, J.G., Thayer, J.B., Thompson, D.J., Tibaldo, L., Tibolla, O., Torres, D.F., Torresi, E., Tosti, G., Troja, E., Van Klaveren, B., Vianello, G., Winer, B.L., Wood, K.S., Wood, M., Zimmer, S., Fermi-LAT Collaboration: Astrophys. J. Suppl. Ser. 218, 23 (2015). 1501.02003
- An and Baan (2012) An, T., Baan, W.A.: Astrophys. J. 760, 77 (2012). 1211.1760. doi:10.1088/0004-637X/760/1/77
- Becker et al. (1995) Becker, R.H., White, R.L., Helfand, D.J.: Astrophys. J. 450, 559 (1995). doi:10.1086/176166
- Berton et al. (2018) Berton, M., Congiu, E., Järvelä, E., Antonucci, R., Kharb, P., Lister, M.L., Tarchi, A., Caccianiga, A., Chen, S., Foschini, L., Lähteenmäki, A., Richards, J.L., Ciroi, S., Cracco, V., Frezzato, M., La Mura, G., Rafanelli, P.: Astron. Astrophys. 614, 87 (2018). 1801.03519. doi:10.1051/0004-6361/201832612
- Boroson and Green (1992) Boroson, T.A., Green, R.F.: Astrophys. J. Suppl. Ser. 80, 109 (1992). doi:10.1086/191661
- Congiu et al. (2017) Congiu, E., Berton, M., Giroletti, M., Antonucci, R., Caccianiga, A., Kharb, P., Lister, M.L., Foschini, L., Ciroi, S., Cracco, V., Frezzato, M., Järvelä, E., La Mura, G., Richards, J.L., Rafanelli, P.: Astron. Astrophys. 603, 32 (2017). 1704.03881
- Cracco et al. (2016) Cracco, V., Ciroi, S., Berton, M., Di Mille, F., Foschini, L., La Mura, G., Rafanelli, P.: Mon. Not. R. Astron. Soc. 462, 1256 (2016). 1607.03438
- Cutri et al. (2014) Cutri, R.M., et al.: VizieR Online Data Catalog, 328 (2014)
- D’Abrusco et al. (2012) D’Abrusco, R., Massaro, F., Ajello, M., Grindlay, J.E., Smith, H.A., Tosti, G.: Astrophys. J. 748, 68 (2012). 1203.0568
- D’Abrusco et al. (2014) D’Abrusco, R., Massaro, F., Paggi, A., Smith, H.A., Masetti, N., Landoni, M., Tosti, G.: Astrophys. J. Suppl. Ser. 215, 14 (2014). 1410.0029
- Decarli et al. (2008) Decarli, R., Dotti, M., Fontana, M., Haardt, F.: Mon. Not. R. Astron. Soc. 386, 15 (2008). 0801.4560. doi:10.1111/j.1745-3933.2008.00451.x
- Doi et al. (2012) Doi, A., Nagira, H., Kawakatu, N., Kino, M., Nagai, H., Asada, K.: Astrophys. J. 760, 41 (2012). 1210.1303
- Douglas et al. (1996) Douglas, J.N., Bash, F.N., Bozyan, F.A., Torrence, G.W., Wolfe, C.: Astron. J. 111, 1945 (1996). doi:10.1086/117932
- Drake et al. (2009) Drake, A.J., Djorgovski, S.G., Mahabal, A., Beshore, E., Larson, S., Graham, M.J., Williams, R., Christensen, E., Catelan, M., Boattini, A., Gibbs, A., Hill, R., Kowalski, R.: Astrophys. J. 696, 870 (2009). 0809.1394
- Fanaroff and Riley (1974) Fanaroff, B.L., Riley, J.M.: Mon. Not. R. Astron. Soc. 167, 31 (1974)
- Gabányi et al. (2018a) Gabányi, K., Moór, A., Frey, S.: In: Revisiting narrow-line Seyfert 1 galaxies and their place in the Universe. Proceedings of Science, PoS(NLS1-2018)042 (2018a). 1807.05802
- Gabányi et al. (2018b) Gabányi, K., Frey, S., Paragi, Z., Järvelä, E., Morokuma, T., An, T., Tanaka, M., Tar, I.: Mon. Not. R. Astron. Soc. 473, 1554 (2018b). 1709.07202
- Giovannini et al. (2001) Giovannini, G., Cotton, W.D., Feretti, L., Lara, L., Venturi, T.: Astrophys. J. 552, 508 (2001). astro-ph/0101096. doi:10.1086/320581
- Goodrich (1989) Goodrich, R.W.: Astrophys. J. 342, 224 (1989)
- Graham et al. (2015) Graham, M.J., Djorgovski, S.G., Stern, D., Drake, A.J., Mahabal, A.A., Donalek, C., Glikman, E., Larson, S., Christensen, E.: Mon. Not. R. Astron. Soc. 453, 1562 (2015). 1507.07603
- Greisen (2003) Greisen, E.W.: In: Heck, A. (ed.) Information Handling in Astronomy - Historical Vistas. Astrophysics and Space Science Library, vol. 285, p. 109 (2003)
- Gu et al. (2015) Gu, M., Chen, Y., Komossa, S., Yuan, W., Shen, Z., Wajima, K., Zhou, H., Zensus, J.A.: The Astrophysical Journal Supplement Series 221, 3 (2015). 1509.01889
- Kellermann et al. (1989) Kellermann, K.I., Sramek, R., Schmidt, M., Shaffer, D.B., Green, R.: Astron. J. 98, 1195 (1989)
- Komossa et al. (2006) Komossa, S., Voges, W., Xu, D., Mathur, S., Adorf, H.-M., Lemson, G., Duschl, W.J., Grupe, D.: Astron. J. 132, 531 (2006). astro-ph/0603680
- Kovalev et al. (2005) Kovalev, Y.Y., Kellermann, K.I., Lister, M.L., Homan, D.C., Vermeulen, R.C., Cohen, M.H., Ros, E., Kadler, M., Lobanov, A.P., Zensus, J.A., Kardashev, N.S., Gurvits, L.I., Aller, M.F., Aller, H.D.: Astron. J. 130, 2473 (2005). astro-ph/0505536
- Lister et al. (2016) Lister, M.L., Aller, M.F., Aller, H.D., Homan, D.C., Kellermann, K.I., Kovalev, Y.Y., Pushkarev, A.B., Richards, J.L., Ros, E., Savolainen, T.: Astron. J. 152, 12 (2016). 1603.03882
- Longair and Riley (1979) Longair, M.S., Riley, J.M.: Mon. Not. R. Astron. Soc. 188, 625 (1979)
- Mainzer et al. (2014) Mainzer, A., Bauer, J., Cutri, R.M., Grav, T., Masiero, J., Beck, R., Clarkson, P., Conrow, T., Dailey, J., Eisenhardt, P., Fabinsky, B., Fajardo-Acosta, S., Fowler, J., Gelino, C., Grillmair, C., Heinrichsen, I., Kendall, M., Kirkpatrick, J.D., Liu, F., Masci, F., McCallon, H., Nugent, C.R., Papin, M., Rice, E., Royer, D., Ryan, T., Sevilla, P., Sonnett, S., Stevenson, R., Thompson, D.B., Wheelock, S., Wiemer, D., Wittman, M., Wright, E., Yan, L.: Astrophys. J. 792, 30 (2014). 1406.6025
- Massaro et al. (2012) Massaro, F., D’Abrusco, R., Tosti, G., Ajello, M., Gasparrini, D., Grindlay, J.E., Smith, H.A.: Astrophys. J. 750, 138 (2012). 1203.1330
- Mathur (2000) Mathur, S.: Mon. Not. R. Astron. Soc. 314, 17 (2000). astro-ph/0003111
- O’Dea et al. (2009) O’Dea, C.P., Daly, R.A., Kharb, P., Freeman, K.A., Baum, S.A.: Astron. Astrophys. 494, 471 (2009). 0810.1213. doi:10.1051/0004-6361:200809416
- Osterbrock and Pogge (1985) Osterbrock, D.E., Pogge, R.W.: Astrophys. J. 297, 166 (1985)
- Rakshit et al. (2018) Rakshit, S., Stalin, C.S., Hota, A., Konar, C.: Astrophys. J. 869, 173 (2018). 1811.02147. doi:10.3847/1538-4357/aaefe8
- Rakshit et al. (2019) Rakshit, S., Johnson, A., Stalin, C.S., Gandhi, P., Hoenig, S.: Mon. Not. R. Astron. Soc. 483, 2362 (2019). 1811.11372. doi:10.1093/mnras/sty3261
- Readhead (1994) Readhead, A.C.S.: Astrophys. J. 426, 51 (1994)
- Romano et al. (2018) Romano, P., Vercellone, S., Foschini, L., Tavecchio, F., Landoni, M., Knödlseder, J.: Mon. Not. R. Astron. Soc. 481, 5046 (2018). 1809.03426. doi:10.1093/mnras/sty2484
- Richards and Lister (2015) Richards, J.L., Lister, M.L.: Astrophys. J. 800, 8 (2015). 1501.05299
- Shepherd et al. (1994) Shepherd, M.C., Pearson, T.J., Taylor, G.B.: Bull. Am. Astron. Soc. 26, 987 (1994)
- Singh and Chand (2018) Singh, V., Chand, H.: Mon. Not. R. Astron. Soc. 480, 1796 (2018). 1807.01945
- Taylor and Vermeulen (1997) Taylor, G.B., Vermeulen, R.C.: Astrophys. J. Lett. 485, 9 (1997). astro-ph/9706011
- Vaughan et al. (2016) Vaughan, S., Uttley, P., Markowitz, A.G., Huppenkothen, D., Middleton, M.J., Alston, W.N., Scargle, J.D., Farr, W.M.: Mon. Not. R. Astron. Soc. 461, 3145 (2016). 1606.02620
- Wood et al. (2017) Wood, M., Caputo, R., Charles, E., Di Mauro, M., Magill, J., Perkins, J.S., Fermi-LAT Collaboration: In: 35th International Cosmic Ray Conference, Proceedings of Science, PoS(ICRC2017)824 (2017). 1707.09551
- Wright et al. (2010) Wright, E.L., Eisenhardt, P.R.M., Mainzer, A.K., Ressler, M.E., Cutri, R.M., Jarrett, T., Kirkpatrick, J.D., Padgett, D., McMillan, R.S., Skrutskie, M., Stanford, S.A., Cohen, M., Walker, R.G., Mather, J.C., Leisawitz, D., Gautier, T.N. III, McLean, I., Benford, D., Lonsdale, C.J., Blain, A., Mendez, B., Irace, W.R., Duval, V., Liu, F., Royer, D., Heinrichsen, I., Howard, J., Shannon, M., Kendall, M., Walsh, A.L., Larsen, M., Cardon, J.G., Schick, S., Schwalm, M., Abid, M., Fabinsky, B., Naes, L., Tsai, C.-W.: Astron. J. 140, 1868 (2010). 1008.0031
- Yuan et al. (2008) Yuan, W., Zhou, H.Y., Komossa, S., Dong, X.B., Wang, T.G., Lu, H.L., Bai, J.M.: Astrophys. J. 685, 801 (2008). 0806.3755
- Zhou et al. (2006) Zhou, H., Wang, T., Yuan, W., Lu, H., Dong, X., Wang, J., Lu, Y.: Astrophys. J. Suppl. Ser. 166, 128 (2006). astro-ph/0603759