Dielectric and Raman Spectroscopy in Hematite crystallites across the Morin Transition
Abstract
We report complex dielectric and Raman spectroscopy measurements in four samples of - Fe2O3, consisting of crystallites which are either hexagonal shaped plates or cuboids. All four samples exhibit the spin reorientation transition from a pure antiferromagnetic (AFM) to a weak-ferromagnetic (WFM) state at the Morin Transition temperature (TM) intrinsic to - Fe2O3. These samples, pressed and sintered in identical conditions for the dielectric measurements, reveal moderate but clear enhancement in the real part of the dielectric constant () in the WFM region. However, a relaxation-like behavior in the imaginary part of is observed only in nano plates or big cuboids. Further still, this relaxation patten is observed only in lower frequency region, lasting upto a few kHz and follows Arrhenius law within this limited range. The activation energy deduced from the fitting is suggestive of polaronic conduction. Temperature dependent Raman spectra reveal anomalies in all major phononic modes and also in 2Eu mode in the vicinity of the Morin transition. A peak like behavior in Raman Shifts, in conjuncture with anharmonic fitting reveals that the nature of spin phonon coupling is different in pure AFM and WFM regions and it is tied to the mild variations, as observed in the dielectric constant of- Fe2O3 near the TM.
I Introduction
Materials exhibiting an entanglement between magnetic and electric order parameters are well known for their tremendous technological importance in futuristic memory storage and spintronic devices Ortega et al. (2015); Ramesh and Spaldin (2007); Hill (2000). For these systems, stringent symmetry limitations are required to realize the coupling between electric polarization (P) and magnetization (M). Cr2O3, for instance is a prototypical magnetoelectric (ME) compound that exhibits linear coupling between P and M. Dzyaloshinskii (1960); Astrov (1961). For magnetic systems with non collinear spin structure such as TbMnO3, the appearance of nonzero polarization is understood to arise from the antisymmetric Dzyaloshinskii-Moriya Interaction (DMI) and such a coupling is again governed by very specific symmetry requirements related to the magnetic lattice. Aoyama et al. (2014); Kimura et al. (2003a); Hur et al. (2004); Katsura et al. (2007). Magnetodielectric (MD) materials, on the other hand, exhibit anomalies in dielectric constants across the magnetic transition temperatures, either ferromagnetic (FM) or antiferromagnetic (AFM) ones. This is irrespective of a specific magnetic symmetry or the peculiar spin configuration such as involved in ME or other DMI driven canted systems.Lawes et al. (2009); Tackett et al. (2007); Kimura et al. (2003b); Newnham (2005). The dielectric anomalies in MD materials are tied to spin-phonon interactions and such systems (single phase or composites) are therefore equally important for practical applications Shin and Park (2010); Tiwari and Vitta (2018); Singh et al. (2016).
| Sample | S/V | Morin | Lattice constant | ||
|---|---|---|---|---|---|
| ratio | Temperature | ||||
| (K) | c (Å) | a (Å) | c/a | ||
| Micro Plates | 0.008 | 225 | 13.7586(4) | 5.0386(1) | 2.7306(1) |
| Nano Plates | 0.16 | 172 | 13.7593(3) | 5.0375(0) | 2.7313(9) |
| Big Cuboids | 0.03 | 210 | 13.7678(7) | 5.0371(2) | 2.7332(1) |
| Small Cuboids | 0.1 | 185 | 13.7687(1) | 5.0350(0) | 2.7346(2) |
On a general note, it is non trivial to establish the exact origins of dielectric anomalies and their coupling with the magnetic order either in symmetry allowed ME systems, in routine FM and AFM or in canted AFM. This is due to the presence of a number of factors, both intrinsic and extrinsic which influence the dielectric constant at the magnetic transition temperature Lawes et al. (2009); Lunkenheimer et al. (2002); Catalan (2006) etc. These studies also provide the pointers, through frequency and magnetic field dependent dielectric spectroscopy, to establish or isolate various factors which may contribute to the dielectric anomalies especially around the magnetic transition. This includes the role of surface defects, oxygen vacancies and magnetoresitive contributions etc.Lawes et al. (2009).
In the context of DMI driven coupling between magnetic and electrical order parameters, Khomskii (2014) - Fe2O3 is unique, as it exhibits both pure AFM as well as spin canted phase. More importantly the canted phase exists at the room temperature.Dzialoshinskii (1957a); Moriya (1960); Khomskii (2014).Below its Neel temperature (TN 950 K) the AFM sublattices of - Fe2O3 lie in the basal plane of hexagonal structure (a convenient representation - Fe2O3) and slightly canted, resulting in a WFM phase. With the decrease of temperature, a spin reorientation transition occurs, known as Morin transition (TM 260 K). AT TM, the sublattice magnetization reorients from the ab plane to the c-axis of the unit cell. This phenomenon is accompanied with simultaneous vanishing of the DMI driven spin canting and - Fe2O3 becomes a pure AFM. In addition to being a room temperature WFM, - Fe2O3 is also a symmetry allowed piezomagnet, a phenomena that involves the generation of magnetic moments upon application of stress Dzialoshinskii (1957b); ANDRATSKii (1966).
DMI driven anomalies in dielectric constant are also subject matter of investigation in various magnetic insulators Khomskii (2014). However, to the best our knowledge, how this feature influences the dielectric constant in prototypical DMI driven compound - Fe2O3, which is also room temperature WFM, has not been explored in great details. Although the ME coupling is not expected in - Fe2O3, a close inspection of the DMI driven coupling on the dielectric constant, especially its variations with morphology and nano structuring is interesting. In a recent study, a signature of magneto-dielectric coupling has been observed at the vicinity of Morin transition, TM, in - Fe2O3. The observed anomaly is also seen to be enhanced with Ga doping in the system Lone and Bhowmik (2015). However, in all these studies the temperature region of the maxima of dielectric anomaly and the Morin transition temperature are largely separated ( by 75 K). More importantly, the anomaly is seen to be pronounced in doped - Fe2O3 system, albeit less attention has been paid in understanding the nature of coupling phenomena in the pristine - Fe2O3, especially as a function of nano-structuring and morphology.
In the present work we investigate dielectric characteristic in four different samples of - Fe2O3 in its pure AFM and WFM regions. The samples are primarily formed in two different morphologies (i) hexagonal plates and (ii) cuboids. To separate the size effects, while retaining the morohology, hexagonal plates under investigation are referred as micro-plates and nano-plates respectively. On the similar lines, cuboid have been reffed to as big cuboids and small cuboids in this work. In addition to dielectric spectroscopy, we have also performed Raman spectroscopy as a complementary tool, which enables to probe the excitations corresponding to the magnetic, lattice and electronic degrees of freedom. Lawes et al. (2009); Kadlec et al. (2011); Kamba et al. (2014); Vermette et al. (2008); Balkanski et al. (1983). Temperature variation of Raman data substantiates the role of spin-phonon coupling associated with the Morin transition and its influence on the dielectric properties of - Fe2O3 samples investigated in this work.
II Experimental Techniques
Big cuboids (side lengths 200 nm), small cuboids (side lengths 60 nm), micro plates (side length x thickness 1-3 µm x 300 nm) and nano plates (side length x thickness 70 nm x 15 nm) of - Fe2O3 have been synthesized by the hydrothermal method Pattanayak et al. (2018). The morphology of the samples have been analysed by the Zeiss Ultra plus Field Emission Scanning Electron Microscope (FESEM) (insets of Figs. 1 and Figure 2). The SEM images show the cuboids are regular in shape with well-defined facets. The plate shaped - Fe2O3 samples are nearly hexagonal in shape. The phase formation and crystallinity of the samples have been analysed by using a Bruker D8 advance powder X- ray diffractometer with Cu Kα radiation. The diffraction patterns fitted with Rietveld refinement using FULLPROF software are provided as SI1. Temperature dependent magnetization data recorded using a MPMS XL SQUID magnetometer while cooling the samples from room temperature down to 5 K in presence of 100 Oe field. The bulk Morin transition is 250 K - Fe2O3 and it is known to systematically decrease with the increase of S/V ratio, as we also observe in our samplesPattanayak et al. (2018). The surface to volume (S/V) ratio, Morin temperature and lattice constants extracted from the Rietveld refinement are presented in table-1. Temperature dependent Raman spectra has been acquired by using HORIBA LabRAM with the help of Linkam Stage.The Raman spectra is recorded using a green (Helium-Neon) laser of wave length 532 nm. For the dielectric measurements, as-prepared powders of Hematite are mixed with a suitable binder, PVA (poly vinyl alcohol) and pelletized. These pellets, about 10 mm in diameter and 2 mm thickness are sintered at a temperature of 400 C for 5 hours prior to dielectric measurements. The dielectric measurements in parallel plate geometry are carried out at a drive of 1 V from room temperature down to 75 K in the frequency range of 100 Hz - 300 kHz using a Novocontrol impedance analyzer.
III Results and Discussions
III.1 Temperature variation Dielectric spectroscopy
The temperature dependent dielectric constant measured as a function of frequency for micro- and nano plates is shown in Figs 1a-1b. SEM images in the upper figures reveal the morphology and size of the individual crystallites for both the samples under investigation. The main panel of the figures 1a-1b represent the real () and the imaginary part () of the dielectric constant respectively. We note that magnitude of the is nearly half ( 60) in nano plates as compared to what is observed in micro-plates (130). It is also to be noted that the Surface to Volume ratio ( SI-Table S1) for nano-plates is roughly 20 times larger than that of the micro-plates and the absolute value of dielectric constant is nearly half in this case. We also note that in both the samples, the dielectric constant exhibits a modest but clear increase in the WFM region. This feature is better seen when normalized is plotted with normalized magnetization for both the samples (Figure 1c and Figure 1d). The anomaly in the vicinity of TM is more pronounced in micro plates as compared to nano plates, as is evident from comparing the derivatives (inset of Figure 1c). The magnitude of is low and it is of similar order, in the vicinity of TM in both cases. Interestingly, the in case of nano plates shows relaxation behavior with the maxima of dispersion shifting to higher temperature with the increase of frequency. However, micro plates do not show any relaxation behavior in this frequency range.
Figure 2 shows the same in case of small and big cuboids. Here the magnitude of is rather similar for both the samples (the small cuboids exhibit a marginally smaller value, 82 as compared to big cuboids, 88), even though the S/V ratio for small cuboids is about 10 times that of big cuboids. The over all trend is somewhat different from samples with hex plate morphology wherein reduces significantly upon nano scaling. However big cuboids also exhibit a small anomaly in the vicinity of the Morin transition as is evident from the inset of Figure 2c wherein temperature derivatives of and M are compared. Main Panel of Figures 2c and 2d (in which normalized and normalized M is plotted) show increase in in the WFM region for both the samples. We also note that the is similar in magnitude for big and small cuboids but the relaxation like feature is observed only in big cuboids (lower panel of Figure 2b). Overall, these data suggest that both morphology and S/V ratio play a part as far as magnitude of the is concerned, but the loss part, is of similar range in all four cases , irrespective of morphology and S/V ratio. We also note that the S/V ratio of nano plates and big cuboids is of similar order and both exhibit relaxation type of behavior. The frequency range of this shift is in rather limited, up to a few kHz. This relaxation is seen to follow Arrhenius Law, given by the following equation.
| (1) |
Here kB is the Boltzmann constant, T is the absolute temperature, is the pre exponential factor and Ea is the activation energy of relaxation. The linear behavior observed following Arrhenius law is shown for nano plates and big cuboids in Figure 3a and 3b respectively. This is suggestive of thermally activated dipole population Thongbai et al. (2008); Zhang and Tang (2004); Smart and Ping (2017); Sharma et al. (2018). The activation energy deduced from the fitting for small cuboids as well as nano-plates is 0.2 eV. Though, with present set of data, it is non trivial to isolate its origin but this activation range is suggestive of polaron hopping, which is a plausible mechanism in case of hematite Smart and Ping (2017). Extrinsic contributions such as space charge or Maxwell-Wagner effect also does not seem to play a significant part, considering that magnitude of and , as these contributions tend to enhance both and Lunkenheimer et al. (2002); Liu et al. (2004); Catalan (2006); Wang et al. (2010); Ke et al. (2010). A small upturn in curves observed in both the samples at higher temperature can be attributed to an extremely small change in electrical conductivity in that temperature region, which has also been reported for hematite.
Overall, from frequency dependent dielectric spectroscopy, we infer that the modest rise in the dielectric constant is indeed tied to the onset of WFM region in all four samples, irrespective of the morphology and size. This is also consistent with previous reports, exhibiting higher rise in the dielectric constant in the vicinity of FM to PM transition as compared to what is observed in pure AFM to PM transitionLawes et al. (2009). Thus, in case of hematite, it appears that the onset of DMI driven WFM has a role to play, and data is also consistent with magnetodielectric coupling. It is known that in the MD systems, the dielectric anomaly appears at the magnetic transition does not necessarily evolve with the appearance of spontaneous electrical polarization. In such systems the appearance of dielectric anomaly at the vicinity of magnetic phase transition is governed by underlying spin-spin correlations, which could be both FM or AFM Lawes et al. (2009). This also enables to understand subtle difference between AFM and FM correlations through the nature of spin spin correlations. As evident from Figure 3, in case of - Fe2O3, irrespective of the morphology, the modest rise in the dielectric constant in each sample is linked to the onset of the WFM phase. It is also known that in magnetic ferroelectrics, a strong polarization at the vicinity of the magnetic ordering resulted in the appearance of dielectric anomaly across the magnetic transition. In such systems a particular non collinear spin structure is an essential ingredient for the appearance of electrical polarization Aoyama et al. (2014); Kimura et al. (2003a); Hur et al. (2004); Katsura et al. (2007); Lawes et al. (2009). Microscopically, the coupling between magnetic and electric order parameters in such systems is mainly governed by DMI interactions. Thus it is important to investigate the role of DMI, especially spin -phonon coupling in these samples. For this purpose we investigated temperature variation of Raman in a representative sample, big cuboids, which has also shown relaxation type of behavior in dielectric loss, which is discussed in next sub section.
III.2 Temperature Variation of Raman
A characteristic Raman spectra acquired using green laser is shown in Fig.3 (a) on big cuboids of - Fe2O3 sample is shown in Fig. 4(a). The assignment of Raman active modes is consistent with the group theory prediction for the space group R3-c Shim and Duffy (2002). The modes located at 225 and 500 are the symmetric A modes and those located at 246 cm-1, 290 , 295 , 408 , 500 and 610are the doubly degenerate Eg modes. The mode Eu, assigned at 660 cm-1 in general is not Raman active and its appearance has been attributed to the disorder related to surface defects and grain sizes. The mode located at 1320 is related by a factor of two with the Eu mode. A weak peak observed in the spectra range of 1500-1600 , merged with the tail of 2Eu mode, is due to the two-magnon scattering in - Fe2O3 Rodriguez et al. (2015); Massey et al. (1990). It is to be recalled that the A symmetry involves the movement of Fe atom along the c-axis of the unit cell and Eg symmetry involves the symmetric breathing mode of the O atoms relative to the Fe atoms in the plane perpendicular to the c axis of the unit cell Beattie and Gilson (1970); Chernyshova et al. (2007).
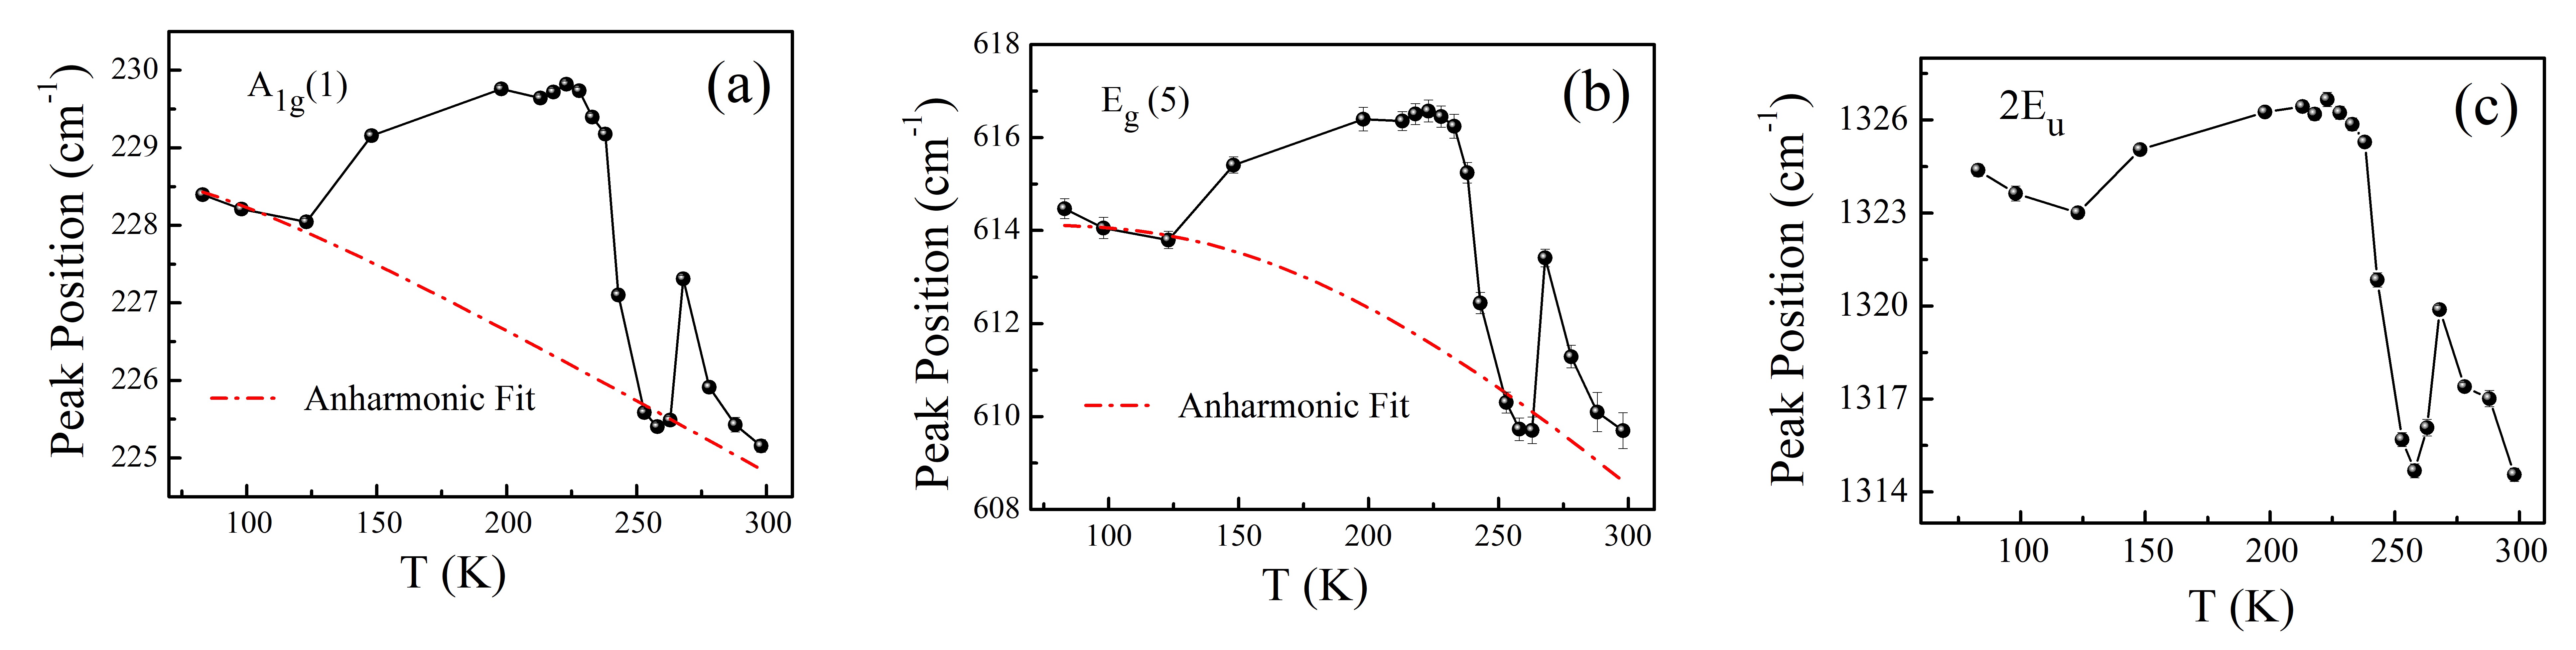
The temperature dependent Raman spectra acquired in the temperature range of 300 K - 80 K is shown in Fig. 3(b). In figures 3(c) and (d) the evolution of phonon frequency as a function of temperature, obtained after the Lorentzian peak profile fit of the acquired spectra, are shown for two selected modes A1g (1) and Eg (5) respectively. The variation of phonon frequency as a function of temperature in a magnetic material can be expressed as Massey et al. (1990)
| (2) |
Where (T) and (0) in L.H.S are the Raman frequency at T and 0 K respectively. The contribution from the first term in R.H.S is due to the lattice expansion/contraction, second term is due to phonon-phonon interaction and last term implies the contribution of spin-phonon coupling in the modulation of phonon frequency. Neglecting the contributions from the lattice and spin – phonon coupling, the variation of phonon frequency as a function of temperature can be simulated by the anharmonic decay of phonon frequency model expressed as Vermette et al. (2008); Balkanski et al. (1983)
| (3) |
Here C is an adjustable parameter, x = ћ (0)/ kBT, kB is the Boltzmann constant and T is the absolute temperature. The simulated curves of the anharmonic phonon decay are shown in red lines in Figures 4a and 4b. The phonon frequency evolutions as a function of temperature in three modes follows the anharmonic behaviour (red lines) except a noticeable deviation observed around the Morin transition. Considering the subtle changes in lattice parameters around the Morin transition observed earlier in these samples, the deviations in the mode positions around the Morin transition can be attributed to arise due to the combined effect of spin-phonon and lattice contributions. We also observe a small deviation in phonon frequency evolution around the temperature regime of 250 K. We infer that this small deviation is more likely due to the presence of a double transition as evident from the remanent magnetization vs temperature data reported earlier on this sample Pattanayak et al. (2018).The Raman data thus confirm the role of spin phonon coupling which manifests in the dielectric measurements in hematite near AFM to WFM transition.
IV Conclusions
Temperature and frequency dependent dielectric and Raman measurements have been conducted around the Morin transition in - Fe2O3 crystallites formed in different morphologies and sizes. Nano scaling results in significant decrease in the dielectric constant in case of hexagonal shaped plates whereas in case of cuboids, no significant changes were observed, as far as the magnitude of the dielectric constant is concerned. The real part of the dielectric constant exhibits a small but clear increase in the weak ferromagnetic region as compared to pure antiferromagnetic region in all the samples, irrespective of morphology and size. This indicates presence of magnetodielectric coupling in hematite and also bring forward the role of Dzyaloshinskii Moriya Interaction driven weak ferromagnetic phase. The temperature variation of Raman modes confirms the presence of spin phonon coupling at the vicinity of Morin transition.
V Acknowledgments
Authors thank Sunil Nair (IISER Pune) for SQUID magnetization measurements. AB acknowledges Department of Science and Technology (DST), India for funding support through a Ramanujan Grant and the DST Nanomission Thematic Unit Program.
References
- Ortega et al. (2015) N. Ortega, A. Kumar, J. Scott, and R. S. Katiyar, Journal of Physics: Condensed Matter 27, 504002 (2015).
- Ramesh and Spaldin (2007) R. Ramesh and N. A. Spaldin, Nature materials 6, 21 (2007).
- Hill (2000) N. A. Hill, The Journal of Physical Chemistry B 104, 6694 (2000).
- Dzyaloshinskii (1960) I. E. Dzyaloshinskii, Soviet Physics JETP 10, 628 (1960).
- Astrov (1961) D. Astrov, Sov. Phys. JETP 13, 729 (1961).
- Aoyama et al. (2014) T. Aoyama, K. Yamauchi, A. Iyama, S. Picozzi, K. Shimizu, and T. Kimura, Nature communications 5, 4927 (2014).
- Kimura et al. (2003a) T. Kimura, T. Goto, H. Shintani, K. Ishizaka, T.-h. Arima, and Y. Tokura, nature 426, 55 (2003a).
- Hur et al. (2004) N. Hur, S. Park, P. Sharma, S. Guha, and S. Cheong, Physical review letters 93, 107207 (2004).
- Katsura et al. (2007) H. Katsura, A. V. Balatsky, and N. Nagaosa, Physical review letters 98, 027203 (2007).
- Lawes et al. (2009) G. Lawes, T. Kimura, C. Varma, M. Subramanian, N. Rogado, R. Cava, and A. Ramirez, Progress in Solid State Chemistry 37, 40 (2009).
- Tackett et al. (2007) R. Tackett, G. Lawes, B. C. Melot, M. Grossman, E. S. Toberer, and R. Seshadri, Physical Review B 76, 024409 (2007).
- Kimura et al. (2003b) T. Kimura, S. Kawamoto, I. Yamada, M. Azuma, M. Takano, and Y. Tokura, Physical Review B 67, 180401 (2003b).
- Newnham (2005) R. E. Newnham, Properties of Materials: Anisotropy, Symmetry, Structure (New York: Oxford University Press, 2005).
- Shin and Park (2010) Y.-S. Shin and S.-O. Park, Microwave and Optical Technology Letters 52, 2364 (2010).
- Tiwari and Vitta (2018) S. Tiwari and S. Vitta, Scientific reports 8 (2018).
- Singh et al. (2016) H. Singh, H. Ghosh, T. Chandrasekhar Rao, G. Sharma, J. Saha, and S. Patnaik, Journal of Applied Physics 119, 044104 (2016).
- Lunkenheimer et al. (2002) P. Lunkenheimer, V. Bobnar, A. V. Pronin, A. Ritus, A. Volkov, and A. Loidl, Physical Review B 66, 052105 (2002).
- Catalan (2006) G. Catalan, Applied Physics Letters 88, 102902 (2006).
- Khomskii (2014) D. I. Khomskii, Transition metal compounds (United Kingdom: Cambridge University Press, 2014).
- Dzialoshinskii (1957a) I. Dzialoshinskii, Soviet Physics Jetp-Ussr 32, 1547 (1957a).
- Moriya (1960) T. Moriya, Phys. Rev. 120, 91 (1960).
- Dzialoshinskii (1957b) I. Dzialoshinskii, JETP 33, 807 (1957b).
- ANDRATSKii (1966) V. P. ANDRATSKii, JETP 51, 1030 (1966).
- Lone and Bhowmik (2015) A. G. Lone and R. Bhowmik, AIP Advances 5, 047117 (2015).
- Kadlec et al. (2011) C. Kadlec, V. Goian, K. Rushchanskii, P. Kužel, M. Ležaić, K. Kohn, R. Pisarev, and S. Kamba, Physical Review B 84, 174120 (2011).
- Kamba et al. (2014) S. Kamba, V. Goian, V. Skoromets, J. Hejtmánek, V. Bovtun, M. Kempa, F. Borodavka, P. Vaněk, A. Belik, J. Lee, et al., Physical Review B 89, 064308 (2014).
- Vermette et al. (2008) J. Vermette, S. Jandl, and M. Gospodinov, Journal of Physics Condensed Matter 20 (2008).
- Balkanski et al. (1983) M. Balkanski, R. Wallis, and E. Haro, Physical Review B 28, 1928 (1983).
- Pattanayak et al. (2018) N. Pattanayak, A. Bhattacharyya, S. Chakravarty, and A. Bajpai, arXiv preprint arXiv:1811.05231 (2018).
- Thongbai et al. (2008) P. Thongbai, S. Tangwancharoen, T. Yamwong, and S. Maensiri, Journal of Physics: Condensed Matter 20, 395227 (2008).
- Zhang and Tang (2004) L. Zhang and Z.-J. Tang, Physical Review B 70, 174306 (2004).
- Smart and Ping (2017) T. J. Smart and Y. Ping, Journal of Physics: Condensed Matter 29, 394006 (2017).
- Sharma et al. (2018) M. Sharma, S. Murugavel, D. K. Shukla, and F. M. De Groot, The Journal of Physical Chemistry C 122, 9292 (2018).
- Liu et al. (2004) J. Liu, C.-G. Duan, W.-G. Yin, W.-N. Mei, R. W. Smith, and J. R. Hardy, Physical review B 70, 144106 (2004).
- Wang et al. (2010) X. Wang, X. Lu, C. Zhang, X. Wu, W. Cai, S. Peng, H. Bo, Y. Kan, F. Huang, and J. Zhu, Journal of Applied Physics 107, 114101 (2010).
- Ke et al. (2010) Q. Ke, X. Lou, Y. Wang, and J. Wang, Physical Review B 82, 024102 (2010).
- Shim and Duffy (2002) S.-H. Shim and T. S. Duffy, American Mineralogist 87, 318 (2002).
- Rodriguez et al. (2015) R. D. Rodriguez, E. Sheremet, T. Deckert-Gaudig, C. Chaneac, M. Hietschold, V. Deckert, and D. R. Zahn, Nanoscale 7, 9545 (2015).
- Massey et al. (1990) M. Massey, U. Baier, R. Merlin, and W. Weber, Physical Review B 41, 7822 (1990).
- Beattie and Gilson (1970) I. Beattie and T. Gilson, Journal of the Chemical Society A: Inorganic, Physical, Theoretical , 980 (1970).
- Chernyshova et al. (2007) I. Chernyshova, M. Hochella Jr, and A. Madden, Physical Chemistry Chemical Physics 9, 1736 (2007).