On period distribution of RR Lyr type variables in the globular cluster M3
© 2019 г. Yu. A. Fadeyev***E–mail: fadeyev@inasan.ru
Institute of Astronomy, Russian Academy of Sciences, Pyatnitskaya ul. 48, Moscow, 119017 Russia
Received March 14, 2019; after revision April 1, 2019;
accepted April 1, 2019
Abstract — Evolutionary calculations of population II stars with chemical composition of the globular cluster M3 were carried out under various assumptions about the initial stellar mass () and the mass loss rate parameter in the Reimers formula (). In general, 30 evolutionary tracks of the horizontal branch stars were computed. Selected models of evolutionary sequences were used as initial conditions for solution of the equations of hydrodynamics that describe radial stellar oscillations. Hydrodynamic models of RR Lyr type stars were computed for the core helium burning stage as well as for the preceding pre–ZAHB stage. Analytic relations for the effective temperature of the instability strip edges as a function of stellar luminosity are obtained. Theoretical histograms of the period distribution of RR Lyr type variables were produced for each evolutionary sequence using Monte–Carlo simulations based on the consistent stellar evolution and nonlinear stellar pulsation calculations. A satisfactory agreement with observations (i.e. the greater number of RRab variables) was found for the evolutionary sequence , with the number fraction of fundamental mode pulsators . At the same time the mean period of fundamental mode pulsators ( day) is substantially greater compared to the observational estimate of .
Keywords: stars: variable and peculiar
introduction
RR Lyr type pulsating variables observed in globular clusters are low–mass () population II stars on the evolutionary stage of steady–state thermonuclear core helium burning (Iben, 1974; Caputo, 1998). In the Hertzsprung–Russel diagram (HRD) the RR Lyr type variables locate on the horizontal branch within the pulsational instability strip and have effective temperatures (Stellingwerf, 1984; Bono, Stellingwerf, 1994). Most of RR Lyr stars are the fundamental mode or the first overtone pulsators (i.e. variables of RRab and RRc type, respectively).
It has been shown by Oosterhoff (1939) that galactic globular clusters may be divided into two groups depending on the mean period and the number fractions of RRab and RRc variables. The criteria of the globular clusters of the first group are day and day with the relative number of RRc variables . On the contrary, in clusters of the second group day, day and (van den Bergh, 1957). The Oosterhoff dichotomy seems to be due to different physical conditions corresponding to pulsational mode switching (van Albada, Baker, 1973) but the cause of the dichotomy remains ubclear.
The globular cluster M3 (NGC 5272) is one of the most thoroughly investigated clusters due to its relatively small distance and insignificant interstellar reddening. Recent distance estimates range from 4.44 kpc (Watkins, van der Marel, 2017) to 10.05 kpc (Marconi et al., 2003) and the interstellar reddening is (VandenBerg et al., 2016). In comparison with other globular clusters M3 is conspicuous due to the large number of RR Lyr pulsating variables. By now about 274 RR Lyr variables were discovered in this cluster (Bakos et al., 2000). The observational period distribution of RR Lyr type variables (Corwin, Carney, 2001) undoubtedly indicate that M3 belongs to the first group of Oosterhoff classification.
Theoretical analysis of horizontal branch stars is based on methods of population synthesis using results of stellar evolution calculations and observations of RR Lyr type variables. In the framework of this approach the relations between the pulsation period and fundamental parameters of the star (the mass , the muninosity , the effective temperature , the metal abundance ) are obtained from the formulae approximating the extensive grids of hydrodynamic models of RR Lyr stars (Caputo et al., 1998; Marconi et al., 2003; 2015). However attempts to reproduce the period distribution of RR Lyr stars in the globular cluster M3 have failed (Catelan, 2004).
The goal of the present study is to consider the theoretical period distribution of RR Lyr variables in the globular cluster M3 using the consistent calculations of stellar evolution and nonlinear stellar pulsations. In this work we employ various assumptions on the initial stellar mass and the mass loss rate. The study implies calculation of the evolutionary sequences of horizontal branch stars and the use of selected evolutionary models as initial conditions for solution of the equations of radiation hydrodynamics and time–dependent convection describing radial stellar oscillations. Consistent evolutionary and nonlinear pulsation calculations allow us to determine the stellar age when the star crosses the instability strip edge as well as the age of the pulsational mode swithing. Finally, for each evolutionary sequence we produce the theoretical period distribution which is compared with observations.
evolutionary tracks of horizontal branch stars
Following the methodology of our preceding work (Fadeyev, 2018) the evolutionary sequences of horizontal branch stars were computed from the zero–age main sequence (ZAMS) to core helium exhaustion. The nuclear network includes 29 nuclides from hydrogen to aluminium which are coupled by 51 reactions. The reaction rates were calculated using the JINA Reaclib data (Cyburt et al., 2010). The initial fractional mass abundance of helium was assumed to be (Salaris et al., 2004) with initial metallicity (Catelan, 2004).
Convective mixing was treated in the framework of the standard theory (Böhm–Vitense, 1958) with mixing length to pressure scale height ratio . In general, we computed 30 evolutionary sequences with initial masses for the mass loss rate parameter in the Reimers formula (1975). All evolutionary calculations were carried out with the program MESA version 10398 (Paxton et al., 2018).
The main difficulty encountered in evolutionary calculations of the horizontal branch stars on the stage of core helium burning is due to the jump of the helium abundance on the outer boundary of the convective core. Finite–difference representation of the evolutionary model is responsible for discrete ingestion of the helium–rich material into the convective core. As a result, the energy generation rate in the triple– reactions may substantially increase so that the evolution time on the horizontal branch significantly increases due to spurious loops in the HRD (Constantino et al., 2015; 2016). In the present study to avoid appearence of spurious breathing pulses we employed the method that allows us to constrain the ingestion rate of unburned helium–rich material on the outer boundary of the convective core (Spruit, 2015; Constantino et al., 2017).
Selected models of evolutionary sequences located in the vicinity of the instability strip in the HRD were used as initial conditions for solution of the equations of radiation hydrodynamics describing radial stellar oscillations. Basic equations and the choice of parameters of the time–dependent convection theory (Kuhfuß, 1986) are discussed in our preceding papers (Fadeyev, 2013; 2015). In the present study the solution of the transport equations for turbulent convection was carried out with in the expression for the turbulent viscosity
| (1) |
where is the gas density, is the mean free path of the turbulent element (i.e. the mixing length), is the mean kinetic energy of turbulence. The parameter determines efficiency of ineraction between turbulent elements and the gas flow. For pulsating stars this parameter ranges within and the pulsation period is almost independent of (Wuchterl, Feuchtinger, 1998; Olivier, Wood, 2005; Smolec, Moskalik, 2008).
For each crossing of the instability strip we computed from 10 to 15 hydrodynamic models. The edge of the instability strip was determined using two adjacent models one of which is unstable against radial pulsations and another shows decaying oscillations. The growth (or decay) rate of oscillations is , where is the period of radial stellar pulsations, is the maximum kinetic energy of pulsation motions. The kinetic energy reaches its maximum value twice per pulsation period. The evolutionary time (i.e. the star age) correspoinding to the instability edge () was evaluated by linear interpolation of .
Effective temperatures of the blue and the red edges of the instability strip can be expressed as a function of the bolometric stellar luminosity by following relations
| (2) | |||
| (3) |
The constant coefficients in (2) and (3) were obtained by the least–squares method within for 58 and 84 crossings of the blue and red edges of the instability strip, respectively, by 30 evolutionary tracks. The larger number of red edge crossings is due to decaying oscillations of energy generation in the triple– reactions after the helium flash on the tip of the red giant branch. Formulae (2) and (3) give the effective temperature on the instability edge with mean r.m.s. deviations of and . The scatter of points around the regression line is mainly due to the linear intrerpolation errors. The average width of the instability strip is .
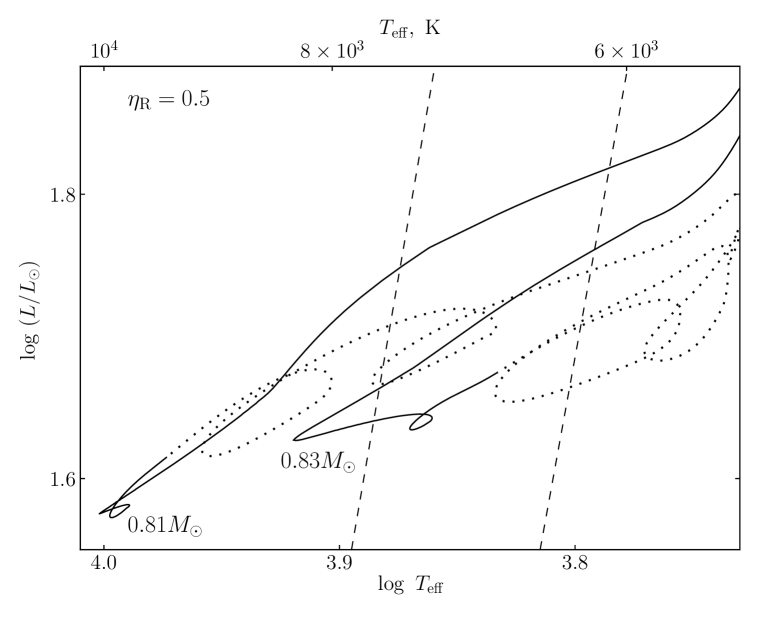
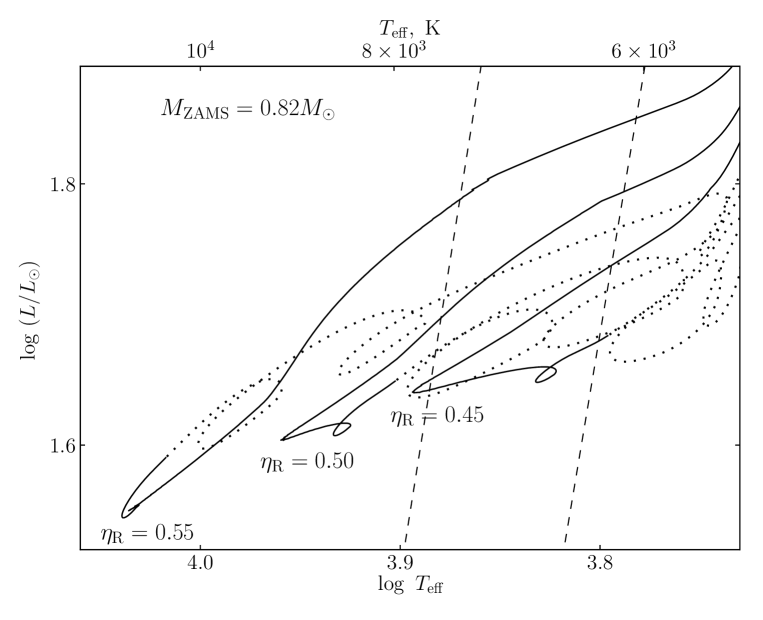
Location of the evolutionary track in the HRD relative to the instability strip depends on the initial stellar mass and the mass lost during the preceding stage of the red giant (i.e. the parameter ). Dependence of the evolutionary track on the initial mass is illustrated in Fig. 1 for evolutionary sequences and computed for the mass loss rate parameter . The role of mass loss is illustrated in Fig. 2 for evolutionary sequences computed for , 0.5 and 0.55.
Solid lines in Figs. 1 and 2 correspond to the evolutionary stage of core helium burning. For all evolutionary sequences considered in the present study the time of core helium burning with an accuracy of a few percent is yr. The preceding evolutionary stage when the star leaves the tip of the red giant branch and approaches the horizontal branch is significantly shorter. For example, the time interval between the maximum energy generation during the helium flash and commencement of core helium burning is yr. In Figs. 1 and 2 this stage of evolution is shown by dotted lines and in close vicinity of the instability strip its duration is yr. The point between the solid and dotted lines corresponds to the horizontal branch of the zero age (ZAHB).
periods of radial pulsations
Computations of each hydrodynamic model were carried out on the time interval encompassing hundreds of pulsation cycles. After completion of hydrodynamic computations the pulsation periods of the fundamental mode and the first overtone were evaluated using the discrete Fourier transform of the pulsating stellar envelope kinetic energy. Both periods are time–independent because after attainment of the limiting amplitude nonlinear effects remain negligible. Therefore, to enhance the accuracy of period determination we calculated the power spectrum of the kinetic energy for the whole time interval of the solution of the equations of hydrodynamics. While approaching the limiting cycle the amplitude of one mode in the spectrum reduces whereas another mode becomes prevalent.
During the instability strip crossing the star undergoes oscillations on the stage of core helium burning and oscillations on the pre–ZAHB stage. Therefore, we may assume with high accuracy that the mode switching occurs instantly. In the present study the stellar age corresponding to the mode switching was determined as a mean evolutionary time of two adjacent hydrodynamic models pulsating in different modes.
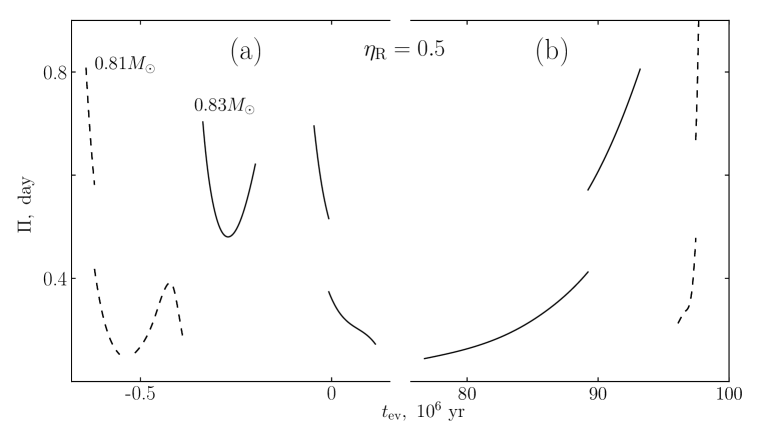
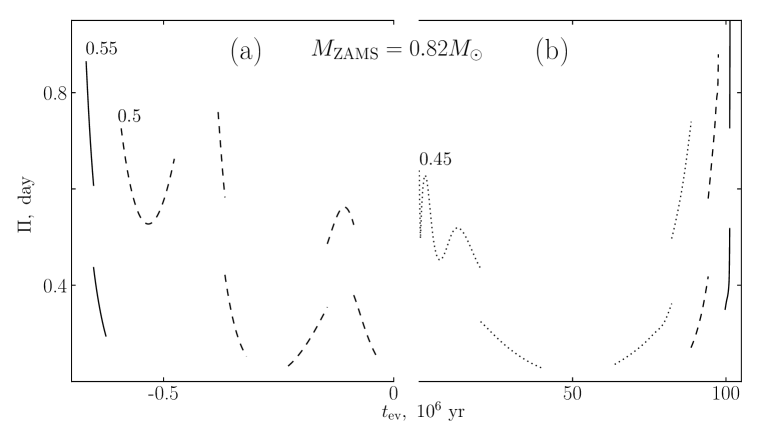
The pulsation period as a continuous function of evolutionary time was determined using the cubic interpolation splines. Results of approximation are shown in Figs. 3 and 4 for evolutionary sequences displayed in Figs. 1 and 2. For the sake of graphical clarity the evolutionary time is set to zero at ZAHB, the time scale for being nearly two orders of magnitude shorter in comparison with that for . Each plot in Figs. 3 and 4 represents the temporal dependence of the pulsation period within the instability strip and a discontinuous jump corresponds to the mode switching.
As clearly seen in Figs. 3 and 4 the lifetime of the star within the instability strip significantly reduces with decreasing mass of the horizontal branch star (i.e. with decreasing or increasing ). Approximate estimates of in units of the core helium burning time are given in the second column of the Table 1 for several values of the zero age horizontal branch stellar mass . The instability strip lifitime on the pre–ZAHB stage is almost independent of stellar mass, so that decrease of is accompanied by increasing number fraction of pre–ZAHB RR Lyr variables (see the third column in Table 1).
period distribution
Theoretical histograms of RR Lyr period distribution were produced for all computed evolutionary sequences using Monte–Carlo simulations. To this end the age of the synthetic star was randomly selected from a uniform distribution on the interval , where yr.
First of all, we have to note that histograms of evolutionary sequences computed with should be excluded from our consideration due to contradiction with observations because they exhibit significant excess of the first overtone pulsators. Moreover, as clearly seen in Fig. 2, the maximum effective temperature of the horizontal branch stars seems to be insufficiently high in comparison with its observational estimates (Catelan et al., 2001; Cacciari et al., 2005).
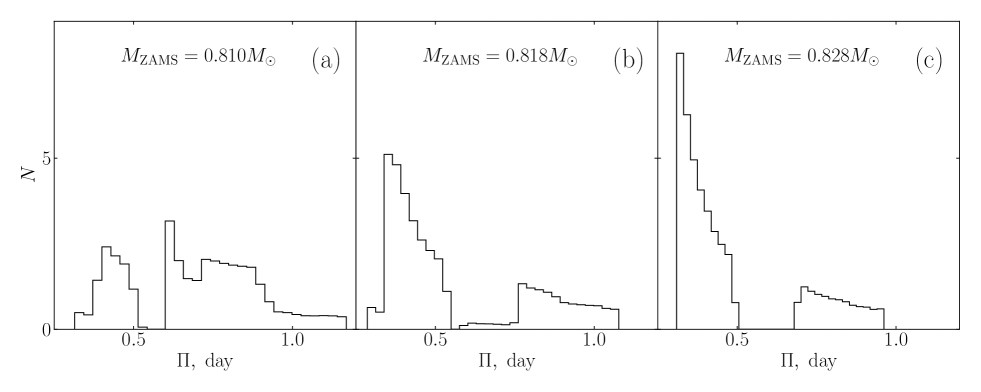
Fig. 5 shows the normalized histograms of the period distribution produced from evolutionary and stellar pulsation computations of three evolutionary sequences with initial masses , , and the mass loss rate parameter . The masses of RR Lyr stars are , and , respectively. As clearly seen, to avoid the contradiction with observations and to obtain excess of fundamental mode pulsators we have to assume that the initial mass is .
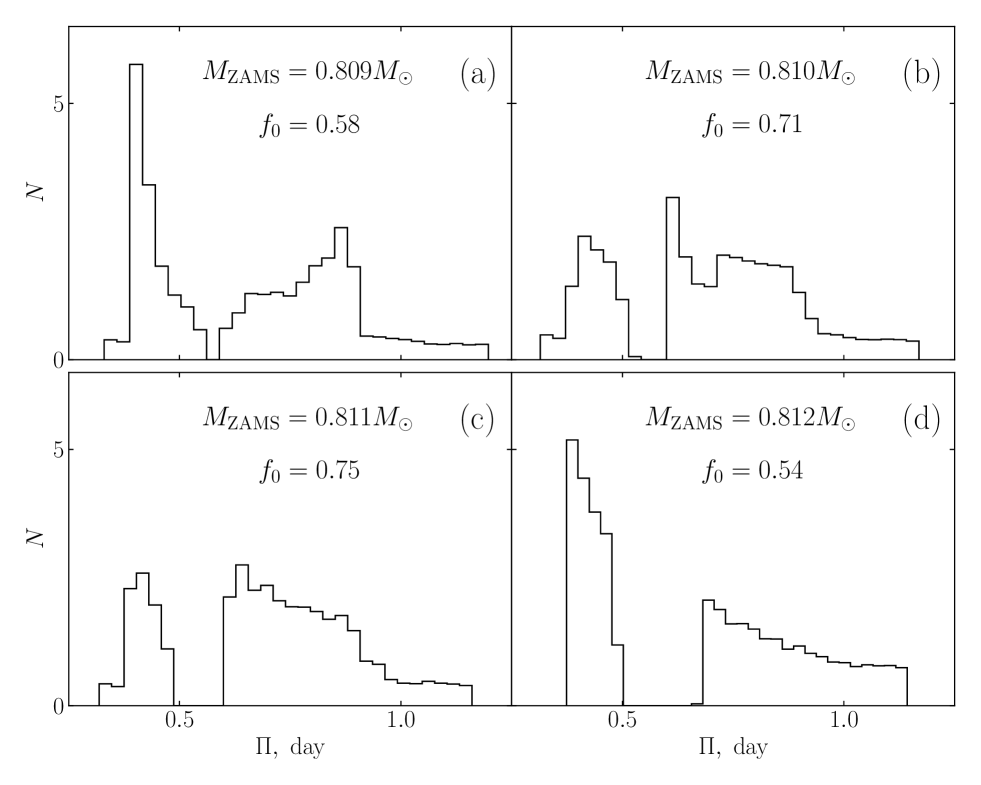
For a more detailed comparison between results of computations and observations Fig. 6 shows normalized histograms of evolutionary sequences with initial masses where each plot is accompanied by the number fraction of fundamental mode pulsators . As clearly seen, the satisfactory agreement with observations is obtained for evolutionary sequences and , that is for RR Lyr stars with masses . The number fractions of fundamental mode pulsators (71% and 75%) are enough close to 78% of RR Lyr variables in the globular cluster M3 (Catelan, 2004). At the same time one should note that the mean period of fundamental mode pulsators day is significantly larger in comparison with the mean period of RRab variables day.
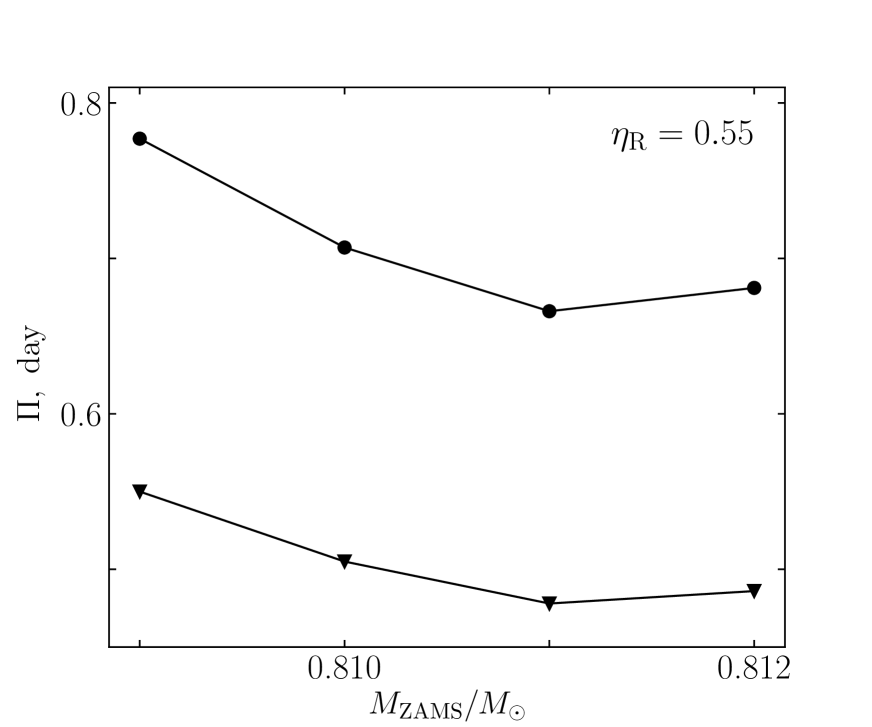
The existence of the narrow interval of intial masses with satisfactory agreement between theory and observations is due to the fact that the mode switching is sensitively dependent on the stellar mass. This dependence is illustrated in Fig. 7 where the periods of the fundamental mode and the first overtone at the mode switching are plotted as a function of . The plots correspond to the final core helium burning stage when radial pulsation mode changes from the first overtone to the fundamental mode. As is seen, in the initial mass interval the period of each mode at the mode switching varies by . A strong sensitivity of the pulsation period at the mode switching to the stellar mass is the main cause of different shapes of histograms displayed in Fig. 6.
conclusions
In the present study we carried out consistent calculations of stellar evolution and nonlinear stellar pulsations for 30 evolutionary sequences of horizontal branch stars. Initial masses of evolutionary models correspond to the age of RR Lyr stars from yr for to yr for . Almost all theoretical histograms exhibit excess of short–period RRc type variables and contradict to observations of the globular cluster M3. A satisfactory agreement with observations was obtained for two evolutionary sequences and computed with the mass loss rate parameter . The number fraction of fundamental mode pulsators (71% and 75%) was found to be insignificantly smaller than the observed number fraction of RRab variables (78%).
The evolutionary sequences of horizontal branch stars computed in the present study will be used to improve the theoretical estimate of the mean period of RR Lyr variables pulsating in the fundamental mode. Bearing in mind the fact that the mode switching is strongly sensitive to the stellar mass we should consider in the future work the evolutionary sequences computed in vicinity of the values , and .
Solution of the problem is complicated by requirements of more thorough evolutionary calculations. The instability strip crossing on the stage of core helium burning occurs when the fractional mass abundance of helium in the convective core is , so that effects of unsteady mass ingestion on the outer boundary of the convective core become stronger and lead to perceptible changes in evolutionary calculations. As was shown above reduction of such effects is necessary for correct determination of the mode switching and thereby for better agreement between theory and observations.
The author is indebted to L.R. Yungelson for critical comments and useful discussions.
references
-
1.
G.A. Bakos, J.M. Benko, and J. Jurcsik, Acta Astron. 50, 221 (2000).
-
2.
E. Böhm–Vitense, Zeitschrift für Astrophys. 46, 108 (1958).
-
3.
G. Bono and R.F. Stellingwerf, Astrophys. J. Suppl. Ser. 93, 233 (1994).
-
4.
C. Cacciari, T.M. Corwin, and B.W. Carney, Astron. J. 129, 267 (2005).
-
5.
F. Caputo, Astron. Astrohys. Rev. 9, 33 (1998).
-
6.
F. Caputo, P. Santolamazza, and M. Marconi, MNRAS 293, 364 (1998).
-
7.
M. Catelan, Astrophys. J. 600, 409 (2004).
-
8.
M. Catelan, F.R. Ferraro, and R.T. Rood, Astrophys. J. 560, 970 (2001).
-
9.
T. Constantino, S.W. Campbell, J. Christensen–Dalsgaard, J.C. Lattanzio, and D. Stello, MNRAS 452, 123 (2015).
-
10.
T. Constantino, S.W. Campbell, W. Simon, J,C. Lattanzio, and A. van Duijneveldt, MNRAS, 456, 3866 (2016).
-
11.
T. Constantino, S.W. Campbell, and J.C. Lattanzio, MNRAS 472, 4900 (2017).
-
12.
T.M. Corwin and B.W. Carney, Astron. J. 122, 3183 (2001).
-
13.
R.H. Cyburt, A.M. Amthor, R. Ferguson, Z. Meisel, K. Smith, S. Warren, A. Heger, R.D. Hoffman, T. Rauscher, A. Sakharuk, H. Schatz, F.K. Thielemann, and M. Wiescher, Astrophys. J. Suppl. Ser. 189, 240 (2010).
-
14.
Yu.A. Fadeyev, Astron. Lett. 39, 306 (2013).
-
15.
Yu.A. Fadeyev, MNRAS 449, 1011 (2015).
-
16.
Yu.A. Fadeyev, Astron. Lett. 44, 616 (2018).
-
17.
I. Iben, Ann. Rev. Astron. Astrophys. 12, 215 (1974).
-
18.
R. Kuhfuß, Astron. Astrophys. 160, 116 (1986).
-
19.
M. Marconi, F. Caputo, M. Di Criscienzo, and M. Castellani, Astrophys. J. 596, 299 (2003).
-
20.
M. Marconi, G. Coppola, G. Bono, V. Braga, A. Pietrinferni, R. Buonanno,M. Castellani, I. Musella, V. Ripepi, and R.F. Stellingwerf), Astrophys. J. 808, 50 (2015).
-
21.
E.A. Olivier and P.R. Wood, MNRAS 362, 1396 (2005).
-
22.
P.T. Oosterhoff, Observatory 62, 104 (1939).
-
23.
B. Paxton, J. Schwab, E.B. Bauer, L. Bildsten, S. Blinnikov, P. Duffell, R. Farmer, J.A. Goldberg, et al., Astropys. J. Suppl. Ser. 234, 34 (2018).
-
24.
D. Reimers, Problems in stellar atmospheres and envelopes (Ed. B. Baschek, W.H. Kegel, G. Traving, New York: Springer-Verlag, 1975), p. 229.
-
25.
M. Salaris, M. Riello, S. Cassisi, and G. Piotto, Astron. Astrophys. 420, 911 (2004).
-
26.
R. Smolec and P. Moskalik, Acta Astron. 58, 193 (2008).
-
27.
H.C. Spruit, Astron. Astrophys. 582, L2 (2015).
-
28.
R.F. Stellingwerf, Astrophys. J. 277, 322 (1984).
-
29.
D.A. VandenBerg, P.A. Denissenkov, and M. Catelan, Astrophys. J. 827, 2 (2016).
-
30.
T.S. van Albada and N. Baker, Astrophys. J. 185, 477 1973.
-
31.
S. van den Bergh, 1957, Astron. J. 62, 334 (1957).
-
32.
L.L. Watkins and R.P. van der Marel, Astrophys. J. 839, 89 (2017).
-
33.
G. Wuchterl and M.U. Feuchtinger, Astron. Astrophys. 340, 419 (1998).
| 0.58 | 0.003 | 0.42 |
| 0.59 | 0.004 | 0.10 |
| 0.60 | 0.01 | 0.12 |
| 0.61 | 0.07 | 0.04 |
Figure captions
-
Fig. 1.
Evolutionary tracks of horizontal branch stars with initial masses and for the mass loss parameter . The stage of core helium burning and the preceding pre–ZAHB stage are shown by solid and dotted lines, respectively. Dashed lines indicate the edges of the instability strip given by relations (2) и (3).
-
Fig. 2.
Same as Fig. 1 but for evolutionary sequences computed with mass loss rate parameter , 0.5 and 0.55.
-
Fig. 3.
The pulsation period as a function of stellar age for evolutionary sequences with initial masses (dashed lines) and (solid lines) computed for the mass loss rate parameter . The stellar age is set to zero at ZAHB.
-
Fig. 4.
Same as Fig. 3 but for evolutionary sequences computed for the mass loss rate parameters (dotted lines), 0.5 (dashed lines) and 0.55 (solid lines).
-
Fig. 5.
Normalized period distribution histograms of RR Lyr variables for evolutionary sequences (a), (b) and (c) computed for the mass loss rate parameter .
-
Fig. 6.
Same as Fig. 5 but for evolutionary sequences (a), (b), (c) and (d). is the number fraction of fundamental mode pulsators.
-
Fig. 7.
The pulsation period of the fundamental mode (filled circles) and the first overtone (filled triangles) at the mode switching on the stage of core helium burning as a function of initial mass for the mass loss parameter .