Supernova 2018aoq and a distance to Seyfert galaxy NGC 4151
Abstract
We present optical photometric observations of SN 2018aoq from 2 to 100 days after explosion, and 7 spectra at epochs from 11 to 71 days. The light curves and spectra are typical for SNe II-P. As previously reported, SN 2018aoq appears to be of intermediate brightness between subluminous and normal SNe II-P. SN 2018aoq was discovered in Seyfert galaxy NGC 4151, for which the distance is uncertain. We utilised the Expanding Photosphere Method using three sets of filter combinations and velocities derived from the absorption minima of FeII lines and obtained a distance of 20.01.6 Mpc. The Standard Candle Method applied to SN 2018aoq yields a distance of 16.61.1 Mpc. Both values are consistent with the distance measurements for NGC 4151 based on geometric method.
keywords:
supernovae: individual: SN 2018aoq – galaxies: individual: NGC41511 Introduction
NGC 4151 is well-known Seyfert 1 galaxy, one of the nearest galaxies with active nucleus.
NGC 4151 is one of the rare objects for which there exist two independent dynamical measurements for the mass of the central black hole. To first order, the black hole mass derived by the stellar dynamical modeling depends linearly on the assumed distance to the galaxy (Onken et al., 2014).
However, the actual distance to the galaxy is rather uncertain.
The Extragalactic Distance Database (Tully et al., 2009) presents distance measurements based on the Tully-Fisher relation: the individual estimate for NGC 4151 is 3.90.4 Mpc, and the group-average distance is 11.21.1 Mpc. The reability of these distance estimates are doubtful, as discussed by Onken et al. (2014).
The methods based on the reprocessing of the emission of the active nucleus provided much larger distances: 19 Mpc (Cackett et al., 2007) and 29 Mpc (Yoshii et al., 2014). Hönig et al. (2014) applied a geometric method, measuring the size of region of hot dust emission as determined from time-delays and infrared interferometry, which yielded 19.02.5 Mpc.
The discovery of a type II-P supernova (SN) 2018aoq in NGC 4151 presents a new possibility to obtain an independent estimate of the distance to the galaxy.
The optical transient Kait-18P=2018aoq was discovered on 2018-04-01.4316 by the Lick Observatory Supernova Search at the unfiltered magnitude of 15.3 at a distance of 73″ from the center of NGC 4151. Spectroscopic observations with the 1.5-m Kanata telescope classified the transient as a Type II supernova111https://wis-tns.weizmann.ac.il/search.
Observations of type II-P SNe can be used to determine distances to their host galaxies using the Expanding Photosphere Method (EPM), which was first developed by Kirshner & Kwan (1974). The method is based on measuring the angular radius of the photosphere from photometric data and comparing the resulting expansion rate to the velocity extracted from the spectral data. The EPM provides estimates of distance independent of extragalactic distance ladder. The method requires high-quality spectroscopic and photometric monitoring of SNe and was applied mostly to nearby objects (e.g., Hamuy et al., 2001; Takáts & Vinkó, 2006; Jones et al., 2009; Bose & Kumar, 2014), although recently it became possible to perform the EPM on SNe at cosmologically significant redshifts (e.g., Gall et al., 2016; Gall et al., 2018). The other method for distance determinations using SNe II-P is the Standardized Candle Method (SCM) (Hamuy & Pinto, 2002), based on a correlation between the luminosity and the expansion velocity of SNe during the plateau phase. This method relies on the local distance calibrators and yields distances that are in reasonable agreement with the EPM (e.g., Nugent et al., 2006; Poznanski et al., 2009; Olivares E. et al., 2010; Gall et al., 2018).
2 Observations
Photometric CCD observations of SN 2018aoq were carried out at the 60-cm and 50-cm telescopes of Crimean Observatory of Sternberg Astronomical Institute (SAI), the 70-cm and 20-cm telescopes of Moscow Observatory of SAI, the 1-m telescope of Institute of Astronomy of Russian Academy of Science (INASAN) at Simeiz Observatory, the 60-cm telescope of Stará Lesná Observatory of the Astronomical Institute of Slovak Academy of Science, and the 60-cm telescope of Shamakhy Astrophysical Observatory.
The standard image reductions and photometry were made using the IRAF222IRAF is distributed by the National Optical Astronomy Observatory, which is operated by AURA under cooperative agreement with the National Science Foundation.. The magnitudes of the SN were derived by a PSF-fitting relatively to a sequence of local standard stars, which were calibrated by Lyutyi (1973), Doroshenko et al. (2005), and Roberts & Rumstay (2012). The photometry was transformed to standard Johnson-Cousins magnitudes by means of instrumental colour-terms.
The surface brightness of the host galaxy at the location of the SN is not very high, nevertheless we checked if the galaxy background affects the photometry. We used the images obtained before SN outburst at the Shamakhy Observatory for galaxy subtraction. We found that for most of the images the effect of galaxy background does not exceed the errors of magnitudes, but for the 50-cm telescope of SAI it may amount to 0.05-0.1 mag. We applied galaxy subtraction for all images obtained with this telescope.
The magnitudes of standard stars are presented in Table 3, the photometric data are presented in Table LABEL:tab:photometry.
Prediscovery observations were reported by Nazarov et al. (2018). We carried out photometry on their images, using our local standard stars and applying galaxy subtraction, and obtained new magnitude estimates, which are also reported in Table LABEL:tab:photometry. The light curves are shown in Fig. 1
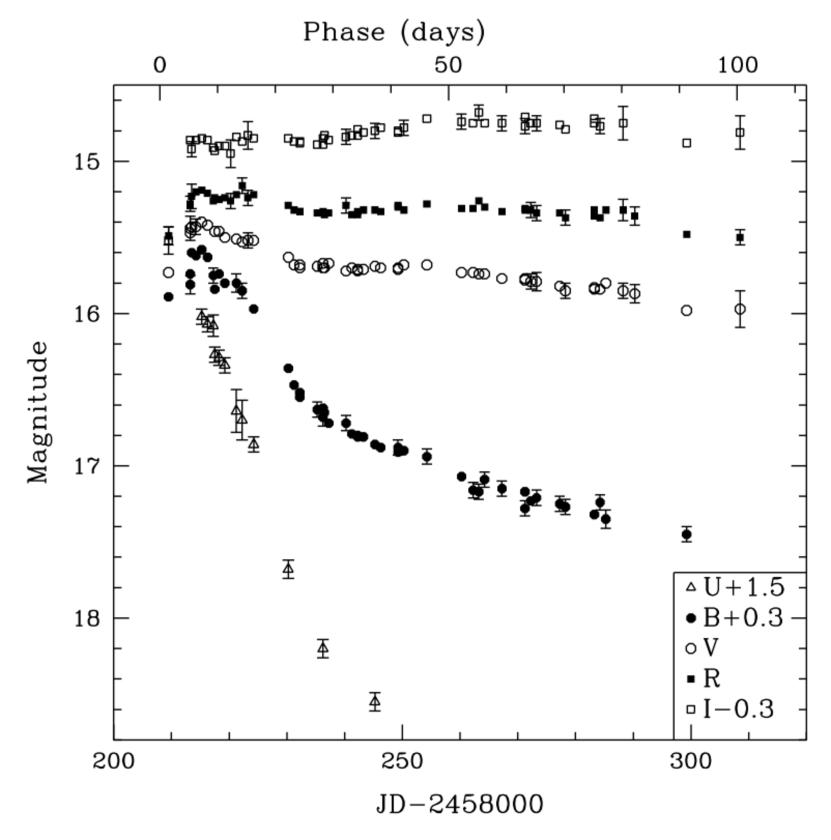
The shape of the light curves is typical for SNe II-P. The first observations were obtained on the rising part of the light curves, and we can determine the epoch when the SN reached the plateau phase as JD 24582151 (April 6). Yamanaka et al. (2018) obtained images of NGC 4151 on JD 2458209.0 (March 31.5) and derived an upper limit of 17.5 mag in the -band, O’Neill et al. (2019) reported that the SN was fainter than 18.89 mag in the ’orange’ ATLAS filter on JD 2458206.97 (March 29). We used a polynomial fit to the -band magnitudes on the rise and found that the best estimate for the epoch of explosion is JD 24582081, 7 days before start of the plateau. This value of rise time is in agreement with the average rise time for SNe II-P reported by Gall et al. (2015).
The blue colour of SN 2018aoq at maximum and the absence of detectable interstellar lines in the spectra allows to conclude that the absorption in the host galaxy was negligible. The galactic extinction is small mag (Schlafly & Finkbeiner, 2011). O’Neill et al. (2019) compared the colour curves of SN 2018aoq to those of type II-P SNe for which the extinction is well-known, and derived the total extinction for SN 2018aoq mag, only slightly larger than . We used for all further calculations.
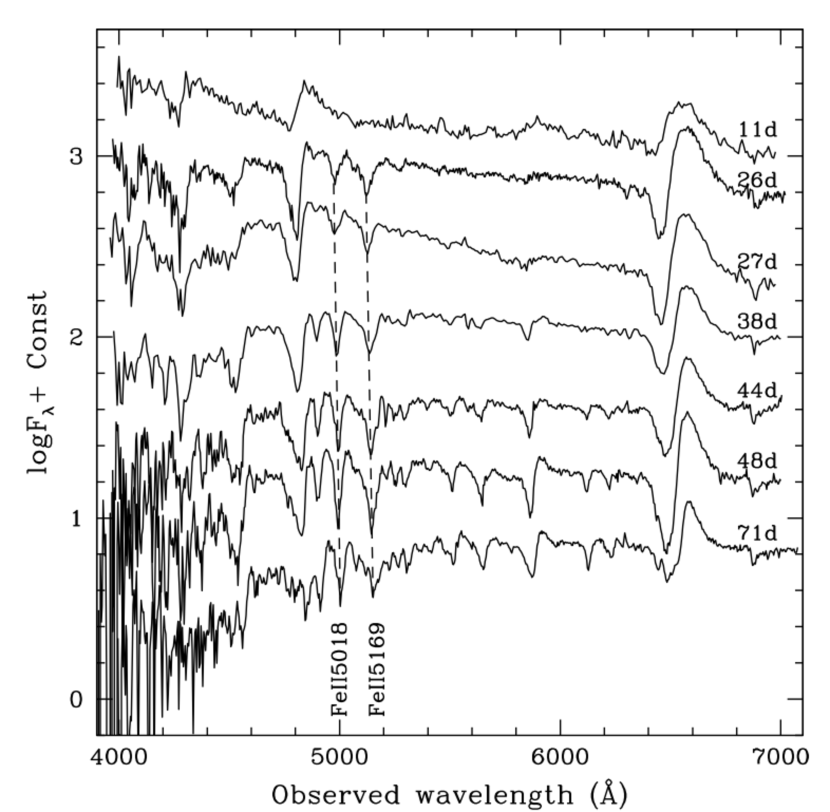
Spectroscopic observations were obtained at the 2-m telescope of Shamakhy Astrophysical Observatory. The modified Universal Astronomical Grating Spectrograph provided the wavelength range of 3900 – 7000 Å with a dispersion of 115Å mm-1, which corresponds to 4.1 or 8.2 Å pixel-1 for different CCD binning. The journal of spectroscopic observations is presented in Table 5, the spectra are shown in Fig. 2.
We continue the observations of SN 2018aoq, the complete set of data and its analysis will be presented in a separate paper.
3 The EPM distance
The Expanding Photosphere Method (EPM) (Kirshner & Kwan, 1974) determines a distance to the SN from the relation , where is the angular radius of photosphere, is its linear radius.
The method can be applied if the ejecta is spherically symmetric, the envelope undergoes free expansion, so that the velocity of matter and the radial distance are connected by , where is the zero-point time, which might be offset from the true moment of explosion.
The photospheric flux of SN is described by a modified Planck spectrum , where is the correction factor, is the colour temperature, is the Planck function.
The description of the EPM is presented in a number of papers, (e.g., Hamuy et al., 2001; Takáts & Vinkó, 2006; Jones et al., 2009; Gall et al., 2018). We applied the EPM following the prescriptions of Hamuy et al. (2001).
The correction factor cannot be determined from observations. The empirical relations between and were established by Eastman et al. (1996) and Dessart & Hillier (2005). We used the relation by Dessart & Hillier (2005), which is confirmed by our research (Baklanov, in prep.) and by Vogl et al. (2018).
We used three sets of filter combinations to derive the temperature and angular radius of SN photosphere. The errors in quantities and were estimated using Monte Carlo technique. Samples of data points were drawn from normal distributions of uncertainty in the photometric fluxes.
The velocity of matter at the photosphere can be measured by the blueshift of weak absorption lines, the lines of FeII 5018Å and 5169Å are used more often (Takáts & Vinkó, 2012). The observed spectra were corrected for the redshift of the galaxy 333https://ned.ipac.caltech.edu/ and continuum subtracted, using polynome fitting with the SNID package (Blondin & Tonry, 2007). The spectra were smoothed with a Savitzky-Golay filter (Savitzky & Golay, 1964) and wavelengths of absorption minima were determined. The uncertainties of velocity measurements were estimated to be in the range of 4–6%, depending on the spectral resolution and photon statistics of the detector.
The computations were carried out for three sets of filter combinations: , , and , for the velocities derived from the lines FeII5018, 5169 and for the average velocities.
Table 1 presents the basic EPM quantities. , and are given only for the filter set, for other sets they are similar.
| JD | Phase, | (FeII5018) | (FeII5169) | |||
|---|---|---|---|---|---|---|
| 2458200+ | days | km s-1 | km s-1 | K | rad | |
| 34.36 | 26.4 | 3529 (140) | 3893 (154) | 7022 (225) | 0.662 | 1.62 (0.11) |
| 35.33 | 27.3 | 3529 (234) | 3893 (231) | 6968 (212) | 0.667 | 1.63 (0.10) |
| 46.35 | 38.4 | 3125 (185) | 3083 (183) | 6245 (181) | 0.747 | 1.80 (0.12) |
| 52.45 | 45.5 | 2707 (108) | 2680 (106) | 5975 (184) | 0.786 | 1.88 (0.14) |
| 56.40 | 48.4 | 2706 (108) | 2666 (106) | 5703 (187) | 0.833 | 1.95 (0.17) |
| 79.39 | 71.4 | 1903 (75) | 1862 (90) | 5365 (135) | 0.905 | 1.94 (0.13) |
The ratio as a function of time for the filter sets , , and is presented in Fig. 3.
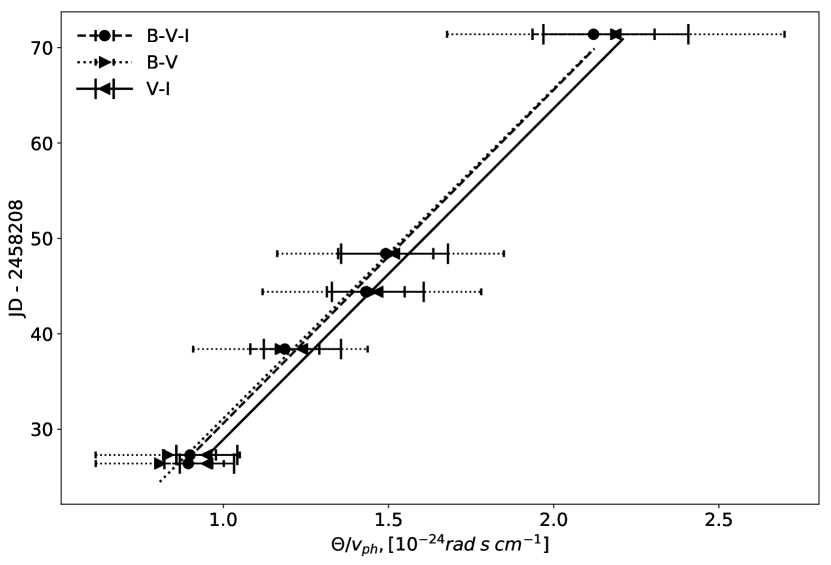
We determined and using the Markov Chain Monte Carlo method in the EMCEE software package (Foreman-Mackey et al., 2013).
The results are presented in Table 2.
| Filter set | FeII line | , Mpc | , JD 2458000+ |
|---|---|---|---|
| 5018 | 21.4 (2.6) | 200.3 (5.5) | |
| 5169 | 19.4 (1.7) | 205.8 (3.2) | |
| Average | 20.2 (2.1) | 203.5 (4.3) | |
| 5018 | 19.9 (3.9) | 203.3 (7.7) | |
| 5169 | 19.7 (3.6) | 204.3 (6.5) | |
| Average | 20.0 (3.9) | 203.3 (7.6) | |
| 5018 | 21.0 (3.3) | 199.2 (7.0) | |
| 5169 | 19.1 (2.2) | 204.6 (4.4) | |
| Average | 19.8 (2.7) | 202.4 (5.6) |
4 The SCM distance
The Standardized Candle Method (SCM) (Hamuy & Pinto, 2002) is based on a correlation between the absolute brightness of SNe II-P and the expansion velocities derived from the minimum of the FeII P-Cygni feature observed during the plateau phase.
We used our estimates of expansion velocity from the shift of FeII line and photometry in the bands and applied the SCM using the calibration by Polshaw et al. (2015), based on the Cepheid distances to well-observed SNe II-P. We obtain distance estimates Mpc, Mpc, and the average Mpc.
5 Discussion
All distance estimates presented in Table 2 are consistent with each other, and we may accept the average value Mpc as the EPM distance for SN 2018aoq and NGC 4151, which is in good agreement with the result of Hönig et al. (2014).
The estimates of are earlier than the explosion epoch derived from photometry, but for most of the data the difference does not exceed the uncertainties. We should note that the epoch from the EPM fit may be offset from the explosion date (Takáts & Vinkó, 2006).
Recently O’Neill et al. (2019) utilised the SCM method for SN 2018aoq as calibrated by Polshaw et al. (2015) to obtain a distance of Mpc. Our SCM distance is about 9% shorter than the result of O’Neill et al. (2019), because of small differences in the observational data.
The expansion velocity of SN 2018aoq is low, about 2600 km s-1 at 50 days past explosion. The luminosity at the plateau is mag for the EPM distance, and mag for the SCM distance. SN 2018aoq appears to be an intermediate object between subluminous and normal SNe II-P, as was suggested by O’Neill et al. (2019).
The distance measurements by the EPM and SCM may have systematic errors, for the EPM they result from the adopted values of dilution factor , which may also be a function of chemical composition and density structure of the envelope. Other reasons for uncertainty are the difference of photospheric velocity from that derived from the FeII lines and absence of spherical symmetry of the ejecta. The major sources of errors for the SCM are the calibration process and the internal diversity of the properties of SNe II-P.
In the case of SN 2018aoq the SCM distance is about 18% shorter than the EPM distance, but both values are consistent with the most reliable distance estimate for the host galaxy Mpc, based on geometric technique (Hönig et al., 2014).
We may conclude that these results confirm the applicability of SNe II-P for distance measurements.
Acknowledgements
The work of D.Tsvetkov and P.Baklanov was partly supported by the Russian Science Foundation Grant No. 16-12-10519. The work of S.Shugarov was partially supported by Grants VEGA 2/0008/17 and APVV-15-0458. The work of I.Volkov was supported by the scholarship of the Slovak Academic Information Agency (SAIA), by the Russian Science Foundation Grant No. 14-12-00146 and Russian Foundation for Basic Research Grant No. 18-502-12025. The work on photospheric velocity determination was done by M.Sh.Potashov and was supported by the Russian Science Foundation Grant No. 19-12-00229. We thank the anonymous referee for constructive suggestions which helped to improve the paper.
References
- Blondin & Tonry (2007) Blondin S., Tonry J. L., 2007, ApJ, 666, 1024
- Bose & Kumar (2014) Bose S., Kumar B., 2014, ApJ, 782, 98
- Cackett et al. (2007) Cackett E. M., Horne K., Winkler H., 2007, MNRAS, 380, 669
- Dessart & Hillier (2005) Dessart L., Hillier D. J., 2005, A&A, 439, 671
- Doroshenko et al. (2005) Doroshenko V. T., Sergeev S. G., Merkulova N. I., Sergeeva E. A., Golubinsky Y. V., Pronik V. I., Okhmat N. N., 2005, Afz, 48, 156
- Eastman et al. (1996) Eastman R. G., Schmidt B. P., Kirshner R., 1996, ApJ, 466, 911
- Foreman-Mackey et al. (2013) Foreman-Mackey D., Hogg D. W., Lang D., Goodman J., 2013, PASP, 125, 306
- Gall et al. (2015) Gall E. E. E., et al., 2015, A&A, 582, A3
- Gall et al. (2016) Gall E. E. E., Kotak R., Leibundgut B., Taubenberger S., Hillebrandt W., Kromer M., 2016, A&A, 592, A129
- Gall et al. (2018) Gall E. E. E., et al., 2018, A&A, 611, A25
- Hamuy & Pinto (2002) Hamuy M., Pinto P. A., 2002, ApJ, 566, L63
- Hamuy et al. (2001) Hamuy M., et al., 2001, ApJ, 558, 615
- Hönig et al. (2014) Hönig S. F., Watson D., Kishimoto M., Hjorth J., 2014, Nature, 515, 528
- Jones et al. (2009) Jones M. I., et al., 2009, ApJ, 696, 1176
- Kirshner & Kwan (1974) Kirshner R. P., Kwan J., 1974, ApJ, 193, 27
- Lyutyi (1973) Lyutyi V. M., 1973, Soviet Ast., 16, 763
- Nazarov et al. (2018) Nazarov S. V., Okhmat D. N., Sokolovsky K. V., Denisenko D. V., 2018, The Astronomer’s Telegram, 11498
- Nugent et al. (2006) Nugent P., et al., 2006, ApJ, 645, 841
- O’Neill et al. (2019) O’Neill D., et al., 2019, A&A, 622, L1
- Olivares E. et al. (2010) Olivares E. F., et al., 2010, ApJ, 715, 833
- Onken et al. (2014) Onken C. A., et al., 2014, ApJ, 791, 37
- Polshaw et al. (2015) Polshaw J., et al., 2015, A&A, 580, L15
- Poznanski et al. (2009) Poznanski D., et al., 2009, ApJ, 694, 1067
- Roberts & Rumstay (2012) Roberts C. A., Rumstay K. R., 2012, Journal of the Southeastern Association for Research in Astronomy, 6, 47
- Savitzky & Golay (1964) Savitzky A., Golay M. J. E., 1964, Analytical Chemistry, 36, 1627
- Schlafly & Finkbeiner (2011) Schlafly E. F., Finkbeiner D. P., 2011, ApJ, 737, 103
- Takáts & Vinkó (2006) Takáts K., Vinkó J., 2006, MNRAS, 372, 1735
- Takáts & Vinkó (2012) Takáts K., Vinkó J., 2012, MNRAS, 419, 2783
- Tully et al. (2009) Tully R. B., Rizzi L., Shaya E. J., Courtois H. M., Makarov D. I., Jacobs B. A., 2009, AJ, 138, 323
- Vogl et al. (2018) Vogl C., Sim S. A., Noebauer U. M., Kerzendorf W. E., Hillebrandt W., 2018, arXiv e-prints,
- Yamanaka et al. (2018) Yamanaka M., Nakaoka T., Kawabata M., Kimura H., Kawabata K. S., 2018, The Astronomer’s Telegram, 11526
- Yoshii et al. (2014) Yoshii Y., Kobayashi Y., Minezaki T., Koshida S., Peterson B. A., 2014, ApJ, 784, L11
A
Appendix A Data tables
| (J2000) | (J2000) | References | |||||
|---|---|---|---|---|---|---|---|
| 12:09:53.538 | 39:26:00.15 | 11.68 | 9.76 | 8.15 | 1 | ||
| 12:10:31.442 | 39:26:41.26 | 13.24 | 12.47 | 11.45 | 10.92 | 10.44 | 1,2,3 |
| 12:10:25.255 | 39:23:55.45 | 15.08 | 14.38 | 13.99 | 13.66 | 3 | |
| 12:10:38.529 | 39:20:29.56 | 15.61 | 14.01 | 12.77 | 12.10 | 11.50 | 1,2 |
| JD | Phase, | Telescope | ||||||||||
|---|---|---|---|---|---|---|---|---|---|---|---|---|
| 2458000+ | days | |||||||||||
| 209.46 | 1.5 | 15.59 | 0.04 | 15.73 | 0.04 | 15.49 | 0.06 | 15.82 | 0.09 | K70 | ||
| 213.30 | 5.3 | 15.51 | 0.06 | 15.44 | 0.08 | 15.28 | 0.05 | M20 | ||||
| 213.39 | 5.4 | 15.44 | 0.04 | 15.47 | 0.03 | 15.29 | 0.03 | 15.16 | 0.04 | C50 | ||
| 213.42 | 5.4 | 15.30 | 0.04 | 15.43 | 0.04 | 15.23 | 0.08 | 15.22 | 0.05 | C60 | ||
| 214.39 | 6.4 | 15.32 | 0.04 | 15.43 | 0.05 | 15.20 | 0.04 | 15.16 | 0.04 | C60 | ||
| 215.32 | 7.3 | 14.52 | 0.05 | 15.28 | 0.04 | 15.40 | 0.04 | 15.19 | 0.04 | 15.15 | 0.04 | C60 |
| 216.33 | 8.3 | 14.57 | 0.05 | 15.33 | 0.04 | 15.42 | 0.03 | 15.21 | 0.04 | 15.16 | 0.04 | C60 |
| 217.32 | 9.3 | 14.58 | 0.07 | 15.45 | 0.05 | 15.26 | 0.03 | 15.21 | 0.04 | C60 | ||
| 217.52 | 9.5 | 14.77 | 0.05 | 15.54 | 0.04 | 15.46 | 0.03 | 15.24 | 0.04 | 15.23 | 0.04 | T60 |
| 218.36 | 10.4 | 14.79 | 0.05 | 15.44 | 0.04 | 15.46 | 0.04 | 15.25 | 0.04 | 15.20 | 0.04 | C60 |
| 219.35 | 11.4 | 14.84 | 0.05 | 15.50 | 0.04 | 15.50 | 0.04 | 15.24 | 0.04 | 15.20 | 0.04 | C60 |
| 220.27 | 12.3 | 15.26 | 0.05 | 15.25 | 0.09 | M20 | ||||||
| 221.33 | 13.3 | 15.14 | 0.14 | 15.50 | 0.06 | 15.51 | 0.03 | 15.22 | 0.03 | 15.14 | 0.04 | C60 |
| 222.34 | 14.3 | 15.20 | 0.13 | 15.55 | 0.05 | 15.53 | 0.03 | 15.16 | 0.05 | 15.17 | 0.03 | C60 |
| 223.28 | 15.3 | 15.52 | 0.05 | 15.24 | 0.05 | 15.13 | 0.09 | M20 | ||||
| 224.31 | 16.3 | 15.36 | 0.05 | 15.67 | 0.04 | 15.52 | 0.03 | 15.22 | 0.03 | 15.15 | 0.03 | C60 |
| 230.36 | 22.4 | 16.18 | 0.06 | 16.06 | 0.04 | 15.63 | 0.03 | 15.29 | 0.03 | 15.15 | 0.03 | C60 |
| 231.36 | 23.4 | 16.17 | 0.04 | 15.68 | 0.03 | 15.32 | 0.04 | 15.17 | 0.03 | C50 | ||
| 232.30 | 24.3 | 16.22 | 0.04 | 15.70 | 0.04 | 15.33 | 0.04 | 15.17 | 0.04 | M70 | ||
| 232.34 | 24.3 | 16.25 | 0.04 | 15.68 | 0.03 | 15.33 | 0.04 | 15.18 | 0.03 | C50 | ||
| 234.28 | 26.3 | 15.66 | 0.03 | 15.21 | 0.03 | A60 | ||||||
| 235.25 | 27.2 | 16.34 | 0.07 | 15.67 | 0.03 | 15.37 | 0.03 | A60 | ||||
| 235.35 | 27.4 | 16.33 | 0.05 | 15.69 | 0.04 | 15.34 | 0.03 | 15.19 | 0.04 | C50 | ||
| 236.29 | 28.3 | 16.70 | 0.06 | 16.32 | 0.04 | 15.67 | 0.04 | 15.33 | 0.03 | 15.19 | 0.04 | T60 |
| 236.30 | 28.3 | 16.38 | 0.06 | 15.70 | 0.04 | 15.34 | 0.04 | 15.15 | 0.04 | C50 | ||
| 236.47 | 28.5 | 16.35 | 0.04 | 15.70 | 0.03 | 15.35 | 0.03 | 15.13 | 0.04 | M70 | ||
| 237.30 | 29.3 | 16.42 | 0.04 | 15.67 | 0.03 | 15.34 | 0.03 | 15.16 | 0.04 | C50 | ||
| 240.31 | 32.3 | 16.42 | 0.05 | 15.72 | 0.04 | 15.29 | 0.05 | 15.14 | 0.05 | C50 | ||
| 241.26 | 33.3 | 15.76 | 0.04 | 15.39 | 0.03 | 15.17 | 0.03 | A60 | ||||
| 241.34 | 33.3 | 16.49 | 0.04 | 15.70 | 0.03 | 15.35 | 0.03 | 15.13 | 0.03 | C50 | ||
| 242.28 | 34.3 | 16.51 | 0.04 | 15.71 | 0.04 | 15.35 | 0.04 | 15.09 | 0.04 | M70 | ||
| 242.32 | 34.3 | 16.50 | 0.04 | 15.72 | 0.03 | 15.33 | 0.03 | 15.13 | 0.03 | C50 | ||
| 243.32 | 35.3 | 16.51 | 0.04 | 15.71 | 0.03 | 15.32 | 0.03 | 15.11 | 0.03 | C50 | ||
| 245.34 | 37.3 | 17.05 | 0.06 | 16.56 | 0.04 | 15.69 | 0.04 | 15.32 | 0.04 | 15.10 | 0.05 | C60 |
| 246.28 | 38.3 | 16.58 | 0.04 | 15.70 | 0.03 | 15.33 | 0.04 | 15.08 | 0.04 | M70 | ||
| 246.41 | 38.4 | 16.66 | 0.06 | 15.73 | 0.04 | 15.29 | 0.04 | 15.11 | 0.04 | A60 | ||
| 249.31 | 41.3 | 16.58 | 0.05 | 15.71 | 0.03 | 15.30 | 0.04 | 15.11 | 0.04 | M70 | ||
| 249.38 | 41.4 | 16.61 | 0.04 | 15.70 | 0.04 | 15.29 | 0.03 | 15.10 | 0.04 | T60 | ||
| 250.32 | 42.3 | 16.60 | 0.04 | 15.68 | 0.03 | 15.32 | 0.04 | 15.08 | 0.05 | M70 | ||
| 253.37 | 45.4 | 16.66 | 0.04 | 15.74 | 0.06 | 15.32 | 0.05 | 15.02 | 0.04 | A60 | ||
| 254.35 | 46.4 | 16.64 | 0.05 | 15.68 | 0.04 | 15.28 | 0.03 | 15.02 | 0.04 | M70 | ||
| 255.42 | 47.4 | 15.72 | 0.05 | 15.33 | 0.05 | 15.11 | 0.03 | A60 | ||||
| 256.35 | 48.4 | 16.60 | 0.04 | 15.74 | 0.04 | 15.33 | 0.05 | 15.05 | 0.04 | A60 | ||
| 257.36 | 49.4 | 16.68 | 0.03 | 15.78 | 0.04 | 15.36 | 0.04 | 15.03 | 0.04 | A60 | ||
| 260.34 | 52.3 | 16.77 | 0.04 | 15.73 | 0.03 | 15.31 | 0.04 | 15.04 | 0.05 | M70 | ||
| 262.30 | 54.3 | 16.86 | 0.05 | 15.73 | 0.04 | 15.31 | 0.04 | 15.05 | 0.04 | M70 | ||
| 263.33 | 55.3 | 16.87 | 0.05 | 15.74 | 0.04 | 15.26 | 0.04 | 14.98 | 0.05 | M70 | ||
| 264.32 | 56.3 | 16.79 | 0.05 | 15.74 | 0.03 | 15.30 | 0.03 | 15.05 | 0.04 | M70 | ||
| 267.34 | 59.3 | 16.85 | 0.05 | 15.77 | 0.04 | 15.33 | 0.03 | 15.05 | 0.05 | M70 | ||
| 271.31 | 63.3 | 16.98 | 0.05 | 15.78 | 0.04 | 15.32 | 0.03 | 15.07 | 0.05 | M70 | ||
| 271.38 | 63.4 | 16.87 | 0.04 | 15.77 | 0.03 | 15.31 | 0.03 | 15.01 | 0.03 | S100 | ||
| 272.31 | 64.3 | 16.93 | 0.04 | 15.79 | 0.05 | 15.32 | 0.05 | 15.05 | 0.04 | S100 | ||
| 273.35 | 65.4 | 16.91 | 0.05 | 15.79 | 0.06 | 15.34 | 0.05 | 15.05 | 0.05 | S100 | ||
| 275.27 | 67.3 | 16.88 | 0.05 | 15.81 | 0.07 | 15.02 | 0.03 | A60 | ||||
| 277.27 | 69.3 | 16.95 | 0.05 | 15.82 | 0.04 | 15.34 | 0.03 | 15.06 | 0.04 | S100 | ||
| 278.30 | 70.3 | 16.97 | 0.05 | 15.85 | 0.05 | 15.37 | 0.05 | 15.09 | 0.04 | S100 | ||
| 282.31 | 74.3 | 17.05 | 0.06 | 15.87 | 0.08 | 15.42 | 0.05 | 15.06 | 0.03 | A60 | ||
| 283.29 | 75.3 | 17.02 | 0.04 | 15.83 | 0.04 | 15.36 | 0.04 | 15.05 | 0.04 | S100 | ||
| 283.33 | 75.3 | 15.84 | 0.04 | 15.32 | 0.04 | 15.02 | 0.04 | M70 | ||||
| 284.29 | 76.3 | 16.94 | 0.05 | 15.84 | 0.04 | 15.37 | 0.04 | 15.07 | 0.05 | S100 | ||
| 285.35 | 77.4 | 17.10 | 0.07 | 15.86 | 0.07 | 15.42 | 0.05 | 15.00 | 0.05 | A60 | ||
| 285.37 | 77.4 | 17.05 | 0.06 | 15.80 | 0.03 | 15.32 | 0.03 | M70 | ||||
| 288.32 | 80.3 | 15.85 | 0.05 | 15.32 | 0.07 | 15.05 | 0.11 | M70 | ||||
| 290.32 | 82.3 | 15.87 | 0.06 | 15.36 | 0.06 | M70 | ||||||
| 299.30 | 91.3 | 17.15 | 0.05 | 15.98 | 0.04 | 15.48 | 0.04 | 15.18 | 0.04 | S100 | ||
| 308.44 | 100.4 | 15.97 | 0.12 | 15.50 | 0.05 | 15.11 | 0.11 | S100 |
A60 = 60-cm reflector of Shamakhy Observatory, C60 = 60-cm reflector of Crimean Observatory of SAI, C50 = 50-cm meniscus telescope of Crimean Observatory of SAI, T60 = 60-cm reflector of Stará Lesná Observatory, S100 = 1-m reflector at Simeiz Observatory, M70 = 70-cm reflector of Moscow Observatory of SAI, M20 = 20-cm meniscus telescope of Moscow Observatory of SAI, K70 = 70-cm reflector of Crimean Astrophysical Observatory (reprocessing of data by Nazarov et al. (2018))
| JD 2458200+ | Phase | Exp. time (s) | CCD binning |
|---|---|---|---|
| 19.34 | 11.3 | 900 | 8x8 |
| 34.36 | 26.4 | 3600 | 4x4 |
| 35.33 | 27.3 | 1200 | 8x8 |
| 46.35 | 38.4 | 1800 | 8x8 |
| 52.45 | 44.5 | 3600 | 4x4 |
| 56.40 | 48.4 | 3600 | 4x4 |
| 79.39 | 71.4 | 3600 | 4x4 |