.tifpng.pngconvert #1 \OutputFile \AppendGraphicsExtensions.tif
Velocity and spatial distribution of inertial particles in a turbulent channel flow
Abstract
We present experimental observations of the velocity and spatial distribution of inertial particles dispersed in the turbulent downward flow through a vertical channel at friction Reynolds numbers and 335. The working fluid is air laden with size-selected glass micro-spheres, having Stokes numbers St = (10) and (100) when based on the Kolmogorov and viscous time scales, respectively. Cases at solid volume fractions and are considered. In the more dilute regime, the particle concentration profile shows near-wall and centerline maxima compatible with a turbophoretic drift down the gradient of turbulence intensity; the particles travel at similar speed as the unladen flow except in the near-wall region; and their velocity fluctuations generally follow the unladen flow level over the channel core, exceeding it in the near-wall region. The denser regime presents substantial differences in all measured statistics: the near-wall concentration peak is much more pronounced, while the centerline maximum is absent; the mean particle velocity decreases over the logarithmic and buffer layers; and particle velocity fluctuations and deposition velocities are enhanced. An analysis of the spatial distributions of particle positions and velocities reveals different behaviors in the core and near-wall regions. In the channel core, dense clusters form which are somewhat elongated, tend to be preferentially aligned with the vertical/streamwise direction, and travel faster than the less concentrated particles. In the near-wall region, the particles arrange in highly elongated streaks associated to negative streamwise velocity fluctuations, several channel height in length and spaced by (100) wall units, supporting the view that these are coupled to fluid low-speed streaks typical of wall turbulence. The particle velocity fields contain a significant component of random uncorrelated motion, more prominent for higher St and in the near-wall region.
1 Introduction
Wall-bounded turbulent flows laden with inertial particles are relevant to a broad spectrum of environmental, biomedical and industrial processes. Examples include sediment transport in rivers (Nino & Garcia, 1996), aerosol inhalation in human airways (Kleinstreuer & Zhang, 2010), and reactors in chemical engineering processes (Capecelatro et al., 2014). The motion of heavy particles in homogeneous turbulence is already complex, featuring well-known (though not fully understood) phenomena such as preferential concentration and consequent clustering (Eaton & Fessler 1994, Monchaux et al. 2012, Bragg & Collins 2014, Gustavsson & Mehlig 2016). The latter is thought to be maximized when the particle response time, , is comparable to the Kolmogorov time scale, , such that the Stokes number is of order unity (Wang & Maxey 1993, Fessler et al. 1994). In the presence of a wall, a mean drift of the particles sets up following the negative gradient of turbulence intensity (so-called turbophoresis) and causing a segregation of particles towards the wall (Caporaloni et al. 1975, Reeks 1983, Young & Leeming 1997, Guha 2008, Fouxon et al. 2018). The relevant parameter is usually considered the Stokes number , where is the viscous time scale, with strong turbophoresis for (e.g., Marchioli & Soldati 2002, Sardina et al. 2012a, Bernardini 2014). Moreover, inertial particles were experimentally observed to arrange in long near-wall streaks (Kaftori et al. 1995a, Kaftori et al. 1995b, Nino & Garcia 1996), and numerical simulations demonstrated the role of coherent turbulent structures in determining such behavior (McLaughlin 1989; Zhang & Ahmadi 2000; Rouson & Eaton 2001; Marchioli & Soldati 2002; Soldati & Marchioli 2009; Sardina et al. 2012a; Nilsen et al. 2013; Richter & Sullivan 2013; Bernardini 2014). For typical Reynolds numbers used in laboratory and computational studies, the parameter ranges leading to both clustering and turbophoresis overlap. In fact, it has been argued that both phenomena represent different aspects of the same process (Sardina et al., 2012a). Moreover, although rarely discussed in particle-laden turbulence studies, inelastic particle collisions may also contribute to near-wall particle accumulation (Hrenya & Sinclair, 1997). Other relevant experiments with similar scope includes the vertical pipe study of Varaksin et al. (2000) and the horizontal channel study of Wu et al. (2006).
Most of the studies mentioned above considered very dilute particles smaller than all scales of the flow – a regime in which the backreaction of the dispersed phase on the carrier fluid is usually deemed negligible. According to Elghobashi (1994), this condition (referred to as one-way coupling) is satisfied only for volume fractions , while at higher loadings the particles do influence the turbulence (two-way coupling). Such classification, however, was merely proposed as a guideline for numerical approaches; the boundary between both regimes is problem-dependent and is affected by other physical parameters, including the particle-to-fluid density ratio, . In wall-bounded turbulence, the flow dynamics and the local particle concentration also evolve with wall distance, especially in the presence of turbophoresis. Several numerical studies investigated the two-way coupled regime by direct numerical simulation (DNS) of wall turbulence, representing the particles as material points that exchange momentum with the fluid (see, for example, Pan & Banerjee 1996; Vreman 2007; Zhao et al. 2010; Dritselis & Vlachos 2011; Richter & Sullivan 2013; Richter & Sullivan 2014; Li et al. 2016; Wang & Richter 2018). The particles were found to affect the ejection-sweep cycle, the dynamics of streamwise vortices, the formation and strength of hairpin eddies, and in general to significantly modify the fluid Reynolds stresses. These modifications to the flow, in turn, altered the particle transport and thus their concentration and velocity statistics. With increasing of the particle mass loading, , simulations also indicated the sizeable effect of inter-particle collision (four-way coupling), notably in reducing the near-wall concentration otherwise enhanced by turbophoresis (Li et al. 2001; Vreman 2007, Nasr et al. 2009, Kuerten & Vreman 2015). Recently Capecelatro et al. (2018) demonstrated a dramatic change from shear-production-dominated to drag-production-dominated regimes when the mass loading increased from (0.1) to (10).
Despite the remarkable insight offered by the point-particle approach, this method presents well-known limitations, partly related to the point-wise forcing on the fluid computational grid (Eaton 2009, Balachandar & Eaton 2010). To overcome these shortcomings, advanced simulation strategies have been proposed (Capecelatro & Desjardins 2013, Gualtieri et al. 2015, Horwitz & Mani 2016, Ireland & Desjardins 2017, Balachandar et al. 2019). In general, our understanding of the physics of two-way coupled particle-laden turbulence is still incomplete, and as a result any simplified model may miss or misestimate significant aspects (Balachandar & Eaton, 2010). The availability of ever-increasing computational capabilities has allowed particle-resolved DNS to investigate relatively large numbers of particles in wall-bounded turbulent flows without the need of modeling the momentum exchange (Garcia-Villalba et al. 2012; Picano et al. 2015; Lin et al. 2017; Wang et al. 2017). Those studies, however, can typically deal with particles much larger than the viscous scales, as opposed to the millions of sub-Kolmogorov particles usually present in point-particle simulations. The latter situation is most relevant to gas-solid mixtures.
In this scenario, the importance of well-controlled laboratory experiments is paramount to reach a predictive understanding of these regimes, and to inform and validate numerical models. Unfortunately, similar studies are rare in the literature and cover limited portions of the parameter space. Several past experiments considered particle-laden water flows with (1) and particle diameters of several wall units (Kaftori et al. 1995a; Kaftori et al. 1995b; Nino & Garcia 1996; Kiger & Pan 2002; Righetti & Romano 2004; Rabencov et al. 2014; Oliveira et al. 2017; Shokri et al. 2017). These conditions are relevant to sediment transport and pipelines, but not to other important applications such as dust and particulate transport in air. For gas-solid suspensions, a non-exhaustive list of previous experiments and their relevant physical parameters is provided in table 1. Currently, the main reference is still represented by the vertical channel flow measurements by Eaton and co-workers. In particular, Fessler et al. (1994) and Kulick et al. (1994) provided seminal insight into preferential concentration and turbulence modulation for a variety of regimes. However, Benson et al. (2005) showed that their apparatus presented substantial wall roughness due to particle deposition on the walls, which according to Vreman (2015) partly explained the disagreement with simulations. Benson et al. (2005) repeated the measurements with a smooth test section, only focusing on the most inertial particles that did not display turbophoresis. Taniere et al. (1997) investigated a particle-laden boundary layer in a horizontal wind tunnel, focusing on particles with . As in all horizontal flow configurations, the particle concentration profile was strongly impacted by gravity. Kussin & Sommerfeld (2002) measured particle motion and concentration as well as turbulence modulation in a horizontal channel flow with rough walls. Their particles were highly inertial and could not display turbophoresis or turbulence-induced clustering. Caraman et al. (2003) considered a vertical particle-laden pipe flow in a regime where turbophoresis is expected, and carried out a detailed analysis of the moments of the particle velocity. Still, comparison with simulations was hampered by the measurement station being downstream of the pipe exit, the lack of concentration profiles, and possible wall roughness (Vreman, 2007). Khalitov & Longmire (2003) conducted measurements in a vertical channel flow laden with glass spheres of various sizes, covering a range of Stokes numbers for which turbophoresis is expected. They documented both particle-particle and gas-particle velocity correlations in the streamwise and spanwise directions, but not the concentration profiles. Hadinoto et al. (2005) considered a vertical pipe flow laden with glass beads that were too inertial to segregate at the wall. Li et al. (2012) imaged inertial particles at in a range of concentrations where two-way coupling effects are expected to be weak. Because their channel was horizontal and they only reported data near the bottom wall, possible turbophoresis was not distinguishable from gravitational settling.
Overall, there is a clear lack of laboratory observations of wall-bounded gas-solid flows in regimes where preferential concentration and turbophoresis are at play. In particular, little is known on the changes occurring when varying the loading across what is considered the boundary between one-way and two-way coupling. Liquid-solid flow studies cannot compensate for these deficiencies in the literature, as the momentum coupling is heavily affected by the density ratio. Importantly, concentration profiles are seldom reported, and therefore near-wall segregation (clearly evident in simulations) has not been fully documented. The seminal studies usually cited as experimental evidence of this phenomenon (e.g., Kaftori et al. 1995a; Kaftori et al. 1995b) were carried out in horizontal flumes where gravitational effects may be important. In order to bridge such knowledge gap, the present study experimentally investigates the transport of small solid particles in turbulent air flowing downward in a smooth-wall vertical channel. We focus on regimes (summarized in table 1) for which significant clustering and turbophoresis are expected, and use planar imaging to analyze the particle behavior for different levels of mass loading. The paper is organized as follows: in §2 we describe the laboratory facility and the methods used to conduct the experiments and analyze the data; in §3 we present the wall-normal profiles of particle concentration and velocities, and the spatial fields along wall-parallel planes at the channel core and near the wall; conclusions and an outlook for further research are provided in §4.
| Configuration | Wall quality | ||||||
| Fessler et al. (1994) | 630 | 27-150 | 0.8-3 | - | 0.03-1 | Vertical channel | Rough |
| Kulick et al. (1994) | 630 | 1500-2000 | 2.5-3 | - | 0.02-0.8 | Vertical channel | Rough |
| Taniere et al. (1997) | 1700 | 270-540 | 1.6-2.3 | 0.006-0.01 | Horizontal boundary layer | Smooth | |
| Kussin & Sommerfeld (2002) | 700-1300 | 570-7800 | 3-38 | - | 0.1-1 | Horizontal channel | Rough |
| Caraman et al. (2003) | 133 | 70 | 0.8 | 0.11 | Vertical pipe | Smooth | |
| Khalitov & Longmire (2003) | 238 | 50-3190 | 0.6-5.1 | 0.1 | Vertical channel | Smooth | |
| Hadinoto et al. (2005) | 253-544 | 730-2700 | 0.8-15 | 0.7 | Vertical pipe | Smooth | |
| Benson et al. (2005) | 630 | 1800 | 5 | 0.15 | Vertical channel | Smooth, rough | |
| Li et al. (2012) | 430 | 100 | 1.7 | - | 0.00025-0.005 | Horizontal channel | Smooth |
| Present study | 235-335 | 64-130 | 0.8-1.1 | - | 0.006-0.1 | Vertical channel | Smooth |
2 Experimental method
2.1 Experimental facility and parameters
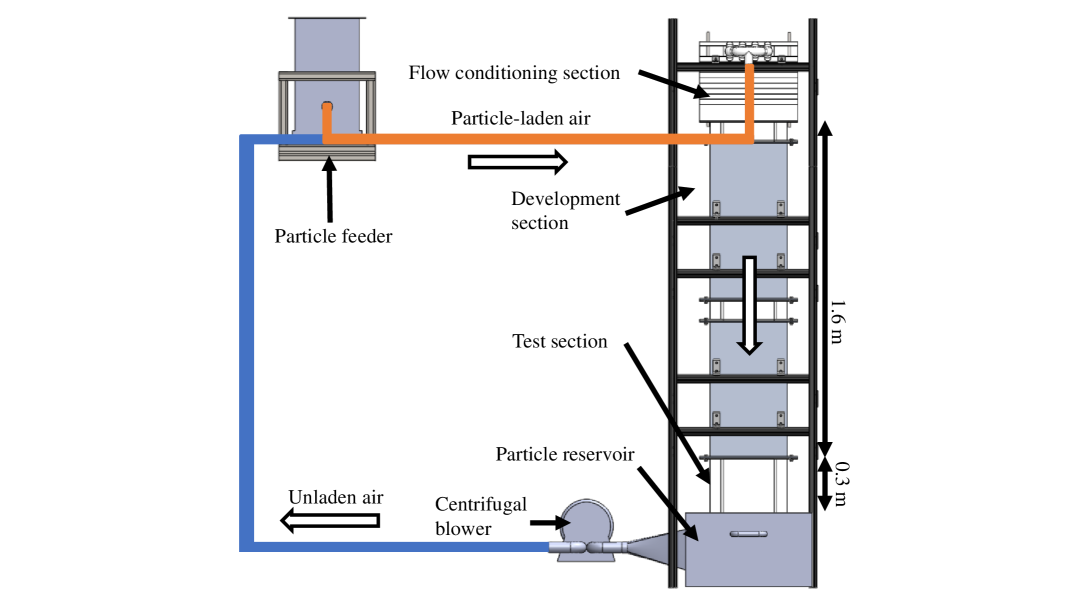
Experiments are conducted in a vertical recirculating wind tunnel depicted in figure 1, featuring a 1.9 m long rectangular channel with a 0.24 m by 0.03 m cross-section. A 1.5 kW centrifugal blower (Atlantic Blowers) controlled by a frequency converter drives air downwards, and the flow rate is continuously monitored via a Venturi flowmeter. Before the air enters the channel, size-selected glass beads (Mo-Sci Corp.) with a density of 2500 kg/m3 and diameter of 50 6 (mean standard deviation measured by optical microscopy over samples) are injected into the flow through a precision screw-feeder (Vibra Screw Inc.). This corresponds to a ratio of channel width to particle diameter of . A flow conditioning section consisting of four screens and three honeycombs is placed at the channel inlet to disperse the particles uniformly. The measurement station consists of a 0.3 m long, fully transparent acrylic section that follows a 1.6 m long development section. The latter has a through-flow time 25 - 40 times larger than the particle response time, depending on the air flow regime. Integration of the particle equation of motion with the Schiller and Neumann’s correction (Clift et al., 2005) indicates that the particles reach their terminal velocity in about half the time it takes them to reach the test section. The particles exhausted from the channel are collected in a 109-liter settling chamber, allowing for the run times needed to achieve well-converged statistics without particles being ingested into the blower. Electrostatic dissipative acrylic (SciCron Technologies) is used to build the optical test section, and the channel is provided with static discharge wires grounded to structural supports. This prevents the particles from accumulating upon impaction and building up unwanted roughness, an effect that has impacted past experiments (Benson et al., 2005). This point is demonstrated and elaborated upon in Appendix A.
The fluid and particle parameters for the investigated cases are listed in table 2. Two flow rates are considered, associated with friction Reynolds numbers = 235 and 335, respectively. The particle Reynolds number, defined with the still-air terminal velocity of the particles 0.17 m/s as a representative relative velocity with respect to the fluid, is (here g is the gravitational acceleration). Using the particle root mean square (rms) of the particle velocity fluctuations as a velocity scale leads to higher values, but still within (1), suggesting that particle wakes negligibly affect the flow. The Froude number, defined as the ratio of the centerline fluid velocity over the still-air settling velocity, satisfies the condition . It has been argued that this warrants a negligible influence of gravity (see the boundary layer study of Sardina et al. (2012b), where the freestream velocity is used to define ). However, this condition is not strictly applicable to the near-wall region where the fluid velocity vanishes. Moreover, for particle-turbulence interaction the relevant velocity scale is arguably the fluid rms fluctuation, which at the channel centerline is of the same order as the still-air settling velocity. Indeed, recent measurements in a vertical pipe from Oliveira et al. (2017) at show large differences in particle behavior between downward and upward flow. Therefore, we will not generalize the present findings to other channel orientations, as gravity may play a significant role in this regime (as also discussed in §3).
| LoSt | HiSt | |
| Fluid density, (kg m-3) | 1.2 | |
| Kinematic viscosity, (m2 s-1) | ||
| Channel half height, (mm) | 15 | |
| Fluid centerline velocity, (m s-1) | 4.41 | 6.51 |
| Fluid bulk velocity, (m s-1) | 3.01 | 4.66 |
| Bulk Reynolds number, | 6020 | 9320 |
| Fluid friction velocity, (m s-1) | 0.235 | 0.335 |
| Friction Reynolds number, | 235 | 335 |
| Viscous lengthscale, () | 64 | 45 |
| Viscous timescale, (ms) | 0.27 | 0.13 |
| Kolmogorov scale close to centerline, () | 200 | 150 |
| Kolmogorov timescale (at centerline), (ms) | 2.6 | 1.5 |
| Density, (kg m-3) | 2500 | |
| Mean diameter, () | 50 | |
| Mean diameter in wall units, | 0.78 | 1.1 |
| Aerodynamic response time, (ms) | 17 | |
| Reynolds number, | 0.6 | |
| Froude number, | 26 | 38 |
| Kolmogorov-based Stokes number, | 6.7 | 11.5 |
| Viscous Stokes number, | 64 | 130 |
| Restitution coefficient, | 0.73 | |
The regimes and 335 are associated with different fluid timescales, resulting in two different Stokes number cases referred to as LoSt and HiSt, respectively. The change in Reynolds number, while not inconsequential, is expected to have a lesser impact over the considered range compared to the variation in . The range of and (the latter being defined with the Kolmogorov timescale at the channel centerline in the unladen flow) suggests significant turbophoresis and preferential concentration. For each Stokes number, two sets of measurements are carried out by changing the screw size in the particle feeder, resulting in volume fractions (for a mass loading ) and (), referred to as LoVF and HiVF, respectively. These correspond to global concentrations 46 and 880 particles/cm3, respectively. The four-case matrix is summarized in table 3. The fluid phase parameters in table 2 are based on the unladen flow, characterized by particle image velocimetry (PIV) as described in the following. While the mass loading for the LoVF cases is not expected to produce sizeable changes in the fluid flow, in the HiVF cases the turbulence is likely to be impacted (Kulick et al., 1994), and therefore the listed values of the flow properties should be regarded as estimates.
The coefficient of restitution, for particle-wall collisions is measured in a separate experiment. is defined as the ratio of the wall-normal particle velocity just after and just before the collision; details on the experimental measurements are elaborated upon in Appendix B. It is known that the value of is dependent on the particle Reynolds number and Stokes number based on the particle velocity relative to the fluid (Gondret et al., 2002). However, the terminal velocity happens to be on the order of the rms wall-normal velocity of the particles in the vicinity of the wall (0.02 – 0.05, where is the centerline velocity), as will be shown later. Thus, the quoted restitution coefficient is relevant to the particle-laden flow condition. Still, the actual collision velocity in the channel flow experiment is expected to have significant scatter; possible consequences of such variance are discussed in §4.
| Parameters | ||
|---|---|---|
| LoSt-LoVF | HiSt-LoVF | |
| LoSt-HiVF | HiSt-HiVF |
2.2 Measurement methods
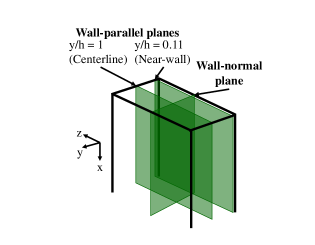
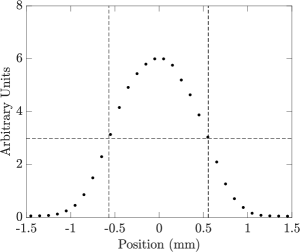
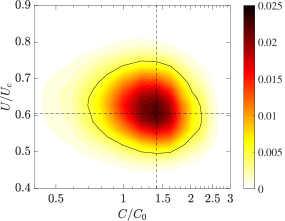
The imaging system consists of a double-pulsed Nd:YAG laser (30 mJ/pulse, New Wave Instruments) and a 1376 1040 pixel CCD camera (Sensicam, PCO Instruments) operated at 5 Hz and synchronized to the laser via a delay generator (BNC-5500, Berkeley Nucleonics). Planar measurements are obtained by shaping the laser beam into a sheet via an optical module combining cylindrical and spherical lenses. For all cases, the measurement locations include a wall-normal plane that contains the channel centerline. We denote with , , and the streamwise, wall-normal, and spanwise directions, the channel walls being located at and . For the HiVF cases, several wall-parallel planes are also imaged and compared, one at the centerline () and one in the near-wall region (), see figure 2a. An additional wall-parallel plane (not shown in figure 2a) is imaged at for comparisons with wall-normal profiles. Spatial calibration and plane location are performed by imaging a target plate mounted on a micrometric traverse, inserted in the channel from the opening at the outflow end. The laser sheet thickness is evaluated using a photodiode (Thorlabs Inc.) coupled with a neutral density filter (CW Optics) and mounted on a traverse. The full width at half maximum is approximately 1.1 mm (Figure 2b).
The unladen (single-phase) case is characterized using 2C-2D PIV along the wall-normal symmetry plane. The flow is seeded with DEHS oil atomized by a Laskin nozzle into 1 - 2 droplets that faithfully follow the flow, their viscous Stokes number being (. For those measurements, the CCD camera mounts a 200-mm Micro-Nikkor lens at f/5.6 to obtain a 13.3 10.1 mm2 field of view. The full channel height is covered by stitching together four slightly overlapping windows. The pulse delay is set to 10 and 15 for the higher and lower flow rate, respectively, keeping the typical tracer displacement to about 8 pixels. Image pairs are processed via a multi-pass cross-correlation algorithm, with a final interrogation window of 32 32 pixels and 50% overlap. Flow statistics are obtained ensemble-averaging over 2000 uncorrelated realizations as well as in the homogeneous streamwise direction. The fully developed nature of the flow at the measurement station is confirmed by comparing profiles across the imaging window, with no appreciable changes for statistics up to second order.
In the particle-laden cases, the inertial particle position and velocity are characterized by Particle Tracking Velocimetry (PTV) using an in-house code developed based on the cross-correlation methods described in Hassan et al. (1992) and Ohmi & Li (2000). Further details on the algorithm can be found in Petersen et al. (2019). For the measurements along the wall-normal plane, the CCD camera mounts a 105-mm Micro-Nikkor lens at f/16, providing an imaging magnification of 36.1 px/mm for a 34.3 25.9 mm2 field of view encompassing the full channel height. The particle-per-pixel density is for the LoVF cases and for the HiVF cases. Along the wall-parallel planes, an aperture of f/4 is used, providing an imaging magnification of 19.0 px/mm for a 55 70 mm2 window at the spanwise center of the channel. The particle-per-pixel density is for the centerplane and for the near-wall plane.The particle images are about 3 pixels, whose centroid is retrieved with an accuracy of approximately 0.1 pixels, as confirmed by tests on synthetic images. The pulse delay ranges between 70 and 100 depending on the cases and imaging locations, with typical particle displacements of 15 to 20 pixels. A pre-processing thresholding routine is applied to eliminate out-of-focus particles. The in-focus particles are tracked between image pairs using the relaxation method described by Baek & Lee (1996). The local concentration is measured along the wall-normal plane by counting the number of particle centroids detected. This approach was used for inertial particles in air (Yang & Shy 2005; Sahu et al. 2014; Sahu et al. 2016) and in water (Kiger & Pan, 2002). Knowles & Kiger (2012) showed that, in water, laser-based measurements of particle concentration can be misestimated by as much as 30%; however, they considered volume fractions one order of magnitude higher than the present case. Even at the higher loading investigated here, the average interparticle distance is 1 mm, which is much larger than the particle image. Due to clustering, the instantaneous local concentration can be higher, and some particles may go undetected. However, intense clustering usually pertains to a limited fraction of the particle set (Baker et al., 2017); here the regions where such bias may be more significant are near the wall, due to turbophoresis. Still, the volume fraction evaluated from the particle count along the wall-normal plane (assuming a 1.1 mm thick imaging volume) agrees within 12 - 15% with the value obtained by weighing the particles accumulated in the settling chamber during a given run time, lending confidence to the approach. Concentration and velocity statistics are based on ensemble-averaging over 2000 uncorrelated realizations (collected over four runs of 500 realizations each) as well as over the streamwise direction. The streamwise homogeneity of the particle statistics is discussed in §3.1.3. All statistics are verified to be steady-state during each run, with excellent repeatability in each run (within variations of the order of the statistical uncertainty). It is noted that simultaneous fluid-phase measurements are not acquired in this experiment. This is due to the relatively high image concentration of the inertial particles, especially near the wall, reducing the signal from fluid tracers. The feasibility of obtaining simultaneous fluid measurements are discussed in §4.
3 Results
Throughout this section, and denote streamwise and wall-normal components of the mean velocity. and are the corresponding fluctuating components, whose rms are denoted as and , respectively. Error bars in the plots represent statistical uncertainties based on 95% confidence levels and using the random uncertainty of the dataset (Bendat & Piersol, 2011). When the wall-normal profiles are shown over half of the channel height, the symmetry of the results along the center-line is within the statistical uncertainty.
3.1 Wall-normal measurements
3.1.1 Unladen air flow
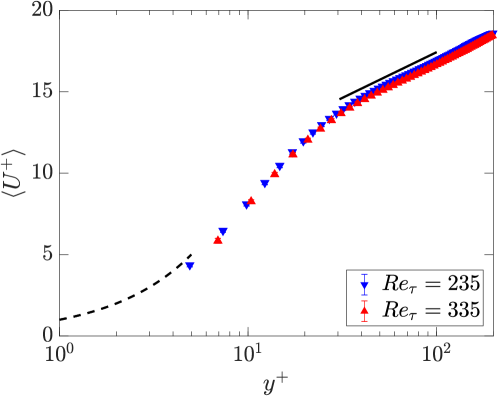
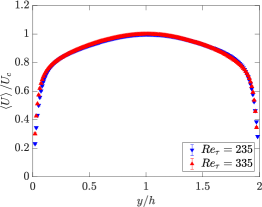
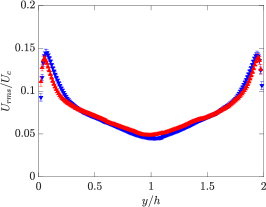
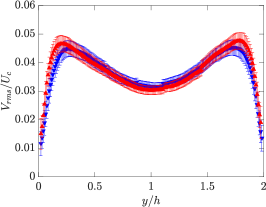
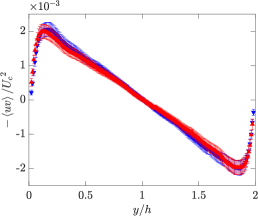
As a baseline, we first present the wall-normal profiles for the unladen fluid velocity. These are plotted in inner units in figure 3, showing the expected logarithmic behavior above . This is used to determine the friction velocity using a Clauser chart method (Clauser 1956; Wei et al. 2005). The profiles for the mean velocity, streamwise and wall-normal rms fluctuation and Reynolds shear stress are plotted in figure 4 in outer units, i.e. normalized by the channel half-height and the centerline velocity. The agreement with DNS of spanwise-periodic channels at comparable Reynolds numbers (e.g. Moser et al. 1999) suggests that the flow in the central part of the channel is not significantly impacted by the finite width of the cross-section.
3.1.2 Particle concentration
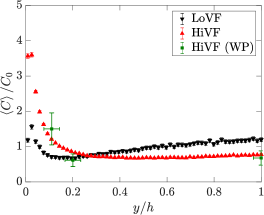
Figure 5 displays the mean profiles of normalized particle concentration for the four particle-laden cases. Here and in the following wall-normal profile plots, data points in the profiles are plotted at the location at the center of the respective wall-normal bin, each bin having a width of 0.25mm (about 9 pixels). Data points measured for the HiVF cases along wall-parallel planes are also shown and found to agree closely to the wall-normal imaging results. Both LoVF and HiVF cases display a peak of concentration in the near-wall region, confirming that turbophoresis is active in the present regime. However, in the more dilute cases the peak is mild, and away from the wall the concentration gradually increases towards another local maximum at the centerline. On the other hand, the higher-loading cases display a much stronger peak of concentration near the wall, and the profile is essentially flat in the core region. The peaks appear to be at a finite standoff distance from the wall, which is however hard to quantify precisely.
As mentioned in the Introduction, previous measurements of near-wall segregation in similar regimes are lacking, and a comparison with past numerical simulations is in order. We refer to point-particle DNS studies, which are free from issues associated to turbulence modeling. Among those, several one-way-coupled simulations yielded near-wall concentration peaks two or more orders of magnitude above the channel mean, and mostly contained within the viscous sub-layer (Marchioli & Soldati 2002; Marchioli et al. 2008; Sardina et al. 2012a; Bernardini 2014). Those results, while insightful, are influenced by the fact that point-particles can amass to arbitrary densities. In two-way-coupled simulations, the momentum back-reaction from the particles reduced the near-wall segregation, as did the inter-particle collisions, see Li et al. (2001), Vreman (2007); Nasr et al. (2009). These authors did show concentrations reaching a minimum adjacent to the near-wall peak and increasing up to a centerline maximum, similarly to our LoVF profiles. However, they found that such reduction of the near-wall peak (and the simultaneous appearance of a centerline maximum) occurred for increasing mass loading, in contrast with the present results. On the other hand, the concentration profiles we observe for LoVF are consistent with the argument of Young & Leeming (1997) that turbophoresis is driven by the gradient of fluid (figure 4c). The concentration is maximized in correspondence to the concentration minimum, decays steeply towards the wall and more mildly towards the centerline, following approximately the same trend as the wall-normal gradient of . We remark that the centerline concentration maximum was observed in several, but not all, one-way-coupled simulations, and was found to depend on the flow orientation: for example, Nilsen et al. (2013) found it for downward and no-gravity flow, but not for upward flow.
3.1.3 Particle velocity
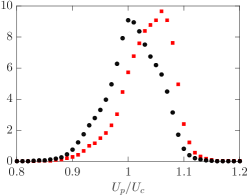
Figure 6 displays mean velocity profiles compared to the unladen air velocity. The data is presented both in outer (a, b) and inner (c, d) units, normalizing by the unladen velocity scales. In the viscous and buffer layer, the particles travel faster than the unladen air. This is a consequence of fast-moving particles retaining part of their momentum when transported towards the wall by turbulent fluctuations, without being constrained by the no-slip boundary condition. Such behavior was already highlighted by Kulick et al. (1994) and in several later experimental and numerical studies (e.g., Taniere et al. 1997; Rouson & Eaton 2001; Vreman 2007; Li et al. 2012). Righetti & Romano (2004) explicitly commented on an effective slip boundary condition for the particle field. Further away from the wall, in the LoVF cases the particles travel at approximately the same speed as the unladen air, while in the HiVF cases they lag in the logarithmic and buffer layers, recovering to the unladen air velocity in the channel core. A decrease of mean velocity with increasing mass loading was also reported by Kulick et al. (1994), although for higher . In that case the lag was visible up to the centerline, but this was likely due to the wall roughness (Benson et al., 2005). In general, we observe less flat velocity profiles than in previous experiments, see e.g. Kulick et al. (1994); Paris (2001); Caraman et al. (2003); Benson et al. (2005). Vreman (2015) argued that those were again influenced by some wall roughness that enhanced the wall-normal particle velocity fluctuations and in turn flattened the mean velocity profiles.
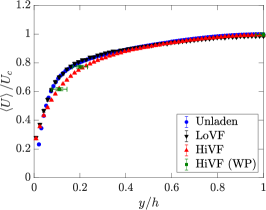
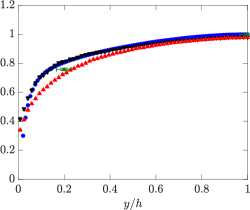
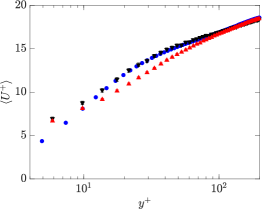
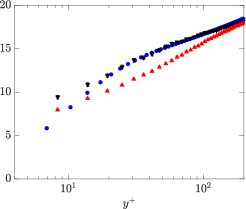
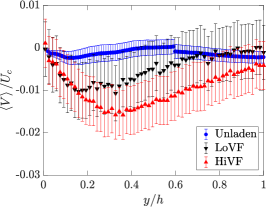
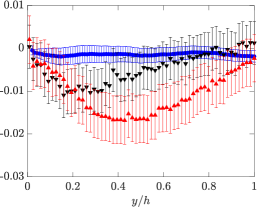
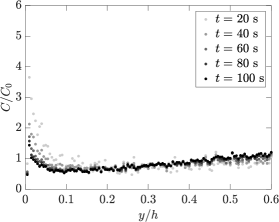
Figure 7 displays profiles of mean wall-normal particle velocity. In a fully developed state, this should be identically zero. This is the case (within error bounds) for the unladen fluid, while the particles do show some residual drift towards the wall. This is likely caused by turbophoresis; the effect is exemplified in the LoVF case where the peak at 0.2 approximately corresponds to the maximum of unladen fluid and to the minimum of particle concentration, consistent with the theory of Young & Leeming (1997) (see also Capecelatro et al. 2016). Numerical simulations at similar indicated that the turbophoretic drift continues to modify the particle field during () viscous time scales, which over the considered range of corresponds to () channel heights (Marchioli et al. 2008; Sardina et al. 2012a; Bernardini 2014). While these estimates are influenced by the one-way coupled nature of the modeling, they clearly indicate that the particle field requires a much greater development length than the sole hydrodynamics. However, we also remark that the observed wall-normal mean velocities are about 1% of the streamwise velocity, and smaller than the rms fluctuation in the same direction (reported below). Moreover, all statistics show no visible trend over the imaging windows (about 1.7 and 3.7 in streamwise direction for the wall-normal and wall-parallel measurements, respectively). Thus, also considering that the particles are expected to have reached terminal velocity much before entering the imaging section, the influence of the partial streamwise development is unlikely to qualitatively impact the reported trends.
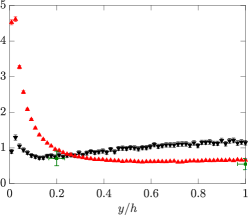
The rms streamwise fluctuations of the particle velocity is plotted in figure 8. The LoVF cases display profiles similar to the unladen flow in the channel core, and significantly more intense fluctuations (up to 20% higher than the fluid) in the near-wall region, with little differences between LoSt and HiSt. Previous studies have found particles with velocity fluctuations stronger than the carrier fluid in several configurations, including particle-laden jets and homogeneous turbulence (e.g., Hardalupas et al. 1989; Petersen et al. 2019). Specifically in channel flows, the observed trend agrees with one-way coupled simulations as reported by Marchioli et al. (2008) and Nasr et al. (2009) for lower but still turbophoretic Stokes numbers. Following Taniere et al. (1997), the increase in rms velocities may be interpreted as a consequence of the spread in momentum of particles with different history: the ones arriving to a near-wall interrogation window from more distant locations retain some of their relatively high speed due to inertia; while those coming from a rebound on the wall have lost some of their kinetic energy in the collision. Remarkably, the HiVF cases show a significant increase of particle velocity fluctuations even at 0.4, which is even more dramatic for HiSt. The near-wall peak is about the same as in LoVF, but the cross-section-average rms fluctuation is substantially augmented for the higher loading. This is in contrast with past two-way and four-way coupled point-particle DNS: considering mass loadings higher than but comparable to the current HiVF cases, Li et al. (2001), Vreman (2007), and Nasr et al. (2009) found a decrease in streamwise rms fluctuations (although the trend with increasing reported by Vreman was locally not monotonic at high loadings).
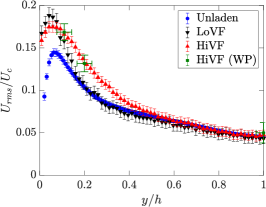
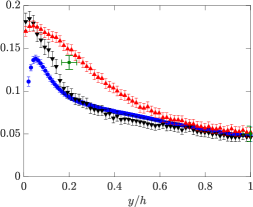
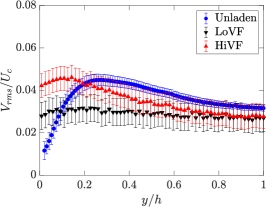
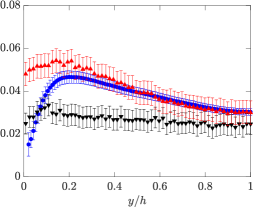
Figure 9 shows profiles of the wall-normal rms fluctuations of the particle velocities. For LoVF, the particle is lower than the unladen fluid in the channel core, but it remains fairly flat across the channel and largely exceeds the unladen fluid levels for . The effect of in the considered range is minor. Moreover, while the fluctuation level decreases approaching the wall, it does not appear to vanish. This is in contrast with one-way coupled simulations where the particle is consistently lower than the fluid (thus vanishing at the wall, Marchioli et al. 2008), but is consistent with previous experiments with particles of similar (Li et al., 2012). The approximately even redistribution of the lateral kinetic energy across the channel cross-section may partly be due to particle inertia, and partly to collisions with the wall (inter-particle collision being relatively unlikely at the lower volume fraction). At HiVF, increases more significantly approaching the wall, and the tendency is stronger for HiSt. This behavior is similar as for , and indicates again that the particle-fluid dynamics has been altered: by the modification of the underlying turbulent flow and/or by the increase in particle-particle/wall-particle collisions.
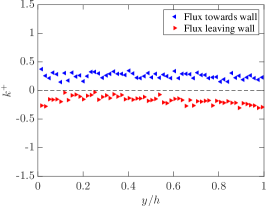
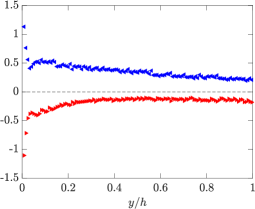
The wall-normal velocity is tightly related to the particle flux towards the wall, which eventually may lead to particle deposition. The flux can be expressed as the rate of particles per unit area crossing a control plane, , where is the number of particles on either side of the plane, indicates time and is the surface area of the control plane. Normalizing by the global concentration yields a characteristic velocity ; taking the control plane at the wall gives the commonly used deposition velocity , which in turn can be made non-dimensional with a velocity scale usually taken as the friction velocity, (Liu & Agarwal 1974; Young & Leeming 1997; Bernardini 2014). Here the spanwise direction is assumed homogeneous and the above definitions are adapted to the two-dimensional measurements: the concentration is areal rather than volumic, and wall-parallel lines act as the control planes. Figure 10 shows the non-dimensional characteristic velocity as a function of wall distance for the LoSt case (which shows similar trends to the HiSt case). We plot separately the fluxes towards and away from the wall. Because there is no net particle deposition, at the wall both fluxes are in balance (within experimental scatter). Wall collision cannot be directly detected with the present setup, but the absolute value of at the measurement location closest to the wall (i.e., control plane at for the LoSt case) is taken as a proxy of . For the LoVF case, one retrieves (0.1), in agreement with previous observations (see, e.g., the collection of data in Young & Leeming 1997). On the other hand, the HiVF case shows a sharp increase of flux in the inner layer and a much higher deposition velocity (1). This is consistent with the high levels reported above, and indicates that the change in particle transport properties at high loading greatly impact wall collision and (for a non-reflective wall) deposition.
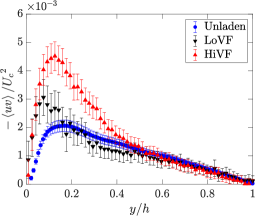
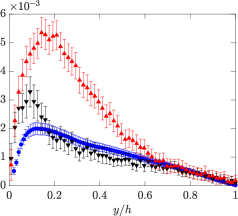
In figure 11 we present profiles of the cross-correlation between the particle streamwise and wall-normal fluctuations, referred to as particle Reynolds shear stress, along with the unladen fluid counterpart. For LoVF, these are found to follow the trend of the unladen fluid in the channel core up to about 0.2, but visibly exceed those values in the near wall region. A similar behavior was reported in the vertical pipe flow of Caraman et al. (2003), whereas in horizontal flow studies such as Li et al. (2012) particle Reynolds stresses were above/below the fluid levels in the core/near-wall region. These discrepancies stress once more the consequential differences between configurations, in particular as it pertains the gravity force direction. The HiVF cases show again an earlier departure from the unladen fluid statistics and a more dramatic increase in correlation magnitude.
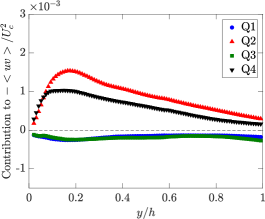
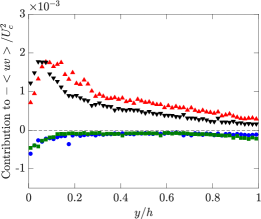
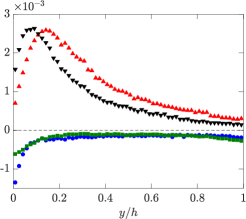
To explore this dynamic further, we perform a quadrant analysis in the () plane. Following classic notation utilized in wall turbulence studies, we label events belonging to the four quadrants as Q1 (), Q2 (), Q3 (), and Q4 (). We report on the LoSt cases, which behave similarly to the HiSt. Figure 12a shows, for reference, the contributions to the Reynolds stresses for the unladen fluid velocity at the same Reynolds number. This highlights the predominance of the Q2 and Q4 events which contribute to positive turbulence production, with Q4 prevailing on Q2 for (or ), and vice versa further from the wall (Kim et al., 1987). The particles (figure 12b,c) follow a similar trend, but with noteworthy differences. The prevalence of Q4 events in the near-wall region is much more pronounced, which is consistent with sweeps being crucial in the process of trapping the particles near the wall (Marchioli & Soldati, 2002). This is in stark contrast with the result of Li et al. (2012): they found overwhelmingly higher probability of Q2 events near the floor of their horizontal channel, where gravity caused much more frequent wall rebounds. At HiVF, both Q2 and Q4 contributions are similarly enhanced, but the cross-over point is farther from the wall compared to LoVF: the region where particles are swept towards the wall is wider, which corresponds to a more intense turbophoretic drift, a stronger near-wall peak of concentration, and a depletion of the centerline peak (see figure 5). For this case also Q3 is remarkably large near the wall, probably a consequence of particles colliding with each other and with the wall (Righetti & Romano, 2004).
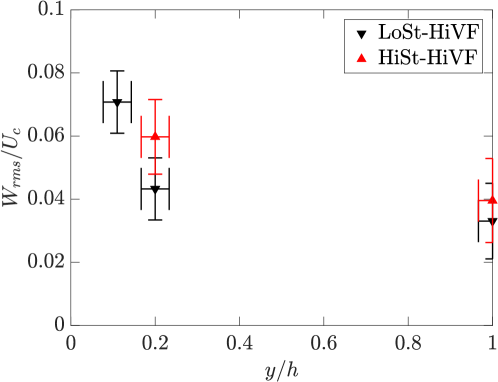
For completeness, we present in figure 13 the rms of the particle spanwise velocity fluctuations from the wall-parallel measurements. At = 0.2 and 1, the values are consistent with the fluid in the DNS of Moser et al. (1999) for 180 and 395 at the same wall-normal locations, which are expected to be close to the unladen fluid values in the present case. The sharp increase at for the LoSt-HiVF case indicates again an augmented fluctuation of the particle velocity near the wall with higher loading, at odds with previous two-way coupled simulations (Li et al. 2001; Nasr et al. 2009).
We conclude this section considering the skewness of the streamwise velocity fluctuations for the inertial particles, in comparison with the unladen fluid. Figure 14 shows data for the LoSt cases (HiSt cases displaying the same trend). To improve convergence, the particle profiles are binned in four regions, each displaying fairly homogeneous behavior and roughly corresponding to the inner layer (), buffer layer (), log layer (), and outer layer (). The unladen fluid streamwise fluctuations have positive skewness in the inner layer and part of the buffer layer, and negative elsewhere as expected (see e.g. Kim et al. 1987). On the other hand, the inertial particles show positive skewness across the channel height, irrespective of volume fraction. Considering the flow is in the direction of gravity, this may be due to a tendency of the particles in the channel core to favor the downward side of turbulent eddies, as it is known to happen in homogeneous turbulence (Wang & Maxey, 1993). We will return to this point in §3.2.2.
3.2 Wall-parallel measurements
We leverage the wall-parallel plane imaging to investigate the instantaneous spatial organization of the particles and their velocity distribution. Streamwise/spanwise planes are especially suitable for this analysis, as they extend along homogeneous directions and thus allow for the efficient calculation of statistics that are unbiased by spatial gradients. We employ two-point quantities such as radial distribution functions and two-point Eulerian velocity correlations of streamwise velocity fluctuations, as well as tessellation techniques such as Voronoi diagrams and box-counting. We do not report here on the spanwise velocity fluctuation correlations in the wall-parallel planes, as the spanwise displacements are not sufficiently larger than the uncertainty to yield accurate second-order statistics. These tools are used to investigate the wall-parallel plane at the centerline (center-plane) and the near-wall plane at 0.11. The analysis is carried out only for the HiVF cases, for which the number of particles is sufficient to provide sufficient spatial resolution and statistical accuracy. While this does not allow direct assessment of the volume fraction effect on such quantities, it does bring useful insight on the particle spatial distribution in the regime for which the inter-phase coupling is expected to be more complex.
3.2.1 Two-point statistics
We use radial distribution functions (RDFs) to describe the scale-by-scale concentration in the area surrounding a generic particle, compared to a uniform distribution (Sundaram & Collins, 1997). For 2D distributions such as those obtained by planar imaging, this can be written as (see, e.g., Wood et al. 2005):
| (1) |
where represents the number of particles within an annulus of radius and area , is the total number of particles within the planar domain of area . In presence of clustering, the RDF is expected to increase above 1 for decreasing , and the range over which it remains significantly greater than unity approximately indicates the length scale over which clustering occurs. We compute RDFs by binning particle pairs in equally spaced annuli of radial width 0.5 mm (). An edge-correction strategy is needed for particles near the image boundaries. Omitting annuli that cross the image boundary limits the maximum separation to the radius of the domain-inscribed circle, reducing the number of usable particle pairs with increasing separations and thus affecting the large-scale characterization. We instead mirror the particle field across the image boundaries, so that the same number of annuli is used for each particle location. The maximum separation then equals the full image size, introducing only small biases near the boundaries (Salazar et al. 2008; de Jong et al. 2010; Petersen et al. 2019). To avoid projection biases at separations below the illuminated volume thickness (Holtzer & Collins, 2002), we only present for 1.1 mm.
This “global” (i.e., omnidirectional) definition of RDF does not discriminate between different directions of the separation . We also calculate “directional” RDFs, in which the separations are oriented either streamwise or spanwise. This allows us to characterize the streamwise and spanwise extent of the highly concentrated particle structures. Additionally, we calculate the angular distribution function (ADF, see Gualtieri et al. 2009, Nicolai et al. 2013) which is obtained by binning the planar domain in polar coordinates ():
| (2) |
Here and correspond to spanwise and streamwise directions, respectively. We use equally spaced annuli of radial width 0.03 and divide each of them in 24 azimuthal sectors of area (in which we count particles). Streamwise and spanwise homogeneity are leveraged to limit the analysis to one quarter of the circle.
We first consider the wall-parallel plane at the center-plane. Figure 15 shows RDFs (global and directional) for LoSt and HiSt cases. The global RDFs indicate that clustering extends over similar length scales for both cases, but it is significantly more pronounced for LoSt. This is not unexpected since the latter is closer to the condition , which was shown to produce more intense clustering in homogeneous turbulence (Wang & Maxey 1993; Wood et al. 2005) and at the center-plane of channel flows (Fessler et al., 1994). The directional RDFs also indicate that the clusters are more elongated in streamwise than in spanwise direction. The spanwise RDF remains somewhat above unity throughout the field, indicating that some structure in the particle distribution persists over large scales in that direction. This general picture is confirmed by the ADFs in figure 16, which also show how the particle field becomes more quickly decorrelated for separations in direction .
We next consider the two-point Eulerian velocity correlations, which provide information on the level of spatial coherence of the particle motion. We follow Fevrier et al. (2005), who in turn borrowed the formalism proposed by Sundaram & Collins (1999), and write the general expression for the correlation between the streamwise velocity fluctuations of particles and , normalized by their velocity variance:
| (3) |
Here is the location within the measurement plane, is the position of the generic th particle, is the separation vector connecting the particle pair (), and angle brackets represent ensemble-averaging over all particle pairs. Boldface denotes vectorial quantities. The calculation is implemented with the same processing routine used for the RDFs and ADFs (which contains the information on the particle pair mutual positions). Again, we calculate both “directional” correlations, in which the separation vector is either streamwise or spanwise, and polar correlations, which span the () space.
Figure 17 displays the directional velocity correlations evaluated at the center-plane. For both LoSt and HiSt cases, the normalized values do not approach unity for vanishingly small separations. (This is also confirmed by data points for separations smaller than the laser sheet thickness, not shown because inherently less accurate.) This indicates that a significant portion of the particle velocity is not spatially correlated. This is in line with the mesoscopic Eulerian formalism introduced by Fevrier et al. (2005), according to which inertial particle motion consists of two components: a contribution from the underlying turbulent velocity field, spatially correlated; and a quasi-Brownian velocity distribution, random and as such spatially uncorrelated. The latter is rooted in the particle inertia, in particular the memory of interactions with distant eddies. This results in different velocities of arbitrarily close particles, possibly enhancing collision rates, and is consistent with the concepts of caustics and sling effect (Wilkinson & Mehlig 2005; Bewley et al. 2013; Reeks 2014). The gap between unity and for vanishing separations is a measure of the fraction of random uncorrelated motion (Fevrier et al. 2005; Vance et al. 2006). This framework has been employed in numerous theoretical and numerical studies to analyze and model different particle-laden flows, from turbulent channels (Vance et al., 2006) to homogenous turbulence (Meneguz & Reeks, 2011) and planar jets (Masi et al., 2014). However, experimental observations of Eulerian particle velocity correlations have been rarely reported, Khalitov & Longmire (2003) and Sahu et al. (2014) being notable exceptions. Figure 17 indicates that HiSt particles display a larger uncorrelated component of the motion than LoSt, consistently with the mesoscopic Eulerian formalism.
From figure 17 one also observes that more inertial particles show a slower decay of velocity correlation with increasing separation, according to the picture of high- particles responding to larger turbulent scales. Moreover, the streamwise fluctuations are significantly more correlated in streamwise than spanwise directions. This is consistent with the idea that the correlated particle motion is dictated by the turbulent flow. Indeed, if one defines integral scales of the fluctuating particle velocity based on the separation at which the correlation drops by 50%, the transverse scale appears to be roughly half the longitudinal one, similar to the expected behavior of the underlying turbulence. The polar diagrams of in figure 18 confirm this picture, and further suggest that the particle motion is organized in large streamwise-elongated structures, whose half-width is about 0.5. This is consistent with the spatial particle distributions as deduced from the RDFs.
After considering two-point statistics at the center-plane, we move our attention to the near-wall plane. We focus on the LoSt case, for which more significant preferential concentration is expected. Figure 19 displays global and directional RDFs and ADFs, which indicate how the particles are arranged in elongated streaks, multiple channel heights in length. Indeed, due to the highly anisotropic spatial distribution of the particles in this region, the global RDFs provide limited insight compared to the directional representations. The amplitude of the peak is significantly smaller than at the center-plane, indicating generally weaker clustering. This is consistent with the fact that particles have much larger response times than the near-wall turbulent scales. As mentioned in the Introduction, several authors used point-particle simulations to investigate the near-wall structure of the particle distributions in regimes for which turbophoresis and preferential concentration are intense (McLaughlin 1989; Zhang & Ahmadi 2000; Rouson & Eaton 2001; Marchioli & Soldati 2002; Soldati & Marchioli 2009; Sardina et al. 2012a; Bernardini 2014). They found thin streaks separated by (100) wall units, which roughly correspond to fluid-phase low-speed streaks in wall-bounded flows (Robinson, 1991), and are even longer than the fluid streaks. Experimental observations of particle streaks have been sporadic, and mostly limited to snapshot realizations (Kaftori et al. 1995a; Nino & Garcia 1996). The present measurements provide quantitative information on such structures: the spanwise RDF shows a minimum at separations of or 70 wall units (which can be interpreted as a measure of the streaks width) and recovery to a local maximum at or 175 wall units (a measure of the streak spacing). These values are somewhat larger than what reported by numerical studies at similar regimes. Moreover, the RDF amplitude we observe at small separations is much smaller than in computations, as will be confirmed by instantaneous particle distributions shown later. Beside the above-mentioned limitations of the point-particle modeling approach, the differences can be partly attributed to the location and thickness of the observation region. Most numerical studies report on streaks along thin slices within the viscous sublayer, which are challenging to isolate in laboratory experiments. Here the imaged particles are contained in a slab of thickness 1.1 mm centered at , thus in the approximate range = 17 – 34. The projection through this thickness may significantly influence the apparent concentration in a region of large wall-normal gradients. Future quantitative comparisons with simulations should take into account such finite thickness of the illumination volume.
When compared to the center-plane, the two-point velocity correlations at = 0.11 show an even stronger uncorrelated component of the motion as shown in figure 20. The uncorrelated velocity component near the wall is expected to increase with increasing particle inertia (Fevrier et al., 2005), and indeed in the near-wall region the particle response time is much larger than the local time scale of the turbulence (i.e., ). Besides inertia, inter-particle and wall-particle collisions may also contribute to the random particle motion (Vance et al., 2006). In the HiVF regime considered, both near-wall concentration and deposition velocity are relatively high (§3.1), thus collisions may play a significant role in the observed partitioning between correlated and uncorrelated velocity. The negative lobe of velocity correlation along the spanwise direction indicates that the particles are arranged in a streaky fashion, alternating positive and negative streamwise velocity fluctuations. The longitudinal extent of those features cannot be precisely assessed from the present measurements, but the long tail of the correlation function in streamwise direction suggests they can extend beyond the field of view. The trends in figure 20 are quantitatively similar to the RDFs and ADFs in figure 19, implying that the fluctuations of particle velocity and concentration are simultaneous. We will elaborate on this point in the next subsection.
3.2.2 Domain tessellation
In order to further investigate the instantaneous distribution of the inertial particle positions and velocities, we apply domain tessellation methods along the wall-parallel planes. These have been widely used to study clustering of inertial particles in turbulence (Monchaux et al., 2012). These approaches should be considered complementary to RDFs, since the latter are strictly two-point quantities, while tessellations are sensitive to the multi-particle arrangement. The simplest method is perhaps box-counting, which consists of dividing the domain into boxes of equal size, counting the particles in each box, and comparing the PDF of the number of particles per box against the Poisson distribution expected for randomly distributed particles. This technique provides a simple scalar measure of the amount of clustering and has been fruitfully exploited in experimental studies (Fessler et al. 1994; Aliseda et al. 2002). In recent years, the Voronoi tessellation method (Monchaux et al., 2010) has gained broader favor: the domain (in our case the two-dimensional image) is divided into cells associated to individual particles, each cell containing the set of points closer to that particle than to any other. The inverse of the area of each cell equals the local instantaneous concentration, . The method has been used in several experimental and numerical studies of wall-bounded particle-laden flows (Garcia-Villalba et al. 2012; Nilsen et al. 2013; Nicolai et al. 2013; Rabencov et al. 2014). Compared to the box-counting method, it has the advantage of not requiring an extrinsic/arbitrary length scale (the box size).
Here we adopt the Voronoi tessellation to investigate the particle distribution along the center-plane. Figure 21a shows a sample instantaneous realization for the LoSt-HiVF case, with Voronoi cells drawn around each particle. In figure 21c the PDF of the cell areas (normalized by its ensemble average) is plotted. As typical of inertial particles clustered by turbulence, the distribution is much wider compared to a random Poisson process, which is well approximated by a distribution (Ferenc & Néda, 2007). The PDF of the Voronoi cells is found to closely follow a log-normal distribution (Monchaux et al. 2010; Petersen et al. 2019), which allows us to characterize the curve by its standard deviation . The latter is a metric of the amount of clustering: LoSt and HiSt cases are found to have 0.78 and 0.70, respectively, confirming that the former has stronger tendency to produce clusters.
The topology and behavior of clusters of highly concentrated particles are relevant to the interphase coupling, especially in view of significant collective backreaction of the dispersed phase on the carrier fluid. We therefore analyze individual clusters (colored in figure 21b), defined as connected groups of particles whose Voronoi cell areas are smaller than a threshold value (figure 21c): the latter is taken as the value below which the probability of finding small cell areas is higher than for randomly distributed particles (Monchaux et al., 2010). To avoid spurious edge effects, we apply the additional constraint that the area of the cells neighboring a cluster also be smaller than (Zamansky et al., 2016). The sum of the areas of all cells belonging to each cluster is taken as its “cluster area”, .
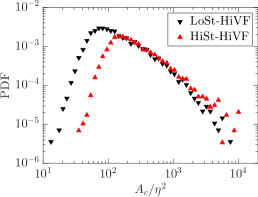
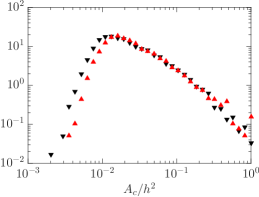
Figure 22 shows the probability distribution of cluster areas along the center-plane for LoSt and HiSt, the PDF in (a) normalized by the corresponding Kolmogorov length scale and (b) normalized by the square of the channel half-height, . Consistent with previous experimental studies, typical sizes are (10) (Aliseda et al., 2002), although such estimates may be affected by the number of particles in the system (Petersen et al., 2019). HiSt particles tend to cluster over larger sets, consistent with their limitation of only responding to the larger scales of turbulence. Above a certain size the probability distributions approach a power-law decay, which is a feature of fractality or geometric self-similarity, indicating a fractal-like formation process due to turbulence (Baker et al., 2017). This was clearer in the homogeneous turbulence studies of Sumbekova et al. (2017) and Petersen et al. (2019), probably due to a combination of limited number of particles in the field of view and limited dynamic spatial range at the present Reynolds numbers. Figure 22b shows that normalizing by the channel half-height produces a remarkable collapse of the LoSt and HiSt cases. This may suggest that, while particle clustering at the present is influenced by small-scale turbulence, the energetic scales of fluid motion also play a major role (as recently argued, e.g., by Petersen et al. 2019). Moreover, this may indicate that the cluster size is significantly influenced by the channel geometry. Indeed, an a priori estimate of the controlling effect of channel walls on clustering is often deduced from the ratio of the channel height to a characteristic cluster size, (Capecelatro et al. 2014). Here mm and , and the value of is close to the peak of PDF(). We remark, however, that the definition of is usually adopted in much denser regimes than the present one, being independent of the air flow characteristics. Further studies with different particle properties and turbulence conditions shall discriminate whether is an appropriate scale for highly dilute systems.
Following Baker et al. (2017), we define “coherent clusters” as those objects large enough to display a scale-invariant topology, i.e. in the range of that approximates the power-law decay. Smaller objects are considered as randomly occurring groups of particles, not necessarily brought together by the underlying turbulent flow. We conventionally set the cutoff at the respective maxima of for both LoSt and HiSt, noting that the choice of twice larger cutoffs does not qualitatively change the observed trends. Besides the physical interpretation discussed in Baker et al. (2017), this step allows us to discard clusters formed by only a few particles (too small for a meaningful topological description).
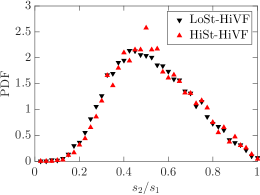
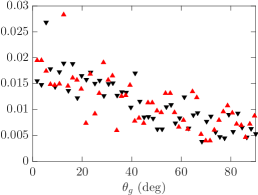
We use the singular value decomposition (SVD) method introduced by Baker et al. (2017) to probe the shape and spatial orientation of the coherent clusters. The SVD provides the principal axes and corresponding singular values for a particle set: the primary axis lies along the direction of greatest particle spread from the cluster centroid, the secondary axis being orthogonal to it. The corresponding singular values and measure the spread along the respective axes. In figure 23a the PDF of the aspect ratio is plotted for LoSt (differences with HiSt are marginal). The limit values 0 and 1 correspond to particles arranged in a straight line and in a perfect circle, respectively. The distribution is quantitatively similar to what reported by Petersen et al. (2019) for clusters settling in homogeneous turbulence. The peak ratio between 0.4 and 0.55 reflects a tendency to form somewhat elongated objects. Figure 23b illustrates the probability distribution of the primary axis orientation, measured by the angle of the latter with the vertical (). The peak at indicates a tendency of the (coherent) clusters to be aligned with gravity (and thus the direction of motion). This behavior was also reported in homogeneous turbulence studies (Baker et al. 2017; Petersen et al. 2019) and is consistent with the directional RDFs and ADFs presented above.
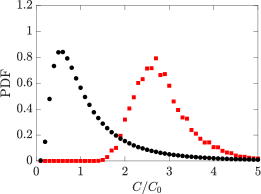
The local particle concentration within clusters can be significantly higher compared to the global value (Baker et al., 2017). Figure 24 shows PDFs of associated with the particles within coherent clusters, compared to the unconditional distribution: the peaks in the PDF for the clustered particles are about four times higher in HiSt and almost five times higher in LoSt. Besides reaffirming that the latter case displays more intense clustering, these plots indicate how the in-cluster concentration can be substantial, such that two-way-coupling (and possibly four-way-coupling) effects may be at play.
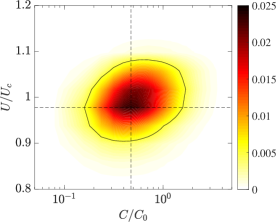
The traveling velocity of the clustered particles is also important to the transport process. Figure 25a depicts the same instantaneous realization as in figure 21, with the Voronoi cells now color-coded by the streamwise velocity of the respective particles. The more concentrated regions appear associated with higher velocities, as confirmed by the joint PDF for LoSt-HiVF (figure 25b): the local particle concentration and streamwise velocity are positively correlated. For a more quantitative account, shown in figure 26 are the PDF of the streamwise velocity for particles belonging to coherent clusters along the center-plane, as well as for all particles in the field of view. The clustered particles travel downward measurably faster than the generic particles. The explanations may be two-fold: on one hand, particles may be favoring the downwash side of turbulent eddies, according to the picture of preferential sweeping originally proposed by Maxey (1987) and later demonstrated by the simulations of Wang & Maxey (1993) and recently by the experiments of Petersen et al. (2019); on the other hand, the highly concentrated clusters may be exerting a collective drag force on the fluid, in turn enhancing their vertical velocity as shown in the numerical simulations of Bosse et al. (2006) and Frankel et al. (2016).

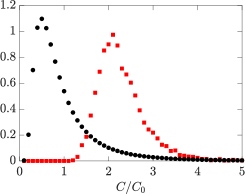
In principle, the Voronoi method may also be used to identify the highly concentrated structures near the wall. However, figure 27a shows how the PDF of the Voronoi cell areas measured along the near-wall plane is in fact narrower than for randomly distributed particles. This may be an artifact due to the relatively high concentration near the wall: particles very close to each other might be identified as one, reducing the probability of detecting small cell areas. Alternatively, the actual topology of the particle field, expected to be organized in streaks, could result in a “crystallized” pattern with a relatively regular arrangement of cells (and thus a narrow PDF of their area). Either way, the Voronoi tessellation method (in its standard form) does not appear as a suitable tool to study clustering in the present near-wall particle fields. We therefore resort to the box-counting approach: we tessellate the domain with square boxes of size 60 wall units or , and in figure 27b we plot the PDF of the concentration in each box , comparing it with the Poisson distribution expected for randomly located particles. The relatively broad distribution indicates that the particles are indeed clustered over scales of the order of the box size. The choice of the latter is informed by the width of the particle streaks as estimated from the RDF analysis in the previous subsection, although it is verified that varying it by a factor two yields similar conclusions. The box index (where and indicate mean and standard deviation of the distribution, respectively, and is the standard deviation of the Poisson distribution) is a comparative measure of clustering. Near the wall we find , while at the center-plane. The latter (consistent with the results of Fessler et al. 1994) confirms the indication from the RDF analysis that clustering in the channel core is significantly more intense.
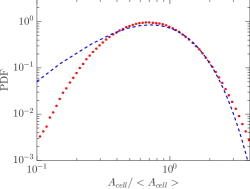
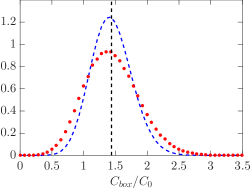
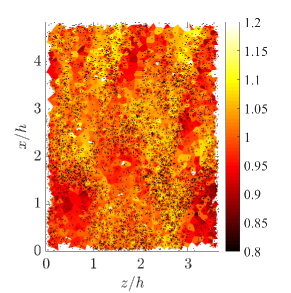
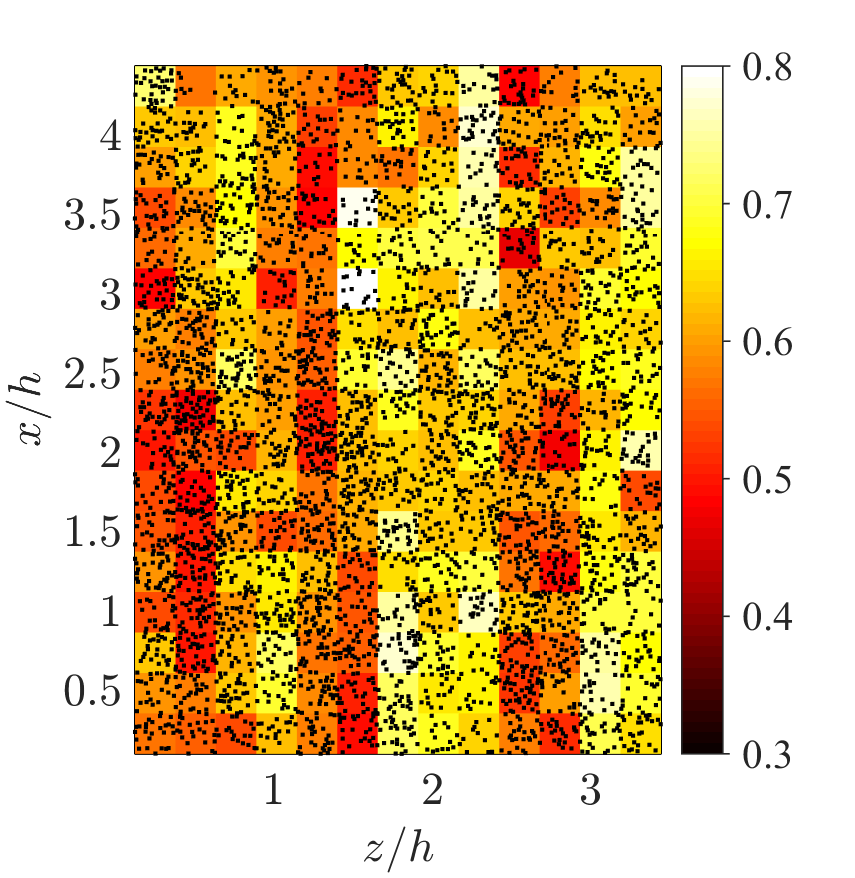
Figure 28a shows an instantaneous realization of the near-wall particle field, color-coded with the mean particle velocity in each square box of the tessellation. The visual impression of elongated slow-velocity streaks is in line with the RDF results. In figure 28b we plot a joint PDF of local particle concentration and streamwise velocity, based on values averaged in each box. The apparent negative correlation contrasts with the center-plane trend in figure 25b, indicating a tendency of the highly concentrated particles to travel slower than the average. Combined with the RDFs, ADFs and two-point correlations reported above, this confirms the picture of particles accumulating in slow-moving streaks.
4 Conclusions
We have reported on a series of experiments conducted on a vertical turbulent channel flow at and 335, in which particle-laden air flows downward. Several aspects of the configuration are chosen to provide a canonical case: smooth walls, streamwise development, relatively large aspect ratio of the cross-section, and small size-selected particles with = (10) and = (100). Care is taken to keep the experimental parameters under strict control, including the smoothness of the walls and the particle mass loading. The latter is varied across what is usually considered the boundary between one-way and two-way coupling. Using laser imaging we have investigated in detail the particle spatial distribution and velocity, gaining new insight expected to be useful to reach a predictive understanding of particle-laden wall bounded flows. Here we summarize and discuss the main findings.
At volume fractions (), the particles show a distinct, although relatively mild, tendency to segregate near the wall, with the concentration displaying a second maximum at the channel centerline. The results are consistent with turbophoresis acting down the gradients of turbulence intensity, and in particular of as proposed by Young & Leeming (1997). At volume fractions (), the near-wall peak is much more pronounced and the centerline maximum is absent, indicating more vigorous turbophoretic drift towards the wall. The increase of near-wall segregation with mass loading is opposite to what reported in previous two-way-coupled point-particle simulations.
The mean velocity profiles show particles traveling faster than the unladen fluid in the immediate vicinity of the wall, resulting in an effective slip velocity. Away from the wall, the more dilute case has particles following a profile similar to the unladen air velocity. In the denser case, the particles are measurably slower up to 0.4 (0.6) for the lower (higher) Stokes number. Both streamwise and wall-normal velocity fluctuations of the particles exceed those of the unladen fluid near the wall; in the denser case the effect is much more significant and extended to larger wall distances. The wall-normal fluctuations do not vanish close to the wall, and lead to estimates of the deposition velocity in line with the expectations in the dilute case, but several times larger in the dense case. The particle Reynolds shear stress follows a similar behavior as the normal stresses: it equals the unladen fluid stress in the channel core, but exceeds it when approaching the wall to a degree that depends on the loading. A quadrant analysis reveals that the prevalence of Q4 events (the equivalent of “sweeps” for the fluid motion) is enhanced in the near-wall region compared to the unladen fluid, suggesting that fluid sweeps are key in the particle segregation process. The effects above are similarly displayed by all cases investigated here, but are more evident for the higher St.
For the denser cases, the spatial distributions of the particle positions and velocities are analyzed over wall-parallel planes using both two-point statistics and tessellation techniques, providing further details on the particle organization and dynamics. In the channel core, the particles show a strong propensity to cluster, forming somewhat elongated objects preferentially aligned in the vertical streamwise direction. Clustering is more intense for the cases closer to the condition 1, although at higher the clusters tend to be larger (Petersen et al., 2019). Groups of particles above a certain size range (“coherent clusters”, Baker et al. 2017) reach concentrations several times higher than the global mean, and tend to travel/fall faster than the non-clustered particles. This suggests that, although the flow in the channel core is a poor approximation of homogeneous isotropic turbulence, the classic phenomena of preferential concentration (Squires & Eaton 1991; or other more recent mechanisms that explain clustering, see Goto & Vassilicos 2008; Bragg & Collins 2014) and preferential sweeping (Wang & Maxey, 1993) are at play. In the near-wall region the particles are observed to form elongated streaks, several channel height in length and spaced by (100) wall units (although the limited range of Reynolds numbers does not allow us to determine a conclusive scaling). Those streaks tend to move slower than the generic particles, supporting the view that they are coupled to fluid low-speed streaks typical of wall turbulence. The particle velocity contains a significant component of random uncorrelated motion. In agreement with the mesoscopic Eulerian formalism introduced by Fevrier et al. (2005), this Brownian-like motion is more prominent for higher and in the near-wall region, where the particle response time is much larger than the turbulent time scales. In general, we note that the differences between the particle behavior near and far from the wall, already remarkable in the present regimes, are expected to be magnified at higher .
Taken together, these results are consistent with a scenario in which the increase in volume fraction from () to () triggers two-way and (locally) four-way coupling effects. In particular, the particle backreaction may alter the turbulence structure in ways that enhance the turbophoretic drift towards the wall (e.g., by enhancing the peak of turbulence intensity and/or displacing it away from the wall). In turn, the higher near-wall concentration may promote inter-particle and wall-particle collisions. These would damp the particle kinetic energy, causing them to travel more slowly but enhancing their velocity fluctuations, as observed. Moreover, the inelastic collisions may prevent the particles from escaping the near-wall region (Hrenya & Sinclair, 1997). In the absence of simultaneous fluid measurements, this and other possible scenarios remain speculative. Future studies shall fill this gap, for example using phase separation techniques (Kiger & Pan 2000; Khalitov & Longmire 2002; Capone et al. 2015; Petersen et al. 2019) to accurately measure fluid statistics in the near-wall region. This, however is expected to be a challenging task: small inertial particles accumulating near the wall pose a major problem to imaging surrounding tracers. This can be partly alleviated by augmenting the spatial resolution, which is becoming possible thanks to the steady increase of the sensor size of available cameras (Discetti & Coletti, 2018).
Despite the relevance for practical applications and the understanding of particle-laden turbulence, previous experiments focused on the present regime have been scarce. The lack is unfortunate, especially given the need to validate point-particle models and the exorbitant cost of particle-resolved simulations. Contrasting our observations with previous numerical studies suggests that, while point-particle simulations capture many key features of the particle transport (e.g., Soldati & Marchioli 2009), the underlying hypotheses may be missing or misestimating some important aspects, especially concerning the two-way and four-way coupling. This is exemplified by the increased near-wall concentration measured for increasing mass loading, which is opposite to the trend found in past simulations. The limitations of point-particle methods in capturing the two-way coupling are well known (Eaton 2009; Balachandar & Eaton 2010) and have been assessed in detail by recent studies on homogeneous turbulence (Mehrabadi et al. 2018; Petersen et al. 2019). Wall-bounded turbulence may pose even harder problems due to the spatially varying resolution. However, as mentioned in the Introduction, recent approaches are showing promising improvements. For example, Capecelatro & Desjardins (2015) used a volume-filtering method to simulate the configuration of Benson et al. (2005) and found satisfactory agreement. That case contained heavier particles than the present one, with a Stokes number likely too high to produce strong near-wall segregation and clustering. It would be interesting to evaluate this and other modeling strategies against the present data, also considering that the dilute and dense cases we investigated should allow isolating one-way and two-way coupling issues. Importantly, given the significant role played by the dense regions in the momentum coupling, future comparisons with simulations should ideally include information on the spatial correlation of the particle field and the clustering properties. The moderate Reynolds number in our study may allow for a comparison with future particle-resolved simulations, which are becoming feasible even for relatively small particles (Schneiders et al., 2017).
Finally, we remark how the effect of inter-particle and wall-particle collisions could also contribute to experimental-numerical discrepancies. As mentioned in §2.1, the restitution coefficient may vary significantly depending on the collision velocity (Joseph et al. 2001; Gondret et al. 2002). Following Gondret et al. (2002), we can define a wall-collision Stokes number as (where we used the fact that is of the order of the particle close to the wall, the latter giving a scale for the wall-normal collision velocity). One finds = (100), which is in the range for which is a strong function of (Gondret et al., 2002). Given the possibly large variance of the collision velocity and the role of inelastic collisions to enhance near-wall accumulation (Hrenya & Sinclair, 1997), the common assumption of a constant restitution coefficient might be inadequate.
Acknowledgements.
Acknowledgements
This project is funded partly by the U.S. Army Research Office (Division of Fluid Dynamics, grants W911NF-17-1-0366 and W911NF-18-1-0354) and partly by the Environment and Natural Resources Trust Fund of Minnesota.
Appendix A. Electrostatic dissipative acrylic
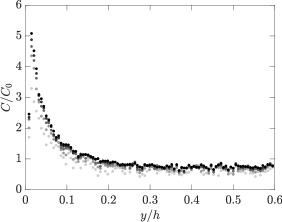
Electrostatic dissipative acrylic (SciCron Technologies) is used to build the optical test section, and the channel is provided with static discharge wires grounded to structural supports. This prevents the particles from accumulating upon impaction and building up unwanted roughness, an effect that has impacted past experiments (Benson et al., 2005). The importance of such precautions is illustrated in figure 29, where cumulative wall-normal profiles of particle concentrations are plotted in the higher volume fraction case. The details of how those measurements are obtained are given in §2.2. When using standard acrylic walls, the concentration profiles start with a strong near-wall peak but drift in time, with particles migrating away from the wall. This is likely the consequence of wall deposition which leads to significant roughness (as verified by inspecting the wall surface at the end of the experiments), in turn altering the collision dynamics and ultimately enhancing particle dispersion towards the channel core. Using electrostatic dissipative acrylic virtually eliminates particle deposition (as also verified by direct wall inspection) and warrants consistent concentration profiles during each run and between different runs.
Appendix B. Coefficient of restitution
The coefficient of restitution, for particle-wall collisions is measured by dropping individual glass beads from a height of 350 mm above a horizontal plate made of the same acrylic used for the test section. The particles reach steady-state terminal velocity before bouncing on the plate. This is achieved independently from the method of release due to the short free-fall stopping distance (of order mm). Particles are imaged at 2300 fps with a high-speed CMOS camera (VEO 640) paired with a 200 mm lens at f/4, and tracked using the same method used for the particle-laden flow measurements. The coefficient of restitution is defined as the ratio of the wall-normal particle velocity just after and just before the collision, and is calculated averaging over five trials as shown in figure 30.
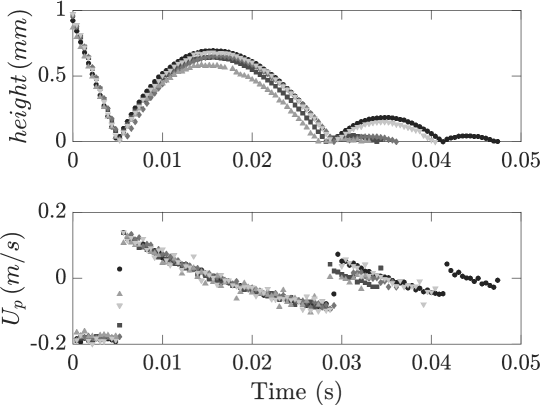
References
- Aliseda et al. (2002) Aliseda, Alberto, Cartellier, Alain, Hainaux, F & Lasheras, Juan C 2002 Effect of preferential concentration on the settling velocity of heavy particles in homogeneous isotropic turbulence. Journal of Fluid Mechanics 468, 77–105.
- Baek & Lee (1996) Baek, SJ & Lee, SJ 1996 A new two-frame particle tracking algorithm using match probability. Experiments in Fluids 22 (1), 23–32.
- Baker et al. (2017) Baker, Lucia, Frankel, Ari, Mani, Ali & Coletti, Filippo 2017 Coherent clusters of inertial particles in homogeneous turbulence. Journal of Fluid Mechanics 833, 364–398.
- Balachandar & Eaton (2010) Balachandar, S. & Eaton, J. K. 2010 Turbulent dispersed multiphase flow. Annu. Rev. Fluid Mech. 42, 111–133.
- Balachandar et al. (2019) Balachandar, S, Liu, Kai & Lakhote, Mandar 2019 Self-induced velocity correction for improved drag estimation in euler–lagrange point-particle simulations. Journal of Computational Physics 376, 160–185.
- Bendat & Piersol (2011) Bendat, Julius S & Piersol, Allan G 2011 Random data: analysis and measurement procedures, , vol. 729. John Wiley & Sons.
- Benson et al. (2005) Benson, Michael, Tanaka, Tomohiko & Eaton, John K 2005 Effects of wall roughness on particle velocities in a turbulent channel flow. Journal of fluids engineering 127 (2), 250–256.
- Bernardini (2014) Bernardini, Matteo 2014 Reynolds number scaling of inertial particle statistics in turbulent channel flows. Journal of Fluid Mechanics 758.
- Bewley et al. (2013) Bewley, Gregory P, Saw, Ewe-Wei & Bodenschatz, Eberhard 2013 Observation of the sling effect. New Journal of Physics 15 (8), 083051.
- Bosse et al. (2006) Bosse, Thorsten, Kleiser, Leonhard & Meiburg, Eckart 2006 Small particles in homogeneous turbulence: Settling velocity enhancement by two-way coupling. Physics of Fluids 18 (2), 027102.
- Bragg & Collins (2014) Bragg, Andrew D & Collins, Lance R 2014 New insights from comparing statistical theories for inertial particles in turbulence: I. spatial distribution of particles. New Journal of Physics 16 (5), 055013.
- Capecelatro & Desjardins (2013) Capecelatro, Jesse & Desjardins, Olivier 2013 An euler–lagrange strategy for simulating particle-laden flows. Journal of Computational Physics 238, 1–31.
- Capecelatro & Desjardins (2015) Capecelatro, Jesse & Desjardins, Olivier 2015 Mass loading effects on turbulence modulation by particle clustering in dilute and moderately dilute channel flows. Journal of Fluids Engineering 137 (11), 111102.
- Capecelatro et al. (2016) Capecelatro, Jesse, Desjardins, Olivier & Fox, Rodney O 2016 Strongly coupled fluid-particle flows in vertical channels. i. reynolds-averaged two-phase turbulence statistics. Physics of Fluids 28 (3), 033306.
- Capecelatro et al. (2018) Capecelatro, Jesse, Desjardins, Olivier & Fox, Rodney O 2018 On the transition between turbulence regimes in particle-laden channel flows. Journal of Fluid Mechanics 845, 499–519.
- Capecelatro et al. (2014) Capecelatro, Jesse, Pepiot, Perrine & Desjardins, Olivier 2014 Numerical characterization and modeling of particle clustering in wall-bounded vertical risers. Chemical Engineering Journal 245, 295–310.
- Capone et al. (2015) Capone, Alessandro, Romano, Giovanni Paolo & Soldati, Alfredo 2015 Experimental investigation on interactions among fluid and rod-like particles in a turbulent pipe jet by means of particle image velocimetry. Experiments in Fluids 56 (1), 1.
- Caporaloni et al. (1975) Caporaloni, M, Tampieri, F, Trombetti, F & Vittori, O 1975 Transfer of particles in nonisotropic air turbulence. Journal of the atmospheric sciences 32 (3), 565–568.
- Caraman et al. (2003) Caraman, N, Borée, J & Simonin, Olivier 2003 Effect of collisions on the dispersed phase fluctuation in a dilute tube flow: Experimental and theoretical analysis. Physics of Fluids 15 (12), 3602–3612.
- Clauser (1956) Clauser, Francis H 1956 The turbulent boundary layer. Advances in applied mechanics 4, 1–51.
- Clift et al. (2005) Clift, Roland, Grace, John R & Weber, Martin E 2005 Bubbles, drops, and particles. Courier Corporation.
- Discetti & Coletti (2018) Discetti, Stefano & Coletti, Filippo 2018 Volumetric velocimetry for fluid flows. Measurement Science and Technology 29 (4), 042001.
- Dritselis & Vlachos (2011) Dritselis, Chris D & Vlachos, Nicholas S 2011 Numerical investigation of momentum exchange between particles and coherent structures in low re turbulent channel flow. Physics of Fluids 23 (2), 025103.
- Eaton (2009) Eaton, John K 2009 Two-way coupled turbulence simulations of gas-particle flows using point-particle tracking. International Journal of Multiphase Flow 35 (9), 792–800.
- Eaton & Fessler (1994) Eaton, John K & Fessler, JR 1994 Preferential concentration of particles by turbulence. International Journal of Multiphase Flow 20, 169–209.
- Elghobashi (1994) Elghobashi, S. 1994 On predicting particle-laden turbulent flows. Appl. Sci. Res. 52 (4), 309–329.
- Ferenc & Néda (2007) Ferenc, Járai-Szabó & Néda, Zoltán 2007 On the size distribution of poisson voronoi cells. Physica A: Statistical Mechanics and its Applications 385 (2), 518–526.
- Fessler et al. (1994) Fessler, John R, Kulick, Jonathan D & Eaton, John K 1994 Preferential concentration of heavy particles in a turbulent channel flow. Physics of Fluids 6 (11), 3742–3749.
- Fevrier et al. (2005) Fevrier, Pierre, Simonin, Olivier & Squires, Kyle D 2005 Partitioning of particle velocities in gas–solid turbulent flows into a continuous field and a spatially uncorrelated random distribution: theoretical formalism and numerical study. Journal of Fluid Mechanics 533, 1–46.
- Fouxon et al. (2018) Fouxon, Itzhak, Schmidt, Lukas, Ditlevsen, Peter, van Reeuwijk, Maarten & Holzner, Markus 2018 Inhomogeneous growth of fluctuations of concentration of inertial particles in channel turbulence. Physical Review Fluids 3 (6), 064301.
- Frankel et al. (2016) Frankel, Ari, Pouransari, Hadi, Coletti, Filippo & Mani, Ali 2016 Settling of heated particles in homogeneous turbulence. Journal of Fluid Mechanics 792, 869–893.
- Garcia-Villalba et al. (2012) Garcia-Villalba, Manuel, Kidanemariam, Aman G & Uhlmann, Markus 2012 Dns of vertical plane channel flow with finite-size particles: Voronoi analysis, acceleration statistics and particle-conditioned averaging. International Journal of Multiphase Flow 46, 54–74.
- Gondret et al. (2002) Gondret, P, Lance, M & Petit, L 2002 Bouncing motion of spherical particles in fluids. Physics of fluids 14 (2), 643–652.
- Goto & Vassilicos (2008) Goto, Susumu & Vassilicos, JC 2008 Sweep-stick mechanism of heavy particle clustering in fluid turbulence. Physical review letters 100 (5), 054503.
- Gualtieri et al. (2009) Gualtieri, Picano, Picano, F & Casciola, CM 2009 Anisotropic clustering of inertial particles in homogeneous shear flow. Journal of Fluid Mechanics 629, 25–39.
- Gualtieri et al. (2015) Gualtieri, Paolo, Picano, F, Sardina, Gaetano & Casciola, Carlo Massimo 2015 Exact regularized point particle method for multiphase flows in the two-way coupling regime. Journal of Fluid Mechanics 773, 520–561.
- Guha (2008) Guha, Abhijit 2008 Transport and deposition of particles in turbulent and laminar flow. Annu. Rev. Fluid Mech. 40, 311–341.
- Gustavsson & Mehlig (2016) Gustavsson, K & Mehlig, B 2016 Statistical models for spatial patterns of heavy particles in turbulence. Advances in Physics 65 (1), 1–57.
- Hadinoto et al. (2005) Hadinoto, K, Jones, EN, Yurteri, C & Curtis, JS 2005 Reynolds number dependence of gas-phase turbulence in gas–particle flows. International journal of multiphase flow 31 (4), 416–434.
- Hardalupas et al. (1989) Hardalupas, Y, Taylor, AMKP & Whitelaw, James Hunter 1989 Velocity and particle-flux characteristics of turbulent particle-laden jets. Proc. R. Soc. Lond. A 426 (1870), 31–78.
- Hassan et al. (1992) Hassan, YA, Blanchat, TK, Seeley Jr, CH & Canaan, RE 1992 Simultaneous velocity measurements of both components of a two-phase flow using particle image velocimetry. International Journal of Multiphase Flow 18 (3), 371–395.
- Holtzer & Collins (2002) Holtzer, Gretchen L & Collins, Lance R 2002 Relationship between the intrinsic radial distribution function for an isotropic field of particles and lower-dimensional measurements. Journal of Fluid Mechanics 459, 93–102.
- Horwitz & Mani (2016) Horwitz, JAK & Mani, Ali 2016 Accurate calculation of stokes drag for point–particle tracking in two-way coupled flows. Journal of Computational Physics 318, 85–109.
- Hrenya & Sinclair (1997) Hrenya, Christine M & Sinclair, Jennifer L 1997 Effects of particle-phase turbulence in gas-solid flows. AIChE Journal 43 (4), 853–869.
- Ireland & Desjardins (2017) Ireland, Peter J & Desjardins, Olivier 2017 Improving particle drag predictions in euler–lagrange simulations with two-way coupling. Journal of Computational Physics 338, 405–430.
- de Jong et al. (2010) de Jong, J, Salazar, JPLC, Woodward, SH, Collins, LR & Meng, H 2010 Measurement of inertial particle clustering and relative velocity statistics in isotropic turbulence using holographic imaging. International Journal of Multiphase Flow 36 (4), 324–332.
- Joseph et al. (2001) Joseph, GG, Zenit, R, Hunt, ML & Rosenwinkel, AM 2001 Particle–wall collisions in a viscous fluid. Journal of Fluid Mechanics 433, 329–346.
- Kaftori et al. (1995a) Kaftori, D, Hetsroni, G & Banerjee, S 1995a Particle behavior in the turbulent boundary layer. i. motion, deposition, and entrainment. Physics of Fluids 7 (5), 1095–1106.
- Kaftori et al. (1995b) Kaftori, D, Hetsroni, G & Banerjee, S 1995b Particle behavior in the turbulent boundary layer. ii. velocity and distribution profiles. Physics of Fluids 7 (5), 1107–1121.
- Khalitov & Longmire (2002) Khalitov, DA & Longmire, EK 2002 Simultaneous two-phase piv by two-parameter phase discrimination. Experiments in fluids 32 (2), 252–268.
- Khalitov & Longmire (2003) Khalitov, Daniel A & Longmire, Ellen K 2003 Effect of particle size on velocity correlations in turbulent channel flow. In ASME/JSME 2003 4th Joint Fluids Summer Engineering Conference, pp. 445–453. American Society of Mechanical Engineers.
- Kiger & Pan (2000) Kiger, KT & Pan, C 2000 Piv technique for the simultaneous measurement of dilute two-phase flows. Journal of fluids engineering 122 (4), 811–818.
- Kiger & Pan (2002) Kiger, KT & Pan, C 2002 Suspension and turbulence modification effects of solid particulates on a horizontal turbulent channel flow. J. Turbulence 3 (19), 1–17.
- Kim et al. (1987) Kim, John, Moin, Parviz & Moser, Robert 1987 Turbulence statistics in fully developed channel flow at low reynolds number. Journal of fluid mechanics 177, 133–166.
- Kleinstreuer & Zhang (2010) Kleinstreuer, C & Zhang, Z 2010 Airflow and particle transport in the human respiratory system. Annual review of fluid mechanics 42, 301–334.
- Knowles & Kiger (2012) Knowles, Philip L & Kiger, Ken T 2012 Quantification of dispersed phase concentration using light sheet imaging methods. Experiments in fluids 52 (3), 697–708.
- Kuerten & Vreman (2015) Kuerten, Johannes GM & Vreman, AW 2015 Effect of droplet interaction on droplet-laden turbulent channel flow. Physics of fluids 27 (5), 053304.
- Kulick et al. (1994) Kulick, Jonathan D, Fessler, John R & Eaton, John K 1994 Particle response and turbulence modification in fully developed channel flow. Journal of Fluid Mechanics 277, 109–134.
- Kussin & Sommerfeld (2002) Kussin, J & Sommerfeld, M 2002 Experimental studies on particle behaviour and turbulence modification in horizontal channel flow with different wall roughness. Experiments in Fluids 33 (1), 143–159.
- Li et al. (2016) Li, Dong, Luo, Kun & Fan, Jianren 2016 Modulation of turbulence by dispersed solid particles in a spatially developing flat-plate boundary layer. Journal of Fluid Mechanics 802, 359–394.
- Li et al. (2012) Li, Jing, Wang, Hanfeng, Liu, Zhaohui, Chen, Sheng & Zheng, Chuguang 2012 An experimental study on turbulence modification in the near-wall boundary layer of a dilute gas-particle channel flow. Experiments in fluids 53 (5), 1385–1403.
- Li et al. (2001) Li, Yiming, McLaughlin, John B, Kontomaris, K & Portela, L 2001 Numerical simulation of particle-laden turbulent channel flow. Physics of Fluids 13 (10), 2957–2967.
- Lin et al. (2017) Lin, Zhao-wu, Shao, Xue-ming, Yu, Zhao-sheng & Wang, Lian-ping 2017 Effects of finite-size heavy particles on the turbulent flows in a square duct. Journal of Hydrodynamics 29 (2), 272–282.
- Liu & Agarwal (1974) Liu, Benjamin YH & Agarwal, Jugal K 1974 Experimental observation of aerosol deposition in turbulent flow. Journal of Aerosol Science 5 (2), 145–155.
- Marchioli & Soldati (2002) Marchioli, Cristian & Soldati, Alfredo 2002 Mechanisms for particle transfer and segregation in a turbulent boundary layer. Journal of fluid Mechanics 468, 283–315.
- Marchioli et al. (2008) Marchioli, Ch, Soldati, A, Kuerten, JGM, Arcen, B, Taniere, A, Goldensoph, G, Squires, KD, Cargnelutti, MF & Portela, LM 2008 Statistics of particle dispersion in direct numerical simulations of wall-bounded turbulence: results of an international collaborative benchmark test. International Journal of Multiphase Flow 34 (9), 879–893.
- Masi et al. (2014) Masi, Enrica, Simonin, Olivier, Riber, Eleonore, Sierra, P & Gicquel, Laurent YM 2014 Development of an algebraic-closure-based moment method for unsteady eulerian simulations of particle-laden turbulent flows in very dilute regime. International Journal of Multiphase Flow 58, 257–278.
- Maxey (1987) Maxey, MR 1987 The gravitational settling of aerosol particles in homogeneous turbulence and random flow fields. Journal of Fluid Mechanics 174, 441–465.
- McLaughlin (1989) McLaughlin, John B 1989 Aerosol particle deposition in numerically simulated channel flow. Physics of Fluids A: Fluid Dynamics 1 (7), 1211–1224.
- Mehrabadi et al. (2018) Mehrabadi, M, Horwitz, JAK, Subramaniam, S & Mani, A 2018 A direct comparison of particle-resolved and point-particle methods in decaying turbulence. Journal of Fluid Mechanics 850, 336–369.
- Meneguz & Reeks (2011) Meneguz, Elena & Reeks, Michael W 2011 Statistical properties of particle segregation in homogeneous isotropic turbulence. Journal of Fluid Mechanics 686, 338–351.
- Monchaux et al. (2010) Monchaux, Romain, Bourgoin, Mickaël & Cartellier, Alain 2010 Preferential concentration of heavy particles: a voronoï analysis. Physics of Fluids 22 (10), 103304.
- Monchaux et al. (2012) Monchaux, Romain, Bourgoin, Mickael & Cartellier, Alain 2012 Analyzing preferential concentration and clustering of inertial particles in turbulence. International Journal of Multiphase Flow 40, 1–18.
- Moser et al. (1999) Moser, Robert D, Kim, John & Mansour, Nagi N 1999 Direct numerical simulation of turbulent channel flow up to re = 590. Physics of fluids 11 (4), 943–945.
- Nasr et al. (2009) Nasr, Hojjat, Ahmadi, Goodarz & McLaughlin, John B 2009 A dns study of effects of particle–particle collisions and two-way coupling on particle deposition and phasic fluctuations. Journal of Fluid Mechanics 640, 507–536.
- Nicolai et al. (2013) Nicolai, Claudia, Jacob, B & Piva, Renzo 2013 On the spatial distribution of small heavy particles in homogeneous shear turbulence. Physics of Fluids 25 (8), 083301.
- Nilsen et al. (2013) Nilsen, Christopher, Andersson, Helge I & Zhao, Lihao 2013 A voronoï analysis of preferential concentration in a vertical channel flow. Physics of Fluids 25 (11), 115108.
- Nino & Garcia (1996) Nino, Y & Garcia, MH 1996 Experiments on particle—turbulence interactions in the near–wall region of an open channel flow: implications for sediment transport. Journal of Fluid Mechanics 326, 285–319.
- Ohmi & Li (2000) Ohmi, Kazuo & Li, Hang-Yu 2000 Particle-tracking velocimetry with new algorithms. Measurement Science and Technology 11 (6), 603.
- Oliveira et al. (2017) Oliveira, JL Goes, van der Geld, CWM & Kuerten, Johannes GM 2017 Concentration and velocity statistics of inertial particles in upward and downward pipe flow. Journal of fluid mechanics 822, 640–663.
- Pan & Banerjee (1996) Pan, Y. & Banerjee, S. 1996 Numerical simulation of particle interactions with wall turbulence. Phys. Fluids 8 (10), 2733–2755.
- Paris (2001) Paris, Anthony Dana 2001 Turbulence attenuation in a particle-laden channel flow .
- Petersen et al. (2019) Petersen, Alec J, Baker, Lucia & Coletti, Filippo 2019 Experimental study of inertial particles clustering and settling in homogeneous turbulence. Journal of Fluid Mechanics 864, 925–970.
- Picano et al. (2015) Picano, Francesco, Breugem, Wim-Paul & Brandt, Luca 2015 Turbulent channel flow of dense suspensions of neutrally buoyant spheres. Journal of Fluid Mechanics 764, 463–487.
- Pope (2000) Pope, S. B. 2000 Turbulent Flows. Cambridge, UK: Cambridge Univ. Press.
- Rabencov et al. (2014) Rabencov, B, Arca, J & van Hout, R 2014 Measurement of polystyrene beads suspended in a turbulent square channel flow: Spatial distributions of velocity and number density. International Journal of Multiphase Flow 62, 110–122.
- Reeks (1983) Reeks, MW 1983 The transport of discrete particles in inhomogeneous turbulence. Journal of aerosol science 14 (6), 729–739.
- Reeks (2014) Reeks, Michael W 2014 Transport, mixing and agglomeration of particles in turbulent flows. In Journal of Physics: Conference Series, , vol. 530, p. 012003. IOP Publishing.
- Richter & Sullivan (2013) Richter, David H & Sullivan, Peter P 2013 Momentum transfer in a turbulent, particle-laden couette flow. Physics of Fluids 25 (5), 053304.
- Richter & Sullivan (2014) Richter, David H & Sullivan, Peter P 2014 Modification of near-wall coherent structures by inertial particles. Physics of Fluids 26 (10), 103304.
- Righetti & Romano (2004) Righetti, M & Romano, Giovanni Paolo 2004 Particle–fluid interactions in a plane near-wall turbulent flow. Journal of Fluid Mechanics 505, 93–121.
- Robinson (1991) Robinson, Stephen K 1991 Coherent motions in the turbulent boundary layer. Annual Review of Fluid Mechanics 23 (1), 601–639.
- Rouson & Eaton (2001) Rouson, Damian WI & Eaton, John K 2001 On the preferential concentration of solid particles in turbulent channel flow. Journal of Fluid Mechanics 428, 149–169.
- Sahu et al. (2014) Sahu, S, Hardalupas, Y & Taylor, AMKP 2014 Droplet–turbulence interaction in a confined polydispersed spray: effect of droplet size and flow length scales on spatial droplet–gas velocity correlations. Journal of Fluid Mechanics 741, 98–138.
- Sahu et al. (2016) Sahu, S, Hardalupas, Y & Taylor, AMKP 2016 Droplet–turbulence interaction in a confined polydispersed spray: effect of turbulence on droplet dispersion. Journal of Fluid Mechanics 794, 267–309.
- Salazar et al. (2008) Salazar, Juan PLC, De Jong, Jeremy, Cao, Lujie, Woodward, Scott H, Meng, Hui & Collins, Lance R 2008 Experimental and numerical investigation of inertial particle clustering in isotropic turbulence. Journal of Fluid Mechanics 600, 245–256.
- Sardina et al. (2012a) Sardina, G, Schlatter, Philipp, Brandt, Luca, Picano, F & Casciola, Carlo Massimo 2012a Wall accumulation and spatial localization in particle-laden wall flows. Journal of Fluid Mechanics 699, 50–78.
- Sardina et al. (2012b) Sardina, Gaetano, Schlatter, Philipp, Picano, Francesco, Casciola, CM, Brandt, Luca & Henningson, Dan Stafan 2012b Self-similar transport of inertial particles in a turbulent boundary layer. Journal of Fluid Mechanics 706, 584–596.
- Schneiders et al. (2017) Schneiders, Lennart, Meinke, Matthias & Schröder, Wolfgang 2017 Direct particle–fluid simulation of kolmogorov-length-scale size particles in decaying isotropic turbulence. Journal of Fluid Mechanics 819, 188–227.
- Shokri et al. (2017) Shokri, R, Ghaemi, S, Nobes, DS & Sanders, RS 2017 Investigation of particle-laden turbulent pipe flow at high-reynolds-number using particle image/tracking velocimetry (piv/ptv). International Journal of Multiphase Flow 89, 136–149.
- Soldati & Marchioli (2009) Soldati, Alfredo & Marchioli, Cristian 2009 Physics and modelling of turbulent particle deposition and entrainment: Review of a systematic study. International Journal of Multiphase Flow 35 (9), 827–839.
- Squires & Eaton (1991) Squires, Kyle D & Eaton, John K 1991 Preferential concentration of particles by turbulence. Physics of Fluids A: Fluid Dynamics 3 (5), 1169–1178.
- Sumbekova et al. (2017) Sumbekova, Sholpan, Cartellier, Alain, Aliseda, Alberto & Bourgoin, Mickael 2017 Preferential concentration of inertial sub-kolmogorov particles: The roles of mass loading of particles, stokes numbers, and reynolds numbers. Physical Review Fluids 2 (2), 024302.
- Sundaram & Collins (1997) Sundaram, Shivshankar & Collins, Lance R 1997 Collision statistics in an isotropic particle-laden turbulent suspension. part 1. direct numerical simulations. Journal of Fluid Mechanics 335, 75–109.
- Sundaram & Collins (1999) Sundaram, Shivshankar & Collins, Lance R 1999 A numerical study of the modulation of isotropic turbulence by suspended particles. Journal of Fluid Mechanics 379, 105–143.
- Taniere et al. (1997) Taniere, A, Oesterle, B & Monnier, JC 1997 On the behaviour of solid particles in a horizontal boundary layer with turbulence and saltation effects. Experiments in Fluids 23 (6), 463–471.
- Vance et al. (2006) Vance, Marion W, Squires, Kyle D & Simonin, Olivier 2006 Properties of the particle velocity field in gas-solid turbulent channel flow. Physics of Fluids 18 (6), 063302.
- Varaksin et al. (2000) Varaksin, A Yu, Polezhaev, Yu V & Polyakov, Anatoly F 2000 Effect of particle concentration on fluctuating velocity of the disperse phase for turbulent pipe flow. International journal of heat and fluid flow 21 (5), 562–567.
- Vreman (2007) Vreman, AW 2007 Turbulence characteristics of particle-laden pipe flow. Journal of fluid mechanics 584, 235–279.
- Vreman (2015) Vreman, AW 2015 Turbulence attenuation in particle-laden flow in smooth and rough channels. Journal of Fluid Mechanics 773, 103–136.
- Wang et al. (2017) Wang, Guiquan, Abbas, Micheline & Climent, Éric 2017 Modulation of large-scale structures by neutrally buoyant and inertial finite-size particles in turbulent couette flow. Physical Review Fluids 2 (8), 084302.
- Wang & Richter (2018) Wang, Guiquan & Richter, David 2018 Modulation of the turbulence regeneration cycle by inertial particles in planar couette flow. arXiv preprint arXiv:1807.02107 .
- Wang & Maxey (1993) Wang, Lian-Ping & Maxey, Martin R 1993 Settling velocity and concentration distribution of heavy particles in homogeneous isotropic turbulence. Journal of fluid mechanics 256, 27–68.
- Wei et al. (2005) Wei, Tie, Schmidt, Rodney & McMurtry, Patrick 2005 Comment on the clauser chart method for determining the friction velocity. Experiments in fluids 38 (5), 695–699.
- Wilkinson & Mehlig (2005) Wilkinson, M & Mehlig, Bernhard 2005 Caustics in turbulent aerosols. EPL (Europhysics Letters) 71 (2), 186.
- Wood et al. (2005) Wood, AM, Hwang, W & Eaton, JK 2005 Preferential concentration of particles in homogeneous and isotropic turbulence. International journal of multiphase flow 31 (10-11), 1220–1230.
- Wu et al. (2006) Wu, Yi, Wang, Hangfeng, Liu, Zhaohui, Li, Jing, Zhang, Liqi & Zheng, Chuguang 2006 Experimental investigation on turbulence modification in a horizontal channel flow at relatively low mass loading. Acta Mechanica Sinica 22 (2), 99–108.
- Yang & Shy (2005) Yang, TS & Shy, SS 2005 Two-way interaction between solid particles and homogeneous air turbulence: particle settling rate and turbulence modification measurements. Journal of fluid mechanics 526, 171–216.
- Young & Leeming (1997) Young, John & Leeming, Angus 1997 A theory of particle deposition in turbulent pipe flow. Journal of Fluid Mechanics 340, 129–159.
- Zamansky et al. (2016) Zamansky, Rémi, Coletti, Filippo, Massot, Marc & Mani, Ali 2016 Turbulent thermal convection driven by heated inertial particles. Journal of Fluid Mechanics 809, 390–437.
- Zhang & Ahmadi (2000) Zhang, Haifeng & Ahmadi, Goodarz 2000 Aerosol particle transport and deposition in vertical and horizontal turbulent duct flows. Journal of Fluid Mechanics 406, 55–80.
- Zhao et al. (2010) Zhao, LH, Andersson, Helge I & Gillissen, JJJ 2010 Turbulence modulation and drag reduction by spherical particles. Physics of Fluids 22 (8), 081702.