Ultra-Diffuse Galaxies at Ultraviolet Wavelengths
Abstract
We measure NUV aperture magnitudes from GALEX images for 258 ultra-diffuse galaxy (UDG) candidates drawn from the initial SMUDGes survey of square degrees surrounding, and including, the Coma galaxy cluster. For the vast majority, 242 of them, we present flux upper limits due either to a lack of significant flux in the aperture or confusion with other objects projected within the aperture. These limits often place interesting constraints on the UDG candidates, indicating that they are non-star forming or quiescent. In particular, we identify field, quiescent UDG candidates, which are a challenge for formation models and are therefore compelling prospects for spectroscopic follow-up and distance determinations. We present FUV and NUV magnitudes for 16 detected UDG candidates and compare those galaxies to the local population of galaxies on color-magnitude and specific star formation rate diagrams. The NUV detected UDG candidates form mostly an extension toward lower stellar masses of the star forming galaxy sequence and none of these lie within regions of high local galaxy density. UDG candidates span a range of properties, although almost all are consistent with being quiescent, low surface brightness galaxies, regardless of environment.
1 Introduction
Physically large, and possibly massive, low surface brightness galaxies, recently coined as ultra-diffuse galaxies (UDGs; van Dokkum et al., 2015), are potentially unique testing grounds for theories of galaxy formation (e.g. Yozin & Bekki, 2015; Amorisco & Loeb, 2016; Agertz & Kravtoc, 2016; Di Cintio et al., 2017; Rong et al., 2017; Chan et al., 2018; Carleton et al., 2018) and the nature of dark matter (e.g. Bernal et al., 2018). Low surface brightness galaxies, even physically large ones, have been known to exist for decades (e.g. Sandage & Binggeli, 1984; Impey et al., 1988; Conselice et al., 2003), but the novel and compelling development is that the largest among these appear to inhabit massive dark matter halos, such that their mass-to-light ratios are comparable to those of the most dark matter dominated dwarf spheroidal satellites of our Galaxy.
Evidence supporting the large inferred masses comes from kinematic measurements of integrated starlight (van Dokkum et al., 2016) and of globular clusters (Beasley et al., 2016), and from the size of their globular cluster populations (van Dokkum et al., 2017). There are caveats associated with the interpretation of both the kinematics, which are measured at small radii necessitating significant extrapolation to estimate total masses, and the globular cluster counts, which adopt large completeness corrections and assume that the relationship between the number of globular clusters and total mass (Blakeslee et al., 1997; Georgiev et al., 2010; Harris et al., 2013; Forbes et al., 2016; Harris et al., 2017; Zaritsky et al., 2017; Forbes et al., 2018) holds for UDGs. Even so, it is only the physically largest UDGs that appear to be this extreme in their total mass, while the physically smaller, more common among them appear to have lower masses that are consistent with those of dwarf galaxies (Amorisco et al., 2018; Sifón et al., 2018). Therefore, much of the population of UDGs is likely to overlap what had been previously referred to as low surface brightness (LSB) galaxies (Disney, 1976; Schombert & Bothun, 1988; Schwartzenberg et al., 1995; Sprayberry et al., 1997; Dalcanton et al., 1997; Conselice et al., 2003).
Large area photometric surveys are now uncovering LSBs/UDGs by the hundreds and thousands in a variety of environments (eg. Yagi et al., 2016; van der Burg et al., 2016; Greco et al., 2018; Zaritsky et al., 2018). Such surveys are crucial if one wants to compile a large sample of the largest, most massive UDGs — the objects that are truly unusual and most likely to place demanding constraints on both models of galaxy evolution and dark matter. However, the lack of redshifts and other ancillary data for nearly all UDG candidates means that these objects are solely defined by surface brightness and angular size, leading to what is likely to be a heterogeneous population (Zaritsky, 2017; Greco et al., 2018; Ferré-Mateu et al., 2018; Lim et al., 2018), thereby mitigating their value as probes of galaxy evolution and dark matter.
Measuring redshifts is currently the limiting factor in utilizing UDGs to advance our understanding of galaxy properties. Optical spectroscopy is expensive, requiring multiple hours per object on our largest ground-based telescopes (eg. van Dokkum et al., 2015; Kadowaki et al., 2017) and neutral hydrogen observations yield redshifts only for the small fraction of UDG candidates with gas (Spekkens & Karunakaran, 2018). Guidance regarding the most promising candidates to target for the expensive spectroscopic follow-up would help mitigate the cost of the observations. Projected membership in a galaxy cluster or group has been one adopted approach, nearly guaranteeing that the adopted distance is the true distance (eg. Kadowaki et al., 2017; Alabi et al., 2018). However, such galaxies have evolved within a dynamical environment, complicating the interpretation of their evolution and structure.
Because of the common focus on UDGs in galaxy clusters, due to the question of distances and observational efficiency, those systems are better characterized than UDGs in low density environments. UDGs in clusters are almost exclusively red, consistent with being quiescent (Yagi et al., 2016; van der Burg et al., 2016). This empirical finding has led to speculation that the evolution of these galaxies is guided by tidal effects, ram pressure gas loss, environmental “strangulation", and basically all of the phenomena that are speculated to alter high brightness galaxies in clusters (cf. Boselli & Gavazzi, 2006). In contrast, the small number of UDGs spectroscopically confirmed to lie in the field are optically bluer (Zaritsky et al., 2018) and sometimes have associated HI (Leisman et al., 2017; Spekkens & Karunakaran, 2018). In fact, several UDG origin scenarios predict an absence of red UDGs in the field (eg. Di Cintio et al., 2017; Chan et al., 2018). Unfortunately, the field UDG population is poorly studied.
The use of existing ultraviolet imaging from the GALEX (Martin et al., 2005) mission archive is an efficient way to measure the prevalence of recent star formation in UDGs across all environments. The use of UV flux to form a UV-optical color has the advantage that it is far more sensitive to recent star formation than are optical colors, while it has the disadvantage that it is in general much more challenging to measure. The GALEX archive was already examined by Greco et al. (2018) in relation to their catalog of low surface brightness galaxies. They find a high detection fraction, 76%, among their optically blue sample, although the UDG selection criteria are different between their sample and SMUDGes. For example, Greco et al. (2018) include systems of smaller angular extent and base their surface brightness criteria on a mean surface brightness within the effective radius rather than a central surface brightness. Here we investigate whether the set of UDG candidates released in the first SMUDGes catalog (Zaritsky et al., 2018) has NUV counterparts, what the properties of those systems are, and interpret the limits from those that are not detected. In §2 we describe our analysis of the GALEX data and how we obtain our photometry. In §3 we present our results, particularly the distribution of UDGs in color-magnitude space relative to “normal" local galaxies and the spatial distribution of various UDG subclasses.
2 Data
We begin with the UDG catalog from Zaritsky et al. (2018) of 275 UDG candidates with half light radii, , 5.3 that lie within roughly a 10∘ projected radius from the Coma galaxy cluster. One key difference between SMUDGes and other UDG catalogs is that the angular criterion corresponds to a physical effective radius, for those objects at the distance of the Coma cluster, of 2.5 kpc rather than the canonical 1.5 kpc. For example, in terms of angular size alone, we select objects whose minimum size is over twice that set by Greco et al. (2018). There is no physically motivated justification for either size criterion, but we choose to focus our effort on the candidates that are more likely to be physically larger. The projected virial radius of the Coma cluster is (Kubo et al., 2007) so the bulk of the survey volume is well outside of the cluster, with 67% of the UDG candidates in the Zaritsky et al. (2018) sample projected beyond the Coma cluster virial radius.
From the Zaritsky et al. (2018) catalog, we extract the coordinates, the half light radii, and the optical magnitudes. We choose to use the -band primarily, although and are also measured in SMUDGes, for comparison to existing work and because provides a compromise between providing the longest wavelength baseline in combination with NUV and the highest signal-to-noise.
The NUV data come from the NASA public archive portal MAST111archive.stsci.edu of the GALEX mission (Martin et al., 2005). GALEX was a 50 cm diameter UV telescope capable of imaging the sky in FUV (1350-1750 Å) and NUV (1750-2750 Å) bands simultaneously. We exclude UDG candidates without available band or that lie outside available GALEX images, and our final sample consists of 258 candidates. As discussed below, detections were sufficiently uncommon in the NUV band that we do not present results for the FUV band for the full sample. The image database is not of uniform depth and so detection thresholds vary across the sample.
To determine whether we detect each individual candidate in the available data, we used the Astropy (The Astropy Collaboration, 2018) affiliated package Photutils222doi.org/10.5281/zenodo.1039309 to perform photometry on the NUV data at each candidate’s location. We define a circular aperture of radius 2, where is the optical half light radius of the target, and measure the flux in the NUV intensity map from which we subtract the background flux. We determine the background flux by measuring the flux within the same circular aperture in the GALEX-provided sky background image. We convert from counts per second (CPS) to an NUV magnitude in the AB system (Oke, 1964; Oke & Gunn, 1983) using the equation
| (1) |
(Morrissey et al., 2005).
To check that the background image is uncontaminated by the UDG candidate itself and to account for the effect of variations in the background map, we recompute after displacing the background aperture, starting from a displacement of 2 and increasing to 10 in and . Although the change in magnitude tends to increase with the displacement, the absolute value of the difference is 0.1 mag for the vast majority (ranging from 240 out of 258 for the smallest displacements to 200 out of 258 for the largest).
The point spread function (PSF) for the GALEX NUV images is 6.0 FWHM (Martin et al., 2005), which can lead to confusion among sources and strong contamination in some cases. In our first step to mitigate this problem, we compute the ratio of the flux obtained within an aperture of radius 2 to that obtained within an aperture of radius . We reject candidates where this ratio is 4. We visually confirmed that this criterion identifies strongly contaminated objects. Fifty-three candidates are classified as strongly contaminated and not considered further. Other candidates where this ratio is 4 may nevertheless suffer more subtle contamination and we discuss that problem further below.
Among the remaining sources, we expect our uncertainties to be dominated by the uncertainty in the background determination. To estimate the mean background uncertainty, we measure the scatter in fluxes obtained from visually-inspected uncontaminated sky regions. We identify blank apertures (of equal size) and measure the enclosed flux. We then compute the standard deviation, , by fitting a Gaussian to the resulting distribution of measured fluxes among the apertures. We define the mean background uncertainty per pixel to be , where is the number of pixels in the sky aperture. The uncertainty in the mean background level within a target aperture is then , where is the number of pixels in the target aperture. If there is a large scale gradient to the background, then our method for estimating the uncertainties will overestimate the background uncertainty locally. However, we cannot be sure that the background gradient is real or systematic and our method captures this uncertainty.
| Criterion | Number Rejected | Number Remaining |
|---|---|---|
| Lacking NUV or r photometry | 17 | 258 |
| Contaminated (flux ratio) | 53 | 205 |
| SNR 2 | 168 | 37 |
| Contaminated (visually determined) | 21 | 16 |
To ascertain our confidence in a source detection, we define the signal to noise ratio (SNR) for each candidate UDG detection, ignoring the uncertainty contribution from the source itself and any faint contaminating objects, as
| (2) |
We consider sources with SNR2 to be non-detections and visually inspect all others. While visually inspecting the candidates with SNR2, we consider how well centered the object is, the extent of the object, and the possible contaminating effects of the neighbors on the photometry. If we conclude that the detection cannot be confidently assigned to the UDG candidate, we label that as a non-detection. For all sources that are classified as non-detections, we either accept the measured flux as an upper limit on the flux or, in cases, where the measured flux is negative, we assign a value of twice the background uncertainty to be the flux upper limit. In cases where we suspect contamination, the measured flux is a conservative upper limit because we have not attempted to correct for the contaminating object.
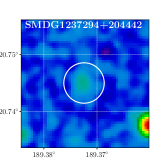
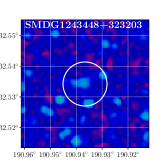
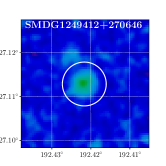
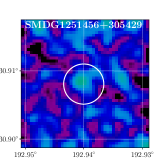
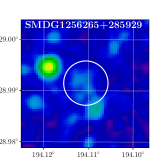
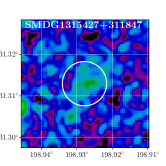
After rejecting 53 candidates on the basis of our initial contamination criterion and 17 candidates without either NUV images or band data, we have 16 detections and 189 non-detections (the effect of different criteria on the final set of detected candidates is summarized in Table 1). The NUV images for the 16 detections are presented in Figure 1. For those detected in NUV, we also measure the FUV magnitude using the same procedure. In Table 2 we present the extinction corrected values of the NUV and FUV magnitudes for those same UDG candidates and band magnitudes using published reddening maps (Schlafly & Finkbeiner, 2011) and the following selective extinction relations
| (3) |
as also adopted by Wyder et al. (2007). We present the lower limits on for the objects that are not visually discernable in the FUV band. Table 3 uses a similar format and contains the extinction corrected limits for the non-detections.
Some of the detections could be chance coincidences with other UV-emitting objects. To gauge the magnitude of this effect, we placed random apertures within the same set of GALEX images and found that 15% of the time the detected flux satisfies our initial SNR 2 criterion. After visual examination, only 20% of those are sufficiently well-centered and uncontaminated. In combination, these results suggest that 3% of our UDG candidates (8 out of 258) could have false superpositions. Accounting for the fraction of contaminated sources, we conclude that 6 of our 16 detections might be attributable to superpositions.
In contrast, some of the non-detections could be chance coincidences of emitting sources with strong, negative noise fluctuations. However, given our few detections, we do not expect there to be a significant population of such objects. Assuming that the positive superpositions discussed above are matched by negative ones, which is overly conservative because real sources contribute to positive fluctuations but not to negative ones, we cap the fraction of such events at 15%. Given 10 to 16 detected sources, we expect to have “lost" one to two sources that we would have otherwise detected.


3 Results
| Object Name | |||||
|---|---|---|---|---|---|
| [arcsec] | |||||
| SMDG1223447+295951 | 9.7 | 18.39 | 21.11 0.26 | 23.54 0.61 | 0.02 |
| SMDG1225264+311647 | 8.5 | 17.62 | 21.68 0.38 | 22.07 0.14 | 0.02 |
| SMDG1228115+290105 | 5.3 | 20.04 | 22.56 0.55 | 22.98 0.20 | 0.02 |
| SMDG1230455+264650 | 5.8 | 19.02 | 20.64 0.10 | 22.31 0.12 | 0.02 |
| SMDG1237294+204442 | 6.4 | 19.56 | 21.64 0.30 | 24.20 0.80 | 0.03 |
| SMDG1243448+323203 | 12.9 | 17.88 | 21.11 0.33 | 23.85 1.05 | 0.01 |
| SMDG1249412+270646 | 9.0 | 18.98 | 20.89 0.19 | 22.86 0.29 | 0.01 |
| SMDG1251456+305429 | 5.3 | 21.06 | 22.55 0.51 | 25.59 2.13 | 0.01 |
| SMDG1256265+285929 | 7.8 | 19.11 | 21.89 0.40 | 23.41 0.41 | 0.01 |
| SMDG1306148+275941 | 9.4 | 19.14 | 21.81 0.45 | 23.32 0.45 | 0.01 |
| SMDG1307463+291231 | 8.6 | 19.09 | 22.14 0.55 | 24.70 1.45 | 0.01 |
| SMDG1313187+312453 | 22.5 | 16.47 | 20.21 0.25 | 21.96 0.31 | 0.01 |
| SMDG1315427+311847 | 9.6 | 18.51 | 20.18 0.10 | 21.34 0.07 | 0.01 |
| SMDG1320482+314822 | 5.9 | 19.58 | 21.56 0.23 | 22.86 0.19 | 0.01 |
| SMDG1333170+281431 | 5.9 | 19.51 | 21.27 0.18 | 22.73 0.17 | 0.01 |
| SMDG1340312+282659 | 6.9 | 19.86 | 21.22 0.19 | 23.92 0.59 | 0.01 |
| Object Name | |||||
|---|---|---|---|---|---|
| [arcsec] | |||||
| SMDG1212080+281630 | 5.6 | 22.7 | 20.9 | 0.02 | 1.7 |
| SMDG1212085+290348 | 6.1 | 25.6 | 19.7 | 0.02 | 0.1 |
| SMDG1212454+273506 | 5.4 | 23.6 | 20.7 | 0.02 | 0.8 |
| SMDG1213061+294551 | 10.6 | 20.9 | 18.0 | 0.02 | 4.6 |
| SMDG1213235+264641 | 6.4 | 23.3 | 20.6 | 0.02 | 0.9 |
| SMDG1213512+282109 | 5.5 | 22.4 | 19.8 | 0.01 | 2.2 |
| SMDG1214010+293203 | 6.3 | 22.8 | 20.8 | 0.02 | 1.3 |
| SMDG1214279+294033 | 6.1 | 22.4 | 20.6 | 0.02 | 0.3 |
| SMDG1214418+274954 | 8.4 | 22.0 | 18.7 | 0.02 | 0.0 |
| SMDG1214429+291508 | 11.3 | 22.7 | 18.6 | 0.02 | 0.9 |
Only the first 10 entries are presented here for reference. The complete table is available electronically.
NUV detections from candidate UDGs drawn from the SMUDGes catalog in GALEX images are rare. We identify only 16 out of 258 (6%), or only 10 (4%) if we account for the possibility of source superposition. Of course, there are a variety of possible reasons for why the remaining systems have low UV fluxes, but even the limits convey information.
3.1 Distribution in Color-Magnitude Space
In Figure 2 we compare the distribution of both our detections and limits for non-detections to the distribution measured for the local galaxy population by Wyder et al. (2007), assuming that the candidate UDGs lie at the distance of the Coma cluster. Zaritsky et al. (2018) provide evidence suggesting this is likely to be the correct distance for most, but not all, of the UDG candidates within this first released survey area. Errors in distance affect only the location of the candidate UDG along the abscissa and so do not significantly impact what we conclude next. We expect errors in our assigned distances to be mostly overestimates because placing the candidates beyond Coma would imply even larger physical sizes.
In Figure 2, we outline with blue and red dashed lines possible extrapolations of the blue cloud and red sequence galaxy populations. The equations for the top and bottom red dashed lines are
| (4) | ||||
| (5) |
and the equations for top and bottom blue dashed lines are
| (6) | ||||
| (7) |
respectively.
For the red sequence, we deliberately define an extreme possibility of a highly tilted red sequence, for which there is a hint in the Wyder et al. (2007) data and which provides the most optimistic possibility for detecting red sequence UDGs in GALEX data. Even so, we have only one detection that might lie on the red sequence. It is evident from this comparison, that we should not expect to detect UDGs that are not forming stars in these GALEX images.
The bulk of the detections lie in an area of the diagram consistent with an extrapolation of the blue cloud, suggesting that at least these objects are forming stars. However, 135 of the 189 non-detections have lower limits on NUV that place them redder than the blue cloud, demonstrating that the majority of the candidates are not star-forming, low mass galaxies. Selecting objects that are large in angular extent and have low central surface brightness in the optical ( mag arcsec2) results in a sample that is dominated by non- or weakly-star forming galaxies in all environments.

3.2 Stacking Analysis
To examine the nature of the non-detections in the extrapolated red and blue sequences of Figure 2, we first average their flux limits and propagate uncertainties to determine if it is feasible to detect an object in the image stack of these candidates if they all have the maximum allowed flux. For the red sequence non-detections, we find that even a stack all of such sources will have insufficient signal for a detection. For the blue sequence non-detections, excluding the one bright UDG candidate at , we find that we could detect the stacked object, provided the objects are not much fainter than the NUV limits.
Our stack of the images of the UDG candidates whose NUV limits potentially place them in the blue cloud region of Figure 2 does result in a detected central object. The stack might include contaminating objects, which we have no way of excluding, and therefore our detection should be treated as a lower limit on NUV. Even so, our measurement (NUV) places the mean object on the red sequence rather than in the blue cloud, suggesting that the majority of the objects contributing to the stack must be on the red sequence. Because we now exclude even most non-detections from the blue cloud, we conclude that the bulk of our UDG candidates are indeed quiescent.

3.3 Spatial Distribution
In Figure 3 we present the spatial distribution of the UDG candidates, coded by whether or not we detect NUV flux. The few detections that lie close to the Coma cluster in projection lie on the periphery. The candidate UDGs for which we were unable to make a measurement because they lacked either GALEX imaging or band data are distributed randomly across the survey area and are not shown in the Figure. The UDG candidates outside of Coma are also predominantly non-detections.
A concern in interpreting the distribution of non-detections is that a fraction of these sources were rejected due to possible contamination. As such, some could have significant NUV flux. Furthermore, it is possible that within regions of high galaxy density we are more likely to identify possible contaminating sources within the aperture. However, we visually rejected only 5 sources within the Coma virial radius. We rejected 16 outside of Coma. The vast majority of UDG candidates (110) within the Coma virial radius had no detectable flux. We conclude that the lack of candidates identified as NUV detections within the Coma cluster is not due to a bias caused by increased contamination within the measurement apertures.
A second potential concern is that the NUV survey depth is uneven across the field. However, the high density areas that proportionally lack NUV detections, the Coma cluster and the area toward the right of Figure 3, tend to have the deeper GALEX imaging available than the low density areas. We conclude that survey depth variations are not responsible for the relative lack of NUV detections in dense environments.
In Figure 4 we show the spatial distribution of a subset of UDG candidates, those that lie either within our extrapolated red sequence or blue cloud regions in Figure 2. Because the majority of these points represents limits on the color, the blue cloud points could represent red UDG candidates, while the red sequence points are securely red. The Coma cluster is dominated by the presence of red sequence galaxies. This confirms the findings of van der Burg et al. (2016) who, on the basis of optical colors, concluded that cluster UDGs are nearly all quiescent. There is an apparent over representation of red UDG candidates also in the overdensity on the right of Figure 4, and a relative overabundance of blue points in the field. However, we know from our stacking analysis that the bulk of these are also quiescent galaxies.
A particularly interesting population of objects are those UDG candidates for which the NUV color limit constrains them to be a quiescent field UDG candidate. These are confidently identified as both quiescent and outside of a dense galaxy environment. Because we do not know their distance, we cannot confirm that they are indeed UDGs rather than dwarf elliptical/spheroidal galaxies. Nevertheless, there are 24 UDG candidates that lie at least 3 virial radii in projected separation from Coma, beyond where cluster effects are observed and theorized to end (cf. Gómez et al., 2003; Zinger et al., 2018) and are confirmed as red for which redshifts would be particularly valuable. GALEX screening of the larger samples expected from the SMUDGes survey will be an efficient way to identify quiescent field UDG candidates. In the entire sample, again assuming that these lie at the distance of the Coma cluster, 8 detections and 21 non-detections belong to UDGs that have 4 kpc. Seven from the latter category lie well outside both the Coma cluster and the galaxy concentration seen toward the right of Figure 4.

3.4 Star Formation Rates
Interpreting the NUV flux as originating from young stars, we proceed to estimate the stellar mass normalized star formation rate, or specific star formation rate (sSFR). These estimates provide an upper limit on the current sSFR because the NUV flux can also originate from somewhat older stars. We will return to this topic farther below when we discuss the FUVNUV colors. Measurements of the sSFR were done for the local galaxy population by Schiminovich et al. (2007), and we follow their approach. We obtain the star formation rate (SFR) from the NUV flux using the relation
| (8) |
as adopted by Wyder et al. (2007). To estimate the stellar mass, we first calculate the mass to light ratio (M/L) from the color using the relation
| (9) |
from Bell et al. (2003). The and magnitudes for the UDGs are given by Zaritsky et al. (2018) and extinction corrected. The stellar mass is then estimated by taking the product of with the band luminosity. The Bell et al. (2003) relation was not derived including UDG stellar populations, but the uncertainty in M/L is small in comparison to the range of SFRs. The sSFR is then simply given by the ratio of the SFR to the stellar mass.
We also calculated the sSFR using a more recent color stellar mass relation derived by Roediger & Courteau (2015) to check the effect of using a different stellar mass estimator. Although, the new transformation noticeably moves the UDG candidates in the stellar mass - specific star formation rate space (the mean fractional change decreases the stellar mass by 46%), the overall distribution remains almost the same and hence does not affect the qualitative results that we present next.
We compare the calculated sSFR’s for the 16 detected UDG candidates to the distribution of values found for local galaxies by Schiminovich et al. (2007) in Figure 5. The distribution of UDGs outlines the upper boundary of the region in this diagram that is populated by the UDG candidates from the SMUDGes survey. At the bluest end, the detected UDGs with the highest sSFR’s almost reach the star forming sequence, suggesting that at the lowest stellar masses we detect the galaxies can be hosting relatively high specific star formation rates and still satisfy our surface brightness selection criteria. However, at most 10 out of the 258 UDG candidates are in this category, demonstrating that the UDG selection criteria is not broadly detecting field star forming dwarfs. Although field UDGs, as defined by the SMUDGes criteria, are generally optically bluer than their cluster counterparts (Zaritsky et al., 2018), they are not low mass galaxies on the star forming sequence. They might possibly tend to be lower stellar mass, and hence lower metallicity, systems. At the high stellar mass end, we are just able to detect in GALEX images objects near the quiescent sequence. The remainder of our detections lie somewhere between the two extremes. The non-detections will fill in the lower left of this diagram, but significantly deeper NUV imaging is necessary to place those objects on this diagram. Distance errors, if the UDG candidates are actually closer than the assumed Coma cluster distance, will move objects to the left in the diagram but do not qualitatively affect our conclusions.
Returning to the question of whether the NUV flux originates from ongoing star formation, we examine the FUVNUV color for the NUV-detected objects. All but two of the detections are red in FUVNUV (), suggesting that the sSFR’s estimated using the NUV fluxes are overestimates of the current sSFR. Such red colors are consistent with those measured for LSB galaxies (Boissier et al., 2008; Wyder et al., 2009). Although the UDG colors appear to be somewhat redder on average than those published for the LSBs, the reddest among our systems have the largest uncertainties and, within 2, are consistent with the LSB colors. Interpreting our measurements of sSFR as upper limits, places even more of the NUV-detected objects into the quiescent category. Only in two cases are the FUVNUV colors consistent with ongoing star formation. This confirms our general result that the SMUDGes UDGs are almost exclusively non-star forming systems in all environments and is consistent with the previous determination that low surface brightness galaxies have lower star formation efficiencies than high surface brightness galaxies (Wyder et al., 2009).

4 Conclusions
We present NUV measurements from GALEX images of the NUV fluxes or flux limits for the sample of ultra-diffuse galaxies (UDGs) presented by the SMUDGes survey (Zaritsky et al., 2018). Of the 258 UDG candidates that have the necessary GALEX imaging and band photometry, we reject 53 as being strongly contaminated by a nearby source, measure a statistically significant NUV flux, and hence NUV color, for 16, and place limits on the NUV flux for the remaining 189.
For a subset of the non-detections the limits are sufficiently constraining that we conclude that they are quiescent galaxies. Furthermore, some of these lie well outside of any high galaxy density region, making those objects prime candidates for quiescent, field UDGs. It is important to measure the distances to these objects and determine whether these are indeed physically large galaxies. Models of UDG formation find it challenging to produce quiescent, large, field, low surface brightness galaxies.
None of the NUV detected objects are in regions of high density, confirming conclusions reached using optical photometry that UDGs within clusters are quiescent. Furthermore, our analysis of the image stack of candidate UDGs whose photometric limits did not preclude them from being star forming objects yielded an NUV flux measurement that demonstrated that the majority of the objects in that stack are actually quiescent as well. Lastly, only two of the NUV detected UDGs have FUVNUV colors consistent with ongoing star formation. We conclude that the vast majority of the SMUDGes UDG candidates are quiescent, independent of environment.
GALEX archival imaging provides valuable ancillary information that can relatively easily help identify key sub populations from the large number of UDG candidates that ongoing surveys will identify.
5 Acknowledgments
We thank Remco van der Burg and Ananthan Karunakaran for helpful comments on an earlier draft. Some of the data presented in this paper were obtained from the Mikulski Archive for Space Telescopes (MAST). STScI is operated by the Association of Universities for Research in Astronomy, Inc., under NASA contract NAS5-26555. We gratefully acknowledge financial support for this work from the National Science Foundation (NSF AAG-171384)
References
- The Astropy Collaboration (2018) The Astropy Collaboration, Price-Whelan, A.M., Sipőcz, B.M, et al. 2018, arXiv:1801.02634
- Agertz & Kravtoc (2016) Agertz, O., & Kravtsov, A. V., 2016, ApJ, 824, 79
- Alabi et al. (2018) Alabi, A., Ferré-Mateu, A., Romanowsky, A. J., et al. 2018, MNRAS, 479, 3308
- Amorisco & Loeb (2016) Amorisco, N. C. & Loeb, A., 2016, ApJ, 459, L51
- Amorisco et al. (2018) Amorisco, N.-C., Monachesi, A., Agnello, A. & White, S.D.M., 2018, MNRAS, 475, 4235
- Beasley et al. (2016) Beasley, M. A., Romanowsky, A. J., Pota, V., Navarro, I. M.,, Martinez Delgado, D. Neyer, F. & Deich, A. L., 2016, ApJ, 819, 20
- Bell et al. (2003) Bell, E. F., McIntosh, D. H., Katz, N. & Weinberg, M. D. ApJS, 2003, 149, 289
- Bernal et al. (2018) Bernal, T., Fernández-Hernández, L. M., Matos, T., & Rodríguez-Meza, M. A., 2018, MNRAS, 475, 1447
- Blakeslee et al. (1997) Blakeslee, J. P., Tonry, J. L., & Metzger, M. R., 1997, AJ, 114, 482
- Boissier et al. (2008) Boissier, S., Gil de Paz, A., Boselli, A., et al., 2008, ApJ, 681, 244
- Boselli & Gavazzi (2006) Boselli, A., & Gavazzi, G., 2006, PASP, 118, 517
- Carleton et al. (2018) Carleton, T., Errani, R., Cooper, M., Kaplinghat, M. & Peñarrubia, J., 2018, arXiv:1805.06896
- Chan et al. (2018) Chan, T. K., Kereš, D., Wetzel, A., et al., 2018, MNRAS, 478, 906
- Conselice et al. (2003) Conselice, C.J., Gallagher III, J.S., & Wyse, R.F.G. 2003, AJ, 125, 66
- Dalcanton et al. (1997) Dalcanton, J.J., Spergel, D.N., Gunn, J.E., Smith, M., & Schneider, D.P. 1997, AJ, 114, 635
- Di Cintio et al. (2017) Di Cintio, A., Brook, C. B., Dutton, A. A., Macciò, A. V., Obreja, A., & Dekel, A., 2017, MNRAS, 466, L1
- Disney (1976) Disney, M.J., 1976, Nature, 264, 573
- Ferré-Mateu et al. (2018) Ferré-Mateu A., Alabi, A., Forbes, D. A., et al., 2018, MNRAS, 479, 4891
- Forbes et al. (2016) Forbes, D. A., Alabi, A., Romanowsky, A. J., Brodie, J. P., Strader, J., Usher, C., & Pota, V., 2016, MNRAS, 458, L44
- Forbes et al. (2018) Forbes, D. A., Read, J. I., Gieles, M., & Collins, M.L.M., 2018, MNRAS, 481, 5592
- Georgiev et al. (2010) Georgiev, I. Y., Puzia, T. H., Goudfrooij, P., & Hilker, M., 2010, MNRAS, 406, 1967
- Gómez et al. (2003) Gómez, P. L. Nichol, R. C., Miller, C. J., et al., 2003, ApJ, 584, 210
- Greco et al. (2018) Greco, J., Greene, J. E., Strauss, M.A. et al. 2018, ApJ, 857, 104
- Harris et al. (2013) Harris, W. E., Harris, G. L. H., & Alessi, M., 2013, ApJ, 772, 82
- Harris et al. (2017) Harris, W. E., Blakeslee, J. P., & Harris, G. L. H., 2017, ApJ, 836, 67
- Impey et al. (1988) Impey, C., Bothun, G., & Malin, D., 1988, ApJ, 330, 634
- Kadowaki et al. (2017) Kadowaki, J., Zaritsky, D., & Donnerstein, R.L. 2017, ApJ, 838, 21
- Kubo et al. (2007) Kubo, J.M., Stebbins, A., Annis, J., et al. 2007, ApJ, 671, 1466
- Leisman et al. (2017) Leisman, L., Haynes, M. P., Janowiecki, S., Hallenbeck, G., Józsa, G., Giovanelli, R., Adams, E. A. K., Bernal Neira, D., Cannon, J. M., Janesh, W. F., Rhode, K. L., & Salzer, J. J., 2017, ApJ, 842, 133L
- Lim et al. (2018) Lim, S., Peng, E. W., Cote, P., Sales, L. V., den Brok, M., Blakeslee, J. P., & Guhathakurta, P., 2018, ApJ, 862, 82
- Martin et al. (2005) Martin, D.C., Fanson, J., Schiminovich, D. et al., 2005, ApJ, 619, L1
- Morrissey et al. (2005) Morrissey, P., Schiminovic, D., Barlow, T.A. et al. 2005, ApJ, 619, L7
- Oke (1964) Oke, J.-B., 1964, ApJ, 140, 689
- Oke & Gunn (1983) Oke, J.-B. & Gunn. J.E. 1983, ApJ, 266, 713
- Roediger & Courteau (2015) Roediger, J. C., & Courteau, S., 2015, MNRAS, 452, 3209
- Román & Trujillo (2017a) Román, J., & Trujillo, I., 2017a, MNRAS, 468, 703
- Román & Trujillo (2017b) Román, J., & Trujillo, I., 2017b, MNRAS, 468, 4039
- Rong et al. (2017) Rong, Y., Guo, Q., Gao, L., et al., 2017, MNRAS, 470, 4231
- Sandage & Binggeli (1984) Sandage, A. & Binggeli, B. 1984, AJ, 89, 919
- Schiminovich et al. (2007) Schiminovich, D., Wyder, T.K., Martin, D.C. et al. 2007, ApJS, 173, 315
- Schlafly & Finkbeiner (2011) Schlafly, E.F. & Finkbeiner, D.P., 2011, ApJ, 737, 103
- Schombert & Bothun (1988) Schombert, J. M. & Bothun, G. D., 1988, AJ, 95, 1389
- Schwartzenberg et al. (1995) Schwartzenberg, J. M., Phillipps, S., Smith, R. M., Couch, W. J., & Boyle, B. J., 1995, MNRAS, 275, 121
- Shi et al. (2017) Shi, D. D., Zheng, X. Z., Zhao, H. B., et al., 2017, ApJ, 846, 26
- Sifón et al. (2018) Sifón, C., van der Burg, R. F. J., Hoekstra, H., Muzzin, A., & Herbonnet, R., 2018, MNRAS, 473, 3747
- Spekkens & Karunakaran (2018) Spekkens, K., & Karunakaran, A. 2018, ApJ, 855, 28
- Sprayberry et al. (1997) Sprayberry, D., Impey, C. D., Irwin, M. J., & Bothun, G. D., 1997, ApJ, 482, 104
- van der Burg et al. (2016) van der Burg, R. F. J.. Muzzin, A., & Hoekstra, H., 2016, A&A, 590, 20
- van Dokkum et al. (2015) van Dokkum, P. G., Abraham, R., Merritt, A., Zhang, J., Geha, M., & Conroy, C., 2015, ApJ, 798, 45
- van Dokkum et al. (2016) van Dokkum, P., Abraham, R., Brodie, J., Conroy, C., Danieli, S., Merritt, A., Mowla, L., Romanowsky, A., & Zhang, J., 2016, ApJ, 828, L6
- van Dokkum et al. (2017) van Dokkum, P, Abraham, R., Romanowsky, A. J., Brodie, J., Conroy, C., Danieli, S., Lokhorst, D., Merritt, A., Mowla, L., & Zhang, J., 2017, ApJ, 844, L11
- Venhola et al. (2017) Venhola, A., Peletier, R., Laurikainen, E. et al. 2017, A&A, 608, 142
- Wyder et al. (2007) Wyder, T.K., Martin, D.C., Schiminovich, D., et al. 2007, ApJS, 173, 293
- Wyder et al. (2009) Wyder, Ted K., Martin, D. Christopher, Barlow., et al. 2009, ApJ, 696, 1834
- Yagi et al. (2016) Yagi, M., Koda, J., Komiyama, Y., & Yamanoi, H., 2016, ApJS, 225, 11
- Yozin & Bekki (2015) Yozin, C. & Bekki, K., 2015, MNRAS, 452, 93
- Zaritsky (2017) Zaritsky, D., 2017, MNRAS, 464, 110L
- Zaritsky et al. (2017) Zaritsky, D., Crnojević, D., & Sand, D.J., 2016, ApJ, 826, L9
- Zaritsky et al. (2018) Zaritsky D., Donnerstein, R., Dey, A., et al. 2018, ApJS, in press (arXiv:1811.04098)
- Zinger et al. (2018) Zinger, E., Dekel, A., Kravtsov, A. V. & Nagai, D., 2018, MNRAS, 475, 3654