Political Text Scaling Meets Computational Semantics
Abstract.
During the last fifteen years, automatic text scaling has become one of the key tools of the Text as Data community in political science. Prominent text scaling algorithms, however, rely on the assumption that latent positions can be captured just by leveraging the information about word frequencies in documents under study. We challenge this traditional view and present a new, semantically aware text scaling algorithm, SemScale, which combines recent developments in the area of computational linguistics with unsupervised graph-based clustering. We conduct an extensive quantitative analysis over a collection of speeches from the European Parliament in five different languages and from two different legislative terms, and show that a scaling approach relying on semantic document representations is often better at capturing known underlying political dimensions than the established frequency-based (i.e., symbolic) scaling method. We further validate our findings through a series of experiments focused on text preprocessing and feature selection, document representation, scaling of party manifestos, and a supervised extension of our algorithm. To catalyze further research on this new branch of text scaling methods, we release a Python implementation of SemScale with all included data sets and evaluation procedures.
1. Introduction
In recent years, automatic text scaling has become one of the key tools of the Text as Data community in political science. A variety of models have been developed for text scaling and have expanded the scope and focus of political text analyses, thus sustaining the growth of the Text as Data community (Laver et al., 2003; Slapin and Proksch, 2008; Lowe et al., 2011, inter alia). Text scaling approaches, such as the widely popular Wordscores (Laver et al., 2003) and Wordfish (Slapin and Proksch, 2008) algorithms, offer the possibility of identifying latent positions of political actors directly from textual evidence produced by those actors, such as party manifestos or political speeches. Such positions, depending on the type of data and the context of the study, have been interpreted as capturing political preferences such as a Right-Left scale of political ideology or different attitudes towards the European integration process (see, for instance, Laver et al. (2003) and Proksch and Slapin (2010)).
The Wordfish algorithm has since been applied in many text-analytic studies in political science. However, while text scaling methods have shown their potential to interpret textual content directly as a form of political data that can be analysed automatically, it is important to notice that they suffer from a major limitation. Namely, they treat textual data in a symbolic fashion, i.e., they represent documents simply as bags of words and assign them (explicitly or implicitly) position scores based on the words they contain. This means that the amount of lexical overlap between two texts directly determines the extent of their positional (dis)agreement. This gives rise to two types of errors in position estimation that methods based on lexical overlap are prone to:
-
(1)
Texts that convey similar meaning and express a similar political position but overlap only in very few words (e.g., “…homophobic outbursts should have no place in modern German society.” and “…anti-gay propaganda needs to be prevented.”) will end up being assigned very different position scores.
-
(2)
Texts that convey different or opposing political positions but have a significant word overlap (e.g., “Migrants are responsible for the increased crime rates.” vs. “Migrants are responsible for fewer crimes than domicile population.”) will end up being assigned similar position scores.
In other words, the unlimited expressiveness of natural language not only allows us to express similar political positions in very different ways and without any word overlap, but also to lexicalize very different political positions, based on similar words. In this work, we address the first issue and propose a scaling approach that remedies for the above-mentioned limitation of existing scaling methods by considering semantic representations of words in a text. In general, semantic word representations are computational representations (e.g., vectors) that have the following property: words with similar meaning (e.g., “homophobic” and “anti-gay”) have similar representations; conversely, words with a different meaning (e.g., “propaganda” and “cheese”) should have dissimilar computational representations.
Our semantic scaling algorithm, dubbed SemScale, is based on semantic representations of words instead of the words itself, thus leveraging recent developments in the area of computational linguistics where methods for inducing robust algebraic representations of word meaning have been proposed (Mikolov et al., 2013; Pennington et al., 2014; Bojanowski et al., 2017, inter alia). By relying on semantic rather than symbolic representations of text, SemScale can distinguish between words with different meaning and phrases with similar or related meaning (e.g., that “homophobic outbursts” has a similar meaning as “anti-gay propaganda”) and can make use of such semantic similarities to produce the scaling scores. Additionally, SemScale is a fully deterministic algorithm, which helps to address issues of consistency and reproducibility of results obtained via text mining approaches.
To assess the benefits of our new, unsupervised111Unsupervised refers to the fact that the algorithm does not require any text to be assigned position scores by human annotators. An algorithm that requires some texts to be annotated with position scores (assigned by human annotators), in order to be able to predict the scores for other texts, is, in contrast, a supervised algorithm. Wordscores (Laver et al., 2003) is an example of a supervised text scaling algorithm. approach to text scaling, we present an extensive empirical comparison of SemScale with the most widely adopted unsupervised text scaling algorithm, Wordfish, which, by operating merely on the basis of word frequencies, is unaware of word meaning. We assess the robustness of our results across different languages and time periods. To do so, we created a benchmarking data set for text scaling from the European Parliament website which comprises all speeches given by members of the European Parliament (MEP) in one of the following five languages, English, German, French, Italian, and Spanish, and their official translations to all of the other languages during the 5th and 6th legislative terms.
Our data set creation builds on the work of Proksch and Slapin (2010) and can be seen as an extension of the data set used in their work for testing the robustness of Wordfish, which covered only the speeches produced in or translated into English, German, and French and only during the 5th legislative term. Our work is thus able to shed more light on the robustness of different text scaling approaches and their sensitivity to different preprocessing methods, the choice of text representation and topical changes in the input data across time.
The main contribution of this study is a novel unsupervised algorithm for text scaling, based on semantic text representations. We demonstrate empirically that our method outperforms the widely adopted Wordfish algorithm in terms of identifying party positions on European integration. In order to stimulate further research and collaborations on semantically-aware text scaling, we release (as supplementary material to this work) (Nanni et al., 2019): (i) the multi-language data set employed in this study (in its original form and after each preprocessing step), (ii) all scaling results (i.e., individual party positions) obtained in our work and (iii) an offline Python implementation of SemScale (a command-line tool).222https://github.com/umanlp/SemScale
In addition to this, we provide a series of validation experiments addressing central points of the current debate on text scaling algorithms. First of all, an often criticised aspect of existing scaling methods is their inability to decipher which (if any) underlying policy dimension is captured by the produced position scores (cf. for instance, the critiques raised by Budge and Pennings (2007a, b) concerning Wordscores or the recommendation made by Proksch and Slapin (2010) with respect to filtering ideological from non-ideological statements prior to applying Wordfish). In addition to the above criticism, Denny and Spirling (2018) have recently questioned the robustness of Wordfish, demonstrating that it is highly sensitive to even small changes in the input text, such as the removal of punctuation or stop words, which should have no effect on the overall political message, i.e., position. To address this issue, we examine the robustness and stability of text scaling results for different lexical and semantic representations of the input texts. We are particularly interested in a better understanding of the extent to which a) known policy positions are captured by specific linguistic traits, such as specific parts of speech or named entities, in contrast to using the entire texts, and b) whether this is further emphasised by our newly proposed scaling approach, which also captures word meaning (and not just the frequency of words in different texts).
Our second validation experiment is aimed to shed light on the contribution of dense semantic text representations for SemScale, in comparison to other types of text representations. In particular, we conduct several comparisons where we employ our newly proposed scaling algorithm and substitute word-embeddings (which we use as textual representations) with: a) term frequency–inverse document frequency (TF-IDF) vectors and b) newly proposed party vectors (Rheault and Cochrane, 2019). The first comparison will unveil whether semantic vectors are in fact necessary to better determine positions or whether the core contribution of our approach comes from its new graph-based scaling algorithm. The second comparison will reveal whether directly inducing document-level representation vectors (Le and Mikolov, 2014) more precisely captures party positions, compared to representing each document as an aggregation of its word embeddings.
The third validation experiment compares the performance of SemScale and Wordfish on different types of texts, to determine the consistency of our results across different textual sources. For this we compare results obtained on speeches from the European Parliament with the ones obtained on party manifestos from five different countries. We study scaling performance (i) when positioning only manifestos from the same elections and (ii) when positioning manifestos from multiple elections on a single scale.
Our next validation experiment investigates the impact of different graph-based clustering algorithms on the results and reports scaling scores for two different, well-known algorithms (i.e., the harmonic function label propagation algorithm (HFLP) and the PageRank algorithm).
We then focus on the core ingredient of SemScale, the dense semantic representations, and explore whether we can improve Wordfish by adding semantic information on word similarity to the input. For that, instead of providing Wordfish with a document frequency matrix based on word frequencies, we compute the frequency matrix by grouping similar words together, based on the cosine similarity of their distributional semantic representations, and counting frequencies of word groups in the documents. This experiment is meant to disentangle the impact of the semantic representations from that of the algorithm used for text scaling that we studied in the previous experiment.
In our final validation experiment, we compare SemScale with another widely used scaling algorithm, Wordscores, a supervised scaling approach that positions so-called virgin texts (i.e., texts of unknown positions) on the basis of known positions of given reference texts. To allow for a fair comparison, we extend SemScale to take two ”pivot texts” as supervised inputs, thereby determining the extremes of the scale. While SemScale is primarily designed as an unsupervised algorithm to operate in low-resource settings in which we do not expect to find human annotations of position scores, here we investigate its performance and potential limitations in (weakly) supervised settings where a small number of texts with assigned positions actually exist. The structure of the article is as follows. In Section 2 (Previous Work on Political Text Scaling), we discuss related work on political text scaling and describe the well known Wordfish (Slapin and Proksch, 2008) and Wordscores (Laver et al., 2003) algorithms. Section 3 (SemScale – A Semantic Model for Political Text Scaling) provides a detailed description of SemScale, our newly proposed scaling method that exploits semantic representations of words and texts. Section 4 (Quantitative Evaluation) presents the data and setup used in our experiments and reports our results. Additional validation experiments are presented in Section 5 (Validation Experiments) where we investigate the impact of different types of features and text representations on the results and test the robustness of different scaling algorithms in various settings. We conclude by discussing our findings and the implications they might have for fostering further research on semantically-aware analyses of political texts.
2. Previous Work on Political Text Scaling
Positioning political actors along predefined dimensions in ideological spaces has been an important foundation of research in the area of political science. One of the most famous examples is the Chapel Hill Expert Survey that relies on expert ratings for estimating party positions on topics like European integration, political ideology and policy issues for national parties in a variety of European countries (Polk et al., 2017; Bakker et al., 2020). Another example is the Global Party Survey (GPS) (Norris, 2020), which also relies on expert surveys in order to position parties on an ideological scale and to obtain measures of populism for parties across the world. A related effort is the Global Populism Database (Hawkins et al., 2019) which positions more than 200 international political leaders according to their degree of latent populist content, based on the speeches they delivered. Those speeches have been subject to holistic grading by human experts, in order to measure latent aspects of populism in the texts.
Those are only a few examples illustrating the importance of spatial models of politics where political attitudes and preferences such as Left-Right ideology or the degree of populism are conceptualised as positions in latent space. However, obtaining information on political ideology or other variables of interest for subjects across the world and over a long period of time is extremely costly in terms of time and manpower. Therefore, many recent studies have been focused on inferring latent political positions directly from the texts produced by political actors (Poole and Rosenthal, 1985; Martin and Quinn, 2002; Proksch and Slapin, 2010; Hjorth et al., 2015; Laver and Benoit, 2018; Egerod and Klemmensen, 2020a), to bypass time-consuming data acquisition and manual coding. Most of these works on political text scaling can be divided into two branches, supervised and unsupervised approaches to text scaling. Below we present the two most prominent algorithms for each branch and discuss their merits and drawbacks.
2.1. Supervised approaches to political text scaling: Wordscores
One of the most widely adopted supervised text scaling algorithms is Wordscores. Introduced by Laver et al. (2003), Wordscores is built around the assumption that word frequency information from “reference” texts, for which the position scores for the dimension of interest have been provided by human annotators, can be used to make predictions for new texts for which the positions are unknown. It is important to note that the notion of supervision used here is different from supervised machine learning which relies on a large number of training instances in order to learn generalisations for new data, while Wordscores requires only a few data points to define the dimension of interest.
Let us assume that we have a number of reference texts with known positions on the scaling dimension of interest and a data set with new texts that we want to position. The first step consists of iterating over each word in the reference texts and determining the position of , based on its frequency in the reference texts. In the second step, we now iterate over the words in the new, unlabelled texts , ignoring all words that we haven’t seen in the reference texts. We can then compare the positions of the words in to their positions in and use this information to assign a score to the new documents. The wordscores for each word on dimension are computed as follows:
where is the probability of word occurring in document and is the known position of the document on dimension . Once we have computed the wordscores for each word in the reference texts , we can use them to infer the position of the new, unknown texts by comparing the wordscores to the word frequencies in the new texts:
where is the frequency of each word in the new, unlabelled texts . As pointed out by Egerod and Klemmsen (Egerod and Klemmensen, 2020a), Wordscores is based on a number of unrealistic assumptions, including the assumption that each word in the texts is equally informative and that the words in the new, unseen documents come from the same distribution as the ones in the reference texts. While these assumptions are not met in real life, they also point out that they can at least help to mitigate bias when used to guide the selection of the reference texts. Since its first introduction, a number of extensions to Wordscores have been presented that address some of these issues (Lowe, 2008; Martin and Vanberg, 2008; Perry and Benoit, 2017) (see (Egerod and Klemmensen, 2020a) for an overview).
2.2. Unsupervised approaches to political text scaling: Wordfish
The most known unsupervised algorithm for political text scaling is Wordfish (Slapin and Proksch, 2008; Proksch and Slapin, 2010). One crucial difference between the unsupervised Wordfish and Wordscores is that, while for Wordscores the scaling dimension is given by means of a small number of reference texts and their scores on the respective dimension, for Wordfish the dimension of interest is unknown and has to be inferred. While this avoids the problem of inserting bias, for example by means of poorly chosen reference texts, it also makes the learning problem much harder.
Wordfish assumes that the words in the documents follow a Poisson distribution. More specifically, Wordfish is a variant of a Poisson ideal point model where, given a collection of documents, the -th vocabulary word’s frequency in the -th document, s is drawn from a Poisson distribution with rate , which is modeled considering the document length (, the token-frequency (), the level to which a token identifies the direction of the underlying ideological space (), and the underlying position of the document ():
2.3. Strengths and weaknesses
In many cases the more explorative unsupervised approach of learning the scaling dimension jointly with the document positions might seem attractive, as this might uncover latent dimensions hidden in the data, while the supervised approach is restricted to use the information that we predefine as the dimension of interest. However, not providing the model with enough guidance might also cause the model to pick up on irrelevant aspects such as topic distinctions (Lowe and Benoit, 2013) instead of ideological positions. Egerod and Klemmsen (Egerod and Klemmensen, 2020a) therefore stress the point that automated political text scaling should only be used to support human experts’ analyses and not replace them (also see (Grimmer and Stewart, 2013) for a critical survey of automated content analysis methods for political text analysis).
A major strength of models relying on word frequencies, such as Wordscores and Wordfish, is that they are directly applicable in any language precisely because they do not explicitly model semantics but adopt word frequency rates as a (often successful) proxy to document semantics. This, however, also comes with a major drawback, as already pointed out in Section 1. The symbolic nature of the representations used in both models, Wordscores and Wordfish, consider semantically similar words such as company and firm as equally distinct as very dissimilar words like company and sunflower, and thus rely on a substantial overlap in vocabulary between texts, precisely because the models are not able to generalize and identify similar meaning across word forms. This is also the motivation for our novel approach to text scaling, described in the next section, which positions texts based on the semantics of the words in the documents, instead of the words itself.
3. SemScale – a Semantic Model for Political Text Scaling
Existing scaling algorithms like Wordfish and Wordscores model words as discrete symbols and consider only their (weighted) frequency; as opposed to this, modern research in computational linguistics primarily represents words as numeric vectors sampled from a continuous multi-dimensional vector space. The research area of distributional semantics, in particular, builds upon the assumption that the meaning of a word can be derived by looking at the contexts in which it is used or, as Firth (1957) puts it, that “a word is characterised by the company it keeps”. For instance, if we consider the sentence “The members of +Europa voted against the proposal”, even without knowing what +Europa is, we can infer from the context that it is probably a political entity.
The ability to precisely capture the meaning of words by representing them as points in a multi-dimensional semantic vector space, i.e., by representing words with so-called word embeddings (Mikolov et al., 2013), is arguably one of the most relevant achievements of computational linguistics in the last few decades. Among other things, word embeddings can be used to detect particular semantic relations that hold between words (e.g., hypernymy, synonymy, antonymy, or meronymy) (Glavaš and Ponzetto, 2017; Glavaš and Vulić, 2018) or between entities (e.g., “being capital of”, “being president of”) (Nickel et al., 2016; Joulin et al., 2017).
In this work, we examine the potential of distributional semantics for obtaining vector representations of texts for unsupervised political text scaling.333Word embeddings have already been studied and employed in political science analyses, e.g., in Gurciullo and Mikhaylov (2017), Rodriguez and Spirling and Rheault and Cochrane (2019). In this work, we test their potential for capturing political positions in a latent space. As Wordfish cannot handle distributional representations of texts but requires symbolic representations (i.e., words) as input, we developed SemScale, a new algorithm for political text scaling, based on distributional semantic representations and graph-based clustering, that we now describe in more detail.
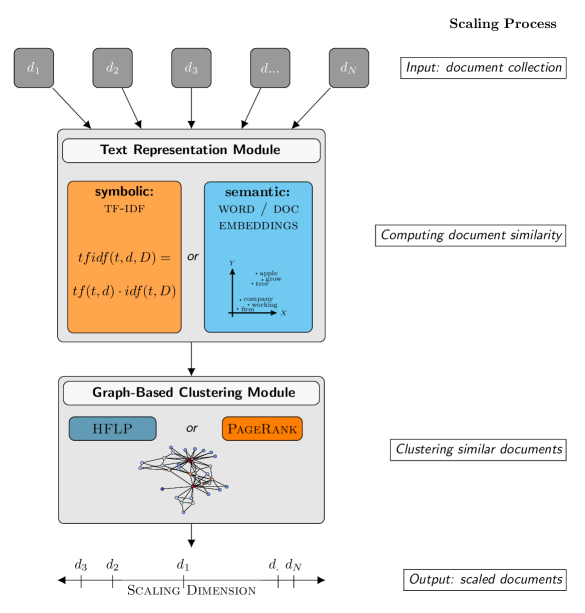
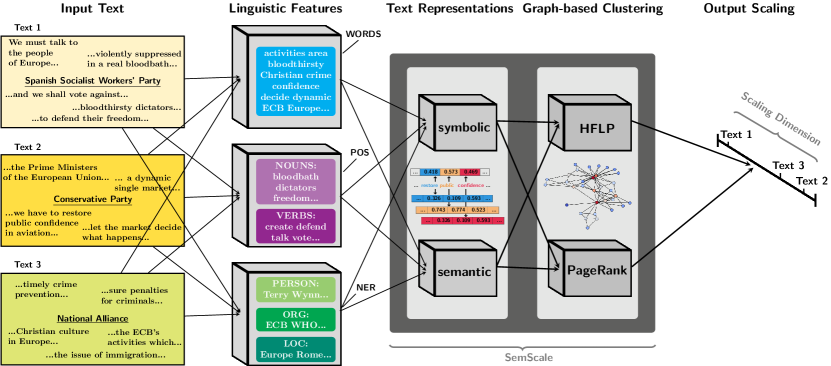
SemScale has two major components, a) the text representation module, and b) the graph-based text scaling algorithm (see Figure 1).444An earlier version of the algorithm, with further technical details and an extension for cross-lingual text scaling, is described in Glavaš et al. (2017). This means that, unlike Wordfish, our core graph-based scaling algorithm is detached from the document representation and can work with both, symbolic and distributional semantic text representations (as demonstrated in Section 5, Validation Experiments). This makes the model highly flexible and allows us to compute the similarity between two documents as the similarity between their symbolic term-frequency–index-document-frequency (tf-idf, cf. the definition in the next section) vectors, but also to compute the similarity between two texts based on dense semantic representations, such as word embedding vectors.
3.1. Text representation
We now describe the default version of SemScale, in which we represent texts as averages of word embeddings (Bojanowski et al., 2017; Glavaš et al., 2018). In Section Validation Experiments, we demonstrate how the SemScale’s graph-based scaling algorithm can be coupled with (2) traditional symbolic tf-idf text representations (Salton and
Buckley, 1988) and (2) document embedding representations (Le and Mikolov, 2014).
We start by representing each document under study by its respective distributional semantic vector, built by aggregating the embeddings of the words in the document as follows: Let be the bag of words of a political text, i.e., the set of all words that appear in that text, and let be the word embedding of some word . We then compute the embedding vector of the whole text, , by computing the weighted average of the embeddings of all words in :
stands for the term frequency-inverse document frequency score for word and document and is used as the weight with which we multiply the embedding vector of the word . The tf-idf score of the word for the text is the product of two scores. The first one is the term frequency score (TF) which captures how often the word appears in the document and the second term is the inverse document frequency score (IDF), which is inversely proportional to the number of other texts in the collection that contain the word .555The intuition behind the tf-idf weighting scheme is that the word contributes more to the overall meaning of the text the more frequently it appears in the document (TF component) and the less common it is, i.e., the lower the number of other texts that contain that same word is (IDF component). Precisely, we compute the TF score for a word w and text document T as follows:
where is the raw frequency of occurrence of in , normalized by the maximal frequency with which any word () appears in . The IDF is computed instead for each word as follows:
where is the collection of textual documents (and is the number of documents in the collection) and is the subset of the documents in the collection that contain the word .
Then, let , , , be the collection of political texts which we want to scale, with their corresponding distributional semantic vectors , , , , computed from word embeddings as described above. We can then measure the semantic similarity between any two texts and by comparing their respective embeddings, i.e., by comparing with . Following common practice with respect to vector-space text representations, we measure the semantic similarity between two texts and as the cosine of the angle that their respective embedding vectors enclose:
where is the dot product between vectors and and denotes the Euclidean norm of the vector . By computing the above similarity for every possible pair of texts in our collection,666In a collection of texts there are different text pairs, i.e., we need to compute similarity scores. we give rise to a fully-connected weighted graph777A fully-connected weighted graph is a graph in which there is an edge between every two vertices and there is a numeric weight assigned to each edge. which we call the similarity graph. The vertices in the similarity graph denote individual texts in our text collection (i.e., vertex corresponds to the text ), whereas the weights of the edges denote how semantically similar the two texts are (i.e., the weight of the edge between vertices and is ). Again, note that, while in the default variant of SemScale we use the cosine similarity between aggregated embedding vectors and , one can set to be any other function that measures some type of similarity between texts in order to induce the similarity graph. We empirically investigate two other similarity functions in Section Validation Experiments. Our graph-based scaling algorithm that we describe next is completely agnostic to how the similarity scores (i.e., weights of the edges of the similarity graph) have been computed.
Graph-based scaling. The graph-based scaling algorithm aims to assign a position score to each vertex in the graph, by taking into account the weights of the edges that connect that vertex with all other vertices, that is, by considering the semantic similarity of the corresponding text with all other texts in the text collection . We start from an intuitive assumption that a pair of least similar (i.e., most dissimilar) texts corresponds to extreme positions in the position spectrum. In other words, among all possible pairs of texts (, ), we identify those two that have the lowest mutual semantic similarity (i.e., lowest ) and assume that one of them is on one end of the position spectrum, whereas the other is on the opposite end; positions of all other texts are assumed to lay somewhere in between these two extremes. We name these two most dissimilar texts pivot texts and assign an initial position score of to one of them and to the other. We next propagate the position scores assigned to the pivot texts to all the other text (which are still without a position score), using the structure and the weights of the similarity graph as the backbone for score propagation. Namely, we employ so-called harmonic function label propagation (HFLP) algorithm, proposed by Zhu et al. (2003) – a commonly used algorithm for graph-based semi-supervised learning – to propagate position scores from the two pivot texts to other, non-pivot texts. Let be our similarity graph and its weighted adjacency matrix. Let be the diagonal matrix with weighted degrees of graph’s vertices as diagonal elements, i.e., , where is the weight of the edge between vertices and . Then is the unnormalized Laplacian of the graph , a matrix representation of the graph which can be used to detect many useful properties of . Assuming that the labeled vertices – the vertices to which we have assigned a position score, i.e., the two vertices corresponding to pivot texts – are ordered before the unlabeled ones (vertices corresponding to all other texts in our collection), the Laplacian matrix of the similarity graph can be partitioned as follows:
The vector containing the scores of the unlabeled vertices (which are vertices corresponding to all but the two pivot texts), capturing the position scores of the non-pivot texts, is then computed as:
where is the vector of scores of labeled vertices, in our case the vector with the scores of pivot vertices, . This way, by propagating the position scores from pivot vertices to all other vertices through exploitation of the structure of the similarity graph , we obtain the position scores for all texts in our text collection.
As Wordfish and SemScale are both unsupervised scaling algorithms, we will first focus on a comparison between the two algorithms (Section 4, Quantitative Evaluation). It is worth mentioning that, same as Wordfish, SemScale produces a spectrum of position scores but cannot tell the orientation of the scale. For example, given the left-to-right ideological scaling, we do not know whether the leftmost point on the scale produced by SemScale corresponds to the political party which is most to the left in the political spectrum or to the political party which is most to the right.
SemScale is a fully deterministic algorithm, assuming a fixed collection of pretrained word embeddings. In other words, when using the same pretrained word embeddings, SemScale will always produce the same output (i.e., same positions for texts) given the same input (the same collection of texts). In contrast, various Wordfish implementations all obtain model parameters via stochastic optimisation methods, which may lead to somewhat different results being produced by multiple runs on the same data input.
In summary, our new scaling algorithm provides a flexible architecture which allows us to plug in different types of text representations and to test their impact on political text scaling. Most importantly, in addition to symbolic representations the model can also handle dense semantic representations, thus addressing one of the major shortcomings of previous scaling models. We hypothesize that this will result in better results for text scaling, which we will investigate in the next section.
4. Quantitative Evaluation
We now present our new benchmarking data set for text scaling that extends the work of Proksch and Slapin (2010) by incorporating additional languages and data from another legislative term from the European Parliament (EP). Then we describe our evaluation setup and report the main results of our experiments, comparing the performance of Wordfish and SemScale when applied to scale the parties based on their members’ speeches in the European Parliament.
4.1. A new benchmarking set for political text scaling: European Parliament Speeches
In our work, we follow the experimental design adopted by Proksch and Slapin (2010) when testing the Wordfish algorithm in different languages (English, French and German). As in their work, we collect speeches from the European Parliament website. We decided to extend the resource and the experimental setting used in this previous work, to test the validity of our findings across more languages (adding Italian and Spanish) and legislative terms (5th and 6th). To do so, we first crawled all individual speeches of all European Parliament representatives regarding the periods under study from the official website of the European Parliament888http://www.europarl.europa.eu which cover 10 years of European politics (1999-2009). These are the only two legislative terms where the transcripts of the speeches are available online and the majority of them have been consistently translated.999For more details, see the European Parliament decision of 20 November 2012 on amendment of Rule 181 of Parliament’s Rules of Procedure concerning verbatim reports of proceedings and Rule 182 concerning the audiovisual record of proceedings.
Unlike Proksch and Slapin (2010), who considered all speeches from all MEPs in the English, French and German translations, we only keep speeches that have been originally delivered in one of the five languages under study and translated to all of the remaining four languages. I.e., we omit speeches delivered in some of the five languages that were not manually translated to each of the other four languages. This allows us to build maximally comparable corpora for all five languages, thus avoiding the issue of not always having a translation available for each language.101010Note that this procedure of building maximally comparable corpora in all languages under study leads, however, to a data set which is different from the one used by Proksch and Slapin (2010) and the one used in our preliminary work (Glavaš et al., 2017), where we consider all speeches available in any of the five languages. Next, as done by Proksch and Slapin, we concatenate all speeches of all representatives of the same national party into a single party-level document for each language. Our data set (see statistics in Table 1), which we share together with this paper, represents a new resource for the evaluation of political text scaling algorithms in order to precisely examine their robustness across contexts and languages. However, it is also important to note that the difference in size between the two legislative corpora may have an impact on the results.
| Term | # Parties | Min. Length | Mean Length | Max. Length |
|---|---|---|---|---|
| 5th (1999–2004) | 31 | 12K | 160k | 543k |
| 6th (2004–2009) | 26 | 11k | 106k | 319k |
4.2. Evaluation Setup for European Parliament Speeches
Each unsupervised scaling technique assumes the existence of an underlying position/policy dimension across the documents under study. When processing transcripts of speeches from the European Parliament, Proksch and Slapin (2010) have shown that the dimension induced by Wordfish from EP speeches correlates better with parties’ positions towards deeper EU integration than with their traditional Right-Left ideological positions. In this work, we replicate their analysis in order to validate their findings for Wordfish and test whether the same holds for semantically informed scaling with SemScale.
We follow Proksch and
Slapin (2010) and consider as ground truth the positions of the parties under study derived from the Chapel Hill expert survey (years 2002 and 2006, respectively for the 5th and 6th legislative term)111111https://www.chesdata.eu/our-surveys/ regarding the European integration process and a broad Right-Left ideology.
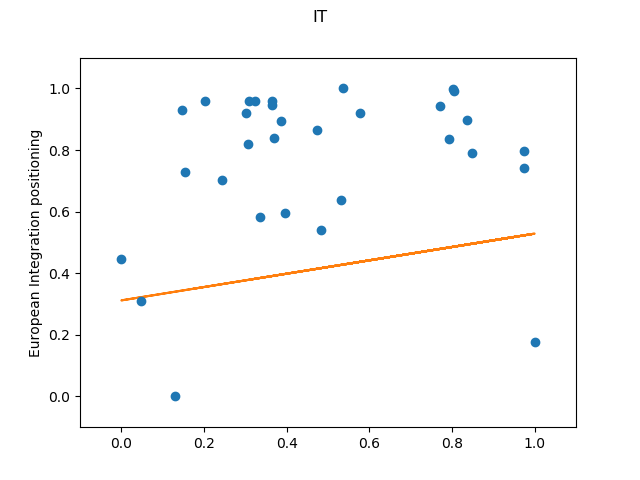
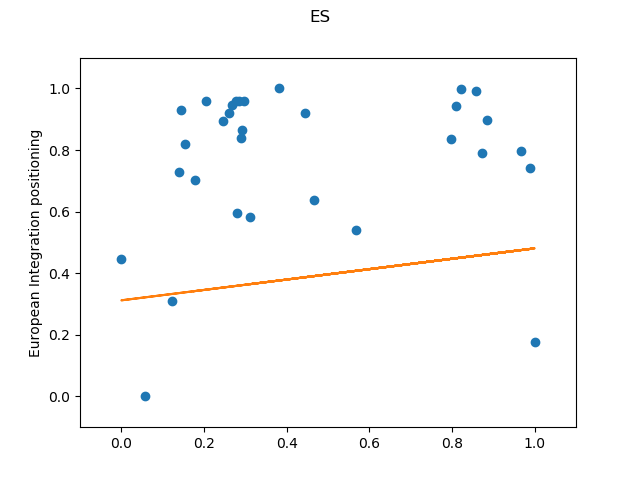
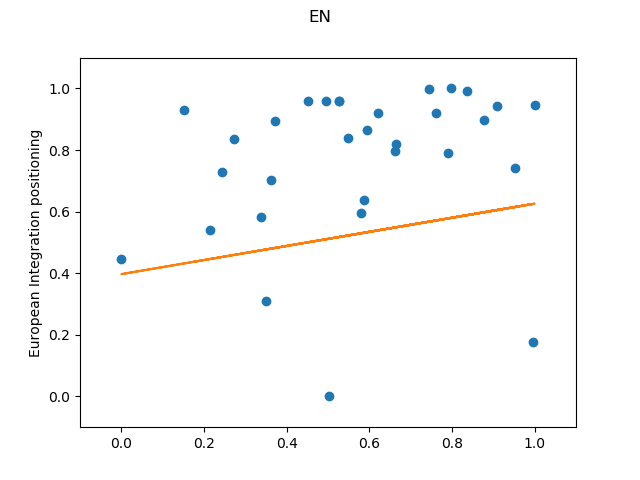
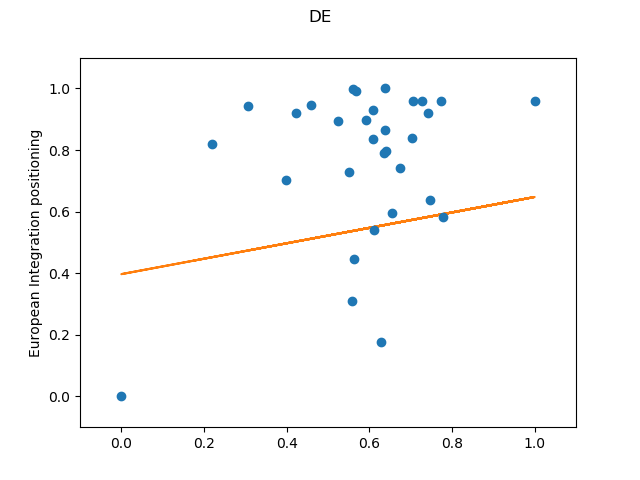
We assess the quality of the scaling output by looking at the correlation of the results with positions assigned by human experts. We compute the pairwise accuracy (PA), i.e., the percentage of pairs with parties in the same order, as well as Pearson () and Spearman () correlation. While PA and Spearman correlation estimate the correctness of the ranking order, Pearson correlation also captures the extent to which the ground truth distances between party positions are correctly captured by the automatically induced scale. In the result tables, we report the average of each measure across the five languages under study. This will highlight how much the scaling results correlate with known positions of parties; a breakdown of the results for each language is available in the online appendix. Additionally, we present visual representations of the robustness of the inferred party positions across different languages.
Parameter settings. In our experiments, we use the Quanteda implementation of Wordfish with default parameters.121212For details, please refer to https://quanteda.io/reference/textmodel_wordfish.html. When computing the document frequency matrix on the European Parliament data set, we empirically set a minimum document frequency of 5 on the basis of empirical tests and following findings and standard practices from previous work (Nanni et al., 2018; Bruinsma and Gemenis, 2019; Egerod and Klemmensen, 2020b). For the experiments on the Manifestos in Section 5.3, we use a smaller threshold of , motivated by the smaller corpus size of the data. The choice to empirically set a document frequency threshold for dimensionality reduction was motivated by (Yang and Pedersen, 1997), who showed that this approach has the following advantages: the technique scales well to large datasets and shows a high correlation with information gain and chi-square statistics.
For SemScale, different options can impact results: (i) the type of preprocessing applied to the input documents (i.e., tokenization, lemmatization, filtering of input according to linguistic features, cf. Section 5.1); (ii) whether or not the input has been filtered by removing stopwords; (iii) the type of embeddings used for computing the similarity between documents (please note that for optimal results, the preprocessing of the input documents should match the preprocessing applied to the corpus used for computing the word embeddings); (iv) the type of similarity function used for computing document similarities (as described above, we use the cosine function); (v) the graph-based clustering algorithm (we use the HFLP algorithm in all experiments and present a comparison with PageRank in Section 5.4).
As Denny and Spirling (2018) have recently highlighted, virtually any type of text preprocessing has a major impact on the scaling output (i.e., party positions) produced by Wordfish. For this reason, we have decided to first evaluate both Wordfish and SemScale on the original texts, with standard preprocessing (i.e., the removal of stopwords and punctuation), but applying neither stemming nor lemmatization to the input texts. While this setting might not be optimal for either of the algorithms, it allows us to compare the capabilities of the two scaling methods in isolation, avoiding the risk of incorrectly attributing performance differences that are due to some text preprocessing step to either of the algorithms. Consequently, in all other validation experiments in Section 5.1, in which we retain only some subset of the original texts (e.g., only nouns or only named entities), we explicitly make sure that both scaling algorithms receive exactly the same textual input.
4.3. Results on European Parliament Speeches
| 5th Leg | 6th Leg | |||||
|---|---|---|---|---|---|---|
| PA | PA | |||||
| Wordfish | 0.54 | 0.15 | 0.12 | 0.53 | 0.16 | 0.09 |
| (0.01) | (0.04) | (0.03) | (0.03) | (0.06) | (0.09) | |
| SemScale | 0.60 | 0.32 | 0.27 | 0.59 | 0.29 | 0.27 |
| (0.02) | (0.03) | (0.05) | (0.02) | (0.03) | (0.06) | |
| 5th Leg | 6th Leg | |||||
|---|---|---|---|---|---|---|
| PA | PA | |||||
| Wordfish | 0.54 | 0.04 | 0.11 | 0.50 | 0.07 | -0.04 |
| (0.0) | (0.01) | (0.01) | (0.01) | (0.03) | (0.03) | |
| SemScale | 0.52 | 0.22 | 0.05 | 0.54 | 0.11 | 0.10 |
| (0.04) | (0.04) | (0.12) | (0.01) | (0.05) | (0.04) | |
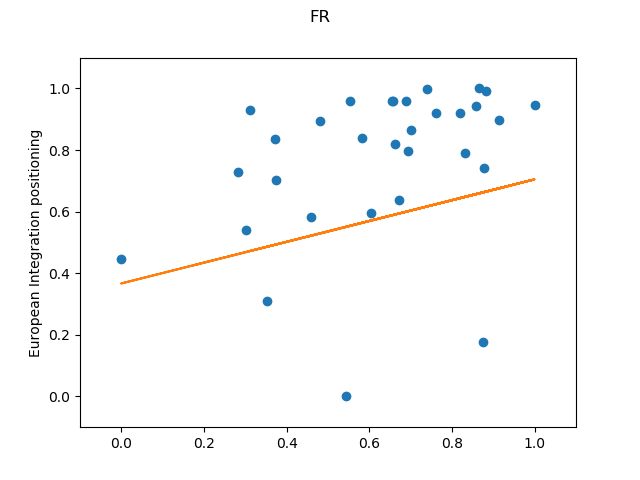
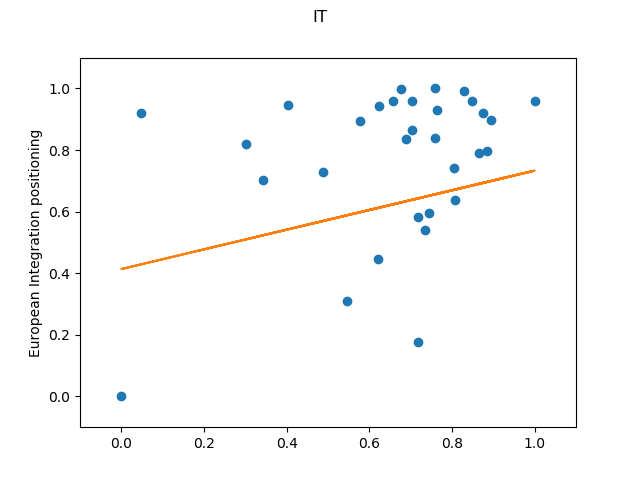
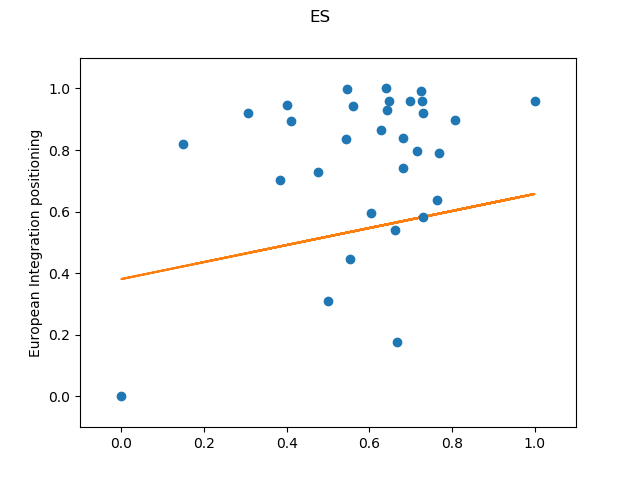
In Table 2, we present the averaged quality of the correlation between the produced scalings and the positions of the parties on the issue of European integration, according to the Chapel Hill Expert Survey, for the two legislative terms under study. The numbers clearly show that the positions induced by SemScale have a significantly higher correlation with ground truth (i.e., Chapel Hill) party positions on EU integration than the positions induced by Wordfish. The results, consistent across parliaments and languages, also confirm the findings of Proksch and Slapin (2010), namely that scalings produced by Wordfish employing the entire text correlate better with the parties’ positions concerning European integration than the ideological Right-Left dimension (cf. Table 3 for comparison). Moreover, they highlight that this effect is even more prominent when adopting SemScale, a semantics-aware text scaling algorithm. These findings are further emphasised by Figures 2 and 3, which reveal the high level of consistency of SemScale across languages. This emphasises the complexity of evaluating the output of text scaling algorithms and the importance of always considering more than a single (ideological) dimension when interpreting their output.
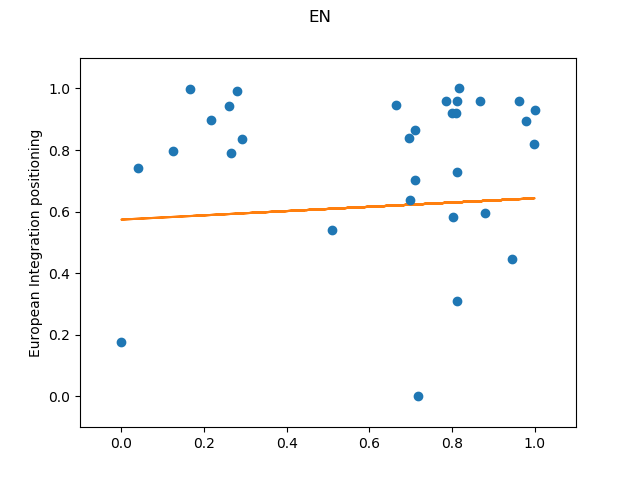
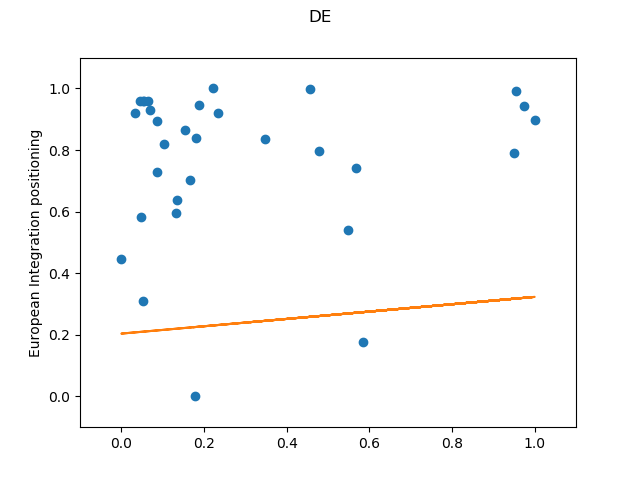
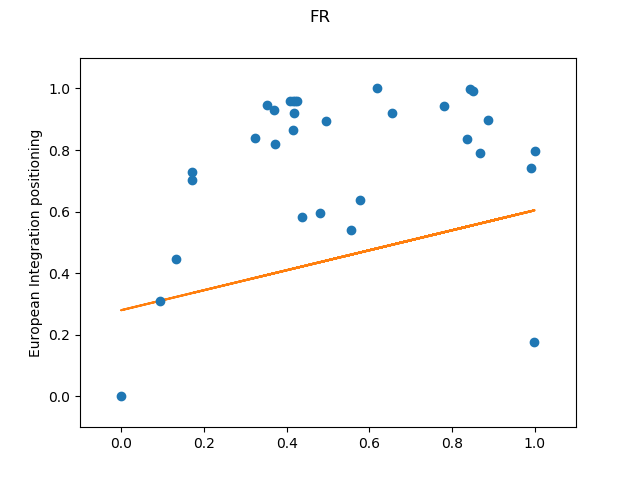
In the next section, we expand on this and present a number of validation experiments where we explore the robustness of the scaling algorithms and systematically evaluate the impact of the different components of our model, i.e., the text representation module and the graph-based clustering algorithm.
5. Validation experiments
In the last section, we have shown that SemScale outperforms Wordfish on scaling party positions on European integration across five languages and two legislative terms. To further validate the effectiveness of SemScale and to better understand its potential and limitations, we now present a series of experiments concerning the impact of text preprocessing (5.1, Preprocessing: The Impact of Linguistic Features) and text representations (5.2, Different Text Representations: tf-idf and Party2Vec) on scaling performance. We test the robustness of SemScale by applying it to a different type of political text (5.3, Scaling Manifestos) and assess the influence of different graph clustering algorithms on scaling results (5.4, Graph Clustering Algorithms: HFLP versus PageRank). In our final validation experiments, we extend Wordfish with word embeddings to test whether this can further improve results for text scaling (5.5, Wordfish with Word Embeddings) and adapt our scaling algorithm to a supervised setup in which ground truth positions are available for some of the texts (5.6, Weakly Supervised Scaling).
5.1. Preprocessing: The Impact of Linguistic Features
In previous sections, we have reported on criticism raised by Denny and Spirling (2018) who investigated the impact of preprocessing on text scaling and showed that the widely-used scaling algorithm Wordfish (Slapin and Proksch, 2008) is not very robust: even small and semantically insignificant text preprocessing steps may have a profound impact on the scaling results. Extending their work, we examine the impact of parts of speech (POS) tagging and named entity recognition on the obtained scaling and its correlation with EU integration positioning. In other words, we quantify how stable different scaling algorithms are with respect to different preprocessing and content selection steps.
We are particularly interested in understanding whether the positions produced by scaling algorithms show a higher correlation with specific subsets of linguistic traits and whether this could point to text preprocessing steps which facilitate scaling and lead to better predictions of party positions.
To do so, we filter the scaling input and only keep words of a specific part of speech or named entity type, and then scale the input documents, based on the selected linguistic features (see Figure 4).
Parts of Speech. The computational linguistics community has put a lot of effort into developing systems capable of identifying the different parts of speech for words in text (nouns, verbs, adjectives, etc.). While older generations of POS tagging models have been based on traditional sequence tagging algorithms such as Hidden Markov Models (which assume that a sequence of words is generated by a Markov process where the parts of speech are latent states that need to be uncovered) or Conditional Random Fields (Lafferty
et al., 2001), state-of-the-art POS tagging models are commonly built upon deep neural networks.131313For instance, bidirectional recurrent neural networks or residual convolutional networks, cf. Goodfellow
et al. (2016) for a comprehensive overview of deep learning architectures.
In order to test the effects that different parts of speech have on the scaling procedure, we have used a POS tagger to filter for nouns and verbs in the input texts, for each of the five languages under consideration.
Lemmas. A common practice in computational text analysis is the normalisation of the texts under study, to reduce the overall vocabulary via morphological normalisation. During this process, all different morpho-syntactic forms of the same word (e.g., “house”, “houses”, “housing”) are reduced to some common form (e.g., “house” or “hous”). The most common types of morphological normalization are (1) stemming (e.g. Porter, 1980), which strips the suffixes from the word, based on a series of heuristics and predefined rules, and (2) lemmatization, which reduces different word forms to their canonical form (e.g., cases of nouns to singular nominative or different conjugations of a verb to its infinitive form).
Stemming has already been shown to have a negative impact on automatic text scaling (Greene et al., 2016; Denny and Spirling, 2018) as it may add lexical ambiguity (e.g., “party” may be stemmed to “part”, which holds a different meaning). Lemmatization, instead, normalises inflected word forms to their canonical forms called lemmas (e.g., “parties” to “party” or “voted” to “vote”). Lemmatization is often performed by a look-up in a dictionary of inflected forms, using the inflected word and its part of speech as look-up keys (e.g., the POS information helps to transform “meeting” to “meet” when used as a verb and leave it unchanged when used as a noun). When using lemmas instead of the words themselves, we obtain lemma embeddings by first (1) lemmatizing all European Parliament speeches (i.e., we create the lemmatised in-domain text corpus) and then (2) running a word embedding algorithm on the previously lemmatised corpus.
In our experiments, lemmatization does not seem to have a significant effect on scaling accuracy for both, WordFish and SemScale. We obtained similar correlations with expert positions when using lemmatised and non-lemmatised texts. Thus, in the paper we only report results for non-lemmatised texts.
However, a major advantage of lemmatization is that it helps to reduce the overall size of the word vocabulary and consequently speeds up the automatic scaling process.
Named Entities. When dealing with large amounts of text documents, a useful strategy for finding relevant pieces of information is to highlight all named entities that are mentioned in the text. Similar to POS tagging, named entity recognition (NER) is a sequence labelling task where, for each word in the text, a label is created that signals whether this word is part of a named entity (e.g., of type PERSON, ORGANISATION, or LOCATION).
As for POS tagging, previous generations of named entity recognition systems were also based on machine learning models such as the Hidden Markov Model and Conditional Random Fields, whereas the most recent NER approaches use deep neural networks (see, for instance, Ganea and Hofmann, 2017) or hybrid systems that combine neural network with Conditional Random Fields (Lample et al., 2016; Ma and Hovy, 2016). In any case, a large corpus of text manually annotated with named entities is required to train a reliable NER model.
Tools Adopted. One of the main goals of our empirical methodology was to use computational approaches that are as comparable as possible across different languages; for this reason, whenever possible, we adopted the same infrastructure, models, and tools for linguistic analysis for each of the five languages. For POS tagging, lemmatization and named entity recognition we employed spaCy,141414https://spacy.io/ a Python library that offers robust pre-trained models for all five languages under study.151515We initially considered using Stanford CoreNLP by Manning et al. (2014), a more widely adopted natural language toolkit. However, we found models for all required tasks – POS-tagging, lemmatization, and NER – only for English, Spanish, and German. We computed word embeddings on the European parliament speeches and political manifestos, using the FastText word embedding tool (Bojanowski et al., 2017).161616We used the Gensim implementation of FastText (https://radimrehurek.com/gensim_3.8.3/) with the skipgram algorithm, a dimension size of 300, a window size of five and a minimum token count of five for the in-domain embeddings. We make all the resources and preprocessed data sets available for further research in our online supplementary materials.
Before we report our results, we would like to remark that while the above-mentioned tools are widely adopted by both the academic and industrial computational linguistics communities, their performance, especially, for more complex tasks (Named Entity Recognition) is far from optimal.171717As also documented by spaCy itself: https://spacy.io/usage/facts-figures Nevertheless, with the aim of opening the discussion and motivating further research efforts on using semantic enrichment of text for political text scaling, we have employed these models with the awareness of their current limitations.
By demonstrating that even with their current, sub-ideal performance these models can significantly contribute to the scaling quality, we believe that with future advances in computational linguistics, we will also witness further improvements in political text scaling.
| 5th Leg | 6th Leg | ||||||
|---|---|---|---|---|---|---|---|
| PA | PA | ||||||
| Wordfish | noun | 0.54 | 0.14 | 0.11 | 0.57 | 0.24 | 0.18 |
| SemScale | noun | 0.55 | 0.23 | 0.14 | 0.58 | 0.25 | 0.22 |
| Wordfish | verb | 0.55 | 0.18 | 0.15 | 0.58 | 0.28 | 0.25 |
| SemScale | verb | 0.65 | 0.36 | 0.46 | 0.55 | 0.22 | 0.15 |
| 5th Leg | 6th Leg | ||||||
|---|---|---|---|---|---|---|---|
| PA | PA | ||||||
| Wordfish | person | 0.55 | 0.11 | 0.12 | 0.63 | 0.42 | 0.37 |
| SemScale | person | 0.62 | 0.38 | 0.31 | 0.66 | 0.49 | 0.46 |
| Wordfish | org | 0.58 | 0.28 | 0.22 | 0.60 | 0.35 | 0.29 |
| SemScale | org | 0.58 | 0.18 | 0.21 | 0.61 | 0.31 | 0.31 |
Nouns and verbs. In Table 4, we show how positions produced by Wordfish and SemScale correlate with ground truth positions on EU integration when we use only the nouns or only the verbs from the input texts, respectively.
For SemScale, noun-only results decrease as compared to scaling on the entire text, but are still higher than the ones for Wordfish. Scaling on verbs only increases results for the 5th legislative term but not for the 6th for SemScale, while for Wordfish the results are in the same range or higher.
Named Entities. We next move to the analysis of scaling results produced when the input to the scaling algorithms consists of names only (i.e., mentions of named entities such as persons, organisations, locations etc.).
When scaling documents based only on the person names in the texts, SemScale produces positions that show a high correlation with party positions on EU integration (Table 5).
In contrast, scaling based on mentions of organisations (e.g., Euratom, Parmalat, PKK) produces results that are less consistent (see Table 5).
We believe that this is primarily due to the variance in performance for named entity recognition models for different languages and named entity types: Typically, person names are easier to recognise across languages while organisations are much harder to disambiguate, thus leading to inconsistent results. This, of course, may result in semantically very different inputs to the scaling algorithms for different languages.
When evaluating the predicted positions against the Right-Left ideological dimension (not shown here), our results again confirm the original findings from Proksch and Slapin (2010) that the EU integration dimension is clearly more prominently captured by text scaling methods than the Right-Left ideological dimension.
Overall, our experiments confirm the findings of Denny and Spirling (2016) and show that both Wordfish and SemScale are sensitive to changes in the input data. Our results also show that informed preprocessing, i.e., filtering the input based on linguistic traits, can improve results over using the whole document content as input (cf. Table 2). However, we need to better understand when preprocessing is beneficial and when it might harm the results. We hope our findings and the data sets we release will motivate further research on the role that entities such as person names, organisations or locations play in deducing ideological positions from textual data.
5.2. Different Text Representations: TF-IDF and Party2Vec
In the last section, we looked at different ways to filter the input for text scaling, based on linguistic preprocessing. Here, we investigate the impact of different input representations on scaling results: a) symbolic representations (i.e., word counts), b) semantics-aware representations (averaged word embeddings) and c) distributional representations of documents (Party2Vec).
Our SemScale approach consists of two main components: (1) a function that measures the similarity between individual documents as the similarity between tf-idf-weighted averages of word embeddings (from now we will refer to this similarity function as Avg w-emb) and (2) a graph-based scaling algorithm that operates on the similarity graph as input, regardless of how the similarity scores were computed. This allows us to easily plug in and test different input representations, as the ones named above.
First, instead of using the Avg w-emb as in previous experiments, we adapt SemScale to operate with a simple symbolic (i.e., sparse) document representation: a term frequency–inverse document frequency (tf-idf) vector for each document. Such representation, which captures word frequency information and does not model semantics, is widely used in traditional text mining as a baseline method in many tasks, from text classification and clustering to information retrieval and regression analyses (Manning and Schütze, 1999). In this case, the similarity function for the construction of the similarity graph is simply the cosine similarity between the sparse tf-idf vectors of documents. Secondly, we investigate a different text representation employing the recently proposed party embeddings (Rheault and Cochrane, 2019). In this work, an algorithm for directly inducing document embeddings, dubbed Doc2Vec (Le and Mikolov, 2014), is used to obtain vector representations of parties: the whole procedure is here referred to as Party2Vec. We have built party embeddings following the procedure and code181818https://github.com/lrheault/partyembed from Rheault and Cochrane (2019) and used the cosine similarity between the obtained party vectors as the similarity function with which we induce the similarity graph for SemScale’s graph-based scaling algorithm.
| 5th Leg | 6th Leg | |||||
|---|---|---|---|---|---|---|
| PA | PA | |||||
| Wordfish | 0.54 | 0.15 | 0.12 | 0.53 | 0.16 | 0.09 |
| (0.01) | (0.04) | (0.03) | (0.03) | (0.06) | (0.08) | |
| tf-idf | 0.58 | 0.22 | 0.23 | 0.57 | 0.20 | 0.19 |
| (0.03) | (0.07) | (0.07) | (0.03) | (0.08) | (0.1) | |
| Avg w-emb | 0.60 | 0.32 | 0.27 | 0.59 | 0.29 | 0.27 |
| (0.02) | (0.03) | (0.05) | (0.02) | (0.03) | (0.06) | |
| Party2Vec | 0.55 | 0.12 | 0.13 | 0.64 | 0.39 | 0.38 |
| (0.02) | (0.03) | (0.05) | (0.03) | (0.09) | (0.08) | |
The results shown in Table 6 denote the correlation scores with European Integration positioning (averaged across five languages) when using different text representations and, consequently, different similarity functions as input for SemScale’s graph-based scaling. It is important to notice that SemScale’s performance when relying on sparse symbolic representation of text (i.e., sparse tf-idf vectors) is still above the one of Wordfish but significantly below SemScale’s performance when relying on word embeddings (Avg w-emb). For the 5th legislative term, we do not observe any improvement in results when replacing the document representations obtained by averaging word embeddings (Avg-w-emb) with Party2Vec embeddings (Rheault and Cochrane, 2019). On the contrary, the aggregation of word embeddings seems to provide a better semantic signal for scaling than the Party2Vec embeddings, but also shows a high variance in results, as compared to Avg-w-emb and tf-idf. For the 6th term, however, the Party2Vec embeddings seem to provide a stronger and more reliable signal for text scaling.
Our results show that the use of word embeddings is a core component of SemScale and should not be substituted by (symbolic) word frequency information alone. However, the results also show that the success of SemScale can not be explained by the use of semantics-aware word embeddings alone but that the graph-based scaling approach might also play a role, given that results for SemScale with tf-idf outperform Wordfish on both data sets from the 5th and 6th legislative term. In addition, we confirm again that – as noted by Denny and Spirling (2018) and in our own experiments in the last section – text scaling algorithms can be highly sensitive to small changes in the input signal.
5.3. Scaling Manifestos
As a further evaluation of the potential of SemScale, we now test it on a different source of political texts, namely party manifestos from the Comparative Manifestos Project(Merz et al., 2016).191919The data is available from https://manifestoproject.wzb.eu/. We collect all electoral manifestos from the United Kingdom, Germany, France, Italy and Spain which are available with manifesto coded annotations at the quasi-sentence level (i.e., a sentence or clause). We do this because, while we do not employ the annotations in our work, we aim to establish a common benchmark that future studies could employ to extend our work even if they intend to rely on the provided annotations.
| Single Election | Multiple Elections | |||||
|---|---|---|---|---|---|---|
| PA | PA | |||||
| Wordfish | 0.63 | 0.44 | 0.35 | 0.61 | 0.26 | 0.31 |
| (0.06) | (0.12) | (0.15) | (0.06) | (0.09) | (0.16) | |
| SemScale (Avg w-emb) | 0.58 | 0.21 | 0.24 | 0.56 | 0.18 | 0.18 |
| (0.04) | (0.11) | (0.09) | (0.04) | (0.09) | (0.12) | |
| SemScale (Party2Vec) | 0.65 | 0.46 | 0.38 | 0.59 | 0.30 | 0.27 |
| (0.06) | (0.12) | (0.14) | (0.02) | (0.06) | (0.06) | |
The manifestos are further divided into two data sets that we call ”Single Election” and ”Multiple Elections”. The first includes electoral manifestos from only a single (recent) election for each country: UK 2015, Germany 2013, France 2012, Italy 2013, Spain 2011; the second data set contains all available coded manifestos for each country. For each country under study and for each data set, we measure the correlation between the produced scaling and the Right-Left ideological positioning (RILE) of the document provided by the Manifesto Project.
Before we present the results, it is important to remark on a few aspects of this specific experiment: a) in contrast to positions of European parties from the Chapel Hill Expert Survey (used as ground truth in previous experiments), which were not (at least not directly) assigned by expert annotators based on the content of the EP speeches, the RILE positions from the Manifesto project are derived directly from the coded quasi-sentences, meaning that they reflect the positions expressed by the texts themselves; b) the Text as Data community has already discussed in detail many of the critical aspects and limitations of the Manifesto Project coding scheme and in particular of RILE.202020See, inter alia, (Mikhaylov et al., 2012; Lacewell and Werner, 2013; Gemenis, 2013). While aware of the criticism, in this study we employ RILE scores because they are ground truth scores derived from the same text available to the automatic scaling methods, as opposed to the Chapel Hill positions, which are assigned by the experts based on their general familiarity and knowledge of political parties; c) in our previous experiments with EP speeches, the texts in different languages were direct translations of each other. This, however, is not the case for the manifestos, meaning that the obtained results are therefore not directly comparable across countries / languages.
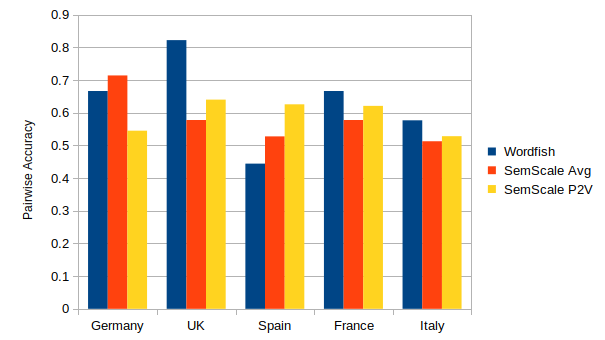
Scaling results on the Manifestos data set are displayed in Table 7.212121In the Manifestos experiments, we decided to decrease the threshold for minimum document frequency from 5 to 2 for Wordfish when computing the document frequency matrix, due to the smaller size of the dataset as compared to the data from the European Parliament. Accordingly, we use a minimum token count of 2 when computing the word embeddings for SemScale. Other parameter settings remain the same as in previous experiments. First of all, we notice that Wordfish better predicts manifesto RILE positions, as compared to the default SemScale variant (with Avg w-emb). SemScale, based on Party2Vec embeddings, however, outperforms Wordfish in the single election setting, while results for the multiple election setting are mixed. Figure 5 offers a more detailed per-country view of the scaling results (in terms of the pairwise accuracy measure). We can see that there is no single scaling method that yields best predictions in all five settings, i.e., for all countries. The performance of each method greatly varies, especially for Wordfish, and ranges from compelling 0.82 (when applied to UK manifestos) to mere 0.44 (on Spanish manifestos)222222The PA performance of 0.44 is below a random predictions baseline of party positions which, on average, is expected to yield a PA of 0.5. while SemScale (both based on Avg-w-emb and Party2Vec) tends to have more consistent correlations across countries and never performs below the random prediction baseline.
We speculate that the lower results for SemScore on the Multiple Elections data set is due to the large semantic shift in the content of such texts, spanning across decades of national politics, to which our semantic algorithm seems to be more sensitive than Wordfish. For these reasons, it is arguably not recommendable to use SemScale outside of the same temporal context (e.g., the same election, campaign, political debate, legislative period) as temporal shifts may severely affect the results: In such settings SemScale may find topical rather than positional similarities between documents and may assign similar positions to texts because they cover the same range of topics.
5.4. Graph Clustering Algorithms: HFLP versus PageRank
In the previous set of validation experiments, we have investigated changes concerning the input representations and content used for text scaling. We now present experiments designed to assess the importance of the choice of graph clustering algorithm used in SemScale. For that, we compare the performance of the harmonic function label propagation (HFLP) algorithm that we used in our previous experiments to results obtained when using PageRank instead of HFLP.
Originally developed by Google for ranking search results in web searches, PageRank counts the number of links to a retrieved document to estimate its importance. This is done with the help of random walks that follow the links between the websites, where the rank of each document is based on the probability of landing on that particular website, which will be higher for important sites with many incoming links. This approach can also be interpreted as a Markov process where each step of the random walk only depends on the current state, but not on the history (i.e., the previous steps).
Besides web searches, the PageRank algorithm can also be applied to many other problems in NLP (see, e.g., (Agirre and Soroa, 2009; Pershina et al., 2015; Wachsmuth et al., 2017)). In order to use PageRank for text scaling, we create our weighted similarity graph as described before, where each document is a node in the graph and the similarity between documents are weighted edges between the nodes. Thus, we can consider the similarity between the documents, based on averaged word embeddings, as “links” from one document to another, with each document (or node) representing the texts produced by one particular party. The likelihood of taking a random walk and landing on a document that is similar to the one from which we started is thus much higher than landing on a document that is completely different to our starting point.
Accordingly, in the next experiment, we use PageRank to compute a probability distribution that represents the likelihood of randomly landing on a particular document when taking the next step in a random walk. When starting the walk, the probability distribution is divided evenly among all documents, and in each iteration of learning the values are adjusted, getting more and more accurate while the learning proceeds.
| 5th Leg | 6th Leg | |||||
|---|---|---|---|---|---|---|
| PA | PA | |||||
| EP SemScale HFLP | 0.60 | 0.32 | 0.27 | 0.59 | 0.29 | 0.27 |
| (0.02) | (0.03) | (0.05) | (0.02) | (0.03) | (0.06) | |
| EP SemScale PageRank | 0.54 | 0.28 | 0.09 | 0.67 | 0.43 | 0.47 |
| (0.01) | (0.03) | (0.02) | (0.01) | (0.03) | (0.03) | |
| Single Election | Multiple Elections | |||||
|---|---|---|---|---|---|---|
| PA | PA | |||||
| Manifestos SemScale HFLP | 0.58 | 0.21 | 0.24 | 0.56 | 0.18 | 0.18 |
| (0.04) | (0.11) | (0.09) | (0.04) | (0.09) | (0.12) | |
| Manifestos SemScale PR | 0.60 | 0.35 | 0.30 | 0.50 | 0.10 | 0.01 |
| (0.04) | (0.10) | (0.12) | (0.03) | (0.05) | (0.09) | |
Table 8 shows results for the two graph-based clustering algorithms on the documents from the EU parliament for correlations with positions on EU integration, and table 9 presents the same results for predicted party positions, evaluated against ground-truth positions from RILE on party manifestos. We can see that the choice of algorithm has a huge impact on results, and that no algorithm provides best results for all settings. However, it seems as if HFLP provides a more reliable and robust signal, as shown by consistent Spearman () correlation scores, while PageRank only shows a very weak correlation or none at all in two of the settings (¡0.1 for EuroParl 5th leg. and =0.01 for Manifestos, Multiple Elections). We thus recommend using SemScale with HFLP instead of PageRank.
| 5th Leg | voc. | 6th Leg | voc. | |||||
|---|---|---|---|---|---|---|---|---|
| PA | PA | |||||||
| Wordfish | 0.54 | 0.15 | 0.12 | 66k | 0.53 | 0.16 | 0.09 | 53k |
| (0.01) | (0.04) | (0.03) | (0.03) | (0.06) | (0.08) | |||
| Wordfish+E | 0.55 | 0.18 | 0.12 | 33k | 0.54 | 0.20 | 0.11 | 24k |
| (: 0.95) | (0.01) | (0.06) | (0.03) | (0.03) | (0.06) | (0.9) | ||
| Wordfish+E | 0.55 | 0.16 | 0.13 | 11k | 0.54 | 0.21 | 0.12 | 7k |
| (: 0.85) | (0.02) | (0.04) | (0.03) | (0.02) | (0.05) | (0.7) | ||
| Wordfish+E | 0.55 | 0.15 | 0.13 | 5k | 0.54 | 0.19 | 0.11 | 3k |
| (: 0.80) | (0.01) | (0.03) | (0.03) | (0.03) | (0.06) | (0.8) | ||
5.5. Wordfish with Word Embeddings
Given the crucial role of word embeddings for text scaling, we next investigate whether we can improve results for Wordfish by adding information on word similarity to the input. As already mentioned above, the main disadvantage of symbolic word representations is their sparsity and the fact that similar words are treated the same way as words with completely different meanings.
To adapt the Wordfish input so that similar words now have similar representations, we preprocess the input documents and, instead of counting word frequencies for individual word forms, we group words into semantic classes, based on the cosine similarity of their embeddings. We test different similarity thresholds for creating these semantic classes. A threshold of 0.85, for example, means that the cosine similarity between two words needs to be for the two words to be grouped in the same class. Words that are not included in the embedding vocabulary are ignored.232323Please not that in our experiments, we use in-domain embeddings trained on the same data sets that we use for scaling. This means that our embedding vocabulary has a high coverage and only words below the minimum token count (set when training the embeddings) are “out-of-vocabulary”. We proceed in a greedy fashion: once we encounter a word with a similarity higher than the threshold, we add it to the semantic class and remove it from the list, so that each word is assigned to exactly one semantic class. Different thresholds have an impact on the vocabulary size, i.e., on the number of distinct word forms in the input (see the voc. column in Table 10). When the grouping is done, we can simply count word frequencies for all words in the same group, so that similar words are aggregated into one count. We can then construct the document frequency matrix over groups of similar words and use it as input for Wordfish.
Table 10 shows results on the European Parliament data set for correlations with ground-truth positions on EU integration. We notice only a small improvement for each of the three different similarity thresholds (0.95, 0.85, 0.8) and results are still significantly lower than the ones for SemScale with averaged embeddings. Interestingly, while the different thresholds have a strong impact on the vocabulary size in the input, these changes do not seem to have any effect on the results.
To sum up, this experiment shows that while word embeddings are an important ingredient in SemScale and contribute to its success, we can not trivially obtain a similar effect for Wordfish by feeding it less sparse and semantic-aware input. This is consistent with our results from Section 5.2 (Table 6) where SemScale outperformed Wordfish even when using sparse tf-idf vectors as input for text scaling.
5.6. Weakly Supervised Scaling
As a final validation experiment, we present a comparison of SemScale and the most widely adopted supervised text scaling algorithm, Wordscores (see Section 2). As SemScale was primarily designed for fully unsupervised scaling settings in which we assume that no ground truth positions are available for any of the documents, we first have to adjust the algorithm to be able to exploit this additional information. Our supervised extension of SemScale requires position scores for the two reference texts that represent extremes of the scale. For clarity, we refer to this (weakly) supervised extension of the original SemScale algorithm as SemScores.
In order to compare SemScores to Wordscores, we provide the same amount of supervision to both: we provide only the two documents that are the extremes (i.e., on each end) of the scale as reference texts and then evaluate the quality of the scalings, using the same correlation metrics as before.
| 5th Leg | 6th Leg | |||||
|---|---|---|---|---|---|---|
| PA | PA | |||||
| Wordscores | 0.63 | 0.55 | 0.36 | 0.66 | 0.59 | 0.46 |
| (0.01) | (0.01) | (0.01) | (0.02) | (0.02) | (0.03) | |
| Semscores | 0.70 | 0.58 | 0.56 | 0.65 | 0.47 | 0.43 |
| (0.01) | (0.0) | (0.03) | (0.01) | (0.00) | (0.01) | |
| Single Election | Multiple Elections | |||||
|---|---|---|---|---|---|---|
| PA | PA | |||||
| Wordscores | 0.70 | 0.77 | 0.49 | 0.66 | 0.57 | 0.42 |
| (0.05) | (0.05) | (0.12) | (0.06) | (0.07) | (0.18) | |
| SemScores | 0.70 | 0.80 | 0.53 | 0.63 | 0.46 | 0.33 |
| (0.06) | (0.02) | (0.12) | (0.06) | (0.07) | (0.16) | |
Results are shown in Table 11. We note that both algorithms produce scalings whose correlations with the Chapel-Hill EU integration positions drastically outperform the fully unsupervised scaling algorithms, Wordfish and SemScale (cf. Table 2). We can see similar improvements for scaling party manifestos where we compare correlations with RILE Right-Left ideological positions (see the comparison between Table 12 and Table 7). This emphasises the benefits gained from minimal supervision in the form of positions of two documents at the opposite ends of the spectrum.
6. Conclusion
Years of research in text scaling have highlighted the fact that bag of words representations of documents, such as the ones employed by Wordfish, have the ability of capturing an underlying dimension across the collection under study, which often correlates with ideological positioning or attitudes towards a relevant topic, for instance, the European integration process. However, while such a scaling approach has supported a large number of different studies, it is inherently limited by the fact that it works at word-frequency level and does not consider any semantic representation of the text. In contrast to this, in this work we present SemScale, a new semantically-aware scaling method that exploits distributional semantic representations of the texts under study. We have provided empirical evidence that in many settings, by employing semantic information, scaling algorithms are able to better capture the European integration dimension, using the speeches from the European parliament as textual input. Moreover, we have shown how controlling for specific lexical and semantic information may lead to more robust position predictions, while at the same time facilitating the interpretability of produced positions for political scientists by reducing the size of the vocabulary under study (for instance when considering only nouns or only named entities instead of all words). We have also evaluated the newly introduced approach for directly inducing semantic representations of parties – the so-called party embeddings – in the context of scaling party manifestos, by coupling them with our graph-based scaling algorithm SemScale. Finally, we have presented a mechanism for extending SemScale to supervised scaling settings in which positions in the dimension of interest are available for some of the texts, demonstrating that even a small amount of supervision can massively improve the quality of an automatically induced scaling.
While the results presented in this work seem promising, we believe that it is essential that our findings are treated with a healthy dose of scepticism, concretely, that the community (1) investigates the applicability and usefulness of semantic text scaling in a much wider set of scenarios and use cases and (2) bears in mind the limitations, some of which we have identified and analysed in this work (e.g., that semantic scaling is not particularly suitable when the texts span a long period of time, due to semantic and topical drift). To this end, we release together with this article the entire evaluation setting employed in our work and a Python implementation of SemScale (usable as a command-line tool). We hope that this effort will catalyse research on semantic text scaling and discovery of further settings in which it can support quantitative analyses in political science and its text-as-data community.
Acknowledgements.
This work is supported by the Sponsor German Research Foundation (DFG) https://www.dfg.de under Grant No. Grant #139943784. The authors are affiliated with the Collaborative Research Center SFB 884 “Political Economy of Reforms” and the Data and Web Science Group, University of Mannheim. Support for this research was provided by the German Research Foundation (SFB 884), projects C4 and B6. We thank Thomas Gschwend for comments on an earlier draft, Julian Bernauer and Konstantin Gavras for feedback on the implementation and Ashrakat Elshehawy for proofreading this paper. To view supplementary material for this article, please visit https://federiconanni.com/semantic-scaling/.References
- (1)
- Agirre and Soroa (2009) Eneko Agirre and Aitor Soroa. 2009. Personalizing PageRank for Word Sense Disambiguation. In Proceedings of the 12th Conference of the European Chapter of the ACL (EACL 2009). Association for Computational Linguistics, Athens, Greece, 33–41. https://www.aclweb.org/anthology/E09-1005
- Bakker et al. (2020) Ryan Bakker, Liesbet Hooghe, Seth Jolly, Gary Marks, Jonathan Polk, Jan Rovny, Marco Steenbergen, and Milada Anna Vachudova. 2020. 1999 – 2019 Chapel Hill Expert Survey Trend File. Version 1.2. Availableonchesdata.eu.
- Bojanowski et al. (2017) Piotr Bojanowski, Edouard Grave, Armand Joulin, and Tomas Mikolov. 2017. Enriching Word Vectors with Subword Information. Transactions of the Association for Computational Linguistics 5 (2017), 135–146.
- Bruinsma and Gemenis (2019) Bastiaan Bruinsma and Kostas Gemenis. 2019. Validating Wordscores: The Promises and Pitfalls of Computational Text Scaling. Communication Methods and Measures 13, 3 (2019), 212–227. https://doi.org/10.1080/19312458.2019.1594741
- Budge and Pennings (2007a) Ian Budge and Paul Pennings. 2007a. Do They Work? Validating Computerised Word Frequency Estimates Against Policy Series. Electoral Studies 26, 1 (2007), 121–129.
- Budge and Pennings (2007b) Ian Budge and Paul Pennings. 2007b. Missing the Message and Shooting the Messenger: Benoit and Laver’s ’Response’. Electoral Studies 26, 1 (2007), 136–141.
- Denny and Spirling (2016) Matthew James Denny and Arthur Spirling. 2016. Assessing the Consequences of Text Preprocessing Decisions.
- Denny and Spirling (2018) Matthew J. Denny and Arthur Spirling. 2018. Text Preprocessing For Unsupervised Learning: Why It Matters, When It Misleads, And What To Do About It. Political Analysis 26, 2 (2018), 168–189.
- Egerod and Klemmensen (2020a) Benjamin C.K. Egerod and Robert Klemmensen. 2020a. Scaling Political Positions from Text: Assumptions, Methods and Pitfalls. In The SAGE Handbook of Research Methods in Political Science and International Relations. Volume 1, Luigi Curini and Robert Franzese (Eds.). SAGE Publications, United Kingdom, 498–521. https://doi.org/10.4135/9781526486387.n30
- Egerod and Klemmensen (2020b) Benjamin C.K. Egerod and Robert Klemmensen. 2020b. Scaling Political Positions from Text: Assumptions, Methods and Pitfalls. SAGE Publications, United Kingdom, 498–521. https://doi.org/10.4135/9781526486387.n30
- Firth (1957) J Firth. 1957. A Synopsis of Linguistic Theory 1930-1955. In Studies in Linguistic Analysis. Philological Society, Oxford.
- Ganea and Hofmann (2017) Octavian-Eugen Ganea and Thomas Hofmann. 2017. Deep Joint Entity Disambiguation with Local Neural Attention (EMNLP 2017). In Proceedings of the 2017 Conference on Empirical Methods in Natural Language Processing. 2619–2629.
- Gemenis (2013) Kostas Gemenis. 2013. What to Do (and Not to Do) with the Comparative Manifestos Project Data. Political Studies 61 (2013), 3–23.
- Glavaš et al. (2018) Goran Glavaš, Marc Franco-Salvador, Simone P Ponzetto, and Paolo Rosso. 2018. A resource-light method for cross-lingual semantic textual similarity. Knowledge-Based Systems 143 (2018), 1–9.
- Glavaš et al. (2017) Goran Glavaš, Federico Nanni, and Simone Paolo Ponzetto. 2017. Unsupervised Cross-Lingual Scaling of Political Texts. In Proceedings of the 15th Conference of the European Chapter of the Association for Computational Linguistics. 688–693.
- Glavaš and Ponzetto (2017) Goran Glavaš and Simone Paolo Ponzetto. 2017. Dual Tensor Model for Detecting Asymmetric Lexico-Semantic Relations. In Proceedings of the 2017 Conference on Empirical Methods in Natural Language Processing. 1757–1767.
- Glavaš and Vulić (2018) Goran Glavaš and Ivan Vulić. 2018. Discriminating between Lexico-Semantic Relations with the Specialization Tensor Model. In Proceedings of the 2018 Conference of the North American Chapter of the Association for Computational Linguistics). 181–187.
- Goodfellow et al. (2016) Ian Goodfellow, Yoshua Bengio, and Aaron Courville. 2016. Deep learning. MIT Press, Cambridge.
- Greene et al. (2016) Zac Greene, Andrea Ceron, Gijs Schumacher, and Zoltan Fazekas. 2016. The Nuts and Bolts of Automated Text Analysis. Comparing Different Document Pre-Processing Techniques in Four Countries. Working paper (Nov 2016), 23 pages. https://doi.org/10.31219/osf.io/ghxj8
- Grimmer and Stewart (2013) Justin Grimmer and Brandon M. Stewart. 2013. Text as data: {The} promise and pitfalls of automatic content analysis methods for political texts. Political Analysis 21, 3 (2013), 267–297. https://doi.org/10.1093/pan/mps028
- Gurciullo and Mikhaylov (2017) Stefano Gurciullo and Slava J Mikhaylov. 2017. Detecting policy preferences and dynamics in the un general debate with neural word embeddings. In 2017 International Conference on the Frontiers and Advances in Data Science (FADS). IEEE, 74–79.
- Hawkins et al. (2019) Kirk A. Hawkins, Rosario Aguilar, Bruno Castanho Silva, Erik K. Jenne, Bojana Kocijan, and Cristobóbal Rovira Kaltwasser. 2019. Measuring Populist Discourse: The Global Populism Database. In 2019 EPSA Annual Conference (Belfast, UK). 16 pages.
- Hjorth et al. (2015) Frederik Hjorth, Robert Klemmensen, Sara Hobolt, Martin Ejnar Hansen, and Peter Kurrild-Klitgaard. 2015. Computers, coders, and voters: Comparing automated methods for estimating party positions. Research & Politics 2, 2 (6 2015), 205316801558047. https://doi.org/10.1177/2053168015580476
- Joulin et al. (2017) Armand Joulin, Edouard Grave, Piotr Bojanowski, Maximilian Nickel, and Tomas Mikolov. 2017. Fast Linear Model for Knowledge Graph Embeddings. In Proceedings of the 6th Workshop on Automated Knowledge Base Construction (AKBC). 8 pages.
- Lacewell and Werner (2013) Onawa P Lacewell and Annika Werner. 2013. Coder training: key to enhancing reliability and validity. Mapping Policy Preferences from Texts 3 (2013), 169–194.
- Lafferty et al. (2001) John D. Lafferty, Andrew McCallum, and Fernando C. N. Pereira. 2001. Conditional Random Fields: Probabilistic Models for Segmenting and Labeling Sequence Data. In Proceedings of the Eighteenth International Conference on Machine Learning. 282–289.
- Lample et al. (2016) Guillaume Lample, Miguel Ballesteros, Sandeep Subramanian, Kazuya Kawakami, and Chris Dyer. 2016. Neural Architectures for Named Entity Recognition. In Proceedings of the 2016 Conference of the North American Chapter of the Association for Computational Linguistics: Human Language Technologies. Association for Computational Linguistics, San Diego, California, 260–270. https://doi.org/10.18653/v1/N16-1030
- Laver and Benoit (2018) Michael Laver and Kenneth Benoit. 2018. Extracting Policy Positions from Political Texts Using Words as Data. American Political Science Review 97, 2 (2018), 311–331. https://doi.org/10.1017/S0003055403000698
- Laver et al. (2003) Michael Laver, Kenneth Benoit, and John Garry. 2003. Extracting policy positions from political texts using words as data. American Political Science Review 97, 02 (2003), 311–331.
- Le and Mikolov (2014) Quoc Le and Tomas Mikolov. 2014. Distributed representations of sentences and documents. In International conference on machine learning. 1188–1196.
- Lowe (2008) Will Lowe. 2008. Understanding wordscores. Political Analysis 4, 16 (2008), 356–371.
- Lowe and Benoit (2013) Will Lowe and Kenneth Benoit. 2013. Validating estimates of latent traits from textual data using human judgment as a benchmark. Political Analysis 21, 3 (2013), 298–313. https://doi.org/10.1093/pan/mpt002
- Lowe et al. (2011) Will Lowe, Kenneth Benoit, Slava Mikhaylov, and Michael Laver. 2011. Scaling Policy Preferences from Coded Political Texts. Legislative Studies Quarterly 36, 1 (2 2011), 123–155.
- Ma and Hovy (2016) Xuezhe Ma and Eduard Hovy. 2016. End-to-end Sequence Labeling via Bi-directional LSTM-CNNs-CRF. In Proceedings of the 54th Annual Meeting of the Association for Computational Linguistics (Volume 1: Long Papers). Association for Computational Linguistics, Berlin, Germany, 1064–1074. https://doi.org/10.18653/v1/P16-1101
- Manning et al. (2014) Christopher Manning, Mihai Surdeanu, John Bauer, Jenny Finkel, Steven Bethard, and David McClosky. 2014. The Stanford CoreNLP Natural Language Processing Toolkit. In Proceedings of 52nd Annual Meeting of the Association for Computational Linguistics. 55–60.
- Manning and Schütze (1999) Christopher D Manning and Hinrich Schütze. 1999. Foundations of statistical natural language processing. MIT press.
- Martin and Quinn (2002) Andrew Martin and Kevin Quinn. 2002. Dynamic ideal point estimation via Markov chain Monte Carlo for the US Supreme Court, 1953–1999. Political Analysis 2, 10 (2002), 134–153.
- Martin and Vanberg (2008) Lanny Martin and Georg Vanberg. 2008. A robust transformation procedure for interpreting political text. Political Analysis 1, 16 (2008), 93–100.
- Merz et al. (2016) Nicolas Merz, Sven Regel, and Jirka Lewandowski. 2016. The Manifesto Corpus: A new resource for research on political parties and quantitative text analysis. Research & Politics 3, 2 (2016), 1–8. https://doi.org/10.1177/2053168016643346
- Mikhaylov et al. (2012) Slava Mikhaylov, Michael Laver, and Kenneth R. Benoit. 2012. Coder Reliability and Misclassification in the Human Coding of Party Manifestos. Political Analysis 20, 1 (2012), 78–91. https://doi.org/10.1093/pan/mpr047
- Mikolov et al. (2013) Tomas Mikolov, Ilya Sutskever, Kai Chen, Greg S Corrado, and Jeff Dean. 2013. Distributed representations of words and phrases and their compositionality. In Advances in neural information processing systems. 3111–3119.
- Nanni et al. (2018) Federico Nanni, Goran Glavaš, Simone Paolo Ponzetto, Sara Tonelli, Nicolò Conti, Ahmet Aker, Alessio Palmero Aprosio, Arnim Bleier, Benedetta Carlotti, Theresa Gessler, Tim Henrichsen, Dirk Hovy, Christian Kahmann, Mladen Karan, Akitaka Matsuo, Stefano Menini, Dong Nguyen, Andreas Niekler, Lisa Posch, Federico Vegetti, Zeerak Waseem, Tanya Whyte, and Nikoleta Yordanova. 2018. Findings from the hackathon on understanding euroscepticism through the lens of textual data. In Proceedings of the LREC 2018 Workshop ParlaCLARIN. 59–66.
- Nanni et al. (2019) Federico Nanni, Goran Glavaš, Simone Paolo Ponzetto, and Heiner Stuckenschmidt. 2019. Online Appendix: Political Text Scaling Meets Computational Semantics. Online Appendix. https://federiconanni.com/semantic-scaling/.
- Nickel et al. (2016) Maximilian Nickel, Kevin Murphy, Volker Tresp, and Evgeniy Gabrilovich. 2016. A review of relational machine learning for knowledge graphs. Proc. IEEE 104, 1 (2016), 11–33.
- Norris (2020) Pippa Norris. 2020. Measuring populism worldwide. Party Politics 26, 6 (2020), 697–717. https://doi.org/10.1177/1354068820927686 arXiv:https://doi.org/10.1177/1354068820927686
- Pennington et al. (2014) Jeffrey Pennington, Richard Socher, and Christopher Manning. 2014. Glove: Global vectors for word representation. In Proceedings of the 2014 conference on empirical methods in natural language processing. 1532–1543.
- Perry and Benoit (2017) Patrick O. Perry and Kenneth Benoit. 2017. Scaling Text with the Class Affinity Model. https://arxiv.org/abs/1710.08963
- Pershina et al. (2015) Maria Pershina, Yifan He, and Ralph Grishman. 2015. Personalized Page Rank for Named Entity Disambiguation. In Proceedings of the 2015 Conference of the North American Chapter of the Association for Computational Linguistics: Human Language Technologies. Association for Computational Linguistics, Denver, Colorado, 238–243. https://doi.org/10.3115/v1/N15-1026
- Polk et al. (2017) Jonathan Polk, Jan Rovny, Ryan Bakker, Erica Edwards, Liesbet Hooghe, Seth Jolly, Jelle Koedam, Filip Kostelka, Gary Marks, Gijs Schumacher, Marco Steenbergen, Milada Vachudova, Marko Zilovic, and Polk Jonathan. 2017. Explaining the salience of anti-elitism and reducing political corruption for political parties in Europe with the 2014 Chapel Hill Expert Survey data. Research & Politics 4, 1 (1 2017), 205316801668691. https://doi.org/10.1177/2053168016686915
- Poole and Rosenthal (1985) Keith Poole and Howard Rosenthal. 1985. A spatial model for legislative roll call analysis. American Journal of Political Science 29, 2 (1985), 357–384.
- Porter (1980) M.F. Porter. 1980. An algorithm for suffix stripping. Program 14, 3 (3 1980), 130–137.
- Proksch and Slapin (2010) Sven-Oliver Proksch and Jonathan B Slapin. 2010. Position Taking in European Parliament Speeches. British Journal of Political Science 52 (2010), 587–611.
- Rheault and Cochrane (2019) Ludovic Rheault and Christopher Cochrane. 2019. Word Embeddings for the Analysis of Ideological Placement in Parliamentary Corpora. Political Analysis 1, 28 (2019), 112–133.
- Rodriguez and Spirling (0) Pedro Rodriguez and Arthur Spirling. 0. Word Embeddings: What works, what doesn’t, and how to tell the difference for applied research. The Journal of Politics 0, ja (0), null. https://doi.org/10.1086/715162 arXiv:https://doi.org/10.1086/715162
- Salton and Buckley (1988) Gerard Salton and Christopher Buckley. 1988. Term-weighting approaches in automatic text retrieval. Information processing & management 24, 5 (1988), 513–523.
- Slapin and Proksch (2008) Jonathan B Slapin and Sven-Oliver Proksch. 2008. A Scaling Model for Estimating Time-Series Party Positions from Texts. American Journal of Political Science 52 (2008), 705–722.
- Wachsmuth et al. (2017) Henning Wachsmuth, Benno Stein, and Yamen Ajjour. 2017. “PageRank” for Argument Relevance. In Proceedings of the 15th Conference of the European Chapter of the Association for Computational Linguistics: Volume 1, Long Papers. Association for Computational Linguistics, Valencia, Spain, 1117–1127. https://www.aclweb.org/anthology/E17-1105
- Yang and Pedersen (1997) Yiming Yang and Jan O. Pedersen. 1997. A Comparative Study on Feature Selection in Text Categorization. In Proceedings of the Fourteenth International Conference on Machine Learning. 412–420.
- Zhu et al. (2003) Xiaojin Zhu, Zoubin Ghahramani, and John D Lafferty. 2003. Semi-supervised learning using gaussian fields and harmonic functions. In Proceedings of the 20th International conference on Machine learning. 912–919.