Exploring the age dependent properties of M and L dwarfs using Gaia and SDSS
Abstract
We present a sample of M and L dwarfs111Find the sample here: https://zenodo.org/record/2636692#.XK9_1etKjVp constructed from two existing catalogs of cool dwarfs spectroscopically identified in the Sloan Digital Sky Survey (SDSS). We cross-matched the SDSS catalog with Gaia DR2 to obtain parallaxes and proper motions and modified the quality cuts suggested by the Gaia Collaboration to make them suitable for late-M and L dwarfs. We also provide relations between Gaia colors and absolute magnitudes with spectral type and conclude that has the tightest relation to spectral type for M and L dwarfs. In addition, we study magnetic activity as a function of position on the color–magnitude diagram, finding that magnetically active stars have, on average, redder colors and/or brighter magnitudes than inactive stars. This effect cannot be explained by youth alone and might indicate that active stars are magnetically inflated, binaries and/or high metallicity. Moreover, we find that vertical velocity and vertical action dispersion are correlated with emission, confirming that these two parameters are age indicators. We also find that stars below the main sequence have high tangential velocity which is consistent with a low metallicity and old population of stars that belong to the halo or thick disk.
1 Introduction
The Milky Way Galaxy is dominated in number by low mass stars occupying the M and L spectral types (e.g. Gould et al., 1996; Bochanski et al., 2010). M dwarfs have a wide range of ages in the Milky Way Galaxy since they have main-sequence lifetimes longer than the current age of the Universe (e.g. Fagotto et al., 1994; Laughlin et al., 1997). This makes them an ideal population for studies of the structure, dynamics, and evolution of the stellar thin disk. Ages of field solar-type stars are typically obtained by three methods (Soderblom, 2010): (1) empirical methods such as activity–age relations (Mamajek & Hillenbrand, 2008) and rotation period–age relations, called gyrochronology (Skumanich, 1972; Barnes, 2007; Angus et al., 2015; Meibom et al., 2015; Van Saders et al., 2016); (2) model-dependent methods such as isochrone fitting (Edvardsson et al., 1993) and asteroseismology (Chaplin et al., 2014); and (3) statistical methods such as kinematic age dating (Wielen, 1977). Despite the availability of multiple methods, assigning accurate ages to M and L dwarfs in the field remains challenging. Due to their long main-sequence lifetimes, age-related parameters change slowly with time. Asteroseismological methods cannot yet be applied to M dwarfs as their acoustic oscillations have extremely small amplitudes (Rodríguez et al., 2016), and their isochronal stellar evolution models are not accurate, in part because of the difficulty associated with modeling fully convective interiors (Baraffe et al., 2015). Empirical and statistical methods are the best option to obtain ages for field M and L dwarfs.
Solar-type stars have a radiative core and a convective envelope that do not rotate as a rigid body. It is generally thought that as a consequence of this differential rotation, a dynamo is generated at the interface of the two zones, which is responsible for the magnetic activity of the star (Parker, 1955). When the magnetic field threads through the surface, it heats the chromosphere and the corona, generating collisionally induced atomic emission (including the emission line) and X-ray emission, respectively. As a consequence, and X-ray emission are measurable evidence of surface magnetism that can be used as magnetic activity indicators. The magnetic field is also partly responsible for the stellar magnetic wind, which dissipates angular momentum, slowing the rotation (and thus the differential rotation) of the star. Due to this process, rotation, magnetic activity and age are tightly related for solar-type stars (e.g. Skumanich, 1972; Barry, 1988; Soderblom et al., 1991; Mamajek & Hillenbrand, 2008). Stars with masses M⊙ (spectral type M3) are fully convective (Chabrier & Baraffe, 1997), so there is no interface with a radiative zone to produce a solar-type dynamo. Even though the mechanism to generate magnetic fields in fully convective stars is not yet understood, a strong correlation between rotation and magnetic activity is found for fully convective M dwarfs (e.g. Delfosse et al., 1998; Mohanty & Basri, 2003; Reiners et al., 2012; West et al., 2015; Newton et al., 2017). Furthermore, several studies have extended the idea that magnetic activity decreases with age for late-M dwarfs (Fleming et al., 1995; Eggen, 1990; West et al., 2006, 2008a; Riedel et al., 2017). This indicates that there is an empirical relation between age, rotation and magnetic activity for M dwarfs that may extend to L dwarfs as well.
As they orbit the center of the Galaxy, stars gravitationally interact with giant molecular clouds and other passing stars, receiving a kinematic kick that alters their orbits. The increased eccentricity and inclination of the altered orbits causes the stars to separate from the plane of the Galaxy as they age. This effect is generally quantified by the age-velocity relation (AVR; Wielen, 1977; Hänninen & Flynn, 2002), which indicates the velocity dispersion of a population of stars with a similar age, goes as the square root of its age (). This relationship is particularly strong when examining the correlations between Galactic height or vertical velocity and age (e.g. West et al., 2006, 2008a; Nordstrom et al., 2004; Aumer et al., 2016; Yu & Liu, 2018). This statistical method was used by several works to obtain kinematic ages of population of stars (e.g. Schmidt et al., 2007; Zapatero Osorio et al., 2007; Faherty et al., 2009; Reiners & Basri, 2009). Thanks to large spectrophotometric surveys such as the Sloan Digital Sky Survey (SDSS; York et al., 2000) and astrometric surveys such as Gaia DR2 (Gaia Collaboration et al., 2016, 2018b), better results can be expected from statistical methods.
Our ultimate goal is to infer the ages of M and L dwarfs by combining different age indicators such as fractional luminosity and vertical action dispersion. We began this process by compiling a sample of tens of thousands of spectroscopically identified M and L dwarfs, including colors, activity measurements, and kinematics with sufficient precision to use vertical action dispersion as an age indicator. In this paper, we introduce the MLSDSS-GaiaDR2 sample which includes H equivalent widths, spectral types for M and L dwarfs, and radial velocities from two catalogs compiled from SDSS: the spectroscopic M dwarf catalog (West et al., 2011) and the the “BUD” catalog of Schmidt et al. (2015, 2019, in prep); as well as their vertical velocities and actions, calculated from Gaia DR2 proper motions, parallaxes and positions.
This paper is laid out as follows. In section 2, we describe the assembly of our M and L dwarf sample, including the process of cross-matching and combining data from different surveys, and the quality cuts we applied that remove incorrect matches and low quality data. In section 3, we fit relations to the Gaia colors/absolute magnitudes and spectral types of the M and L dwarfs in our catalog. In section 4, we fit relations between the Two Micron All Sky Survey (2MASS; Skrutskie et al., 2006) and SDSS absolute magnitudes and spectral types of stars in our sample. In section 5, we briefly explore the relation between fractional luminosity and tangential velocity and the position of the star in the Gaia color–magnitude diagram. We find that magnetically active stars have redder colors and/or brighter magnitudes than inactive stars and show that this effect cannot be explained only by youth and that radius inflation, metallicity and binarity could be the causes. We also use color–magnitude position and tangential velocity to identify a possibly old halo or thick disk population of M dwarfs. In this section we also discuss the relation between three age indicators in our catalog: H luminosity, vertical velocity, and vertical action. Finally, in section 6 we summarize the work and our conclusions.
2 The MLSDSS-GaiaDR2 Sample
In this paper, we present the MLSDSS-GaiaDR2 sample of M and L dwarfs including spectral types, H measurements, survey photometry, and Galactic kinematics. The compilation of the MLSDSS-GaiaDR2 sample was accomplished in two parts: assembling the base sample, dubbed the “MLSDSS” sample, and then cross-matching it with the Gaia Data Release 2 (DR2; Gaia Collaboration et al., 2018b). The MLSDSS sample is based on data from the Sloan Digital Sky Survey Data Releases 7, 10, and 12 (DR7; DR10; DR12; Abazajian et al., 2009; Ahn et al., 2014; Alam et al., 2015) and the SDSS-III Baryon Oscillation Spectroscopic Survey (BOSS; Dawson et al., 2013; Eisenstein et al., 2011). The construction of the MLSDSS sample is described in Section 2.1 and the cross-match with Gaia DR2 is in Section 2.2. In Section 2.3, we describe the criteria we applied to the MLSDSS-GaiaDR2 sample to create a high-quality astrometric sample and the three resulting photometric subsamples.
2.1 Assembling the MLSDSS Sample
The MLSDSS sample is the combination of two catalogs of low mass stars identified in SDSS: the DR7 spectroscopic M dwarf catalog (West et al., 2011) and the BOSS Ultracool dwarf “BUD” late-M and L dwarf catalog of Schmidt et al. (2015, 2019, in prep).
The DR7 spectroscopic M dwarf catalog contains M0–M9 dwarfs from SDSS DR7; these stars comprise the bulk of the MLSDSS sample. West et al. (2011) selected sources using color cuts designed to include all M dwarfs ( and ) and then combined a spectral template matching code with visual inspection to classify stars with spectral types M0 to M9 based on their red-optical SDSS low-resolution () spectra. They also measured the equivalent width ( EW) and fractional luminosity () from the SDSS spectra and included the values with uncertainties for each star in their catalog. Finally, they give SDSS photometry and Two Micron All Sky Survey (2MASS; Skrutskie et al., 2006) photometry for the M dwarfs.
The second component of the MLSDSS sample is the BUD catalog composed of M7–L8 dwarfs. It includes M7–M9 dwarfs from the DR7 M dwarf catalog and an additional L dwarfs from SDSS DR7 (Schmidt et al., 2010). The BUD catalog was also complemented with M7–L8 dwarfs selected as ancillary targets in the BOSS survey and released in SDSS DR10 (Schmidt et al., 2015) and DR12 (Schmidt et al., 2019, in prep). The additional M7–M9 dwarfs were selected using the same color-cuts of the West et al. (2011) catalog ( and ); the L dwarfs were selected with . Schmidt et al. (2015) assigned spectral types for the L dwarfs and the additional M dwarfs. They adopted the spectral type classification assigned by West et al. (2011) for the rest of the M0–M8 dwarfs but re-classified all of the M9 dwarfs (Schmidt et al., 2019, in prep.). Schmidt et al. (2015) measured equivalent widths and for all objects in the BUD catalog. They also re-queried SDSS and 2MASS and reported new , , , , and photometry. For the M7–M9 objects which are present in both the DR7 M dwarf and BUD catalogs, we adopted the photometry, EW, and spectral type from BUD into the MLSDSS sample.
The spectral type distribution of the MLSDSS sample is shown in Figure 1. The sample is not complete and reflects the SDSS target selection and sensitivities. The spectroscopic targeting of SDSS avoided some of the most common M3/M4 stars, and the sample is also incomplete at later spectral types and fainter magnitudes due to the capabilities of the telescope and instrument.
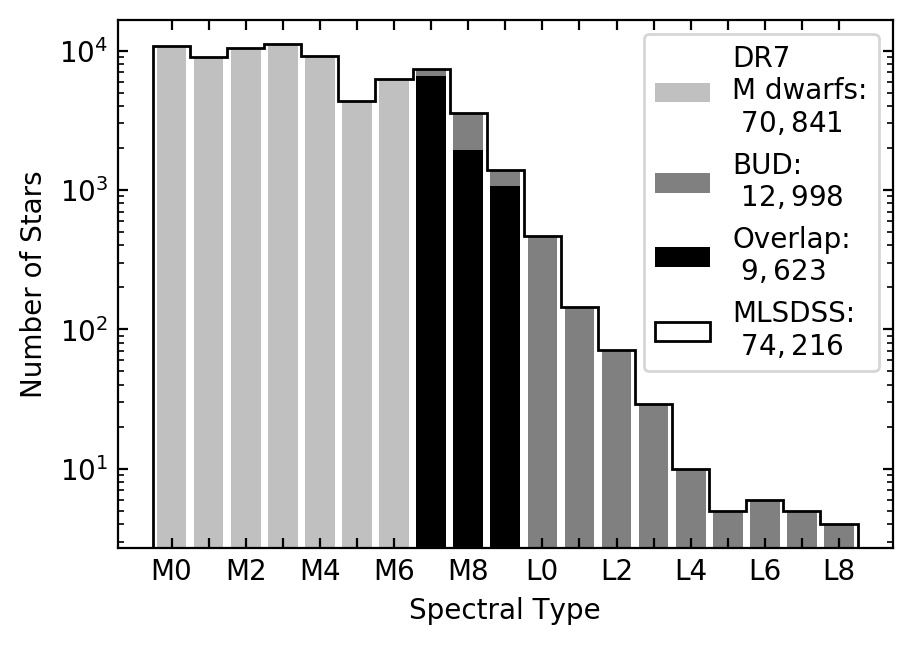
Both the SDSS DR7 M dwarf spectroscopic catalog and the BUD catalog contain data relevant to kinematics and activity: an activity field (ACTHA) and proper motion and radial velocity estimates. We adopted these three values from the SDSS DR7 M dwarfs spectroscopic catalog for spectral types M0 to M6 and from the BUD catalog for spectral types M7 and later.
The ACTHA field mentioned above indicates if the star is active or not ( active and inactive; described below). Both West et al. (2011) and Schmidt et al. (2015) classified stars as magnetically active or inactive according to the equivalent width of the emission line. Stars were considered active if they meet these four criteria: (1) the signal-to-noise per pixel in the region near is greater than 3, (2) EW Å, the detection threshold for SDSS spectra, (3) EW is larger than its uncertainty, and (4) the peak height of is greater than three times the noise level of the continuum region (measured by the standard deviation of the flux values). Stars that pass criterion (1) for signal-to-noise but do not pass the detection threshold are categorized as inactive. Stars that do not pass the first criterion were classified as neither active nor inactive, and stars which pass all criteria but the second were classified as weakly active and not included in this work.
Both the SDSS DR7 M dwarf spectroscopic catalog and the BUD catalog also include proper motions for the stars that were used as part of our cross-match procedure. The stars in the SDSS DR7 M dwarf catalog are all bright enough that proper motions were part of the Munn et al. (USNO-B; 2014) catalog, based on SDSS and USNO-B positions, and have mean uncertainties of only mas/yr. The stars in the BUD sample, on the other hand, are too faint to be in the USNO-B, and their proper motions were calculated using positions from SDSS, 2MASS, and the Wide-Field Infrared Sky Explorer (WISE; Wright et al., 2010) by Schmidt et al. (2019, in prep) and have mean uncertainties of mas/yr.
Lastly, both catalogs include radial velocities estimates with typical uncertainties of km/s. These were measured via cross-correlation of the () SDSS spectra to templates from Schmidt et al. (2014) and Bochanski et al. (2007).
When compiling the MLSDSS sample, we modified several fields from the two input catalogs to make them as consistent as possible with each other: the photometry quality flag (GOODPHOT_SDSS); the white dwarf-M Dwarf binary flag (WDM); and the photometry impacted by extinction.
The two input catalogs indicate good quality photometry using different methods: the SDSS DR7 M dwarfs spectroscopic catalog assigned a single quality flag or that depends on the quality of , and -band photometry (-band extinction magnitudes, and uncertainties magnitudes) while the BUD catalog has a flag for each band (using a combination of SDSS flags and uncertainty cuts to select good photometry, see Section 3.1 in Schmidt et al. (2015) for more details). We applied the first convention to the BUD stars, assigning them a value if the , and -band were all good.
Another difference between the two input catalogs is the WDM flag, which indicates if the star is a white dwarf-M Dwarf binary ( is a binary and is not). West et al. (2011) selected these pairs with the color cuts from Smolčić et al. (2004): , , , . The BUD catalog does not contain white dwarf-M Dwarf binaries (Schmidt et al., 2015) so we added a in the WDM column for all of these stars.
Lastly, West et al. (2011) corrected all five SDSS magnitudes for dust extinction using the Schlegel et al. (1998) maps. Schmidt et al. (2015) did not apply the correction to the magnitudes and instead included the extinction correction as a field in the BUD catalog. We applied the extinction correction for the stars in the BUD catalog so that all of the included SDSS photometry in the MLSDSS sample is corrected for extinction.
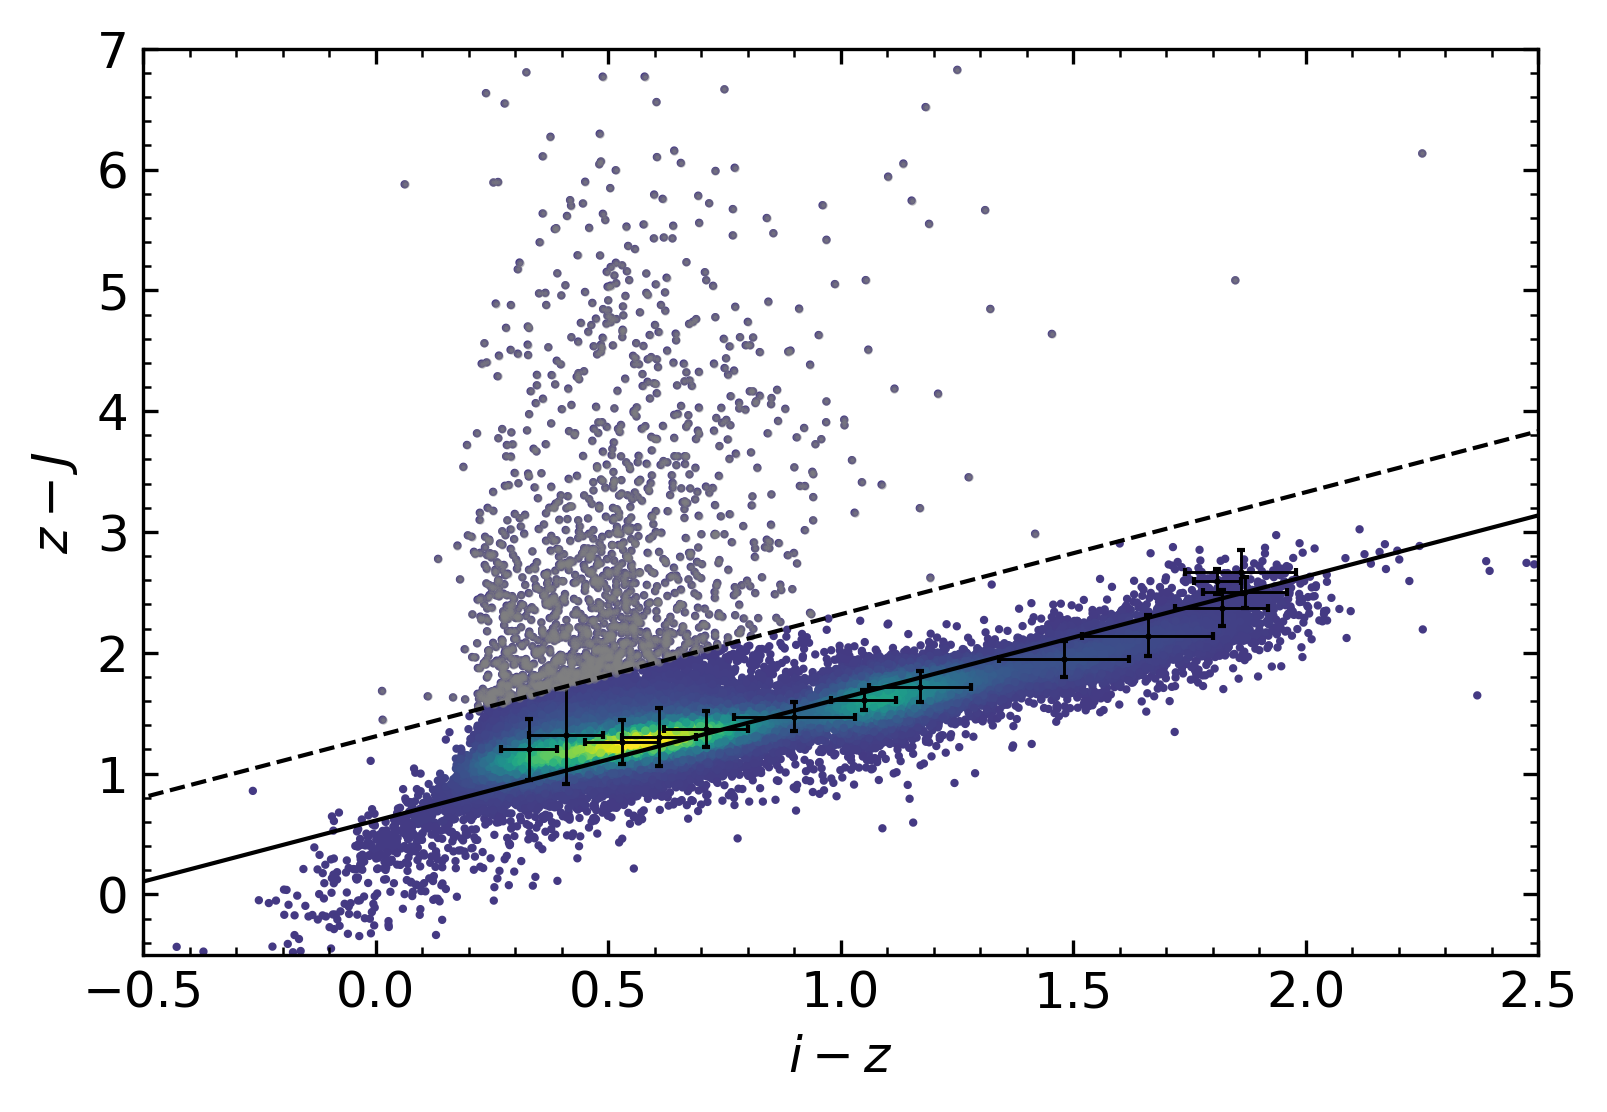
We found that some of the 2MASS photometry included in the DR7 M dwarf catalog was incorrect due to mismatches. This is demonstrated in Figure 2 where the versus color-color plot shows a significant scatter towards redder color, inconsistent with the colors and spectral types of the sample when compared to the median values and standard deviation for and colors of confirmed M and L dwarfs (West et al., 2011; Schmidt et al., 2015). The outliers do not have a low signal-to-noise ratio -band photometry and have good SDSS photometry (). They are also more common among fainter, bluer stars that are unlikely to be bright enough in 2MASS bands to have detections. It is therefore likely that the spurious colors are due to 2MASS mismatches with the SDSS source. We fit a line to the median values using the errors in as weights and removed the 2MASS information for the stars with colors more than above the fit, where is the mean propagated error on the color. These stars remain in the MLSDSS sample, just without 2MASS photometry.
The final MLSDSS sample includes M and L dwarfs with spectral types, SDSS photometry, 2MASS photometry, equivalent width and fractional luminosity (), an activity classification, proper motions, and radial velocities.
2.2 Cross-match with Gaia DR2
We cross-matched the MLSDSS sample with Gaia DR2 to obtain precise proper motions and parallaxes. First, we propagated the positions from the SDSS epoch (ranging from to ) to the Gaia DR2 epoch () using the proper motions in MLSDSS. Second, we queried the Gaia Archive222http://gea.esac.esa.int/archive/ and selected all the objects within a radius of of the 2015.5 position. We found that ( stars) of MLSDSS stars have at least one match in Gaia DR2. Of these, have between two and five matches within a radius. To find a single best match, we propagated the position of each match back to the SDSS epoch using the Gaia DR2 proper motion and kept only the closest match between the Gaia position at the SDSS epoch and the SDSS position. We include a FITS table that contains the matches in our sample as a supplementary file. In Table 1 we list the parameters in our sample and in the FITS table.
For this paper, we want a high fidelity sample with a minimum of mismatches. We found that a separation between SDSS (RA, DEC), and Gaia (RA, DEC) propagated backwards to the SDSS epoch using the proper motions from Gaia, provides a reasonable balance between sample size and crossmatch reliability. A total of stars ( of MLSDSS) have Gaia DR2 matches and a separation less than or equal to . These are indicated in Table 1 with the GOODMATCH flag ( or ). The analysis in this paper is based on these objects with matches () and we call this the “MLSDSS-GaiaDR2 sample”.
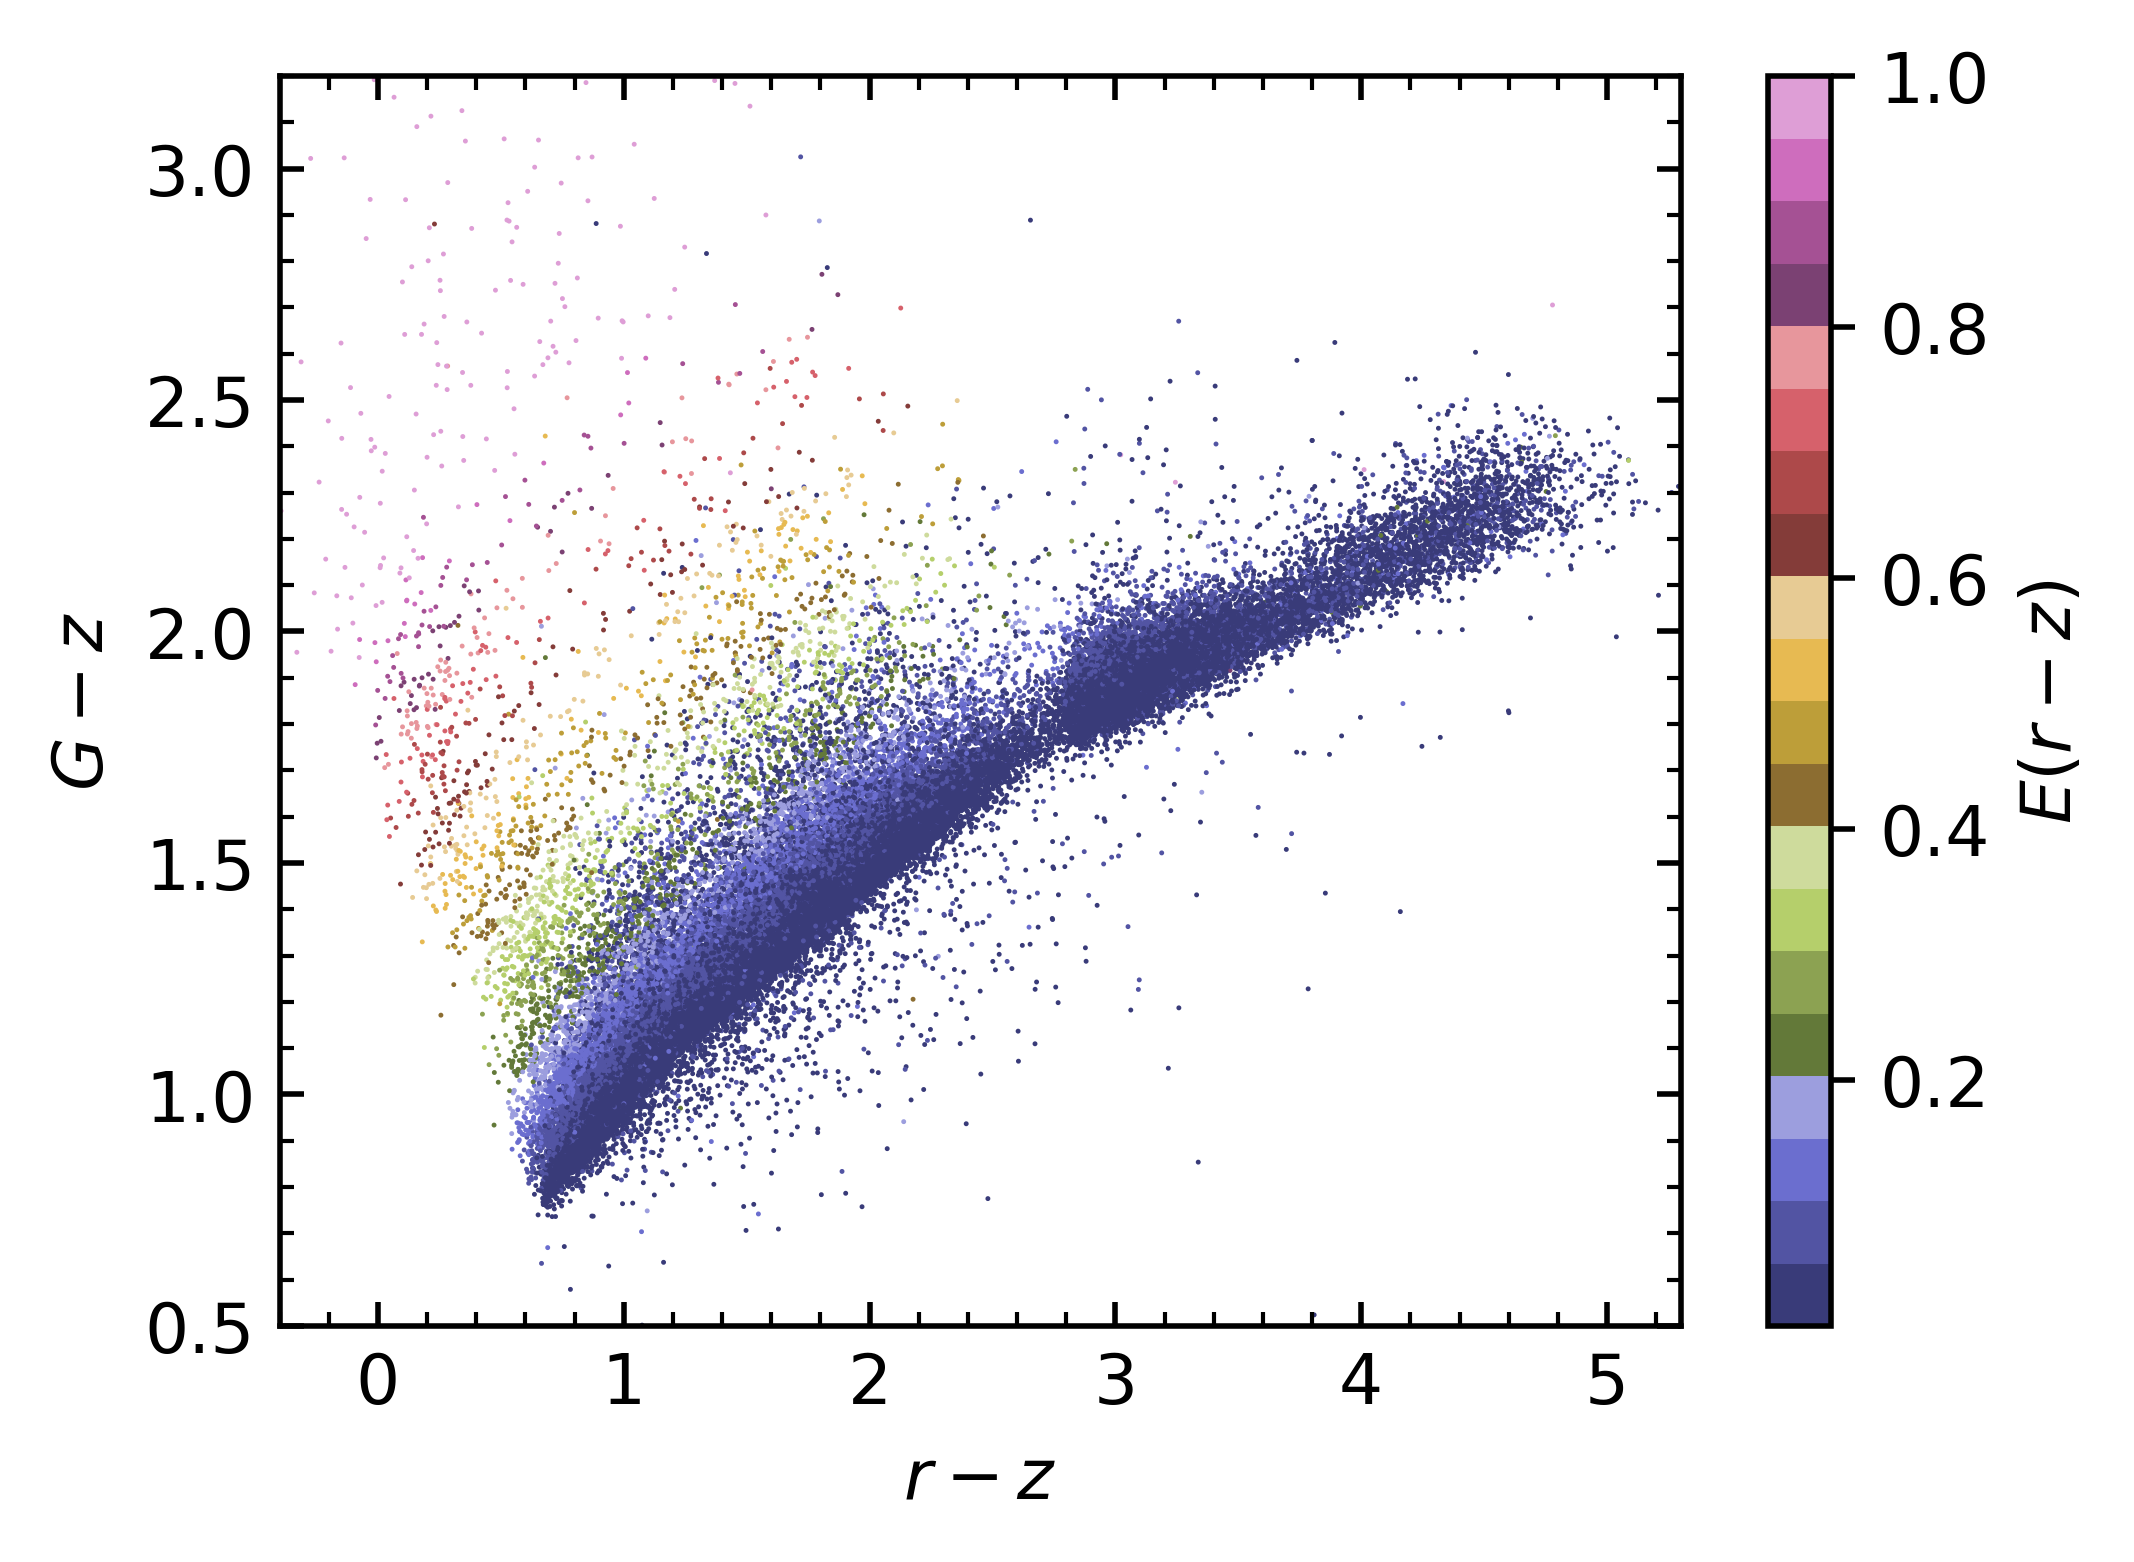
To check the goodness of the cross-matching, we examine a color-color plot of the MLDSS-GaiaDR2 sample in Figure 3. Nearly all of the stars fall along the expected locus, and the that fall off the locus are those with a high extinction correction to the SDSS magnitudes. The scatter in the color-color space is due to the lack of extinction correction applied to the magnitude, and does not indicate mismatches. Extinction corrections were not applied to the Gaia photometry in our sample because the extinction coefficients provided by the collaboration were calibrated for K and are not valid for low mass stars (Gaia Collaboration et al., 2018a).
| name | units | description |
|---|---|---|
| MJD | d | Modified julian date from SDSS |
| PLATE | Plate number from SDSS | |
| FIBER | Fiber number from SDSS | |
| solution_id | Gaia DR2 Solution Identifier | |
| designation | Unique Gaia source designation (unique across all Data Releases) | |
| source_id | Unique Gaia source identifier (unique within DR2) | |
| ref_epoch_gaia | yr | Reference epoch from Gaia DR2 |
| SPT | Spectral Type | |
| RA | deg | Right ascension in Gaia DR2 epoch |
| RA_ERR | mas | Standard error of right ascension in Gaia DR2 |
| DEC | deg | Declination in Gaia DR2 epoch |
| DEC_ERR | mas | Standard error of DEC in Gaia DR2 |
| PMRA | mas/yr | Proper motion in RA direction in Gaia DR2 |
| PMRA_ERR | mas/yr | Standard error of proper motion in RA direction in Gaia DR2 |
| PMDEC | mas/yr | Proper motion in DEC direction in Gaia DR2 |
| PMDEC_ERR | mas/yr | Standard error of proper motion in DEC direction in Gaia DR2 |
| RV | km/s | Radial velocity from MLSDSS |
| RV_ERR | km/s | Radial velocity error from MLSDSS |
| RA_SDSS | deg | Right ascension in SDSS photometric object |
| DEC_SDSS | deg | Declination in SDSS photometric object |
| PSFMAG | mag | SDSS photometry -bands |
| PSFMAG_ERR | mag | SDSS photometry -bands errors |
| GOODPHOT_SDSS | Good photometry flag for SDSS riz-bands | |
| EXTINCTION | mag | Extinction coorection for -bands (, , , , ) |
| PMRA_SDSS | mas/yr | Proper motion in RA direction in MLSDSS |
| PMRA_ERR_SDSS | mas/yr | Proper motion error in RA direction in MLSDSS |
| PMDEC_SDSS | mas/yr | Proper motion in DEC direction in MLSDSS |
| PMDEC_ERR_SDSS | mas/yr | Proper motion error in DEC direction in MLSDSS |
| GOODPM_SDSS | Good proper motion flag for MLSDSS (1=good proper motion) | |
| MJD_2MASS | d | Modified julian date from 2MASS |
| RA_2MASS | deg | Right ascension in 2MASS |
| DEC_2MASS | deg | Declination in 2MASS |
| MAG_2MASS | mag | 2MASS photometry -bands |
| MAG_ERR_2MASS | mag | 2MASS photometry -bands error |
| ACTHA | Active flag (1=active, 0=inactive) | |
| EWHA | Angstrom | Equivalent width |
| EWHA_ERR | Angstrom | Equivalent width error |
| LHALBOL | Fractional luminosity | |
| LHALBOL_ERR | Fractional luminosity error | |
| GOODMATCH | Good matches with Gaia DR2 (1=good, 0=probable mismatch) | |
| parallax | mas | Parallax in Gaia DR2 |
| parallax_error | mas | Standard error of parallax in Gaia DR2 |
| astrometric_n_good_obs_al | Number of good observations AL | |
| astrometric_chi2_al | AL chi-square value | |
| visibility_periods_used | Number of visibility periods used in Astrometric solution | |
| phot_g_mean_flux | electron/s | -band mean flux |
| phot_g_mean_flux_error | electron/s | Error on -band mean flux |
| phot_g_mean_flux_over_error | electron/s | -band mean flux divided by its error |
| phot_g_mean_mag | mag | -band mean magnitude |
| phot_bp_mean_flux | electron/s | Integrated mean flux |
| phot_bp_mean_flux_error | electron/s | Error on the integrated mean flux |
| phot_bp_mean_flux_over_error | electron/s | Integrated mean flux divided by its error |
| phot_bp_mean_mag | mag | Integrated mean magnitude |
| phot_rp_mean_flux | electron/s | Integrated mean flux |
| phot_rp_mean_flux_error | electron/s | Error on the integrated mean flux |
| phot_rp_mean_flux_over_error | electron/s | Integrated mean flux divided by its error |
| phot_rp_mean_mag | mag | Integrated mean magnitude |
| phot_bp_rp_excess_factor | BP/RP excess factor | |
| r_est | pc | B-J estimated distance |
| r_lo | pc | B-J lower bound on the confidence interval of the estimated distance |
| r_hi | pc | B-J upper bound on the confidence interval of the estimated distance |
| r_len | pc | B-J length scale used in the prior for the distance estimation |
| V_R | km/s | Mean radial component of the velocity |
| V_R_ERR | km/s | Standard deviation of radial component of the velocity |
| V_T | km/s | Mean tangential component of the velocity |
| V_T_ERR | km/s | Standard deviation of tangential component of the velocity |
| V_Z | km/s | Mean vertical component of the velocity |
| V_Z_ERR | km/s | Standard deviation of vertical component of the velocity |
| J_Z | kpc km/s | Median vertical action |
| J_Z_16per | kpc km/s | 16th percentile vertical action |
| J_Z_64per | kpc km/s | 64th percentile vertical action |
| WDM | White dwarf-M dwarf binary flag (1=binary, 0=not binary) | |
| astrometric_sample | Astrometric subsample (1=good astrometry, 0=bad astrometry) | |
| photometric_sample_subg | Sub G subsample (1=goodphot, 2=outlier, 0=badphot) | |
| photometric_sample_subred | Sub Red subsample (1=goodphot, 2=outlier, 0=badphot) | |
| photometric_sample_submix | Sub Mix subsample (1=goodphot, 2=outlier, 0=badphot) |
Note. — Columns of the MLSDSS-GaiaDR2 sample of M and L dwarfs, including the matches with Gaia DR2. The table is available as a FITS table as a supplementary file. We include name of the columns, units and a brief description.
2.3 Quality Cuts
To ensure the cleanest possible sample of Gaia DR2 M and L dwarfs, we investigated optimal quality cuts for the photometric and astrometric data. The quality cuts in the Gaia Papers (e.g. Lindegren et al., 2018; Evans et al., 2018; Arenou et al., 2017; Gaia Collaboration et al., 2018a) are so conservative that they remove good quality data for faint, red stars at the end of the main sequence. As as result, we modified the suggested cuts to adapt them for M and L dwarfs, the faintest stars in Gaia DR2. We describe these cuts in the following subsections.
2.3.1 Astrometric Quality Cuts
The quality of the five-parameter solution (ra, dec, pmra, pmdec and parallax) given by Gaia DR2 depends on factors such as the magnitude of the source, the number of observations per source, neighboring sources, and the type of source (Lindegren, 2018). We describe below how we defined astrometric cuts for the MLSDSS-GaiaDR2 sample to obtain the best quality five-parameter solution. The astrometric cuts we used to clean the MLSDSS-GaiaDR2 sample are summarized in Table 2 and described below.
| Flag | Cut | removed by | after |
|---|---|---|---|
| single cut | cumulative cuts | ||
| start=67,573 | |||
| PE | 40,801 | ||
| VP | 8,166 | ||
| UWE | UWE | 2,582 |
Note. — Astrometric quality cuts applied to the MLSDSS-GaiaDR2 sample. The Flag column contains the name of the cut we use in this paper; Cut indicates the name of the column in the catalog and the criterion applied; N removed by Single Cut shows the number of stars removed by only that cut; and N after Cumulative cuts shows the number of stars left after applying that cut and the ones listed above it. Objects included in the astrometric sample are indicated with the flag .
To ensure accurate parallaxes (mean uncertainty mas) we applied the quality cut suggested by Lindegren et al. (2018): (abbreviated as PE from here on). This cut conservatively removes poor astrometric solutions and reduces our sample by , removing stars.
The number of Gaia observations included in each astrometric solution is an indicator of reliable astrometric data and is indicated in the visibility_periods_used field, abbreviated as VP from here on. As suggested in Gaia Collaboration et al. (2018a), we selected stars with to restrict our sample to stars with enough observations to produce reliable astrometric solutions. This removes stars from the original MLSDSS-GaiaDR2 sample, leaving stars when applied after the PE cut (see Table 2).
To remove poor astrometric solutions generated by binary stars and double stars, we also applied an astrometric cut based on the residual of the fit of the single star astrometric solution. The “unit weight error” (UWE) is a reduced statistic and reflects the goodness of fit (Arenou et al., 2017; Lindegren et al., 2018). The square of the UWE is calculated as
| (1) |
where and is the degree of freedom where is the total number of good observations of the source. Lindegren et al. (2018) found that a good astrometric solution corresponds to UWE and suggest a cut:
| (2) |
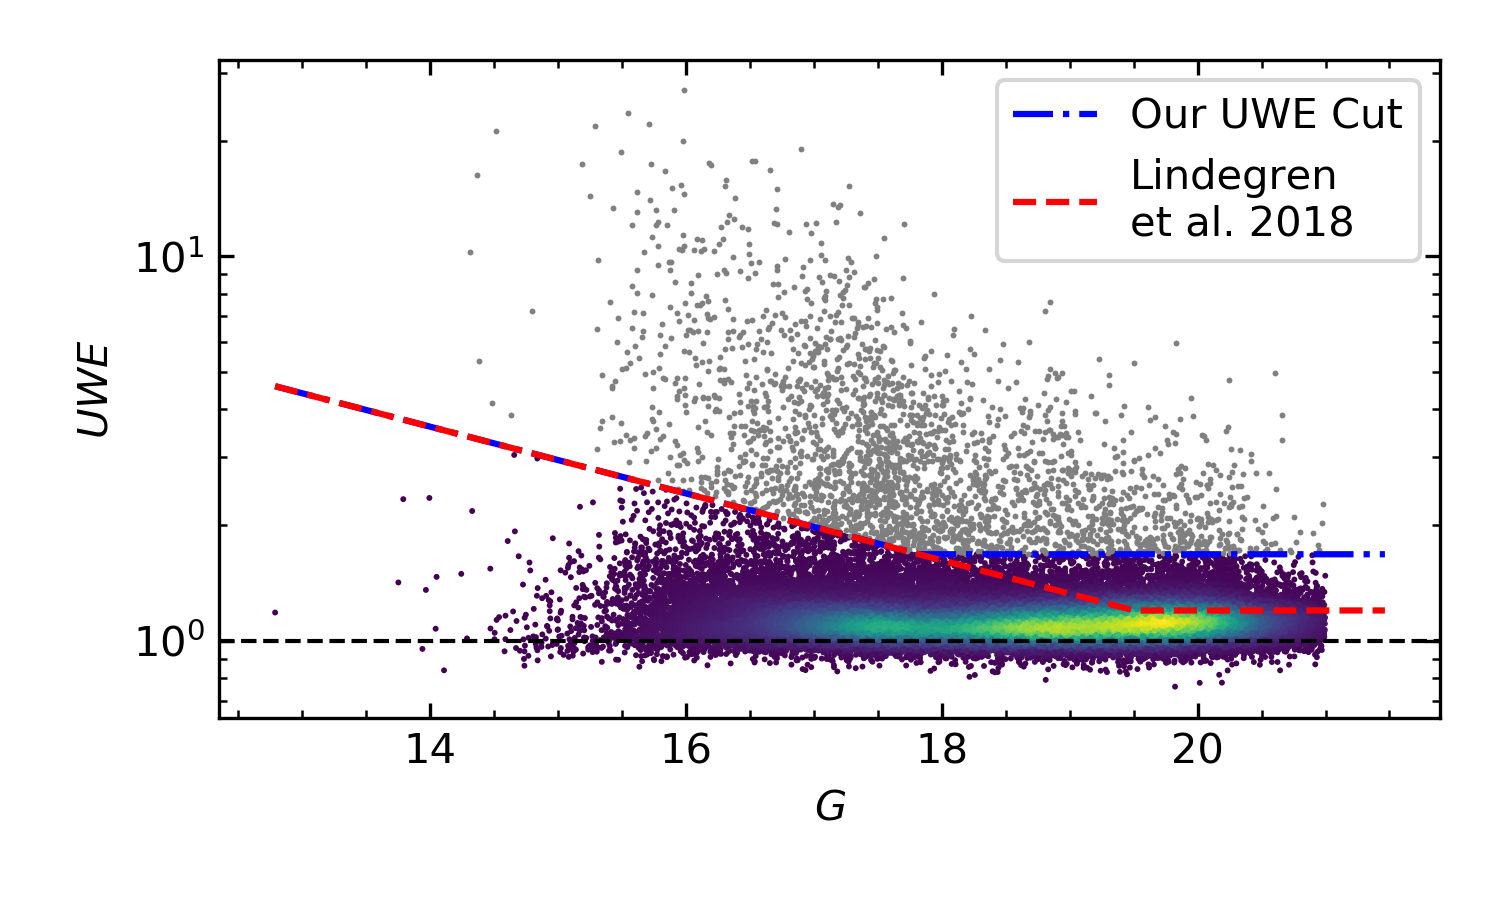
We show UWE as a function of magnitude in Figure 4. The cut suggested by Lindegren et al. (2018), shown as a red dashed line, removes a high number of faint stars () even though they have a good astrometric fit (UWE). We wanted to retain faint stars for our sample of M and L dwarfs and future analysis, so we defined a new cut and increase the maximum UWE tolerance for faint stars from 1.2 to 1.68:
| (3) |
represented in a blue dashed-dotted line in Figure 4. This new cut matches the Lindegren et al. (2018) through and includes an extra stars with also having a good astrometric solution. Applying this cut removes stars from the original MLSDSS-GaiaDR2 sample, leaving stars when applied after the PE and VP cuts (see Table 2).
An alternative to this cut is described in the Technical Note by Lindegren (2018), where they define a new quantity called the re-normalized UWE, or RUWE. Because the UWE is necessarily dependent on the color and magnitude of each star, the RUWE is designed to make a quality cut in the data that is relatively complete in color and magnitude. This is calculated by dividing UWE by a different normalization factor for each color and magnitude bin, which accounts for the fraction of good and bad data in each bin. We did not intend our sample to be complete in color and/or magnitude, and applying a cut on the RUWE removes more stars than Equation 3, so we did not use RUWE in our quality cuts.
.
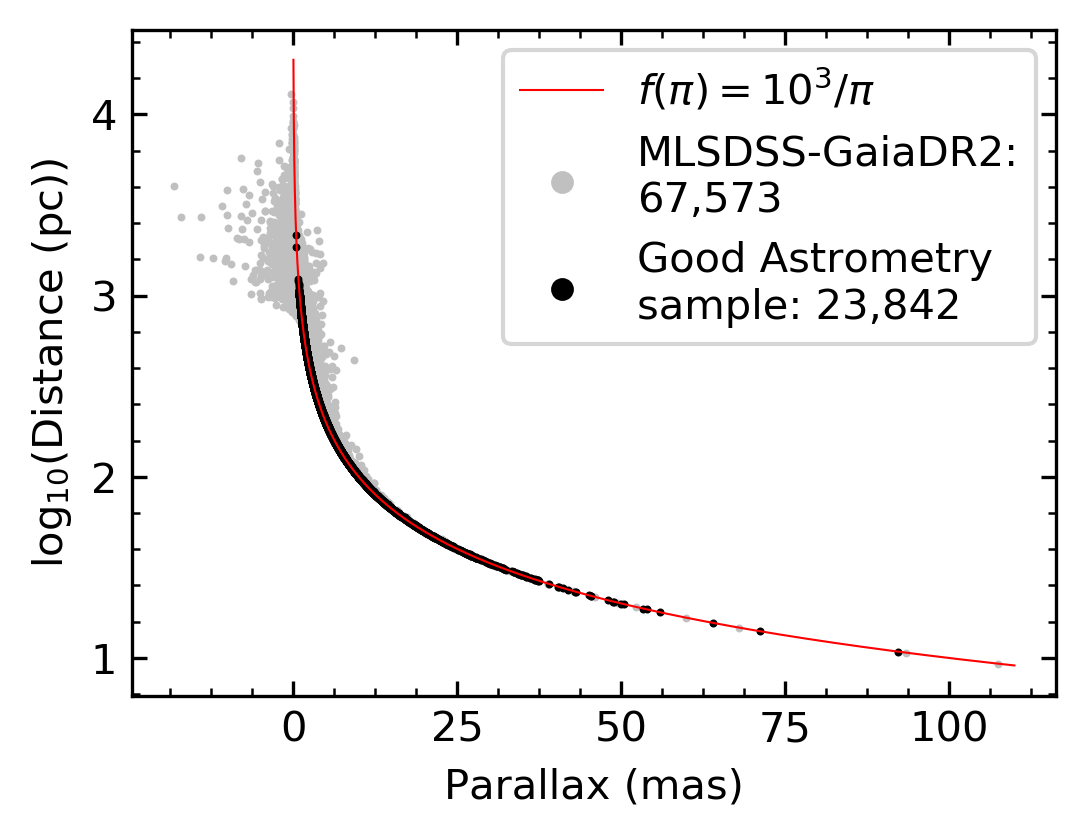
Once the three astrometric cuts summarized in Table 2 are applied, the MLSDSS-GaiaDR2 sample contains stars with good astrometry. As a way of verifying our astrometric cuts, we cross-matched MLSDSS-GaiaDR2 with the Bailer-Jones et al. (2018) catalog that uses an inference procedure to account for the non linearity of for computing distances. If our astrometric cuts are valid, the distances calculated as with MLSDSS-GaiaDR2 should be the same as in the Bailer-Jones et al. (2018) catalog. We plot parallaxes from our sample against Bailer-Jones et al. (2018) distances in Figure 5 and confirm that the parallaxes selected by our cuts follow the formula relating parallax and distance, , where is the parallax in mas. This indicates that the quality of the astrometry in our final sample is excellent. Objects included in the astrometric sample are indicated with the flag in the FITS file.
.
2.3.2 Photometric Quality Cuts for Gaia bands
Given that the MLSDSS-GaiaDR2 sample contains predominantly faint and red stars, we also implemented several photometric cuts described below to ensure a sample without contamination and suitable for detailed color analysis. The cuts and the resulting subsamples are summarized in Table 3 and described below.
| Subsample | Cut expression | Stars |
|---|---|---|
| start = 23,842 | ||
| (1) Sub G | astrometric cuts | |
| + | ||
| only when | ||
| (2) Sub Red | (1) + | |
| (3) Sub Mix | (2) + |
Note. — Photometric quality cuts applied to the good astrometry sample (Section 2.3.1). The column Subsample indicates the name of the subsample used in this paper; the Cut expression indicates the name of the column in the catalog and the cuts that were made over that column; and N Stars indicates the number of stars in each subsample. Objects in the subsamples are indicated with the flags, , and , respectively.
.
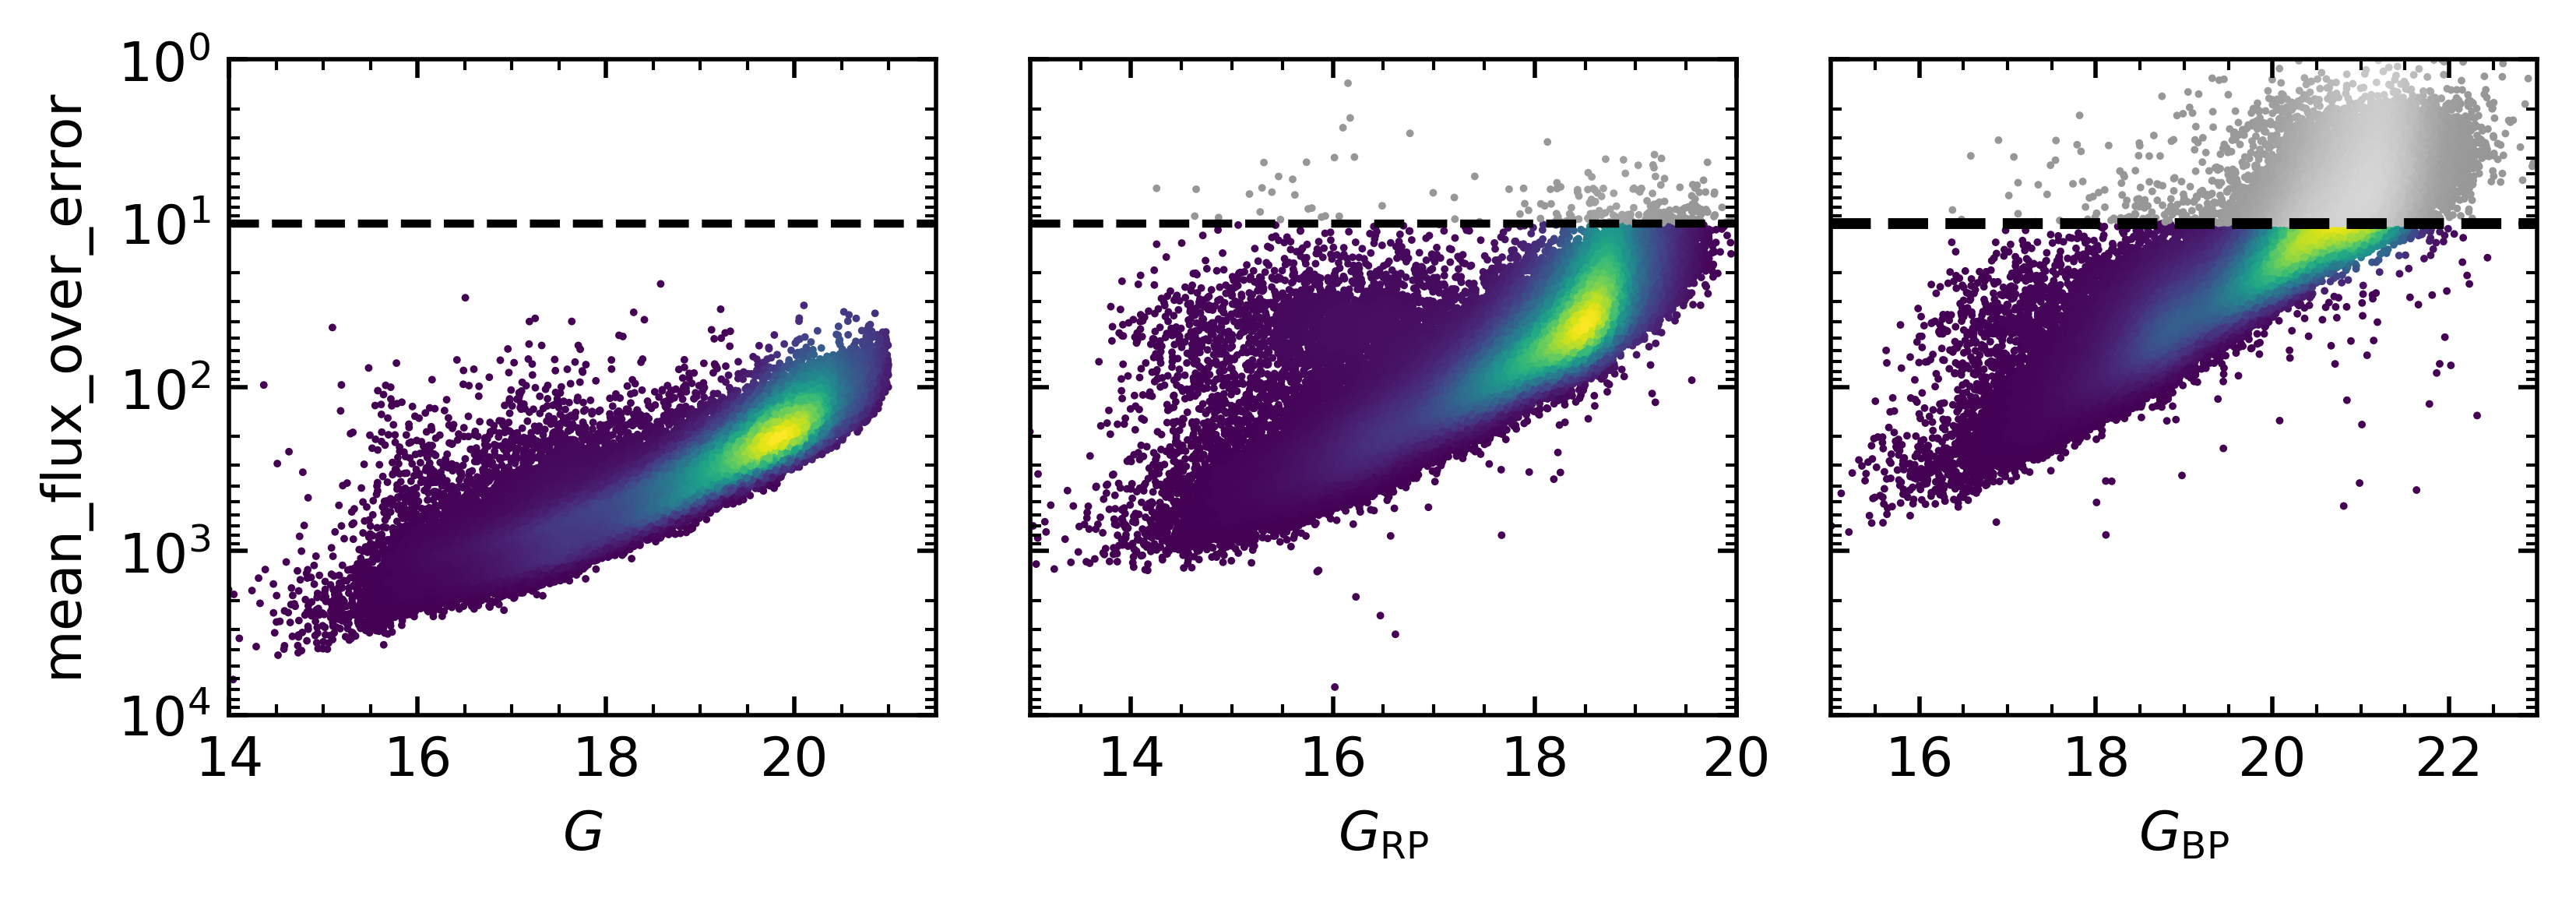
To ensure accurate Gaia photometry (signal-to-noise ratio ) we applied cuts based on the signal-to-noise ratio (SNR) for the flux in the three Gaia bands, ( nm), ( nm), and ( nm). We show the mean flux over error for these three bands in Figure 6. Gaia DR2 contains a column with the SNR value for each band. Lindegren et al. (2018), in their Appendix C, suggest combining the cuts over SNR for the blue and red band ( and respectively): and . The suggested cut for the blue Gaia band removes a significant number of stars from the MLSDSS-GaiaDR2 sample, while the same cut in the red band only removes a handful of stars. This is expected because M and L dwarfs emit most of their flux at red wavelengths, so they are faint in the blue band. If we follow the suggestion made by Lindegren et al. (2018) and combine the cuts for the red and blue bands, we would remove stars that have SNR10 in , but SNR10 in . Furthermore, all the stars in the MLSDSS-GaiaDR2 sample have SNR10 in the band as we show in the left panel in Figure 6. In particular, the stars that have low-quality blue photometry, but high-quality red photometry, , have also good photometry. To maximize the number of stars available for each band with high SNR photometry, we created three subsamples: in the first subsample (Sub G) we did not apply any SNR cuts, only the photometry is necessarily SNR10; in the second subsample (Sub Red) we applied the SNR cut in the red band (), resulting in good and photometry; and in the third subsample (Sub Mix) we applied the SNR cut to both the red and blue bands so, therefore, it contains SNR10 photometry in , and bands. The summary of these subsamples is presented in Table 3. Objects in the subsamples are indicated with the flags, , and , respectively.
.
The last source of photometric inaccuracy relevant to our sample is contamination generated by neighbouring sources. As explained in Evans et al. (2018), the wavelength ranges of the and passbands overlap slightly. Therefore, the excess ratio defined as the flux ratio , where is the flux in the band indicated by the subindex, should be only slightly greater than . This quantity is indicated in Gaia DR2 in the column phot_bp_rp_excess_factor. Evans et al. (2018) and Arenou et al. (2017) suggest the following criteria to select stars with uncontaminated photometry:
| (4) |
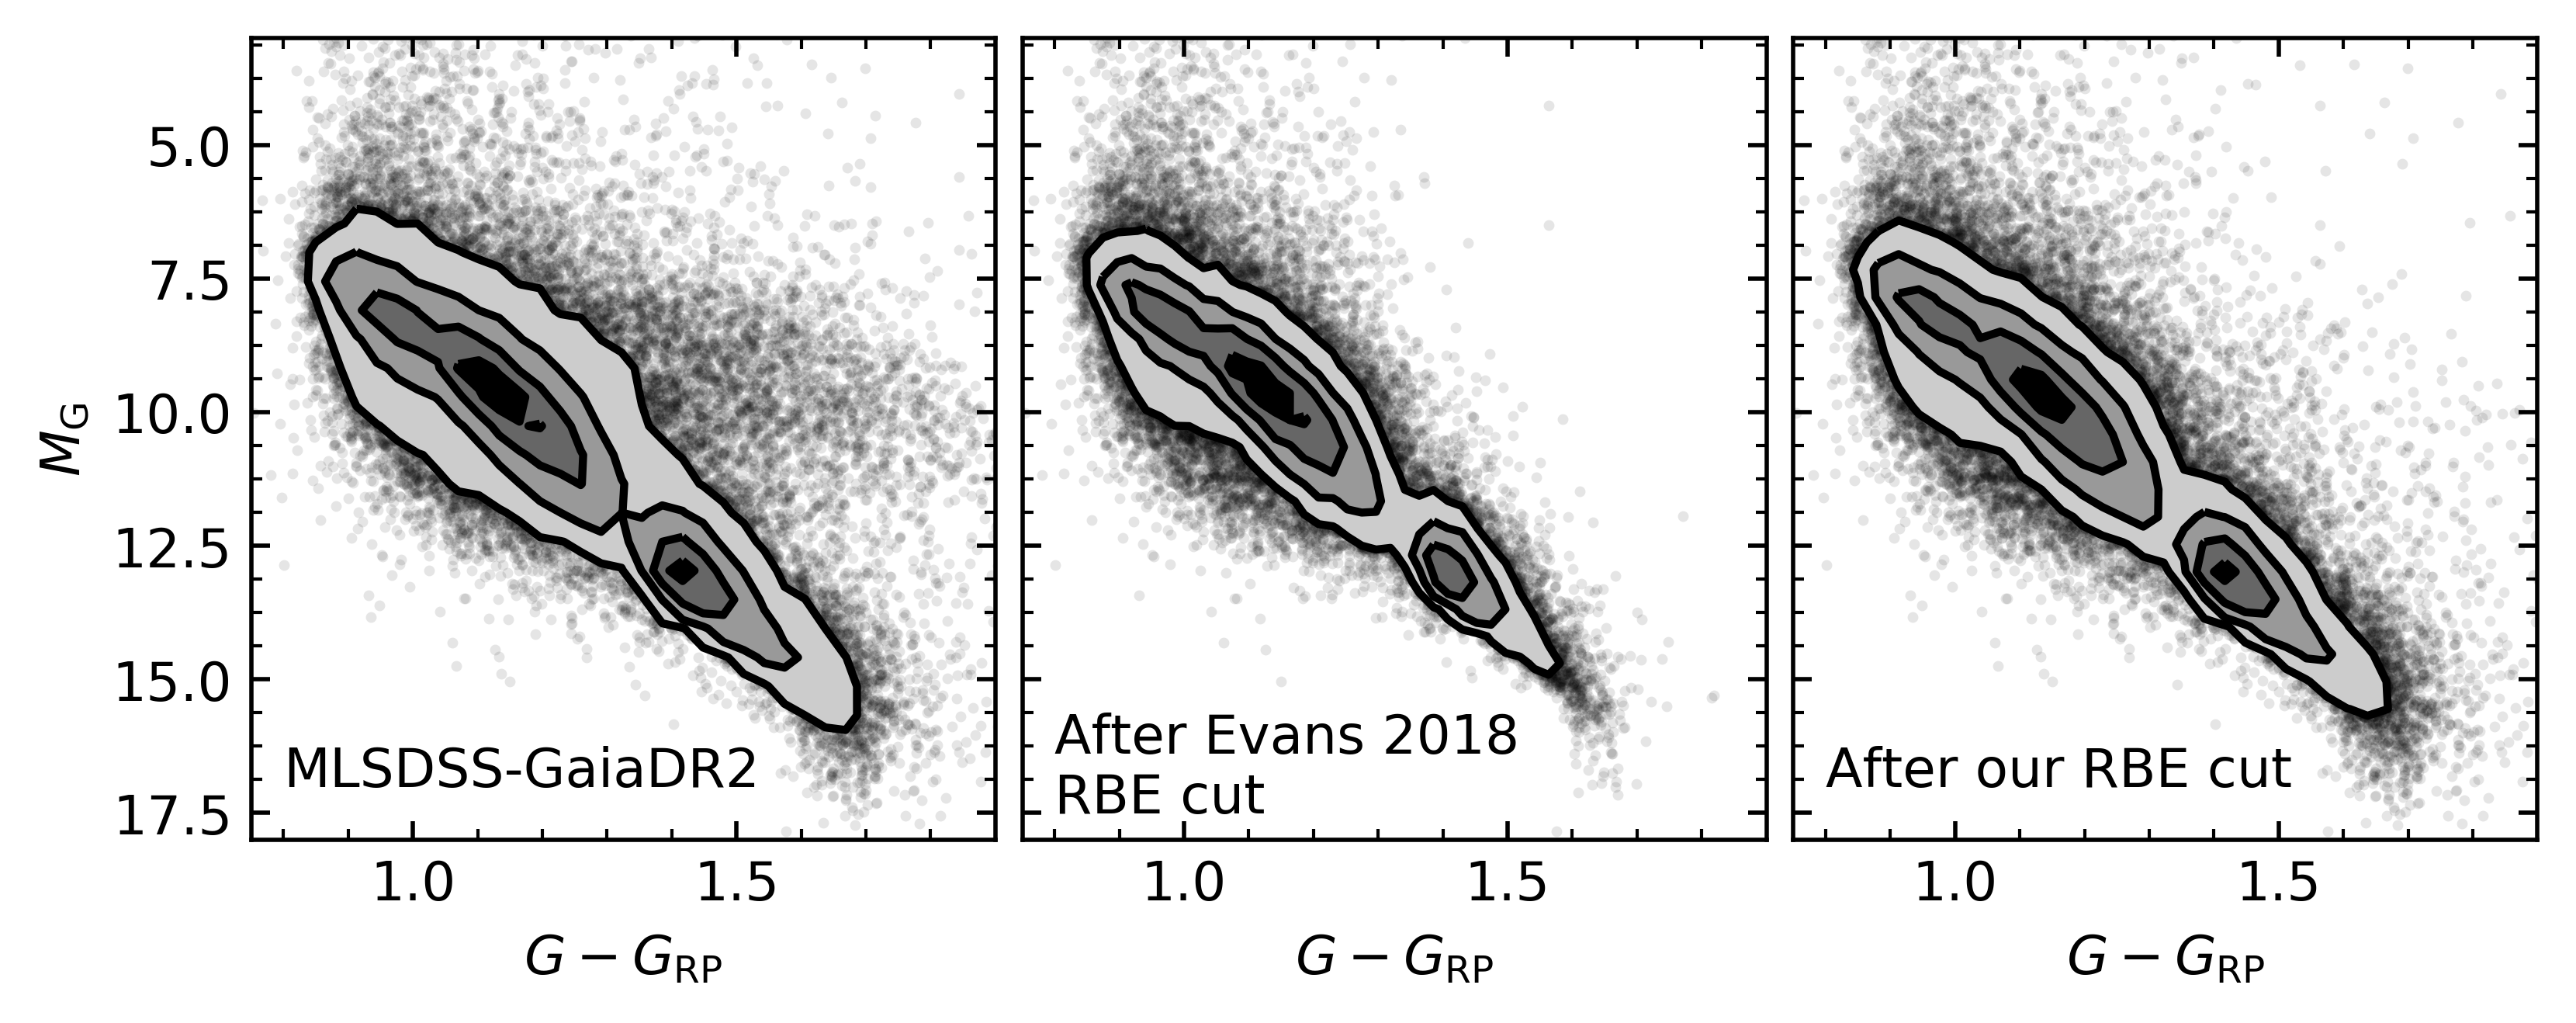
The cut in Equation 4 selects the stars for which the excess factor , is close to . However, it depends on accurate photometry, which is not available for our faint, red stars. Accordingly, the excess factor increases for fainter stars as a function of the three bands. We examine this cut in the color–magnitude diagram shown in Figure 7. If we apply the cut suggested by Evans et al. (2018) to the MLSDSS-GaiaDR2 sample, it removes the spurious data shown in Figure 7 (left panel has no cuts and the middle panel has these cuts applied). However, it also removes stars at the bottom of the main sequence that we are interested in keeping for future analysis because they have good and photometry. To reduce the number of high quality stars being eliminated for conservative values that generate a large excess factor, we applied the cut on the excess factor in Equation 4 only when the blue photometry is good (, abbreviated as RBE cut hereon). After adding this condition, the new cut to MLSDSS-GaiaDR2 removes significantly fewer main sequence stars (right panel of Figure 7). We applied this cut over the excess factor for the three subsamples as indicated in Table 3.

.
The final spectral type distribution for the three photometric subsamples is shown in Figure 8 compared to the entire MLSDSS, MLSDSS-GaiaDR2, and astrometric samples. Comparing the MLSDSS and the MLSDSS-GaiaDR2 samples, a significant difference can be observed in the number of late M and L dwarfs because Gaia DR2 does not contain the faintest stars, so we could not find a match for all MLSDSS objects. The Sub G and Sub Red subsamples are similar to the astrometric sample because high quality G photometry is necessary for the astrometric sample, and only a few stars have low SNR in . The distribution changes significantly for the Sub Mix subsample because the SNR cut for removed all the L dwarfs and many late-M dwarfs.
To validate all the quality cuts we defined, we plot the color–magnitude diagrams for as a function of the three Gaia colors (, and ) with and without the previously discussed astrometric and photometric cuts in Figure 9. The photometric cuts remove dramatic outliers in color and magnitude space in each color and magnitude combination, indicating that they have reliably selected good quality photometry. Due to the low quality of the band for the reddest, faintest stars, there is a higher density of red stars in the Sub Red subsample shown on the diagram. Those stars fall below the main sequence for and in the color–magnitude diagrams without quality cuts applied (Top panels of Figure 9).


3 Gaia DR2 colors and absolute magnitudes of M and L dwarfs
Characterizing the relationships between spectral types and both colors and absolute magnitudes facilitates the classification of new objects and aids in the identification of interesting outliers. Therefore we used the MLSDSS-GaiaDR2 sample with good photometry and astrometry described in Section 2 to calculate Gaia DR2 mean colors and absolute magnitudes for M and early-L dwarfs as a function of spectral subtype. The stellar locus in color-color space is also an important tool to classify stars and identify sources of contamination, so we examined the SDSS-2MASS-Gaia stellar locus for M and L dwarfs. Finally we plotted the color–magnitude diagram using Gaia bands to study fundamental properties of the stars.
3.1 Mean Colors with Gaia DR2
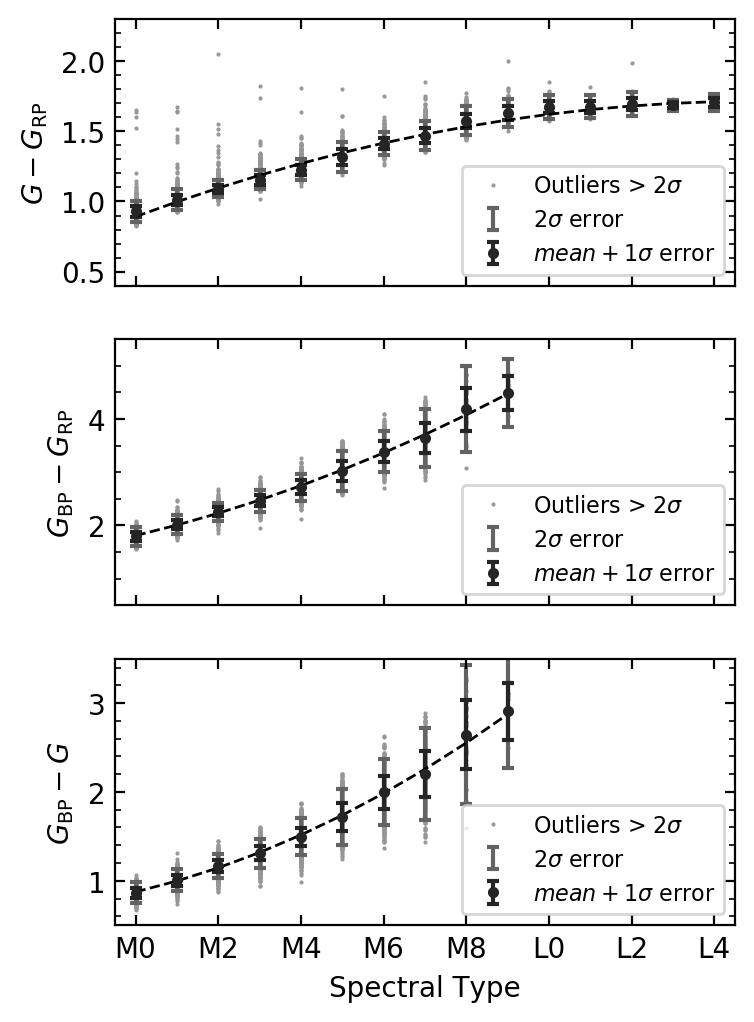
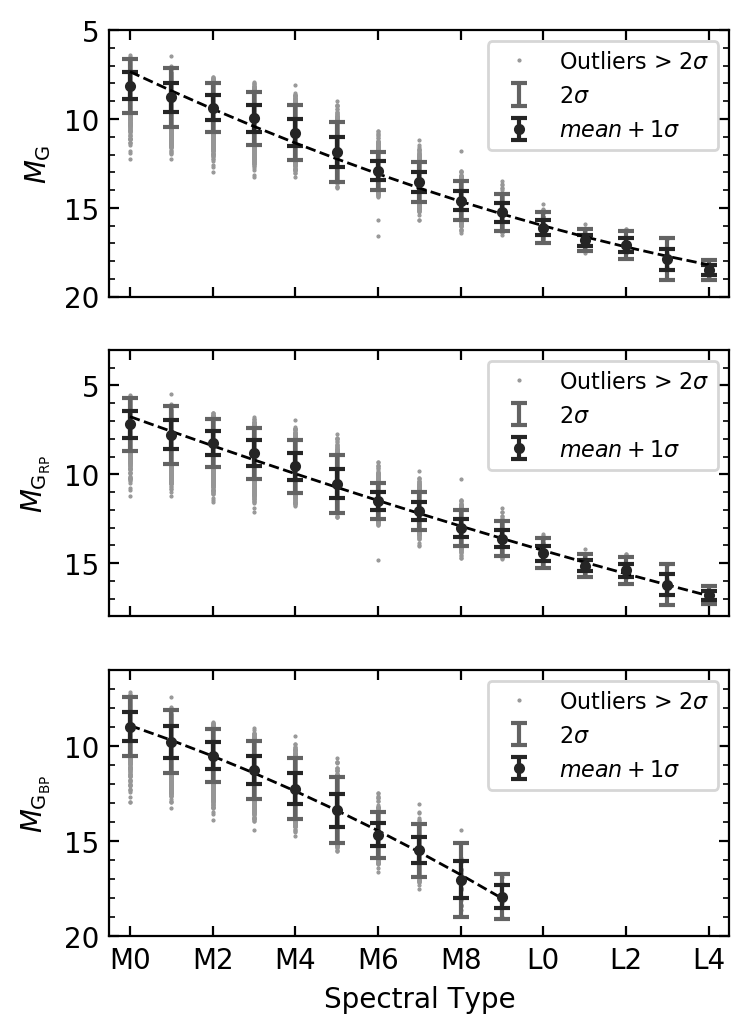
Quantifying the correlation between the new Gaia colors and spectral type is essential to classify new objects and detect outliers. We calculated Gaia DR2 mean colors as a function of spectral type for using the Sub Red sample and and using the Sub Mix sample (See Section 2.3.2). We removed stars with extinction correction to avoid photometry contaminated by dust in front of the star. The resulting means and standard deviations are shown in Figure 10 and enumerated in Table 4. We fit a second degree polynomial to the mean color values as a function of spectral type (shown in Figure 10) and give the best fit parameters in Table 5, where is the standard deviation of the stars in each bin, which was used to weight the fit. We calculated mean values for M0–L4 for the color, and for M0–M9 for the other two colors because L dwarfs are too faint in the band and did not pass the quality cuts defined in Section 2.3.
The color has the tightest relation to spectral type, as shown in the top left panel in Figure 10. The and colors have a tight relation for M0 to M7 stars, however, the dispersion increases for later spectral types. Therefore we conclude the color is the best proxy for spectral type for late-M and L dwarfs in the Gaia bands.
The color locus in Figure 10 has of its most extreme outliers redward (above) of the mean. These outliers have good photometry in and bands according to the quality cuts described in Section 2.3.2, but they have low signal-to-noise fluxes in the blue band, (). Inspection of the images of these dwarfs showed that they are binaries or have a close neighbor, which might be causing the excess in the color. These objects were not removed by the excess cut made in Section 2.3 because they have low SNR photometry. By studying the images, we also confirmed that they were not mismatches. Furthermore, we could not find any peculiarities by plotting these objects in color-color plots for SDSS colors. We concluded the color excess is likely due to contamination in the band and we removed them from the analysis. In the MLSDSS-GaiaDR2 sample, these objects are indicated as , and .
| SpT | ||||||||||||||||||
|---|---|---|---|---|---|---|---|---|---|---|---|---|---|---|---|---|---|---|
| N | mean | N | mean | N | mean | N | mean | N | mean | N | mean | |||||||
| M0 | 1600 | 0.93 | 0.04 | 1599 | 1.79 | 0.09 | 1599 | 0.87 | 0.06 | 1620 | 8.13 | 0.76 | 1600 | 7.2 | 0.74 | 1599 | 8.99 | 0.78 |
| M1 | 1473 | 1.01 | 0.04 | 1468 | 2.02 | 0.09 | 1468 | 1.0 | 0.06 | 1506 | 8.78 | 0.83 | 1473 | 7.76 | 0.82 | 1468 | 9.78 | 0.84 |
| M2 | 2937 | 1.09 | 0.03 | 2934 | 2.25 | 0.09 | 2934 | 1.16 | 0.07 | 2989 | 9.35 | 0.69 | 2937 | 8.26 | 0.67 | 2934 | 10.51 | 0.7 |
| M3 | 3651 | 1.16 | 0.03 | 3624 | 2.46 | 0.1 | 3624 | 1.31 | 0.08 | 3698 | 9.97 | 0.74 | 3651 | 8.81 | 0.72 | 3624 | 11.27 | 0.75 |
| M4 | 2855 | 1.23 | 0.04 | 2790 | 2.72 | 0.13 | 2790 | 1.49 | 0.1 | 2889 | 10.77 | 0.77 | 2855 | 9.55 | 0.75 | 2790 | 12.25 | 0.8 |
| M5 | 1400 | 1.32 | 0.05 | 1131 | 3.02 | 0.19 | 1131 | 1.72 | 0.16 | 1416 | 11.86 | 0.85 | 1400 | 10.54 | 0.81 | 1131 | 13.38 | 0.87 |
| M6 | 2488 | 1.41 | 0.04 | 969 | 3.39 | 0.19 | 969 | 2.0 | 0.19 | 2510 | 12.92 | 0.53 | 2488 | 11.5 | 0.5 | 969 | 14.67 | 0.61 |
| M7 | 2645 | 1.47 | 0.05 | 527 | 3.64 | 0.27 | 527 | 2.2 | 0.26 | 2686 | 13.54 | 0.56 | 2645 | 12.07 | 0.52 | 527 | 15.48 | 0.7 |
| M8 | 1093 | 1.57 | 0.05 | 33 | 4.18 | 0.41 | 33 | 2.65 | 0.39 | 1122 | 14.6 | 0.55 | 1093 | 13.02 | 0.51 | 33 | 17.04 | 0.97 |
| M9 | 354 | 1.63 | 0.05 | 8 | 4.48 | 0.32 | 8 | 2.91 | 0.32 | 363 | 15.26 | 0.53 | 354 | 13.62 | 0.5 | 8 | 17.92 | 0.6 |
| L0 | 119 | 1.67 | 0.04 | 0 | 0 | 121 | 16.11 | 0.44 | 119 | 14.45 | 0.42 | 0 | ||||||
| L1 | 46 | 1.68 | 0.04 | 0 | 0 | 47 | 16.82 | 0.31 | 46 | 15.14 | 0.31 | 0 | ||||||
| L2 | 16 | 1.7 | 0.04 | 0 | 0 | 16 | 17.11 | 0.4 | 16 | 15.42 | 0.39 | 0 | ||||||
| L3 | 6 | 1.69 | 0.02 | 0 | 0 | 6 | 17.89 | 0.59 | 6 | 16.21 | 0.58 | 0 | ||||||
| L4 | 3 | 1.71 | 0.03 | 0 | 0 | 3 | 18.51 | 0.27 | 3 | 16.8 | 0.25 | 0 | ||||||
| L5 | 0 | 0 | 0 | 0 | 0 | 0 | ||||||||||||
| L6 | 1 | 1.77 | 0.0 | 0 | 0 | 2 | 18.92 | 0.17 | 1 | 16.98 | 0.0 | 0 | ||||||
| L7 | 0 | 0 | 0 | 0 | 0 | 0 | ||||||||||||
Note. — Number of objects included in calculation (N), mean color or magnitude, and standard deviation () of the mean.
| Band/Color | Valid Range | ||||
|---|---|---|---|---|---|
| 0.03 | M0SpTL4 | ||||
| 0.09 | M0SpTM9 | ||||
| 0.08 | M0SpTM9 | ||||
| 0.52 | M0SpTL4 | ||||
| 0.47 | M0SpTL4 | ||||
| 1.24 | M0SpTM9 |
Note. — Results from the best fit to the mean absolute magnitudes and colors as a quadratic function of spectral type, , with M0=0, M9=9, and L4=14, as shown in Figure 10
3.2 Mean Absolute Magnitudes with Gaia DR2
We used the MLSDSS-GaiaDR2 sample to calculate mean absolute magnitudes in the three Gaia DR2 bands as a function of spectral subtype of M and L dwarfs using Gaia DR2 parallaxes. We chose the appropriate photometric subsample described in Section 2.3.2 for each band: Sub G for , Sub Red for and Sub Mix for . As in the previous section, we removed stars with high extinction corrections () to minimize photometry contaminated by foreground dust. The distributions of absolute magnitudes as a function of spectral subtype are shown in Figure 10 right panels and listed in Table 4.
Note that with the parallax SNR cut applied to the astrometric subsample, we selected a maximum of uncertainty in distance, which corresponds to a maximum of mag uncertainty in absolute magnitude (, see Section 2.3 for details, Lindegren et al. 2018).
For the band, the standard deviation of the distribution of absolute magnitudes per spectral type () increases towards later spectral types as shown in Table 4. This effect is due to the higher uncertainties in the band for fainter, redder stars (M0 stars have a mean flux SNR in the blue band of and M8 of ). In the and bands, the standard deviation for late M dwarfs is one order of magnitude smaller than in the band. This is because the photometry in and bands have higher SNR than the blue band for our sample (M0 stars have a mean flux SNR in the red band of and in the band of and M8 and , respectively).
To quantify the relationship between absolute magnitude and spectral type, we fit a second degree polynomial to the mean values as a function of spectral type, shown as a black dashed line in Figure 10. We used the as a weight to perform the fit. The best fit parameters for the polynomial are given in Table 5.
While the vast majority of the sample is well-characterized by a second degree polynomial in absolute magnitude versus spectral type, there are outliers () more than away from the mean in each plot in the right panel of Figure 10. For spectral type earlier than M3, the majority of outliers are fainter than the average fit, and the opposite is the case after M3. We surmise that the scatter towards fainter absolute magnitudes for earlier spectral types is associated with low metallicity, halo or thick disk stars, while the scatter towards brighter absolute magnitudes is related to high metallicity, magnetic activity and/or unresolved binarity. We discuss the relation to age of these particular features in Section 5.
3.3 The SDSS-2MASS-Gaia M and L Dwarf Stellar Locus in Color Space
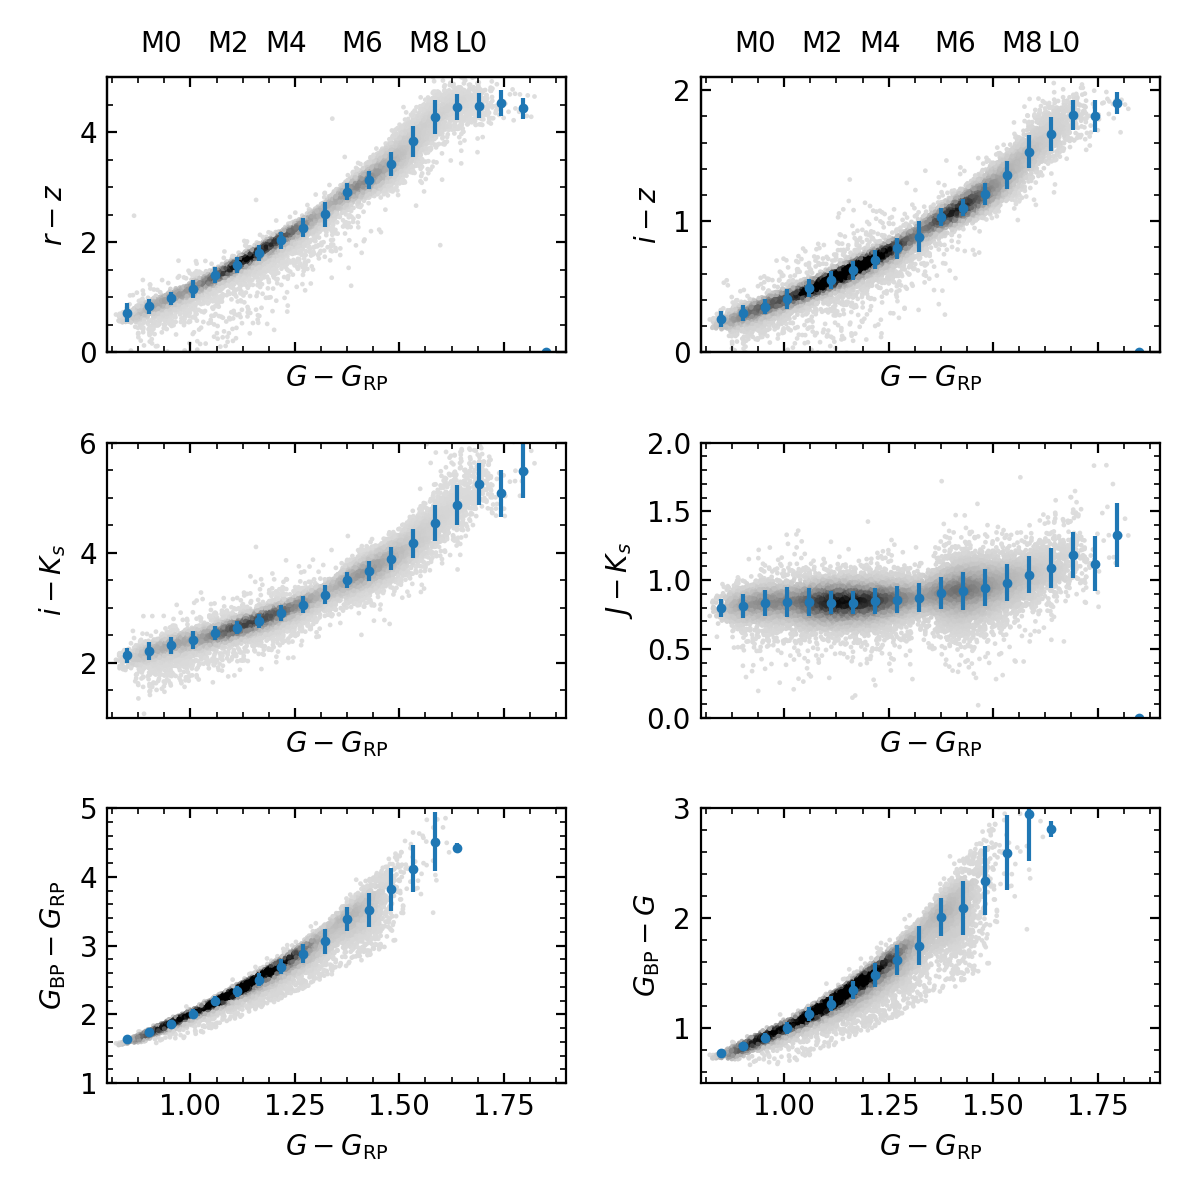
Previous work (e.g. Covey et al., 2007; Davenport et al., 2014) has shown the power of characterizing the color-color space of the stellar locus to classify stars, detect sources of contamination in a sample, and to calculate extinction corrections. A characterized stellar locus for Gaia colors of M and L dwarfs provides a continuous parametrization of color as a function of effective temperature and facilitates finding color outliers for follow up. Furthermore, incorporating photometry from other surveys provides a relation between colors that will allow us to estimate Gaia DR2 photometry for M or L dwarfs from other catalogs colors, or vice versa. We used the MLSDSS-GaiaDR2 sample which contains Gaia (, and ), SDSS (, , , and ) and 2MASS (, and ) photometry to search for an optimal characterization locus for M and L dwarfs. The characterized stellar locus is shown for , , , , and in Figure 11.
We chose as a grounding color because it has the tightest relation to spectral type (see Section 3.1). We used the appropriate photometric subsample described in Section 2.3.2 for each plot: Sub Red for , , , and Sub Mix for and . We also selected stars with good SDSS photometry using the GOODPHOT_SDSS flag (see Section 2.1 for more details on this cut), including the highest possible number of objects with good photometry in the analysis (median SNR for SDSS photometry, for 2MASS photometry, for band, for the band, for the band). We modeled the sequence using a step of for the full color range covered by M and L dwarfs ().
Most of the colors have a linear, non-zero-slope relation with . The and linear relations are consistent with previous work (Covey et al., 2007; Davenport et al., 2014; Schmidt et al., 2015). has a flat relation with for early M and a slightly positive slope for , which indicates it is not a good color to distinguish spectral type. This result is consistent with the conclusions in Schmidt et al. (2015) for . The linear relation between , , and breaks for L dwarfs at . We will discuss this break in Section 4. Finally, and have a tight linear relation with ). The low dispersion of outliers for these colors is due to the photometric cuts applied to create the subsample Sub Mix.
3.4 Gaia DR2 Color Magnitude diagrams
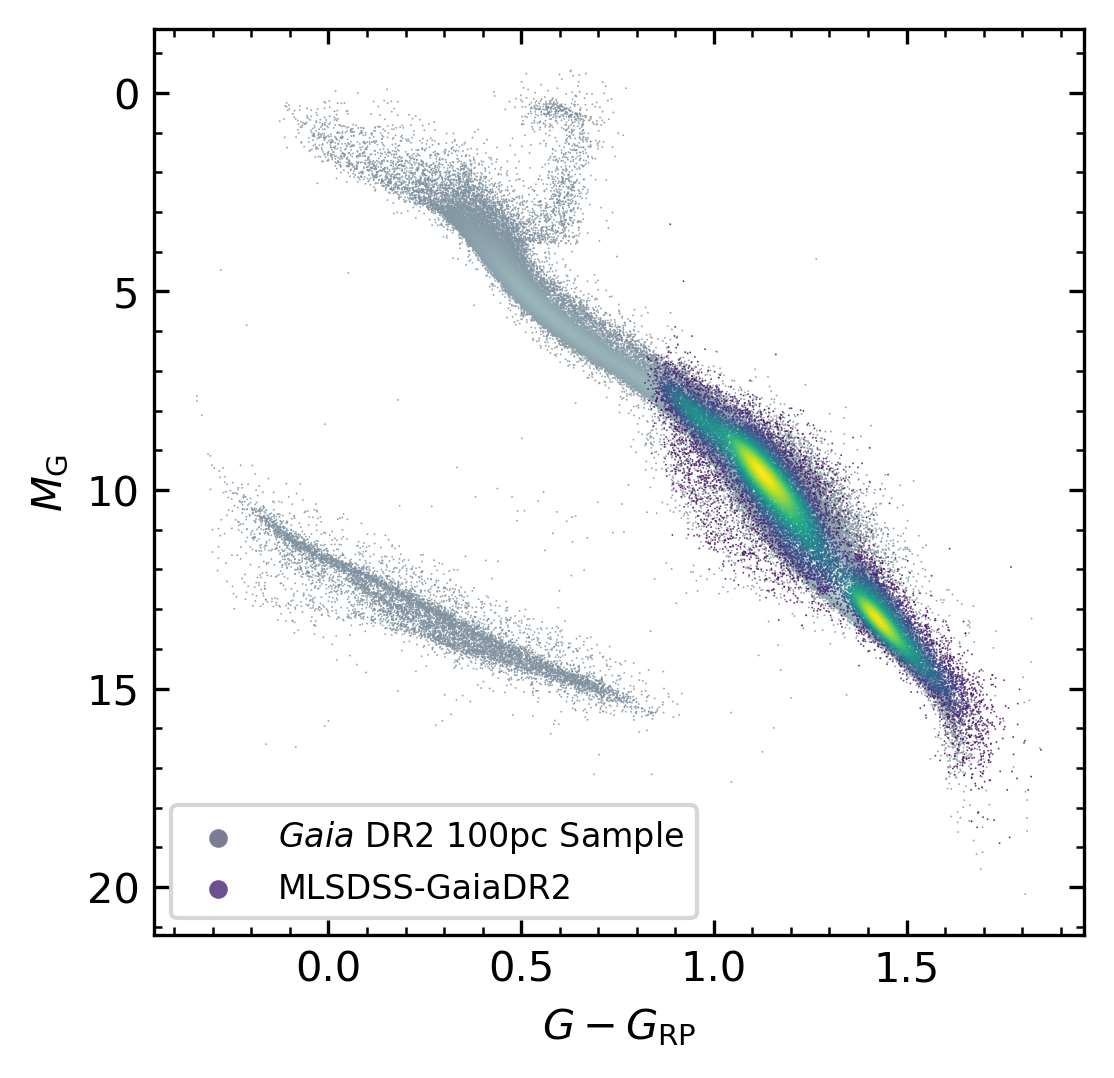
To put the MLSDSS-GaiaDR2 sample in broader stellar context, we compare it to the solar neighborhood ( pc) sample in the vs color–magnitude diagram (CMD, Figure 12). Given that we used the red Gaia color , we used the photometric subsample Sub Red to use the highest number of stars with good photometry in the analysis. We chose this color because it has the tightest relation with spectral type (see Figure 10) and we decided to use because this band has the smallest photometric error for all stars in the MLSDSS-GaiaDR2 sample (see Figure 6). The solar neighborhood sample shows the full main sequence as well as the beginning of the red giant branch and the white dwarf sequence, while M and L stars from the MLSDSS-GaiaDR2 sample fall at the faint, red end of the main sequence.
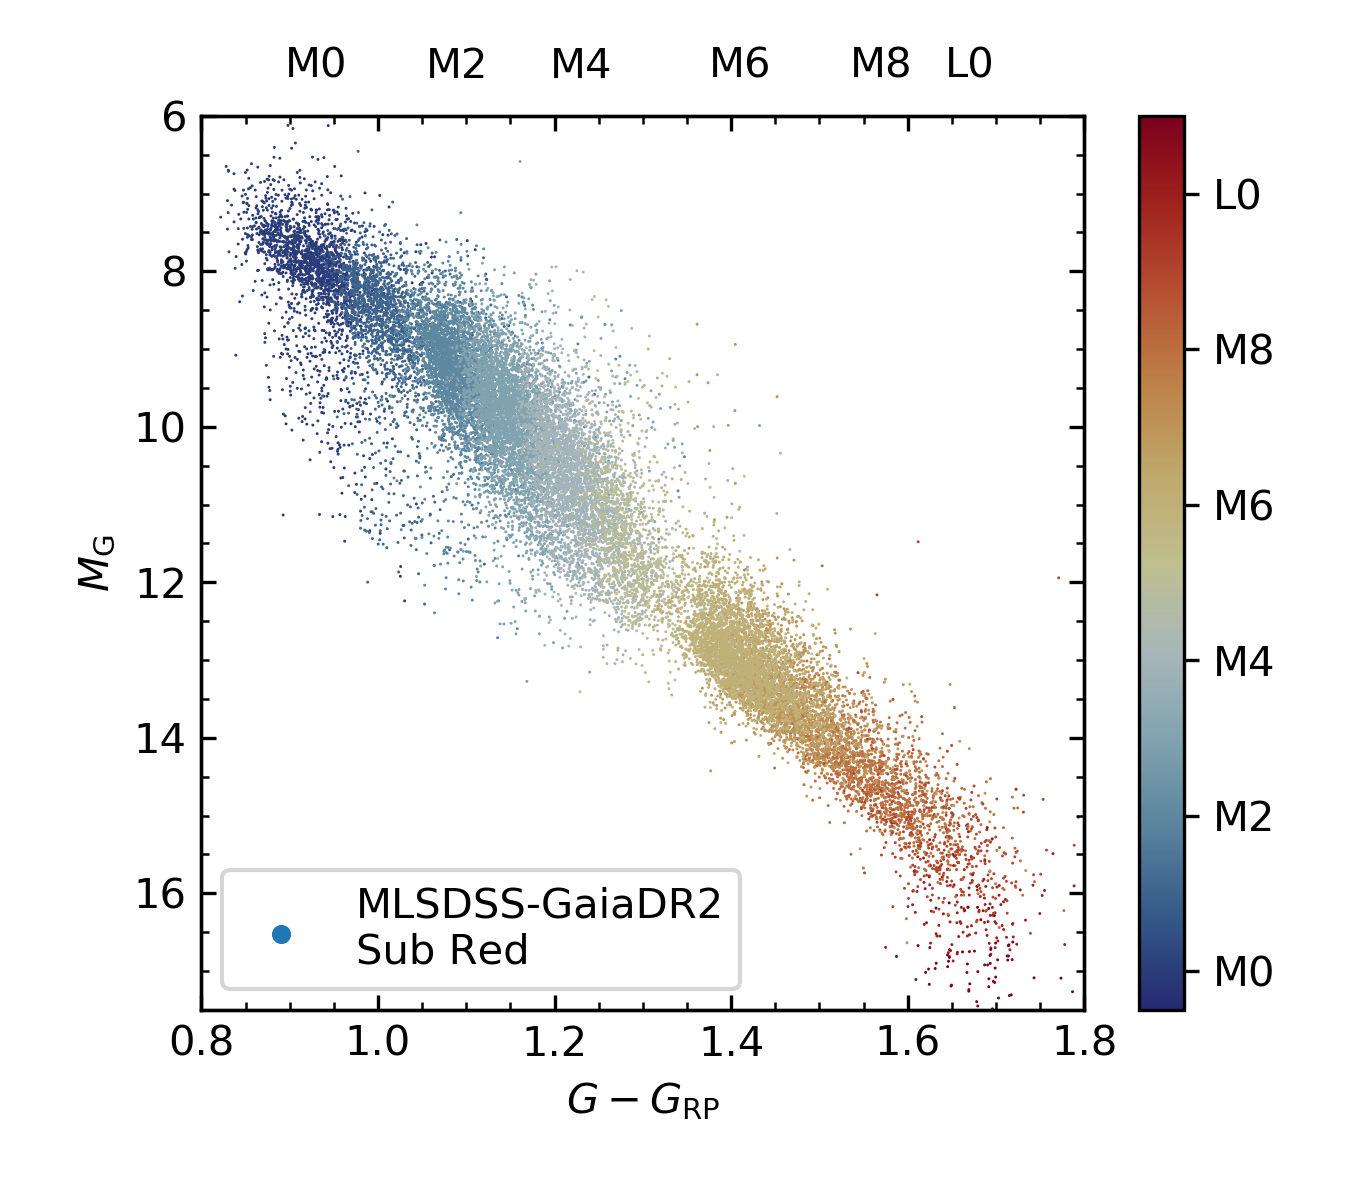
The MLSDSS-GaiaDR2 sample color–magnitude diagram is shown again in Figure 13 with SDSS spectral type color coded. Note that the gap around M5 is due to SDSS selection effects which were pointed out by West et al. (2011). In this figure, the main sequence widens for stars fainter than . This effect could be related to the transition into fully convective low mass stars.
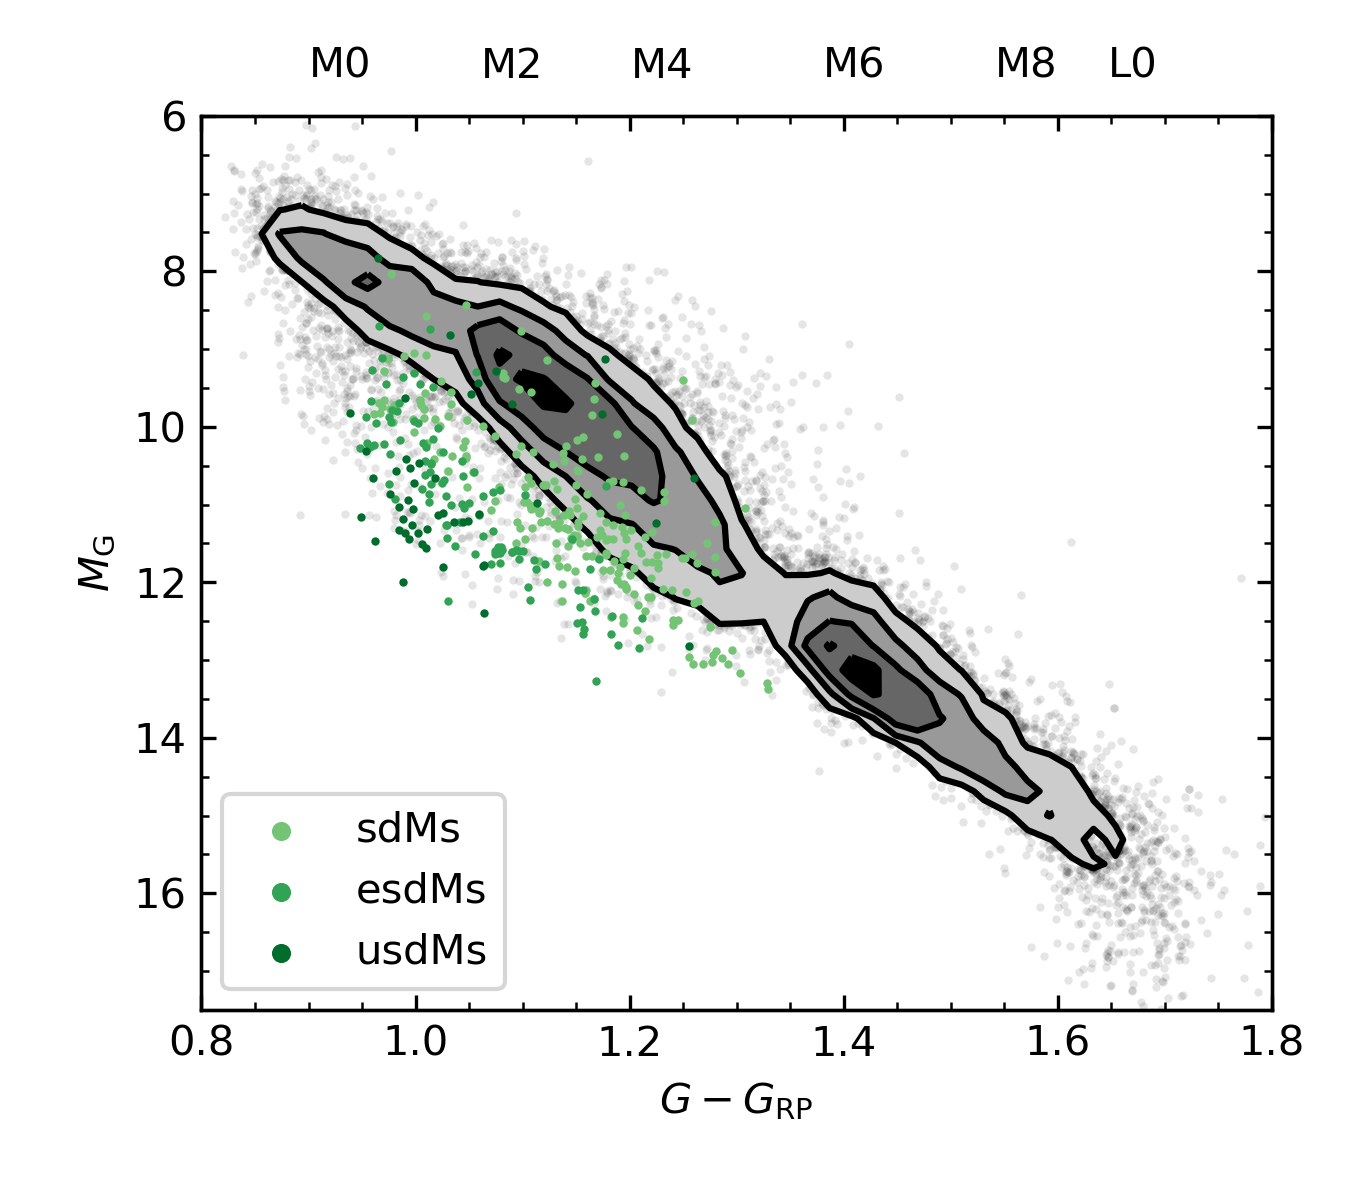
For earlier-type stars (), there is a significant number of objects below the main sequence. These objects are likely to be low metallicity, old stars. This faint outlier population is not present for later types (). This is not likely to be a result of the quality cuts we made in Section 2.3 because the scatter is not present when there are no cuts applied (see Figure 9). The lack of scatter in the region where subdwarfs typically lie for later types could be a selection effect from SDSS or a physical difference in the colors of later-type subdwarfs (which could be less blue than their earlier spectral type counterparts West et al., 2004; Lépine & Scholz, 2008). To corroborate that the stars scattered below the main sequence are primarily subdwarfs, we cross-matched MLSDSS-GaiaDR2 with the catalog of subdwarfs from Savcheva et al. (2014). From this cross-match we found subdwarfs in the MLSDSS-GaiaDR2 sample which had good photometry and astrometry according to our quality cuts (Section 2.3). In Figure 14 we show a color–magnitude diagram of these subdwarfs compared to the MLSDSS-GaiaDR2 sample. We also included the distinction between subdwarfs (sdMs), extreme subdwarfs (esdMs) and ultrasubdwarfs (usdMs) according the metallicity proxy () (Lepine et al., 2007; Dhital et al., 2012). As expected, the esdMs fall the furthest below the main sequence, with the usdMs and sdMs falling progressively closer to main sequence stars, consistent with Savcheva et al. (2014). However, some of the Savcheva et al. (2014) subdwarfs fall on the main sequence of our color–magnitude diagram. Many of these stars have relatively low signal-to-noise spectra and may have been mis-classified as subdwarfs in that work.
Bochanski et al. (2013) found that the separation between subdwarf types was mag in at a given color or spectral type, which is approximately the same separation we observe in Figure 14 for at a given . The position of the subdwarfs in the color–magnitude diagram is also consistent with other work on metal-poor M dwarfs (see for e.g. Lepine et al. 2007; Jao et al. 2008, 2017).
There are also sources scattered above the main sequence, likely caused by M dwarf binaries, high metallicity, magnetic activity (see Section 5.1), and dust contamination in Gaia bands (see Section 2.2). Note that some of the most distant stars from the main sequence could be binaries with an M dwarf primary and a giant companion (Gaia Collaboration et al., 2018a). The scatter above and below the main sequence is discussed in more detail in Section 5.
4 M and L dwarf Absolute Magnitudes in SDSS and 2MASS Bands
Gaia DR2 distances are an order of magnitude more precise than the photometric distances in MLSDSS (uncertainties of versus ), allowing us to calculate absolute magnitudes with a median error of mag for SDSS photometry and mag for 2MASS photometry. We re-calculated the relationship between absolute magnitudes and spectral type for SDSS and 2MASS photometry with these new values and the relationship between absolute magnitudes and the color. These relations are useful to estimate spectrophotometric and photometric distances for stars that are not in Gaia DR2, as shown by previous work, which was based on less than a hundred stars with parallaxes (e.g. Hawley et al., 2002; Bochanski et al., 2010). We caution, however, that because the MLSDSS-GaiaDR2 sample has not been vetted for binaries and low metallicity stars, it may be subject to biases not present in the previous, smaller samples.
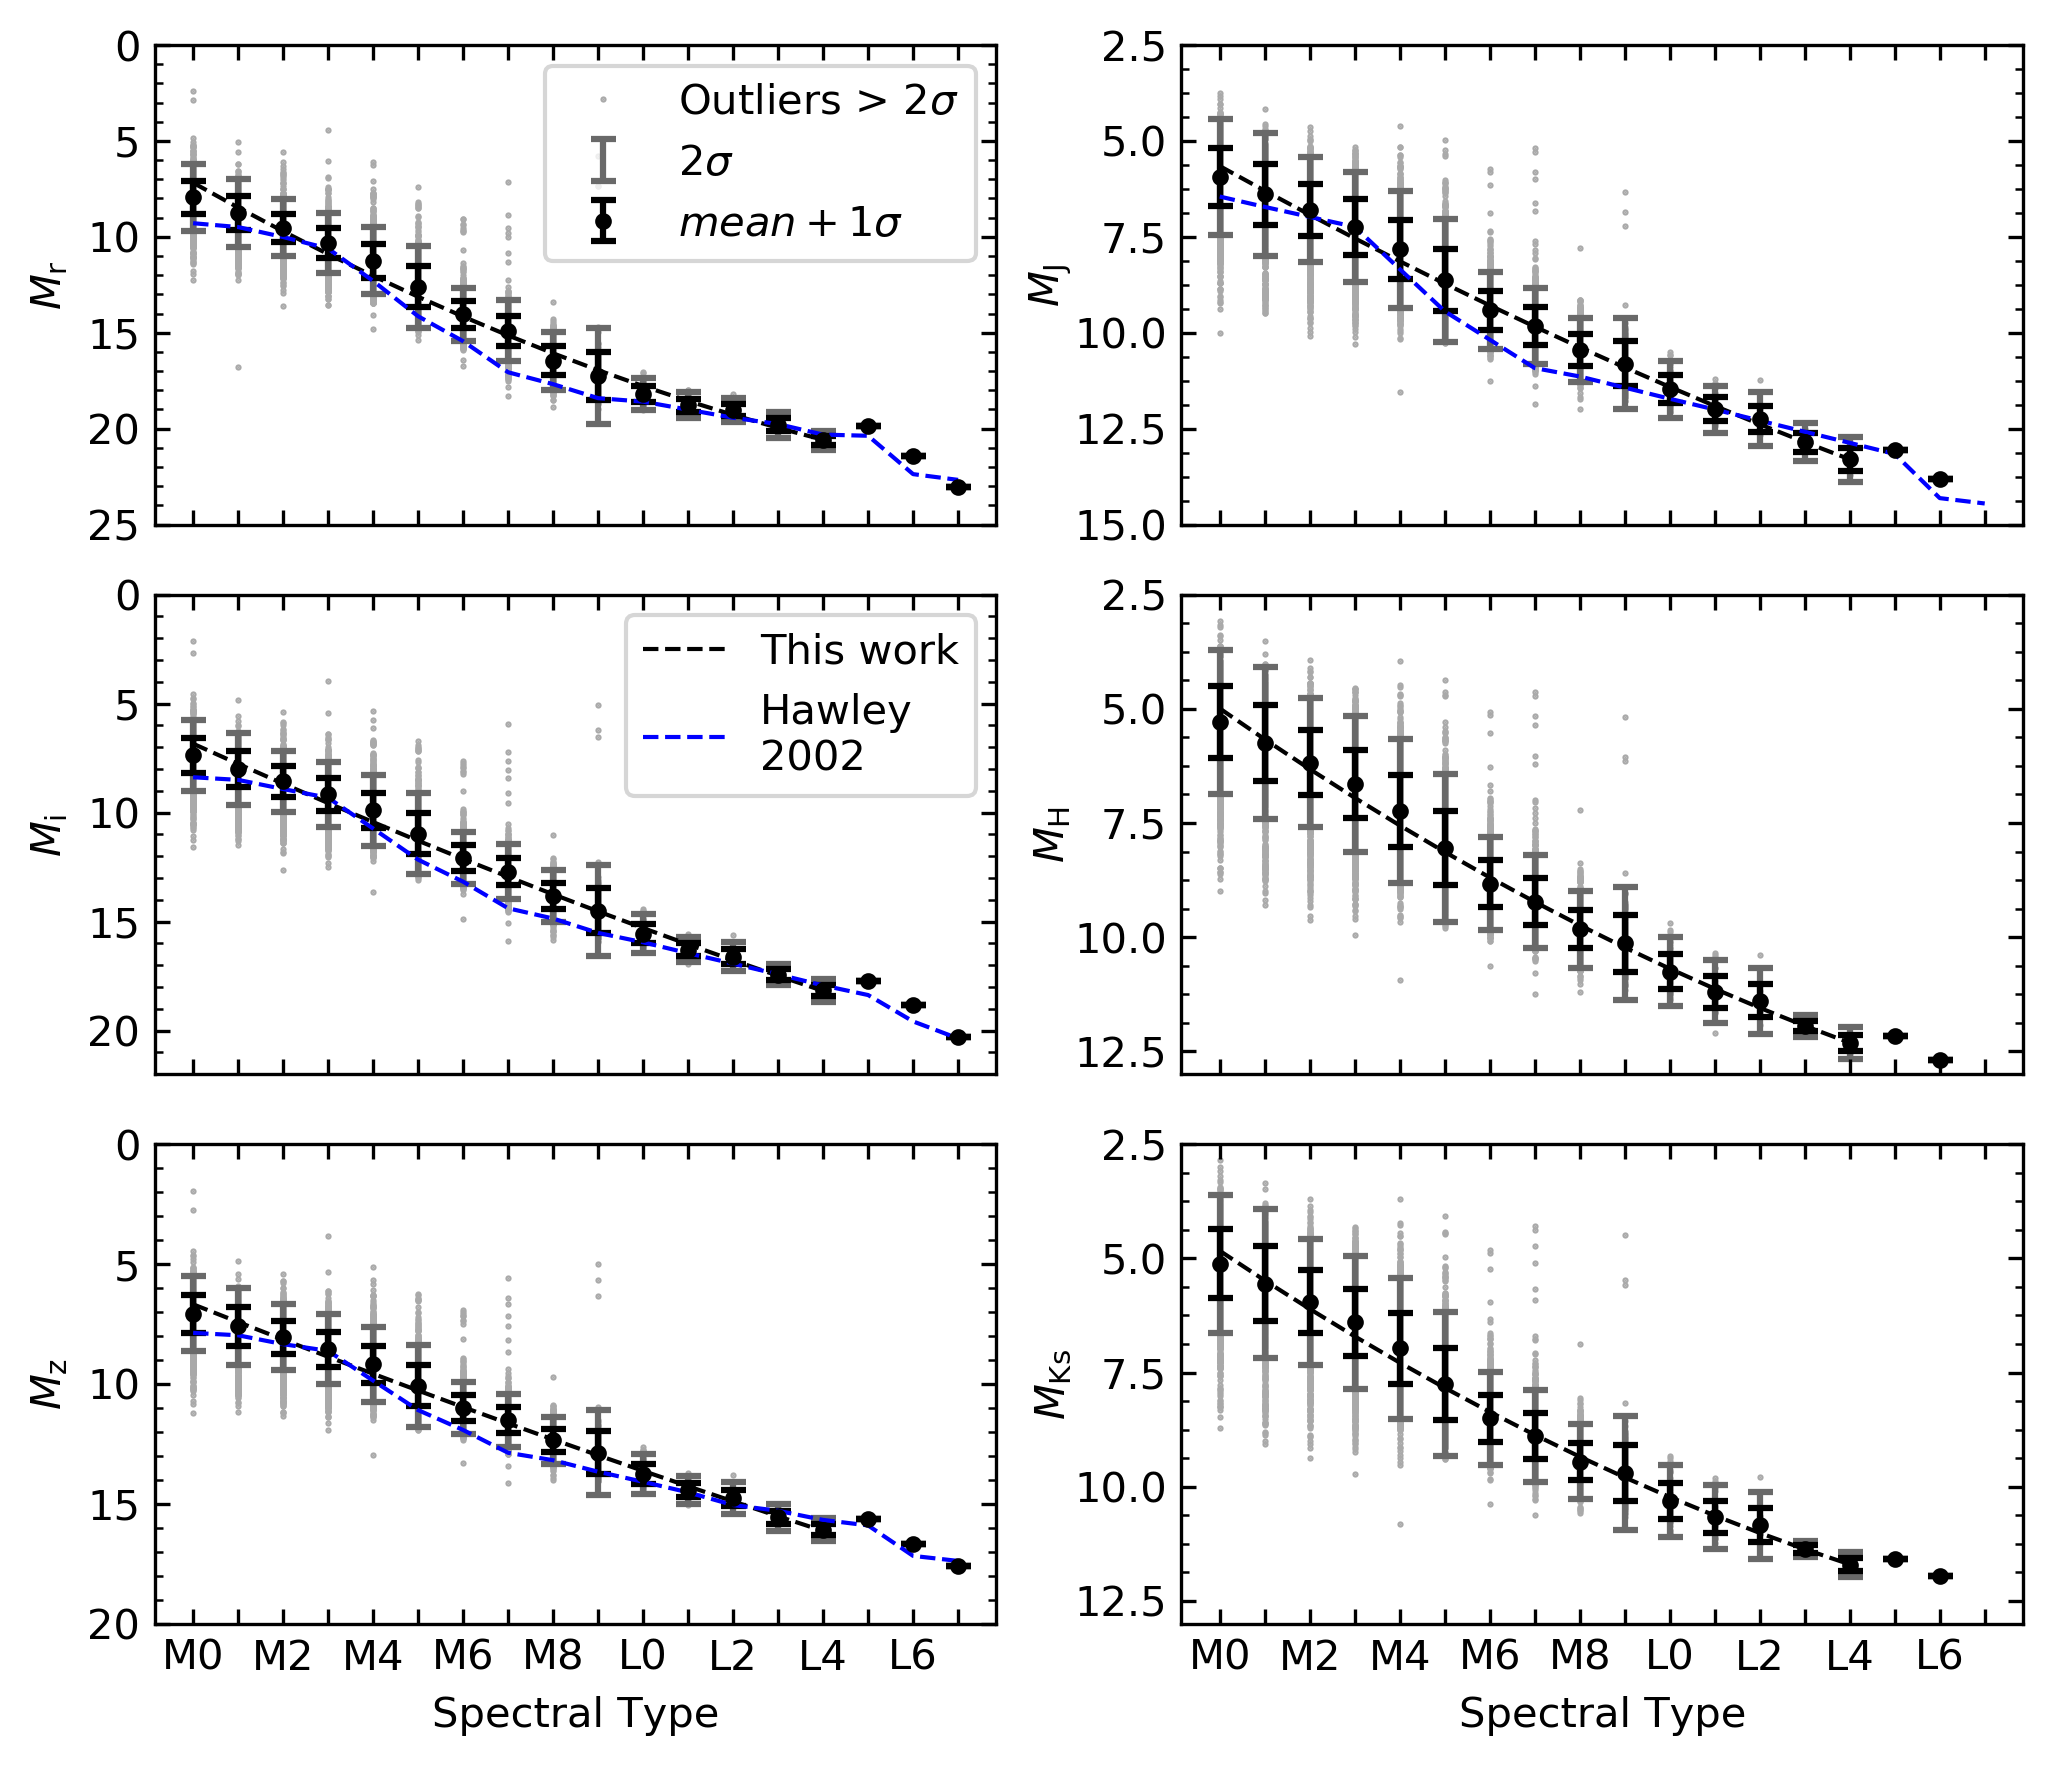
To generate the most accurate relationship between absolute magnitudes and spectral type and color, we applied the astrometric cuts discussed in Section 2.3.1 and the photometric cut for SDSS photometry discussed in Section 2.1, thereby selecting objects with the best astrometry and photometry available. The distribution of absolute magnitudes as a function of spectral type is shown in Figure 15 and as a function of color in Figure 16.
For each spectral type we calculated the mean value and the standard deviation in absolute magnitude. We also performed a fit to the mean values as a function of spectral type with as weights. The fit only extends to spectral type L4 due to the small number of later-type objects; most objects later than L4 are too faint to be in Gaia DR2 and so cannot be included (See Section 2.2). The best fit parameters for SDSS and 2MASS absolute magnitudes are listed in Table 6. For comparison, we included the mean values as a function of spectral type calculated by Hawley et al. (2002) from a sample of M and L dwarfs with photometric distances. We note that our fit for , and lies above the values calculated by that work. This is likely in part due to the uncertainties in the photometric distance, but also may be due to the binary population in our sample when performing the fit: binary systems with two equal mass components fall mag above the main sequence, which could result in brighter mean absolute magnitude.
While most of the MLSDSS-GaiaDR2 sample follows the mean trend for absolute magnitude as a function of spectral type, there are outliers in each spectral type bin that are more than from the mean in absolute magnitude. These outliers have a distribution similar to that in the Gaia photometric color–magnitude diagram (Figure 13). Those scattered to fainter absolute magnitudes can be associated with low metallicity stars and are only present for earlier spectral types. The scatter towards brighter absolute magnitudes is mostly present for early and mid-M dwarfs and can be associated with binarity, high metallicity, and/or magnetic activity. We will discuss more this scatter in Section 5.
| Band | ||||
|---|---|---|---|---|
Note. — Best fit parameters to a quadratic fit to SDSS and 2MASS absolute magnitudes as a function of spectral type, , as shown in Figure 15. The fit was based on stars with spectral types M0–L4.
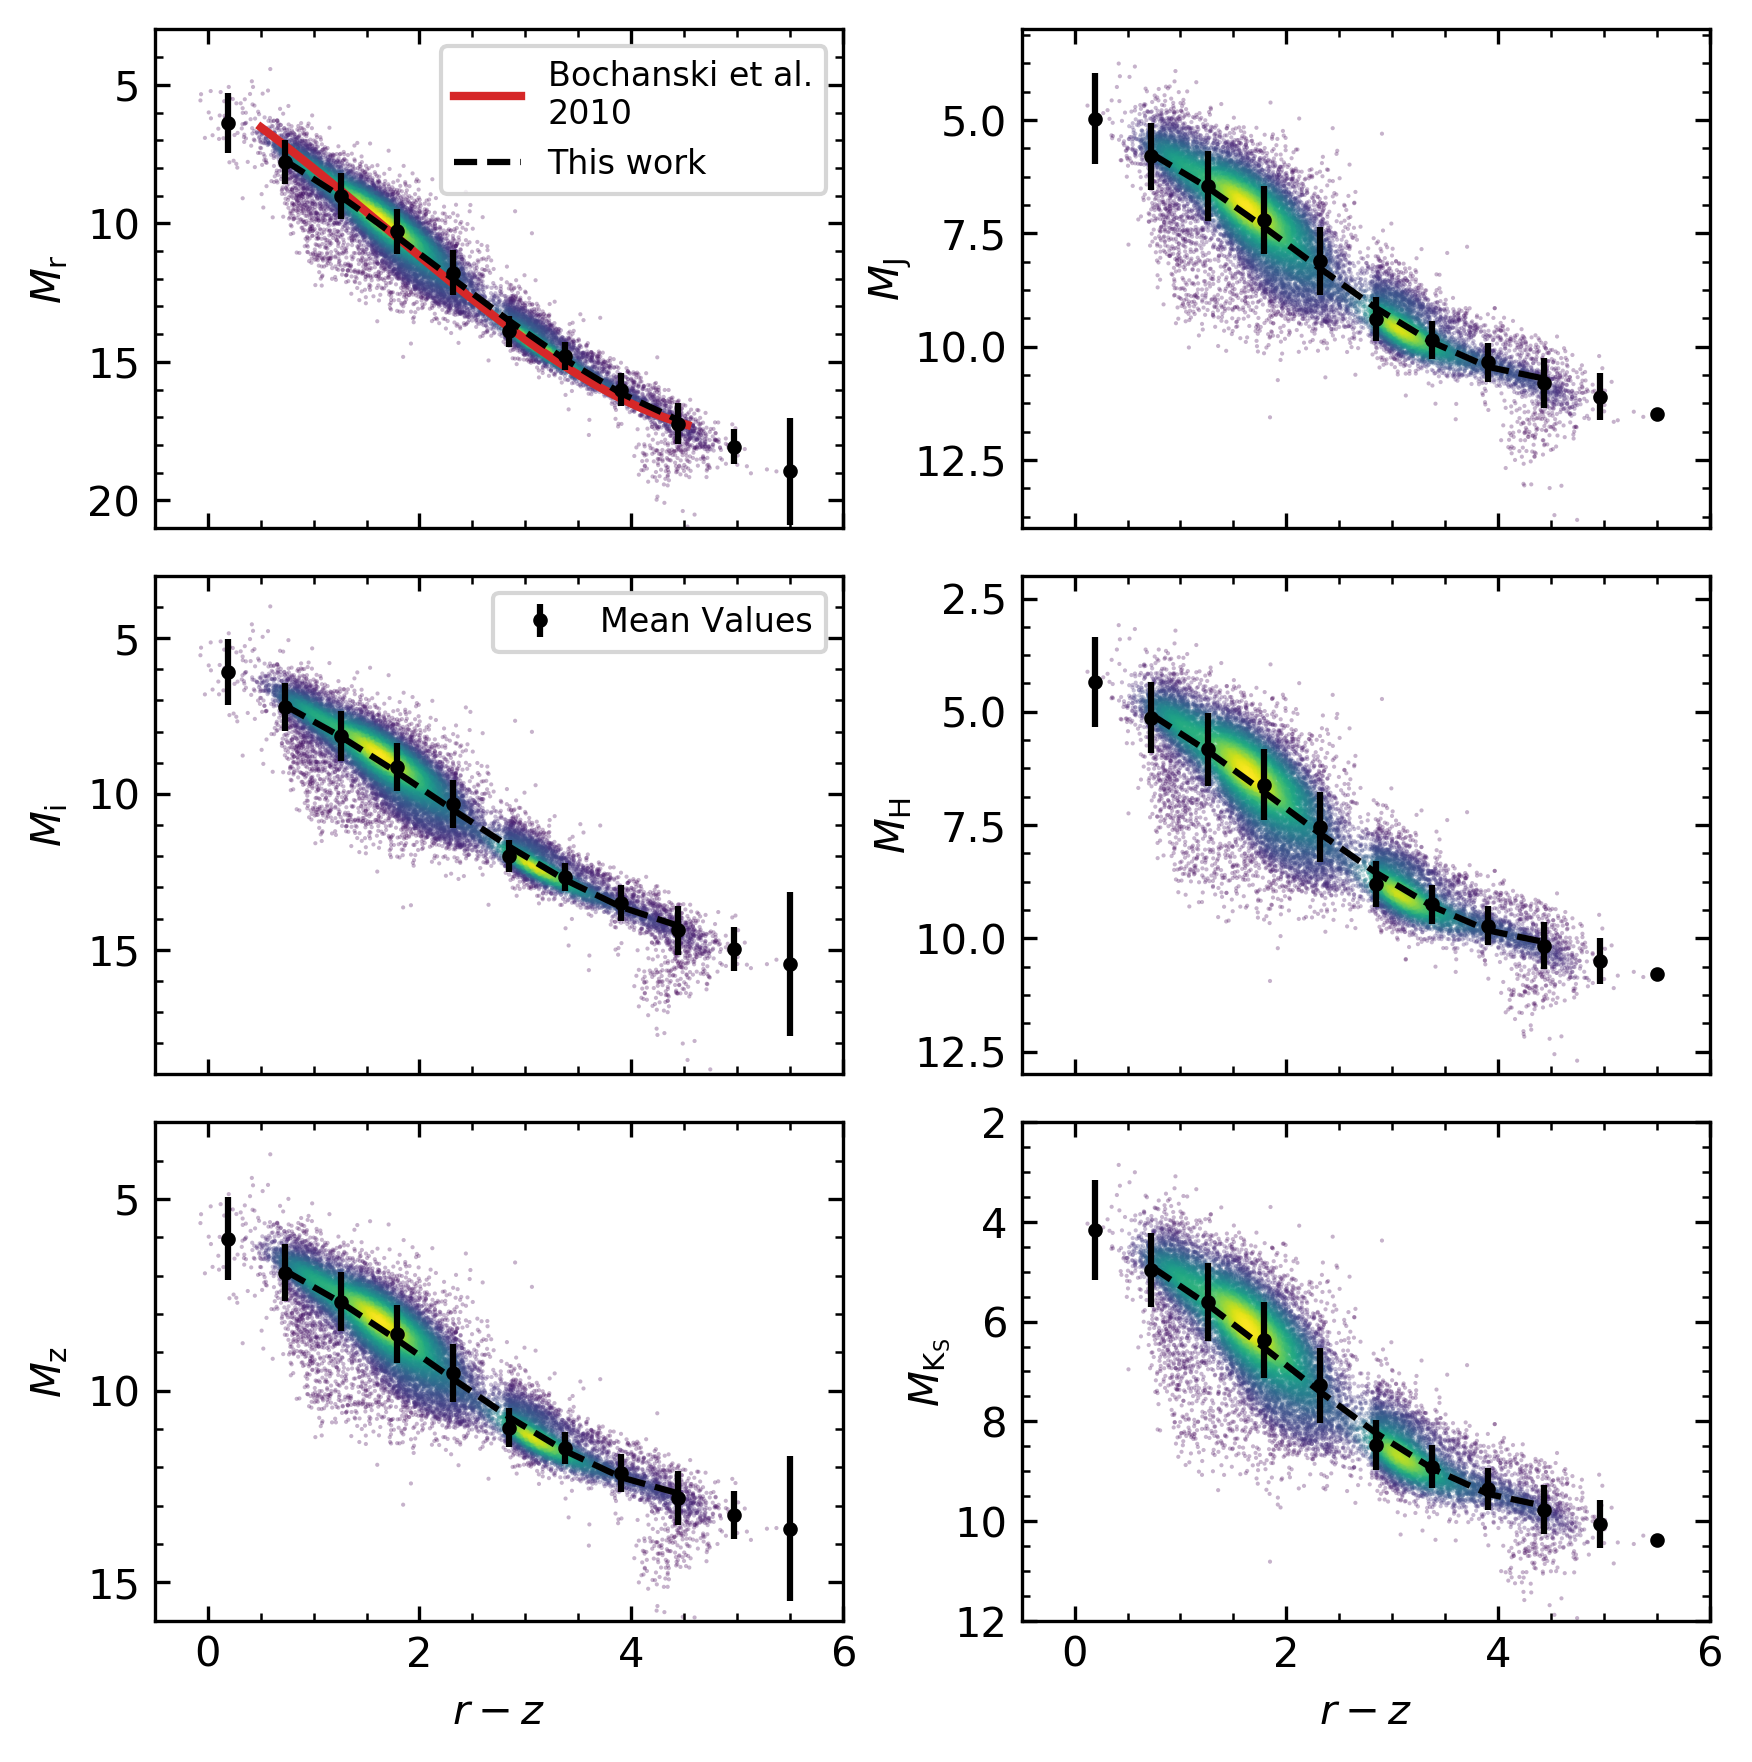
We also examined the relationships between SDSS and 2MASS absolute magnitudes as a function of the color. We selected as the base color because it is a good indicator of spectral type/effective temperature for M dwarfs. We divided the axis in intervals of mag and calculated the mean value and standard deviation for each interval. We fit the mean values with a third degree polynomial using the standard deviations as weights. We performed a fit for mag (corresponding to M0–M9 dwarfs) because for L dwarfs, the main sequence turns over, as shown in Figure 16. This is the same break shown in the stellar color locus analysis in Figure 11 at color . It means the relation between absolute magnitude and color cannot be used beyond this point because the two quantities are no longer related in the same way. The best fit parameters are in Table 7.
We find that has the tightest relation with color. The spread above and below the main sequence increases for the and -bands. Furthermore, all three 2MASS bands (right panels) have higher spread above and below the main sequence than SDSS bands, and it also increases for the bands in comparison with and . We compared our data and fit in versus to the fit from Bochanski et al. (2010) as a check on our accuracy. The two fits are in good agreement, and both fall over the highest density of data points.
| Band | |||||
|---|---|---|---|---|---|
Note. — Results from the best fit to SDSS and 2MASS absolute magnitudes as function of color with a third degree polynomial, , as shown in Figure 15. The fit is valid between .
5 Age-related parameters
One of the primary goals for analysis of the MLSDSS-GaiaDR2 sample is to calibrate observable age indicators for M and L dwarfs. In this section, we examine the following activity-related and kinematic age indicators: (1) fractional luminosity (), (2) vertical velocity dispersion (), (3) vertical action dispersion (), and (4) tangential velocity (). The relationship between , kinematics, and age has been explored in previous works (e.g., West et al., 2008a; Pineda et al., 2013). However our kinematics significantly improve the uncertainties on MLSDSS data as Gaia DR2 contains proper motions with uncertainties of and distances with uncertainties of .
5.1 Fractional luminosity on the Gaia color–magnitude diagram
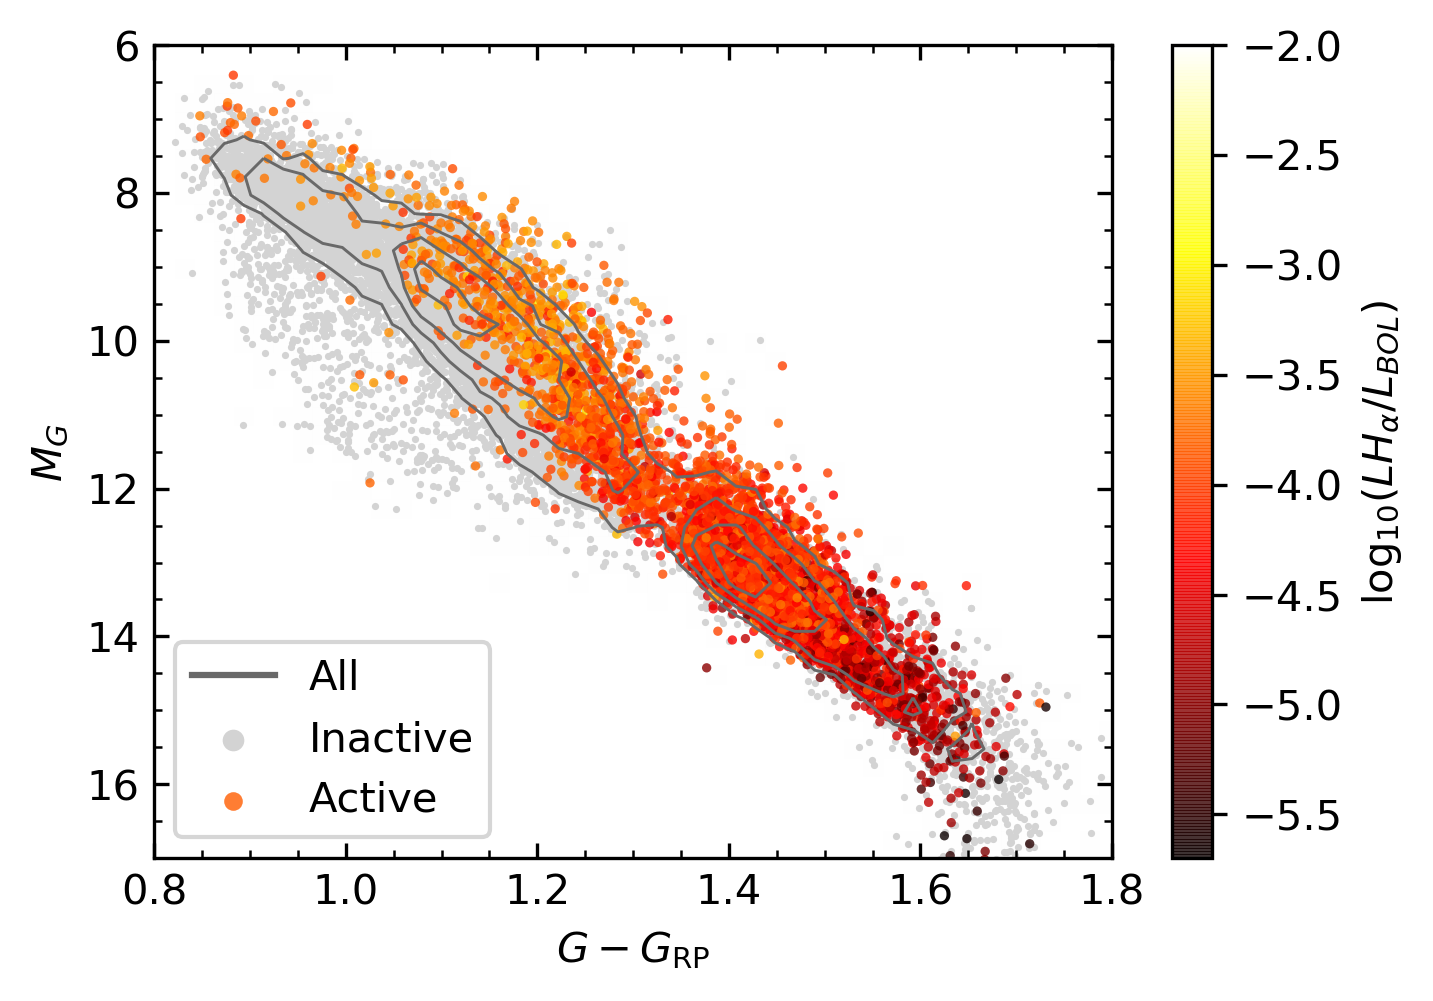
Fractional luminosity () is a parameterization of the strength of the chromospheric emission line which removes the dependence on the continuum that is a factor with EW measurements. This fractional luminosity is an age indicator because it is a measure of stellar magnetic activity, which is presumed to be age-dependent: young stars have higher magnetic activity while old stars are less active or inactive (e.g., Skumanich, 1972; Baliunas et al., 1995; Donahue et al., 1996; West et al., 2008b; Mamajek & Hillenbrand, 2008). We show the relationship between fractional luminosity and the position of the star on the Gaia color–magnitude diagram in Figure 17, including inactive stars for comparison. To mitigate the effects of dust extinction which can also scatter stars on the color–magnitude diagram, we remove stars with high SDSS extinction, meaning .
As shown in Figure 17, the majority of the low mass, red stars (; M5), are both active and fall along the main sequence. The high fraction of active stars is due to the long (7 Gyr) active lifetimes of late-M and L dwarfs (Gizis et al., 2000; West et al., 2004, 2008b; Schmidt et al., 2015).
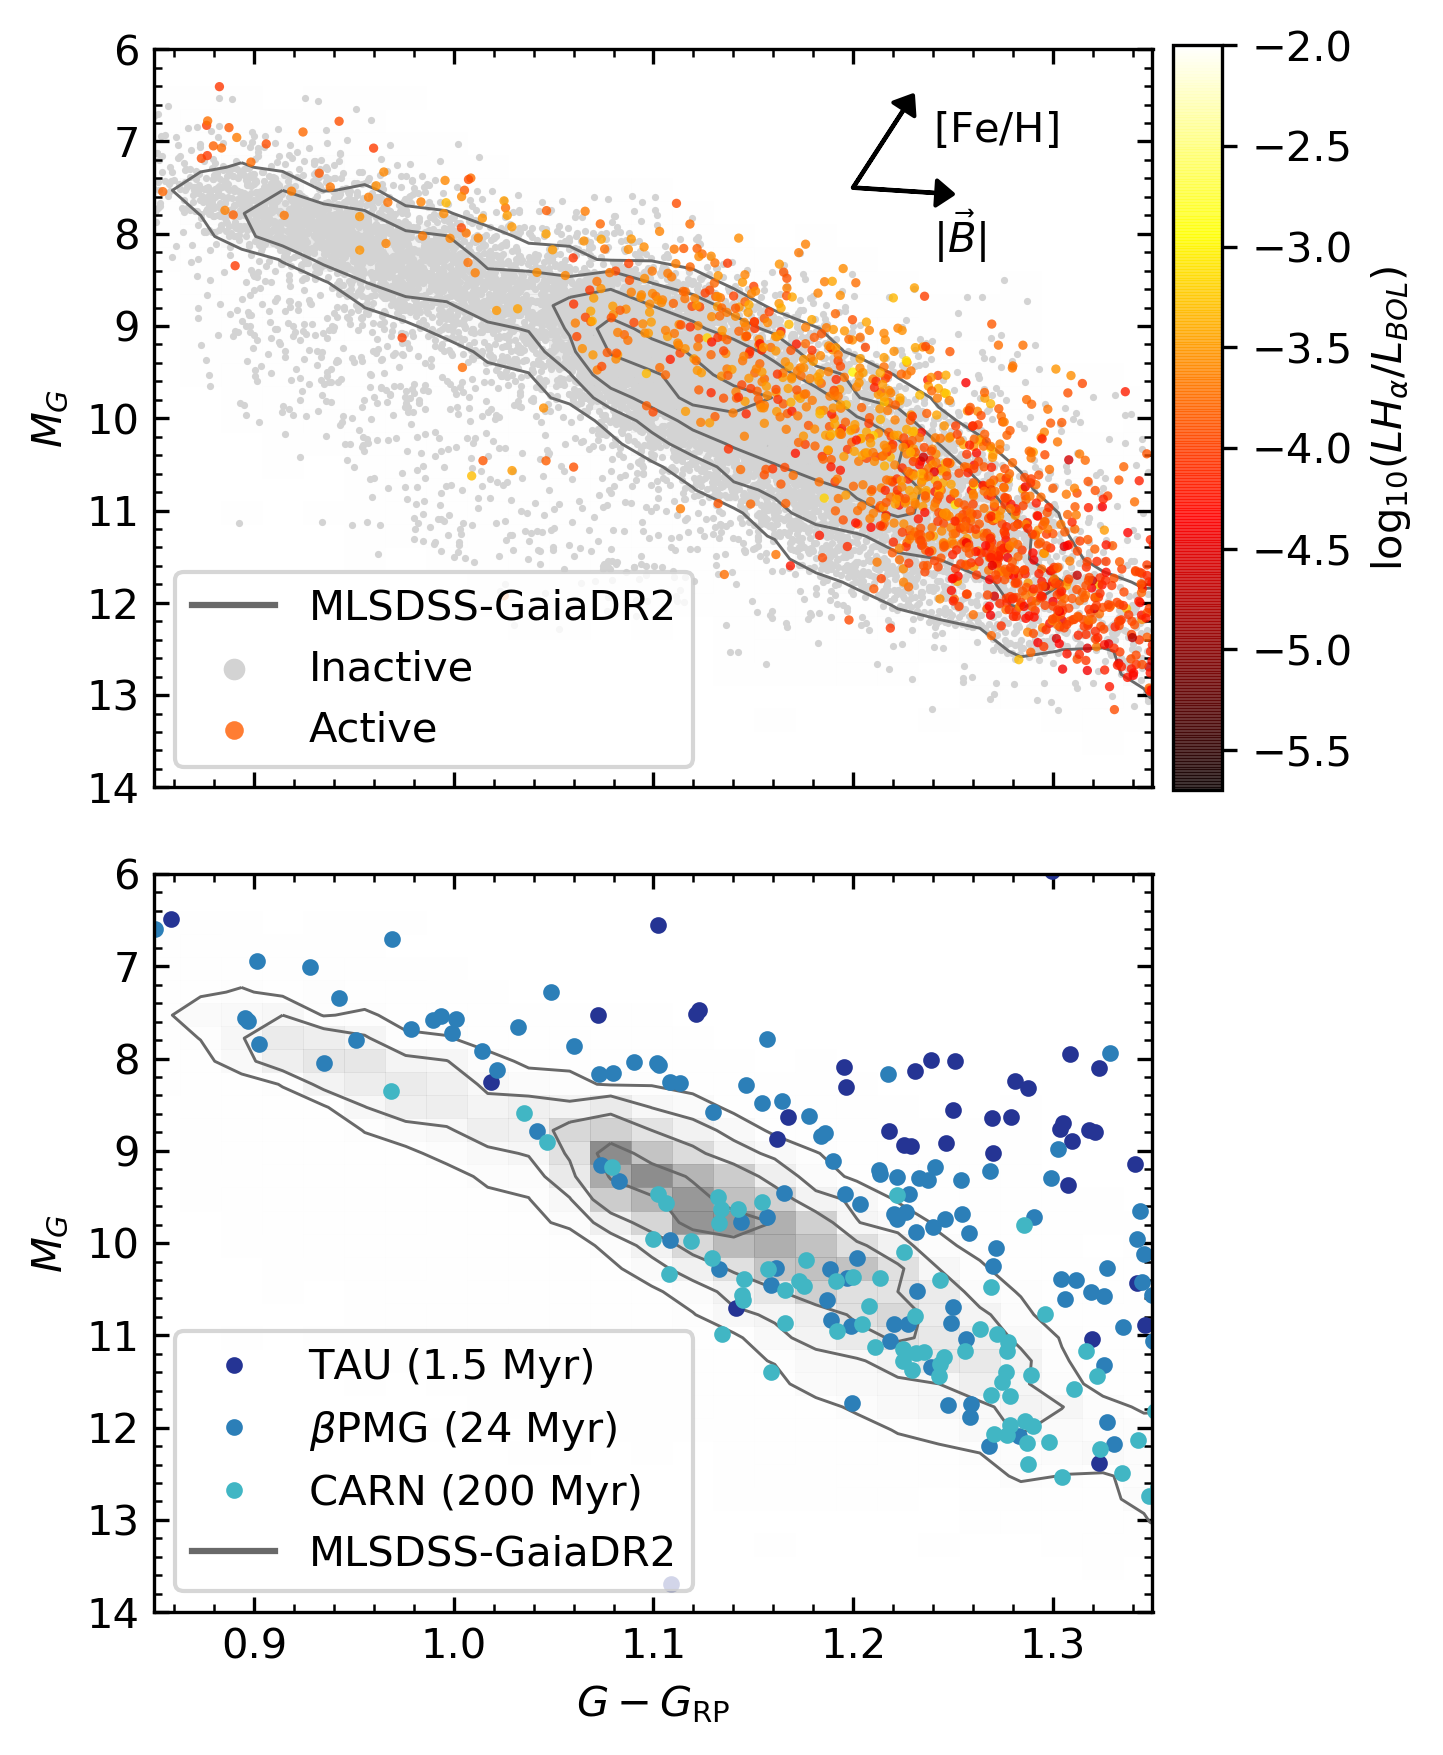
We find a clear correlation between activity and the position in the color–magnitude diagram for the bluer (;M5) stars and in Figure 18, we zoom into this region. Active stars are found, on average, at redder colors and/or brighter magnitudes than inactive stars. The four most probable causes are youth, metallicity, binarity and/or magnetic activity. The effects of each are described below.
To investigate the effect of youth, we compared the color–magnitude position of the active stars with the position of three known young moving groups from Gagné & Faherty (2018): Taurus (TAU, Myr), Pictoris (PMG, Myr) and Carina-Near (CARN, Myr; Figure 18). The oldest of the moving groups, CARN, is the closest to the main sequence, while the younger groups fall above it, mostly due to the stars still contracting and having larger radii than stars of the same mass that have reached the main sequence. While these young stars are active, they are on average not as active as the most strongly active stars in the MLSDSS-GaiaDR2 sample. Therefore we speculate their position above the main sequence is primarily due to their pre-main sequence radius rather than their activity level. The comparison between these young stars and the active MLSDSS-GaiaDR2 stars provides an estimate of how much radius inflation due to youth is responsible for their position on the color–magnitude diagram.
In Figure 18, we show that active MLSDSS-GaiaDR2 stars that lie just above the main sequence have approximately the same position as the Myr moving group PMG. However, these active stars are unlikely to be young: they are within pc from the Sun but there are a limited number of associations at or around Myr at these nearby distances (e.g. Orionis, see Faherty et al. 2018) and none of these stars appear to be members of known young groups. Furthermore, most of the early M dwarfs in MLSDSS-GaiaDR2 are highly separated from the plane of the Galaxy which indicates they are old (e.g., West et al., 2004). Therefore the position of the active stars at redder colors and/or brighter magnitudes than inactive stars is not due entirely to youth.
Binarity could also affect the position of active stars in the color–magnitude diagram. Tight binaries are more luminous and could be more active due to tidal interactions (Shkolnik et al., 2011).
Another factor that influences the position of stars on the color-magnitude diagram is its metallicity. Mann et al. (2015) showed that high metallicity M dwarfs tend to have larger radii than low metallicity M dwarfs for a given effective temperature. This effect could be another factor in the position of active stars on the color-magnitude diagram.
Moreover, Bochanski et al. (2011) showed that active stars fall even redder and/or higher above the main sequence than inactive stars with the same metallicity. Active stars have been shown to have inflated radii, possibly caused by strong surface magnetic fields (e.g. Lopez-Morales & Ribas, 2005; Morales et al., 2009; Torres, 2013). Observations of young low-mass stars show radii that are, at a fixed mass, – larger than predicted by evolutionary models (e.g. Somers & Stassun, 2017; Cruz et al., 2018; Kesseli et al., 2018). Stassun et al. (2012) showed that for low mass stars, the activity strength of active stars (as indicated by and ) is correlated with inflated radii and cooler effective temperatures compared to inactive stars. They also found that radius inflation and cooler temperatures cancel the effect of magnetic activity on bolometric luminosity, meaning that these effects should mostly cause horizontal shifts on the color magnitude diagram, not vertical ones.
Youth, binarity, metallicity, and activity can all play a role in scattering M0–M5 stars, shown in the top panel of Figure 18 to redder colors and/or brighter magnitudes than the bulk of the main sequence. Metallicity and binarity effects seem combined with activity to lift stars further off the main sequence, however, it is unlikely our active stars are particularly young. Magnetism likely plays a strong role in the position of active stars on the color-magnitude diagram. This effect might also exist for the later spectral types (M5) but it is not evident in our current analysis.
5.2 Vertical velocity and vertical action dispersion
Full three-dimensional space motion has been shown to trace stellar ages in the Galaxy. As stars age, increased interactions with giant molecular clouds and passing stars result in kinematic heating. Therefore one can use the overall velocity distribution of a population of stars to infer the age of that population via an age-velocity dispersion relation (AVR; e.g. Wielen, 1977; Hänninen & Flynn, 2002). Previous works have used full kinematics, or tangential velocity as a proxy for full space motion, to estimate the kinematic age of the low-mass star population compared to higher mass stars (e.g. Schmidt et al., 2007; Zapatero Osorio et al., 2007; Faherty et al., 2009; Reiners & Basri, 2009). Vertical action is related to the vertical component of a star’s angular momentum integrated over the gravitational potential of the Milky Way. Previous work has showed that in particular, vertical velocity and vertical action dispersion ( and ) are correlated with age (e.g. West et al., 2006, 2008b; Nordstrom et al., 2004; Aumer et al., 2016; Yu & Liu, 2018). As we do not have ages for the stars in the MLSDSS-GaiaDR2 sample yet, we studied the correlation between and and fractional luminosity, another age indicator (see Section 5.1 for the analysis).
We calculated vertical actions and vertical velocities using positions, proper motions and parallaxes from Gaia DR2 and radial velocities from MLSDSS. Note that the stars in the MLSDSS-GaiaDR2 sample are too faint to have radial velocities in Gaia DR2. For this analysis we used the good astrometric sample described in Section 2.3.1 and we added cuts for radial velocity signal to noise: and absolute value: km/s. The number of stars after the extra cuts for radial velocity is ( of the good astrometric sample of stars). We also removed stars categorized as white dwarf-M dwarf binaries because the white dwarf can affect the magnetic field of the companion (see Section 2.1, Morgan et al. 2012). To compute vertical velocities and vertical actions we used Galpy333http://github.com/jobovy/galpy (Binney, 2012; Bovy & Rix, 2013; Bovy, 2015) and W. Trick’s code444https://github.com/wilmatrick/GaiaSprint/blob/master/Action_Galpy_Tutorial.ipynb with the Milky Way potential from Bovy (2015). Uncertainties on these values were computed via Monte Carlo.
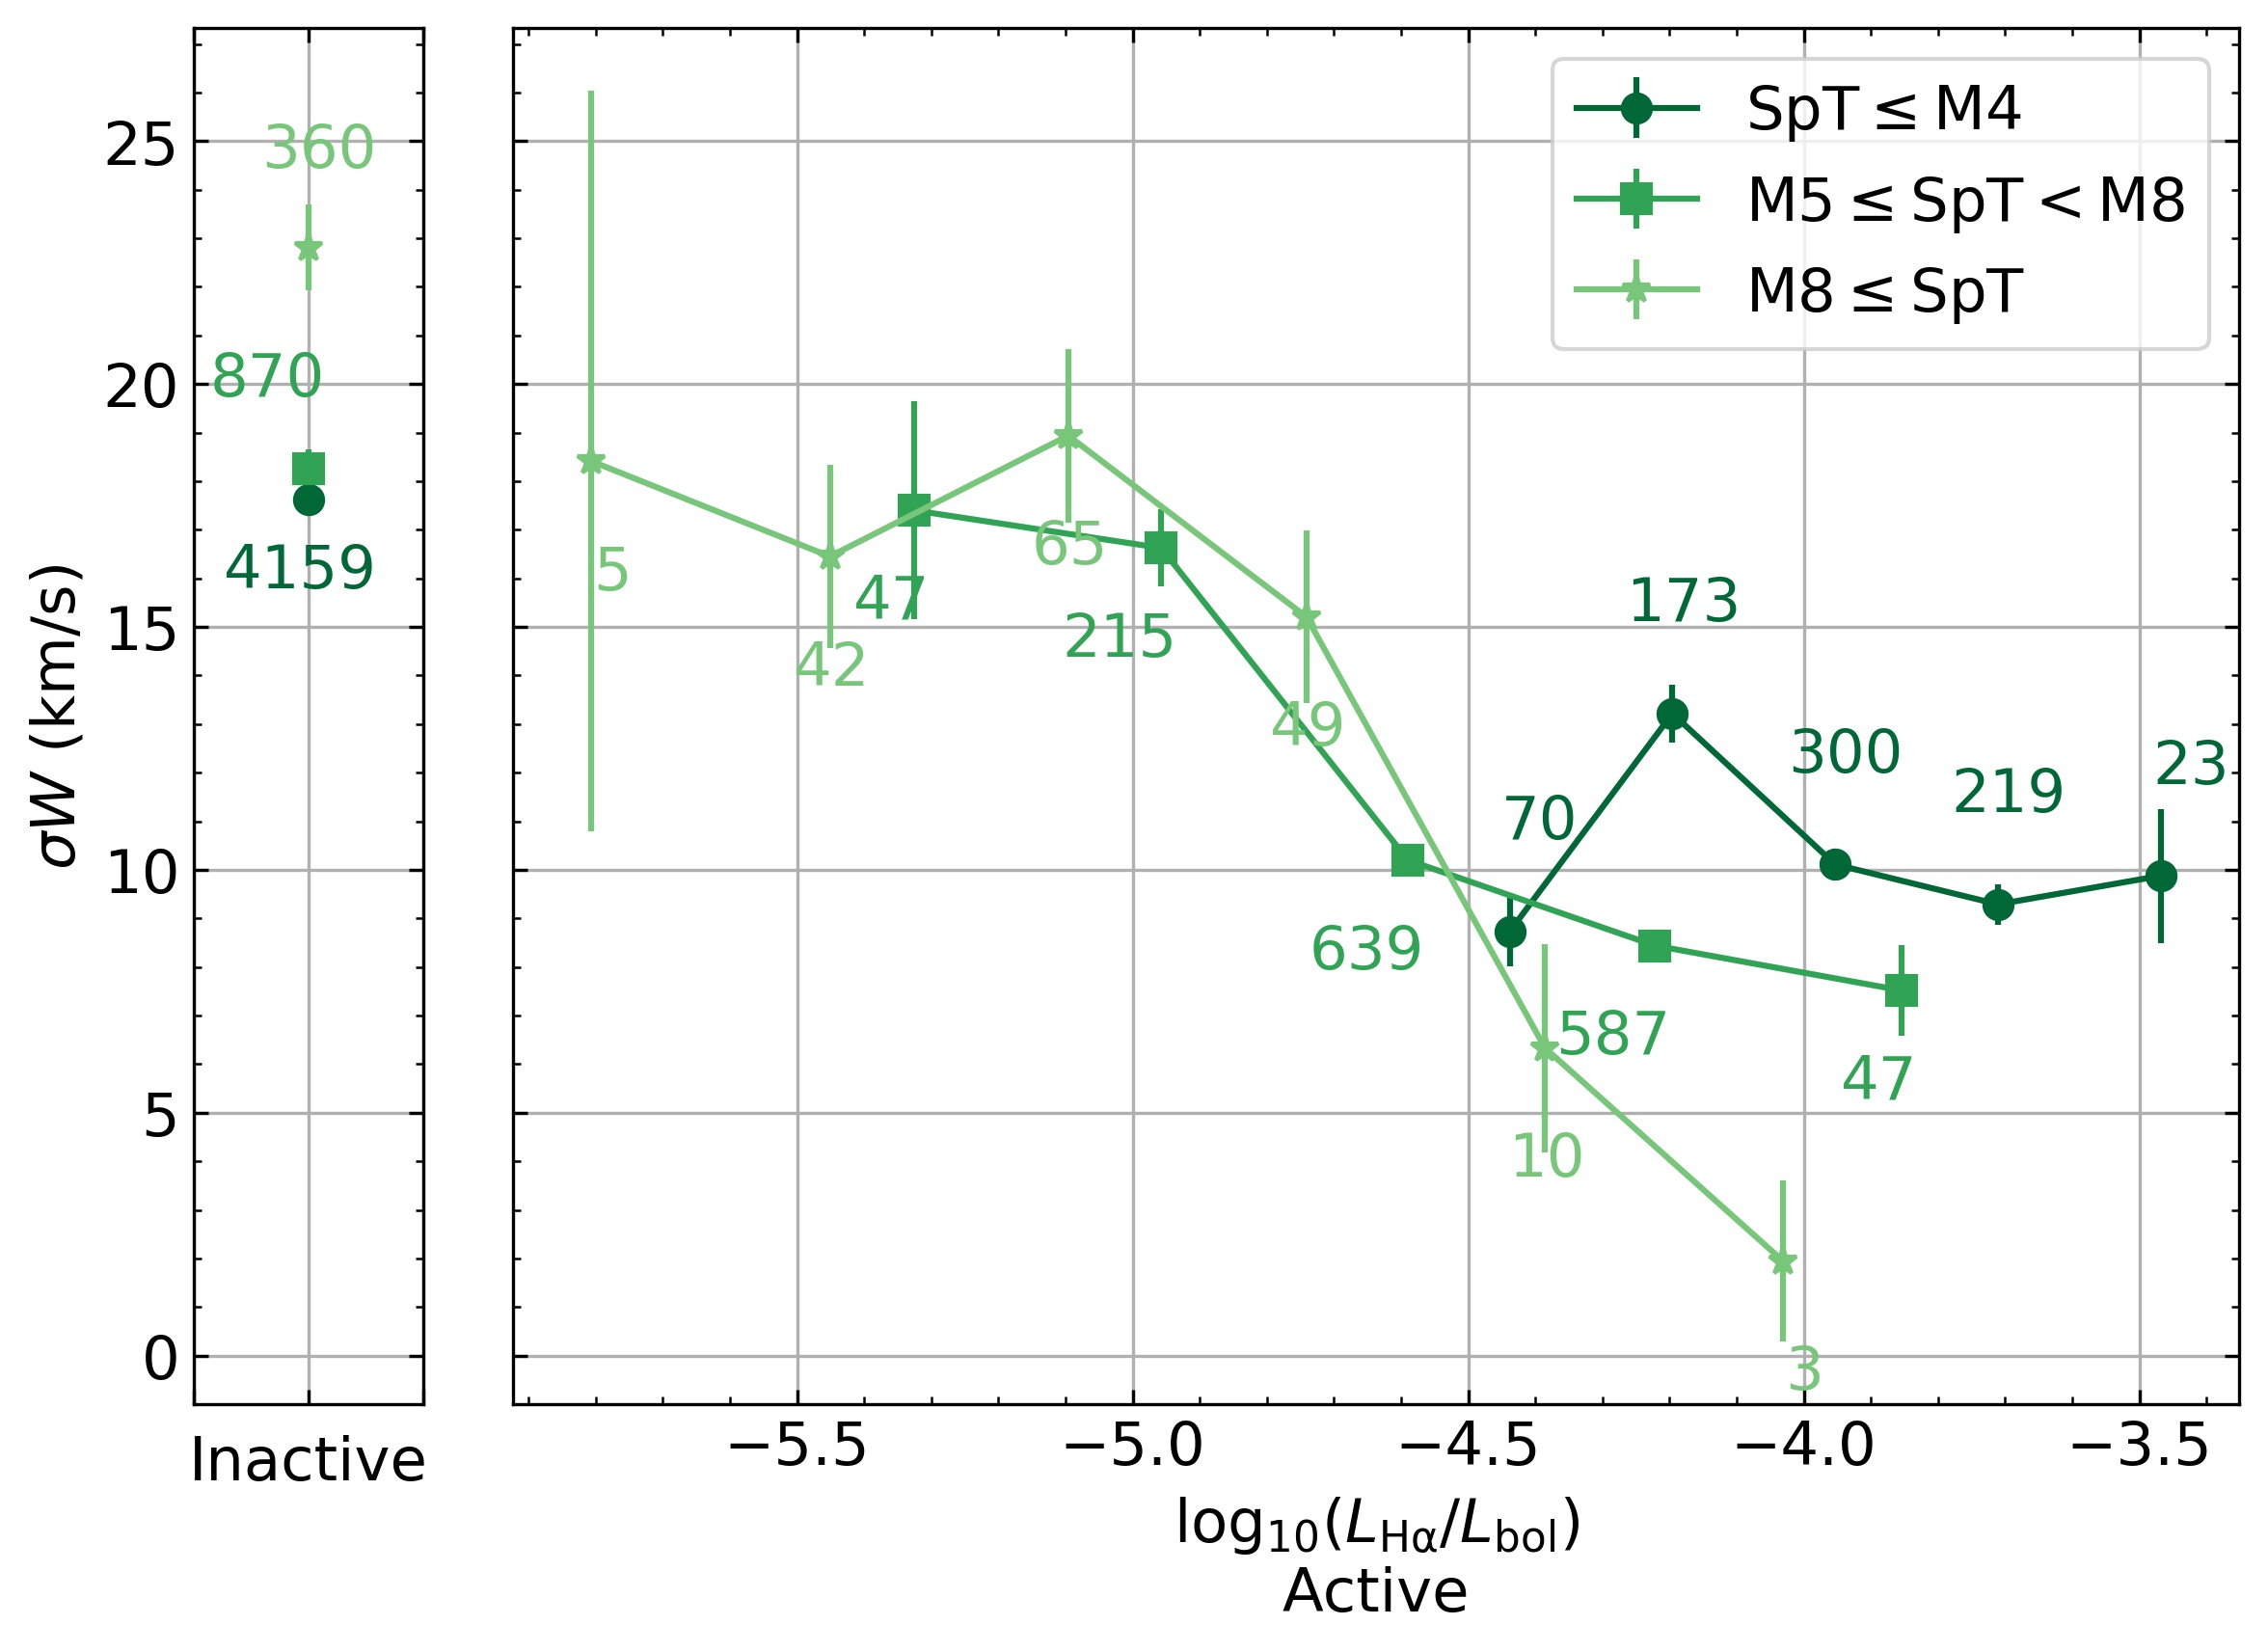
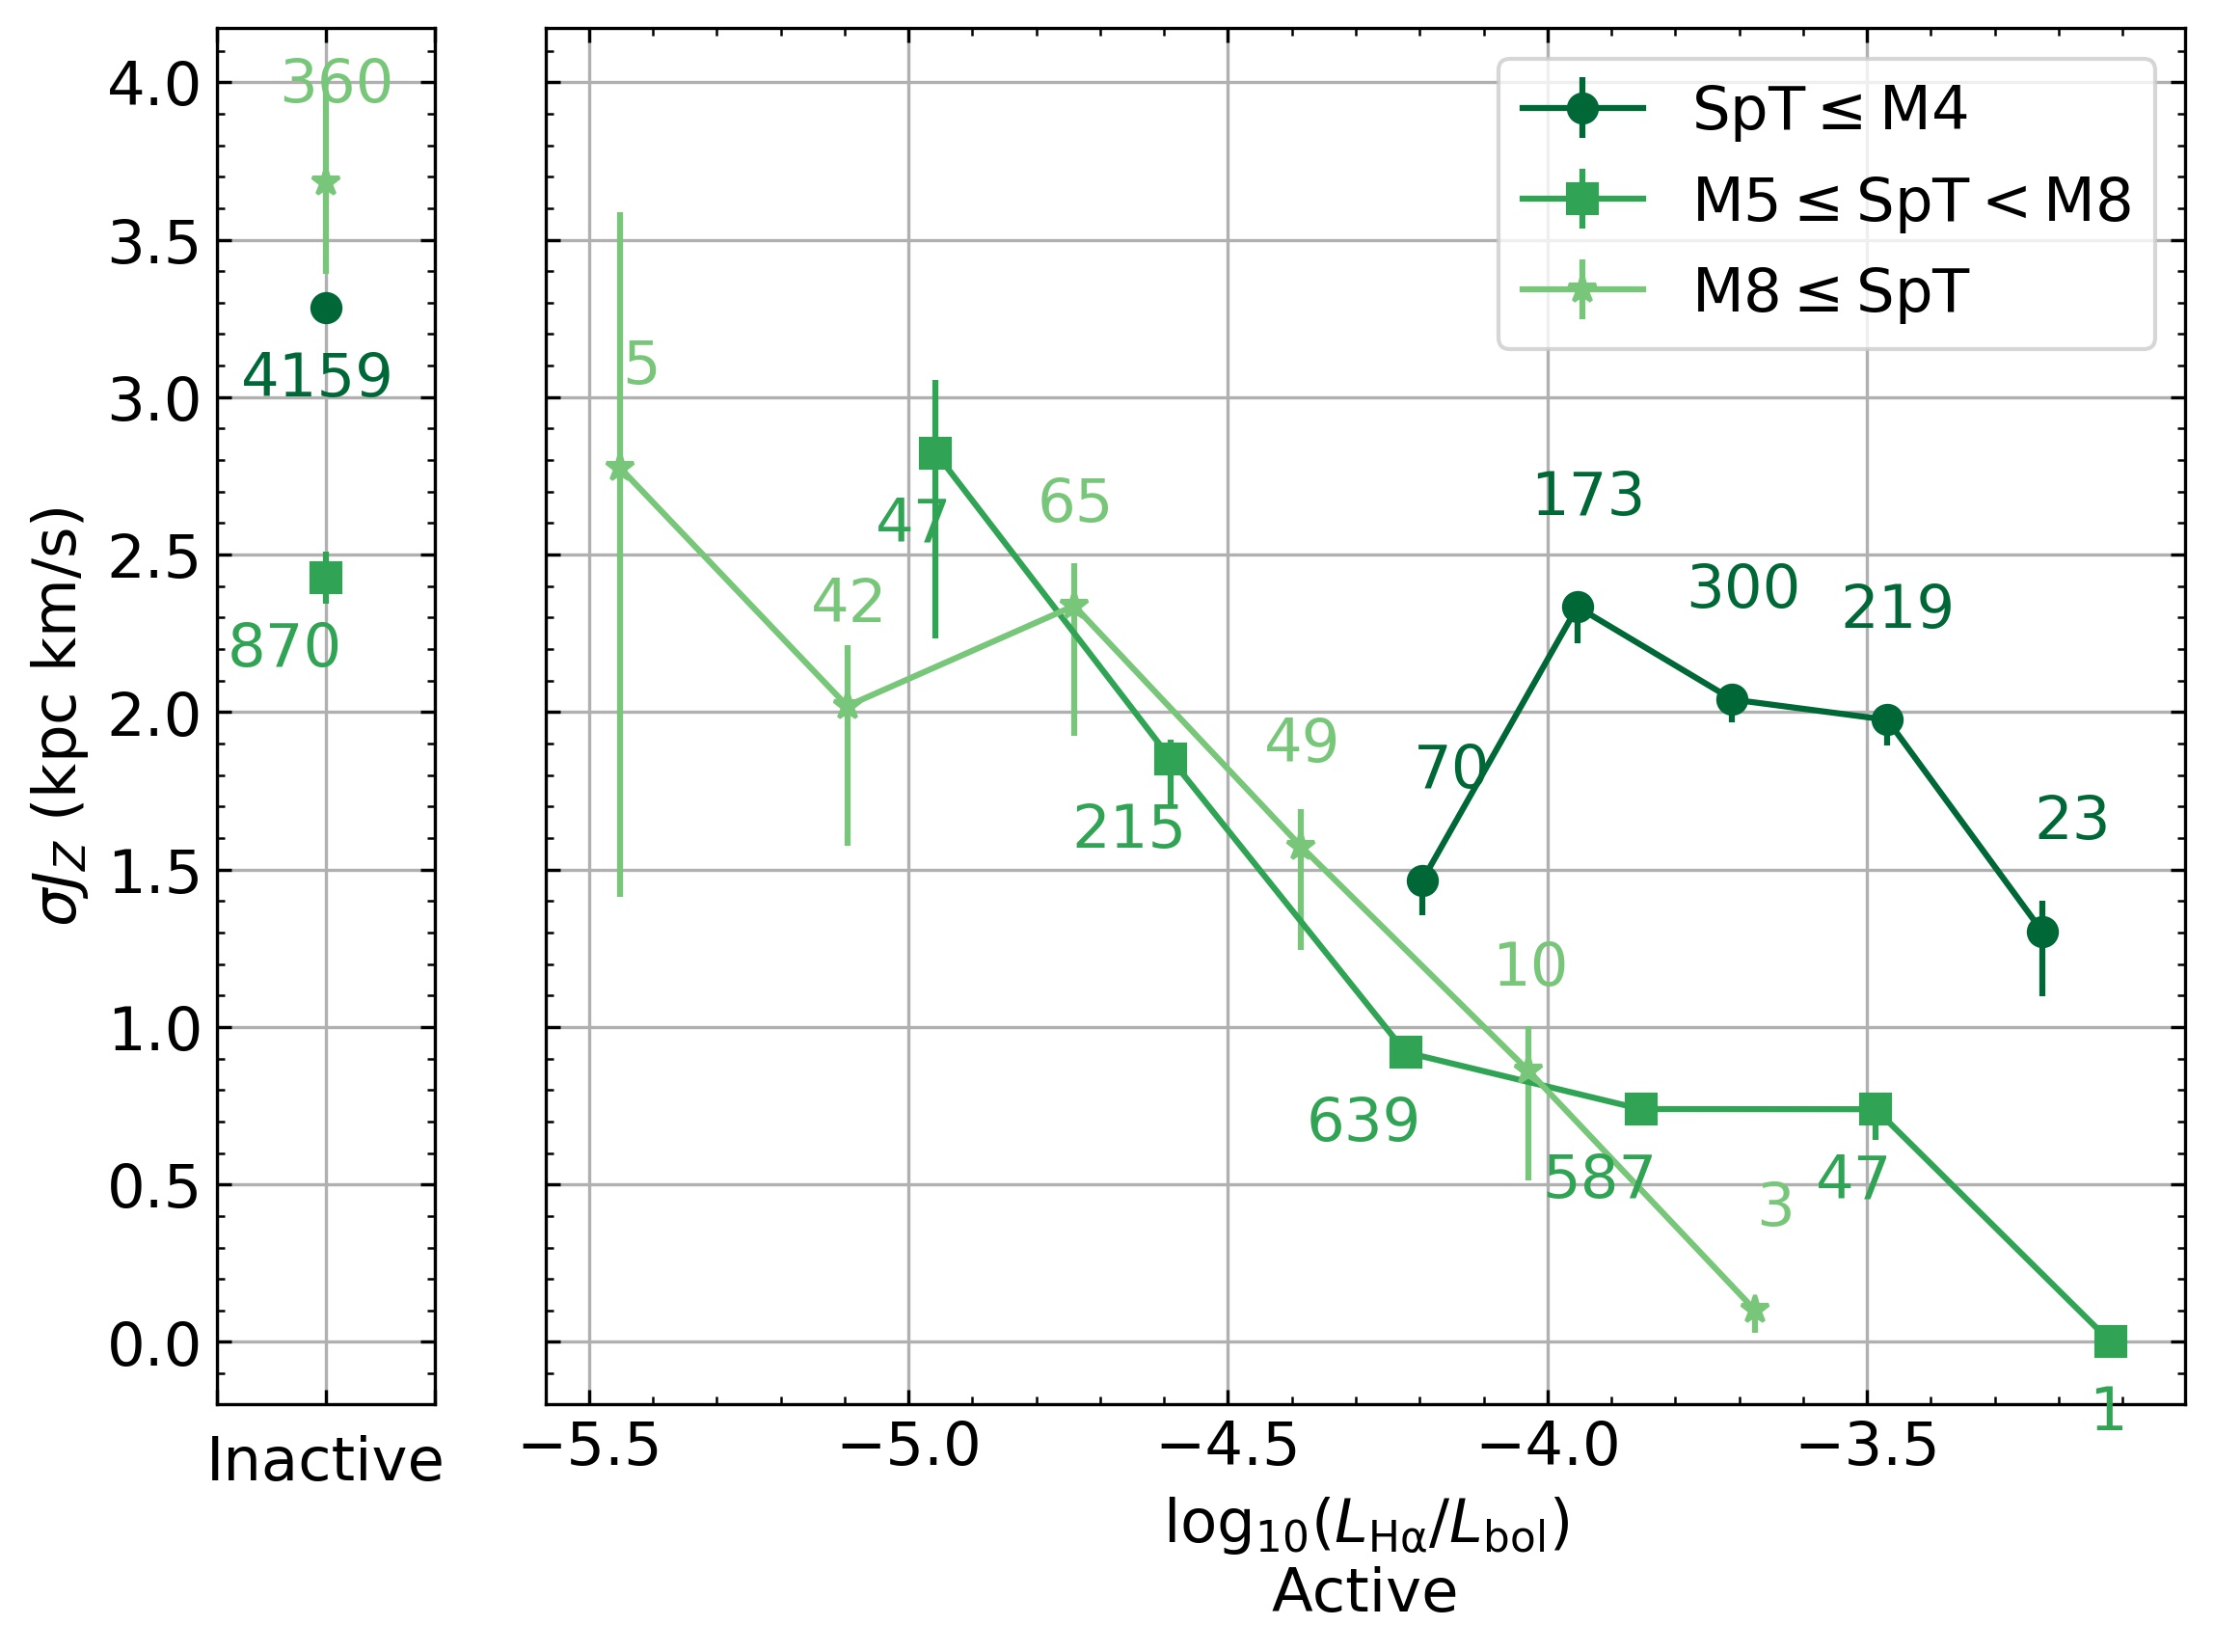
To compute the dispersion, we divided the values of logarithmic fractional luminosity () into six regularly spaced bins and calculated the dispersion per bin (). The value of fractional luminosity assigned to each corresponds to the middle of the bin. To calculate the dispersion per bin we used the median absolute deviation to alleviate the influence of outliers. Uncertainties on the median absolute deviation were estimated, again by performing Monte Carlo re-sampling of data points within their uncertainties.
Results for the dispersion of vertical velocity as a function of luminosity are presented in Figure 19. We divided the data into three spectral type bins: SpTM4, M5SpTM8 and M8SpT, as well as two categories of active and inactive stars (see Section 2.1 for more detail on the classification of active and inactive). For the active stars, we find that is lower for high activity stars than for less active stars, and inactive stars have a higher vertical velocity dispersion than active stars on average. Magnetically active stars are younger than less active or inactive stars (e.g., Skumanich, 1972; West et al., 2008b), therefore Figure 19 is showing that vertical velocity is also correlated with age: young stars have a smaller vertical velocity dispersion because they have had less time to experience orbital perturbations in the direction (out of the galactic plane).
The activity-velocity dispersion relation does not show an obvious dependence on spectral type which is a proxy for mass for mid and late dwarfs (SpT ). Active early-M dwarfs have higher vertical velocity dispersions compared to later type dwarfs. This is likely due to the detection threshold for the proper motions of the most distant M dwarfs; those with lower tangential velocities have lower quality proper motions, so only stars with high velocities have reliable proper motions, therefore biasing the dispersion to larger values (Bochanski et al., 2011). Moreover, the sample of early-M dwarfs is biased towards old stars compared to the sample of mid- to late-M dwarfs due to selection effects. The SDSS photometric detectors saturated for sources brigher than mag in , they cannot obtain reliable photometry for dwarfs found closer than pc to the Sun. On the faint end, SDSS spectra only have sufficient quality to be included in the sample of objects brighter than mag in , including early-M dwarfs as distant as kpc but late-M dwarfs only are detected at a distance of pc. As a consequence, early-M dwarfs found in the MLSDSS-GaiaDR2 sample are typically higher above the plane of the Galaxy and so they are likely older than later-type M dwarfs.
We calculated vertical action using a similar procedure used to calculate vertical velocity, and Figure 20 shows vertical action dispersion as a function of fractional luminosity. In this case, not all of the vertical action distributions are gaussian, so the distributions of dispersion per bin are also not a gaussian. Therefore, we represent the uncertainties with the and percentiles. Similarly to the vertical velocity analysis, inactive stars have significantly larger vertical action dispersion than active stars, and for active stars, the dispersion decreases with increasing activity. This indicates that vertical action dispersion, similar to the vertical velocity dispersion, is another age indicator: young stars have low vertical action dispersion while old stars have higher dispersion because they were kinematically heated. Early M-dwarfs in Figure 20 seem to have higher vertical action dispersion; however, this is likely due to the same biases from distant M dwarfs explained above.
Figures 19 and 20 are the first steps to obtaining a functional description of how kinematics indicate the age of low mass stars (e.g. work such as Wielen (1977) for higher mass stars).
5.3 Tangential velocity
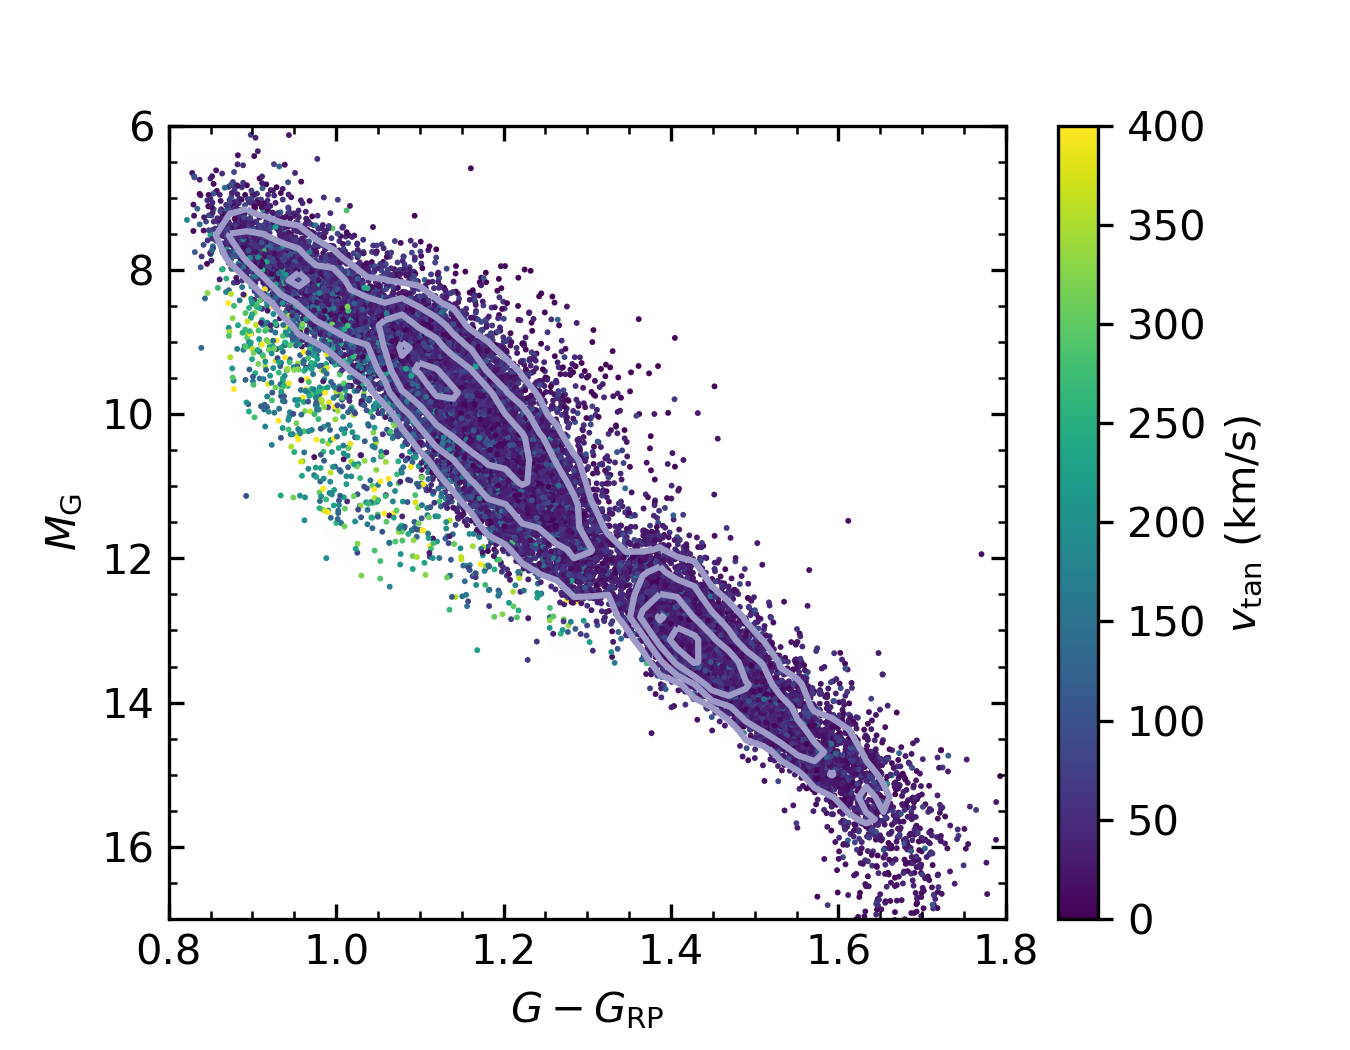
With Gaia DR2 we were able to calculate precise tangential velocities for M and L dwarfs in the MLSDSS-GaiaDR2 sample. To explore the disk and halo populations of stars in our catalog, we studied the correlation between tangential velocity () and color–magnitude diagram position for the MLSDSS-GaiaDR2 sample (Figure 21) as done by previous work (Lepine et al., 2007; Gizis & Reid, 1999; Jao et al., 2017).
There is a significant number of stars below the main sequence for which have a high tangential velocity, with km/s, in comparison to the rest of the stars in the sample, with km/s. Such objects that are blue and fast are likely members of the older thick disk or halo. At least half of these stars were classified as subdwarf candidates with the cuts in Gizis & Reid (1999) and Jao et al. (2017). Furthermore, our stars are in the same place in the color–magnitude diagram as the subdwarfs in Jao et al. (2017), and of them were classified as subdwarfs by Savcheva et al. (2014) (See Section 3.4). These high tangential velocity objects also have low fractional luminosities (see Figure 17). The lack of magnetic activity paired with high tangential velocities, low metallicities, and blue optical colors affirms they are likely an older population of low mass stars.
6 Summary
We compiled the MLSDSS-GaiaDR2 sample of M and L dwarfs. To create the sample we combined two SDSS catalogs: the SDSS DR7 M dwarfs spectroscopic catalog (West et al., 2011) and the BUD catalog (Schmidt et al., 2015, 2019, in prep), into the MLSDSS sample. equivalent widths, spectral types and radial velocities were calculated by the authors of these catalogs. We cross-matched the MLSDSS sample with Gaia DR2 to obtain proper motions and parallaxes for the stars. We found matches and we used a very conservative criterion to identify good matches. We adjusted some of the quality cuts suggested by the Gaia Papers (e.g. Lindegren et al., 2018; Evans et al., 2018; Arenou et al., 2017; Gaia Collaboration et al., 2018a) to make them suitable for the later M and L dwarfs. The final MLSDSS-GaiaDR2 sample contains equivalent widths, spectral types, SDSS, 2MASS and Gaia photometry and proper motions and parallaxes from Gaia DR2. The good astrometric sample contains stars and the good photometry sample for the , and bans have , and stars respectively.
With the MLSDSS-GaiaDR2 sample we calculated mean absolute magnitudes and colors as a function of spectral type using the three photometric bands in Gaia DR2: , and . Furthermore, we characterized the color-color space of the stellar locus for Gaia, SDSS and 2MASS colors. We used the distances calculated with Gaia DR2 parallaxes, which are one order of magnitude better than the photometric distances from MLSDSS, to plot the color–magnitude diagram for the MLSDSS-GaiaDR2 sample. We found that the main sequence widens as it goes towards cooler stars. This effect starts around spectral type M3 and could be related to the transition to fully convective interior. We also used the the MLSDSS-GaiaDR2 SDSS and 2MASS photometry to calculate absolute magnitudes as a function of spectral type and color for the -photometry and , and bands. We compared our results with Hawley et al. (2002) and Bochanski et al. (2011) and found good agreement.
We noticed that active stars are found, on average, at redder colors and/or brighter magnitudes than inactive stars in the color–magnitude diagram. Comparing to the position in the color–magnitude diagram of three young moving groups with different ages we found that youth alone cannot explain the position of active stars. The stars in the MLSDSS-GaiaDR2 sample are mostly high above the galactic plane, therefore unlikely to be young. We hypothesize that the position of active stars might be due to binarity, metallicity and/or that magnetism likely plays a strong role by inflating the radii of the stars and reducing their effective temperature, which makes them look redder.
Furthermore, we found that early types of inactive stars that are faint in absolute magnitude (below the main sequence) have high tangential velocities ( km/s), which indicates they belong to the halo or thick disk and that they are an old population of M dwarfs. Furthermore, of these were identified as subdwarfs by Savcheva et al. (2014).
Finally, we studied the relation between vertical velocity and vertical action dispersion with fractional luminosity. We found that stars with higher activity have lower dispersion both in vertical velocity and vertical action and stars with lower activity or inactive have higher dispersion. As is an age indicator, this means that young (active) stars live close to the plane of the galaxy, so their vertical action and vertical velocity dispersion is small, and old (less active or inactive) stars were kinematically heated, so their dispersion is higher. In future work we will fit these relations using bayesian inference and we will constrain the ages of M and L dwarfs using the age indicators in the MLSDSS-GaiaDR2 sample.
7 Acknowledgements
The authors would like to thank Andrew Mann, John Bochanski, Ricky Smart, Jonathan Gagné and Eric Mamajek for useful discussions and helpful comments on this work. The authors would also like to thank the referee for their comments, which were very useful in clarifying and improving the analysis and results.
This work is supported by: SDSS Faculty and Student Team (FAST) initiative, NASA through the American Astronomical Society’s Small Research Grant Program, the American Museum of Natural History (AMNH) and the National Science Foundation under Grant No. 1614527. This publication makes use of data products from the Two Micron All Sky Survey, which is a joint project of the University of Massachusetts and the Infrared Processing and Analysis Center/California Institute of Technology, funded by the National Aeronautics and Space Administration and the National Science Foundation. Funding for SDSS-III has been provided by the Alfred P. Sloan Foundation, the Participating Institutions, the National Science Foundation, and the U.S. Department of Energy Office of Science. The SDSS-III web site is http://www.sdss3.org/. SDSS-III is managed by the Astrophysical Research Consortium for the Participating Institutions of the SDSS-III Collaboration including the University of Arizona, the Brazilian Participation Group, Brookhaven National Laboratory, University of Cambridge, Carnegie Mellon University, University of Florida, the French Participation Group, the German Participation Group, Harvard University, the Instituto de Astrofisica de Canarias, the Michigan State/Notre Dame/JINA Participation Group, Johns Hopkins University, Lawrence Berkeley National Laboratory, Max Planck Institute for Astrophysics, Max Planck Institute for Extraterrestrial Physics, New Mexico State University, New York University, Ohio State University, Pennsylvania State University, University of Portsmouth, Princeton University, the Spanish Participation Group, University of Tokyo, University of Utah, Vanderbilt University, University of Virginia, University of Washington, and Yale University. Funding for the SDSS and SDSS-II has been provided by the Alfred P. Sloan Foundation, the Participating Institutions, the National Science Foundation, the U.S. Department of Energy, the National Aeronautics and Space Administration, the Japanese Monbukagakusho, the Max Planck Society, and the Higher Education Funding Council for England. The SDSS Web Site is http://www.sdss.org/. The SDSS is managed by the Astrophysical Research Consortium for the Participating Institutions. The Participating Institutions are the American Museum of Natural History, Astrophysical Institute Potsdam, University of Basel, University of Cambridge, Case Western Reserve University, University of Chicago, Drexel University, Fermilab, the Institute for Advanced Study, the Japan Participation Group, Johns Hopkins University, the Joint Institute for Nuclear Astrophysics, the Kavli Institute for Particle Astrophysics and Cosmology, the Korean Scientist Group, the Chinese Academy of Sciences (LAMOST), Los Alamos National Laboratory, the Max-Planck-Institute for Astronomy (MPIA), the Max-Planck-Institute for Astrophysics (MPA), New Mexico State University, Ohio State University, University of Pittsburgh, University of Portsmouth, Princeton University, the United States Naval Observatory, and the University of Washington.
This work has made use of data from the European Space Agency (ESA) mission Gaia (https://www.cosmos.esa.int/gaia), processed by the Gaia Data Processing and Analysis Consortium (DPAC, https://www.cosmos.esa.int/web/gaia/dpac/consortium). Funding for the DPAC has been provided by national institutions, in particular the institutions participating in the Gaia Multilateral Agreement.
Part of this research was done at the NYC Gaia DR2 Workshop at the Center for Computational Astrophysics of the Flatiron Institute in 2018 April.
References
- Abazajian et al. (2009) Abazajian, K. N., Adelman-McCarthy, J. K., Agüeros, M. A., et al. 2009, Astrophys. J. Suppl. Ser., 182, 543, doi: 10.1088/0067-0049/182/2/543
- Ahn et al. (2014) Ahn, C. P., Alexandroff, R., Allende Prieto, C., et al. 2014, Astrophys. Journal, Suppl. Ser., 211, 1, doi: 10.1088/0067-0049/211/2/17
- Alam et al. (2015) Alam, S., Albareti, F. D., Prieto, C. A., et al. 2015, Astrophys. Journal, Suppl. Ser., 219, doi: 10.1088/0067-0049/219/1/12
- Angus et al. (2015) Angus, R., Aigrain, S., Foreman-Mackey, D., & McQuillan, A. 2015, Mon. Not. R. Astron. Soc., 450, 1787, doi: 10.1093/mnras/stv423
- Arenou et al. (2017) Arenou, F., Luri, X., Babusiaux, C., et al. 2017, A&A, 599, A50, doi: 10.1051/0004-6361/201629895
- Astropy Collaboration et al. (2013) Astropy Collaboration, Robitaille, T. P., Tollerud, E. J., et al. 2013, A&A, 558, A33, doi: 10.1051/0004-6361/201322068
- Aumer et al. (2016) Aumer, M., Binney, J., & Schönrich, R. 2016, Mon. Not. R. Astron. Soc., 462, 1697, doi: 10.1093/mnras/stw1639
- Bailer-Jones et al. (2018) Bailer-Jones, C. A. L., Rybizki, J., Fouesneau, M., Mantelet, G., & Andrae, R. 2018, Astron. J., 156, 11, doi: 10.3847/1538-3881/aacb21
- Baliunas et al. (1995) Baliunas, S. L., Donahue, R. A., Soon, W. H., et al. 1995, Astrophys. J., 438, 269, doi: 10.1086/175072
- Baraffe et al. (2015) Baraffe, I., Homeier, D., Allard, F., & Chabrier, G. 2015, Astron. Astrophys., 577, A42, doi: 10.1051/0004-6361/201425481
- Barnes (2007) Barnes, S. A. 2007, Astrophys. J., 669, 1167, doi: 10.1086/519295
- Barry (1988) Barry, D. C. 1988, Astrophys. J., 334, 436, doi: 10.1086/166848
- Binney (2012) Binney, J. 2012, Mon. Not. R. Astron. Soc., 426, 1324, doi: 10.1111/j.1365-2966.2012.21757.x
- Bochanski et al. (2010) Bochanski, J. J., Hawley, S. L., Covey, K. R., et al. 2010, Astron. J., 139, 2679, doi: 10.1088/0004-6256/139/6/2679
- Bochanski et al. (2011) Bochanski, J. J., Hawley, S. L., & West, A. A. 2011, Astron. J., 141, 12, doi: 10.1088/0004-6256/141/3/98
- Bochanski et al. (2013) Bochanski, J. J., Savcheva, A. S., West, A. A., & Hawley, S. L. 2013, Astron. J., 145, 40, doi: 10.1088/0004-6256/145/2/40
- Bochanski et al. (2007) Bochanski, J. J., West, A. A., Hawley, S. L., & Covey, K. R. 2007, Astron. J., 133, 531, doi: 10.1086/510240
- Bovy (2015) Bovy, J. 2015, Astrophys. Journal, Suppl. Ser., 216, 29, doi: 10.1088/0067-0049/216/2/29
- Bovy & Rix (2013) Bovy, J., & Rix, H. W. 2013, Astrophys. J., 779, doi: 10.1088/0004-637X/779/2/115
- Chabrier & Baraffe (1997) Chabrier, G., & Baraffe, I. 1997, Astron. Astrophys., 327, 1039
- Chaplin et al. (2014) Chaplin, W. J., Basu, S., Huber, D., et al. 2014, Astrophys. Journal, Suppl. Ser., 210, 1, doi: 10.1088/0067-0049/210/1/1
- Covey et al. (2007) Covey, K. R., Ivezic, Z., Schlegel, D. J., et al. 2007, Astron. J., 134, 2398, doi: 10.1086/522052
- Cruz et al. (2018) Cruz, P., Diaz, M., Birkby, J., et al. 2018, Mon. Not. R. Astron. Soc., 476, 5253, doi: 10.1093/mnras/sty541
- Davenport et al. (2014) Davenport, J. R., Ivezić, Ž., Becker, A. C., et al. 2014, Mon. Not. R. Astron. Soc., 440, 3430, doi: 10.1093/mnras/stu466
- Dawson et al. (2013) Dawson, K. S., Schlegel, D. J., Ahn, C. P., et al. 2013, Astron. J., 145, 2013, doi: 10.1088/0004-6256/145/1/10
- Delfosse et al. (1998) Delfosse, X., Forveille, T., Perrier, C., & Mayor, M. 1998, Astron. Astrophys., 331, 581
- Dhital et al. (2012) Dhital, S., West, A. A., Stassun, K. G., et al. 2012, Astron. J., 143, 67, doi: 10.1088/0004-6256/143/3/67
- Donahue et al. (1996) Donahue, R. A., Saar, S. H., & Baliunas, S. L. 1996, Astrophys. J., 466, 384, doi: 10.1086/177517
- Edvardsson et al. (1993) Edvardsson, B., Anderson, J., Gustaffson, B., et al. 1993, Astron. Astrophys., 275, 101
- Eggen (1990) Eggen, O. J. 1990, Astron. Soc. Pacific, 102, 166
- Eisenstein et al. (2011) Eisenstein, D. J., Weinberg, D. H., Agol, E., et al. 2011, Sept. Astron. J., 142, 72, doi: 10.1088/0004-6256/142/3/72
- Evans et al. (2018) Evans, D. W., Riello, M., De Angeli, F., et al. 2018, Astron. Astrophys., 616, A4, doi: 10.1051/0004-6361/201832756
- Fagotto et al. (1994) Fagotto, F., Bressan, A., Bertelli, G., & Chiosi, C. 1994, Astron. Astrophys. Suppl. Ser., 105, 29
- Faherty et al. (2018) Faherty, J. K., Bochanski, J. J., Gagné, J., et al. 2018, Astrophys. J., 863, 22, doi: 10.3847/1538-4357/aac76e
- Faherty et al. (2009) Faherty, J. K., Burgasser, A. J., Cruz, K. L., et al. 2009, Astron. J., 137, 1, doi: 10.1088/0004-6256/137/1/1
- Fleming et al. (1995) Fleming, T. A., Schmitt, J. H. M. M., & Giampapa, M. S. 1995, Astrophys. J., 450, 401, doi: 10.1086/176150
- Gagné & Faherty (2018) Gagné, J., & Faherty, J. K. 2018, Astrophys. J., 862, 138, doi: 10.3847/1538-4357/aaca2e
- Gaia Collaboration et al. (2018a) Gaia Collaboration, Babusiaux, C., Leeuwen, F. V., et al. 2018a, Astron. Astrophys., 616, A10, doi: 10.1051/0004-6361/201832843
- Gaia Collaboration et al. (2018b) Gaia Collaboration, Brown, A. G. A., Vallenari, A., Prusti, T., & J, D. B. J. H. 2018b, Astron. Astrophys., 616, A1, doi: 10.1051/0004-6361/201833051
- Gaia Collaboration et al. (2016) Gaia Collaboration, Prusti, T., de Bruijne, J. H. J., et al. 2016, Astron. Astrophys., 595, A1, doi: 10.1051/0004-6361/201629272
- Gizis et al. (2000) Gizis, J. E., Monet, D. G., Reid, I. N., et al. 2000, Astron. J., 120, 1085, doi: 10.1086/301456
- Gizis & Reid (1999) Gizis, J. E., & Reid, I. N. 1999, Astron. J., 117, 508, doi: 10.1086/300709
- Gould et al. (1996) Gould, A., Bahcall, J. N., & Flynn, C. 1996, Astrophys. J., 465, 759, doi: 10.1086/177460
- Hänninen & Flynn (2002) Hänninen, J., & Flynn, C. 2002, Mon. Not. R. Astron. Soc., 337, 731, doi: 10.1046/j.1365-8711.2002.05956.x
- Hawley et al. (2002) Hawley, S. L., Covey, K. R., Knapp, G. R., et al. 2002, Astron. J., 123, 3409, doi: 10.1086/340697
- Hunter (2007) Hunter, J. D. 2007, Computing In Science & Engineering, 9, 90
- Jao et al. (2008) Jao, W.-C., Henry, T. J., Beaulieu, T. D., & Subasavage, J. P. 2008, Astron. J., 136, 840, doi: 10.1088/0004-6256/136/2/840
- Jao et al. (2017) Jao, W.-C., Henry, T. J., Winters, J. G., et al. 2017, Astron. J., 154, 191, doi: 10.3847/1538-3881/aa8b64
- Jones et al. (2001) Jones, E., Oliphant, T., Peterson, P., & Others. 2001, SciPy: Open source scientific tools for Python. http://www.scipy.org/
- Kesseli et al. (2018) Kesseli, A. Y., Muirhead, P. S., Mann, A. W., & Mace, G. 2018, Astron. J., 155, 14, doi: 10.3847/1538-3881/aabccb
- Laughlin et al. (1997) Laughlin, G., Bodenheimer, P., & Adams, F. C. 1997, Astrophys. J., 482, 420, doi: 10.1086/304125
- Lepine et al. (2007) Lepine, S., Rich, R. M., & Shara, M. M. 2007, Astrophys. J., 669, 1235, doi: 10.1086/521614
- Lépine & Scholz (2008) Lépine, S., & Scholz, R.-D. 2008, Astrophys. J., 681, 33, doi: 10.1086/590183
- Lindegren (2018) Lindegren, L. 2018
- Lindegren et al. (2018) Lindegren, L., Hernandez, J., Bombrun, A., et al. 2018, Astron. Astrophys., 616, A2, doi: 10.1051/0004-6361/201832727
- Lopez-Morales & Ribas (2005) Lopez-Morales, M., & Ribas, I. 2005, Astrophys. J., 631, 1120, doi: 10.1086/432680
- Mamajek & Hillenbrand (2008) Mamajek, E. E., & Hillenbrand, L. A. 2008, Astrophys. J., 687, 1264, doi: 10.1086/591785
- Mann et al. (2015) Mann, A. W., Feiden, G. A., Gaidos, E., Boyajian, T., & Braun, K. V. 2015, Astrophys. J., 804, 1, doi: 10.1088/0004-637X/804/1/64
- Meibom et al. (2015) Meibom, S., Barnes, S. A., Platais, I., et al. 2015, Nature, 517, 589, doi: 10.1038/nature14118
- Mohanty & Basri (2003) Mohanty, S., & Basri, G. 2003, Astrophys. J., 583, 451, doi: 10.1086/345097
- Morales et al. (2009) Morales, J. C., Torres, G., Marschall, L. A., & Brehm, W. 2009, Astrophys. J., 707, 671, doi: 10.1088/0004-637X/707/1/671
- Morgan et al. (2012) Morgan, D. P., West, A. A., Garcés, A., et al. 2012, Astron. J., 144, 93, doi: 10.1088/0004-6256/144/4/93
- Munn et al. (2014) Munn, J. A., Harris, H. C., Von Hippel, T., et al. 2014, Astron. J., 148, doi: 10.1088/0004-6256/148/6/132
- Newton et al. (2017) Newton, E. R., Irwin, J., Charbonneau, D., et al. 2017, Astrophys. J., 834, 85, doi: 10.3847/1538-4357/834/1/85
- Nordstrom et al. (2004) Nordstrom, B., Mayor, M., Andersen, J., et al. 2004, Astron. Astrophys., 418, 989, doi: 10.1051/0004-6361:20035959
- Parker (1955) Parker, E. N. 1955, Astrophys. J., 122, 293, doi: 10.1086/146087
- Pineda et al. (2013) Pineda, S. J., West, A. A., Bochanski, J. J., & Burgasser, A. J. 2013, Astron. J., 146, 50, doi: 10.1088/0004-6256/146/3/50
- Price-Whelan et al. (2018) Price-Whelan, A. M., Sipőcz, B. M., Günther, H. M., et al. 2018, AJ, 156, 123, doi: 10.3847/1538-3881/aabc4f
- Reiners & Basri (2009) Reiners, A., & Basri, G. 2009, Astrophys. J., 705, 1416, doi: 10.1088/0004-637X/705/2/1416
- Reiners et al. (2012) Reiners, A., Joshi, N., & Goldman, B. 2012, Astron. J., 143, 93, doi: 10.1088/0004-6256/143/4/93
- Riedel et al. (2017) Riedel, A. R., Alam, M. K., Rice, E. L., Cruz, K. L., & Henry, T. J. 2017, Astrophys. J., 840, doi: 10.3847/1538-4357/840/2/87
- Rodríguez et al. (2016) Rodríguez, E., Rodríguez-López, C., López-González, M. J., et al. 2016, Mon. Not. R. Astron. Soc., 457, 1851, doi: 10.1093/mnras/stw033
- Savcheva et al. (2014) Savcheva, A. S., West, A. A., & Bochanski, J. J. 2014, Astrophys. J., 794, 145, doi: 10.1088/0004-637X/794/2/145
- Schlegel et al. (1998) Schlegel, D. J., Finkbeiner, D. P., & Davis, M. 1998, Astrophys. J., 500, 525, doi: 10.1086/305772
- Schmidt et al. (2007) Schmidt, S. J., Cruz, K. L., Bongiorno, B. J., Liebert, J., & Reid, I. N. 2007, Astron. J., 133, 2258, doi: 10.1086/512158
- Schmidt et al. (2015) Schmidt, S. J., Hawley, S. L., West, A. A., et al. 2015, Astron. J., 149, doi: 10.1088/0004-6256/149/5/158
- Schmidt et al. (2019) Schmidt, S. J., Hawley, S. L., West, A. A., Bochanski, J. J., & Dhital, S. 2019
- Schmidt et al. (2014) Schmidt, S. J., West, A. A., Bochanski, J. J., Lawley, S. L., & Kielty, C. 2014, Publ. Astron. Soc. Pacific, 126, 642, doi: 10.1086/677403
- Schmidt et al. (2010) Schmidt, S. J., West, A. A., Hawley, S. L., & Pineda, J. S. 2010, Astron. J., 139, 1808, doi: 10.1088/0004-6256/139/5/1808
- Shkolnik et al. (2011) Shkolnik, E. L., Liu, M. C., Reid, I. N., Dupuy, T., & Weinberger, A. J. 2011, Astrophys. J., 727, 6, doi: 10.1088/0004-637X/727/1/6
- Skrutskie et al. (2006) Skrutskie, M. F., Cutri, R. M., Stiening, R., et al. 2006, Astron. J., 131, 1163, doi: 10.1086/498708
- Skumanich (1972) Skumanich, A. 1972, Astrophys. J., 171, 565, doi: 10.1086/151310
- Smolčić et al. (2004) Smolčić, V., Ivezić, Ž., Knapp, G. R., et al. 2004, Astrophys. J., 615, L141, doi: 10.1086/426475
- Soderblom (2010) Soderblom, D. R. 2010, Annu. Rev. Astron. Astrophys., 48, 581, doi: 10.1146/annurev-astro-081309-130806
- Soderblom et al. (1991) Soderblom, D. R., Duncan, D. K., & Johnson, D. R. H. 1991, Astrophys. J., 375, 722, doi: 10.1086/170238
- Somers & Stassun (2017) Somers, G., & Stassun, K. G. 2017, Astron. J., 153, 17, doi: 10.3847/1538-3881/153/3/101
- Stassun et al. (2012) Stassun, K. G., Kratter, K. M., Scholz, A., & Dupuy, T. J. 2012, Astrophys. J., 756, 47, doi: 10.1088/0004-637X/756/1/47
- Taylor (2005) Taylor, M. B. 2005, in Astronomical Society of the Pacific Conference Series, Vol. 347, Astronomical Data Analysis Software and Systems XIV, ed. P. Shopbell, M. Britton, & R. Ebert, 29
- Torres (2013) Torres, G. 2013, Astron. Nachrichten, 334, 4, doi: 10.1002/asna.201211743
- Van Der Walt et al. (2011) Van Der Walt, S., Colbert, S. C., & Varoquaux, G. 2011, Computing in Science & Engineering, 13, 22
- Van Saders et al. (2016) Van Saders, J. L., Ceillier, T., Metcalfe, T. S., et al. 2016, Nature, 529, 181, doi: 10.1038/nature16168
- West et al. (2006) West, A. A., Bochanski, J. J., Hawley, S. L., et al. 2006, Astron. J., 132, 2507, doi: 10.1086/508652
- West et al. (2008a) West, A. A., Hawley, S. L., Bochanski, J. J., Covey, K. R., & Burgasser, A. J. 2008a, Proc. Int. Astron. Union, 4, 327, doi: 10.1017/S1743921309031986
- West et al. (2008b) West, A. A., Hawley, S. L., Bochanski, J. J., et al. 2008b, Astron. J., 135, 785, doi: 10.1088/0004-6256/135/3/785
- West et al. (2015) West, A. A., Weisenburger, K. L., Irwin, J., et al. 2015, Astrophys. J., 812, 3, doi: 10.1088/0004-637X/812/1/3
- West et al. (2004) West, A. A., Hawley, S. L., Walkowicz, L. M., et al. 2004, Astron. J., 128, 426, doi: 10.1086/421364
- West et al. (2011) West, A. A., Morgan, D. P., Bochanski, J. J., et al. 2011, Astron. J., 141, 97, doi: 10.1088/0004-6256/141/3/97
- Wielen (1977) Wielen, R. 1977, Astron. Astrophys., 60, 263
- Wright et al. (2010) Wright, E. L., Eisenhardt, P. R., Mainzer, A. K., et al. 2010, Astron. J., 140, 1868, doi: 10.1088/0004-6256/140/6/1868
- York et al. (2000) York, D. G., Adelman, J., Anderson, J. E., et al. 2000, Astron. J., 120, 1579, doi: 10.1086/301513
- Yu & Liu (2018) Yu, J., & Liu, C. 2018, Mon. Not. R. Astron. Soc., 475, 1093, doi: 10.1093/mnras/stx3204
- Zapatero Osorio et al. (2007) Zapatero Osorio, M. R., Martin, E. L., Bejar, V. J. S., et al. 2007, Astrophys. J., 666, 1205, doi: 10.1086/520673