Imaging recoil ions from optical collisions between ultracold, metastable neon isotopes
Abstract
We present an experimental scheme which combines the well established method of velocity-map-imaging, with a cold trapped metastable neon target. The device is used for obtaining the branching ratios and recoil-ion energy distributions for the penning ionization process in optical collisions of ultracold metastable neon. The potential depth of the highly excited dimer potential is extracted and compared with theoretical calculations. The simplicity to construct, characterize, and apply such a device, makes it a unique tool for the low-energy nuclear physics community, enabling opportunities for precision measurements in nuclear decays of cold, trapped, short-lived radioactive isotopes.
Excited states of noble gases harbor sufficient energy to ionize most atoms and molecules upon collision. These reactive collisional processes play a crucial role in early universe chemistry Gerlich et al. (2012), have been identified as important for the evolution of planetary atmospheres Falcinelli et al. (2015), and the chemistry of cold interstellar medium van der Poel and Bethlem (2018).
Noble gas atoms posses a long-lived metastable state which is amenable to the methods of laser-cooling and trapping Metcalf and Van der Straten (2007); Vassen et al. (2012), leading to ultracold (mK), dense (/cm3) samples, in which collisional processes occur predominantly in the quantum regime, where only a few partial waves contribute. However, a major difficulty arises for quantum mechanical calculations of these reaction processes, owing to the coupling of the entrance molecular channel to the ionization continuum Hauser et al. (2015), and the highly excited nature of the reactants Skomorowski et al. (2016).
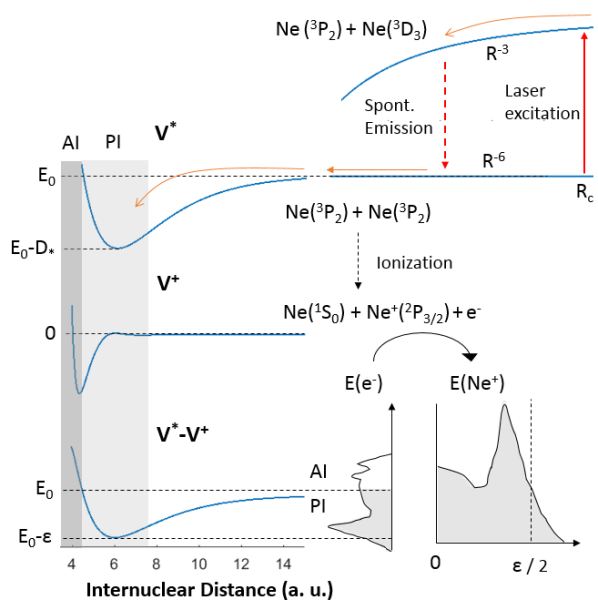
An appreciable microscopic understanding of these reactions stems from an agreement between state of the art, relativistic ab initio potentials and ionization widths, and ample, precise experimental input. Experiments investigating single or dual species ultracold collisions, usually measure trap loss and ionization rates Skomorowski et al. (2016); Kuppens et al. (2002); Stas et al. (2006); Busch et al. (2006); Glover et al. (2011); Flores et al. (2016), and in some implementations employ mass-spectroscopic techniques for separating the reaction products Mastwijk et al. (1998); Deiglmayr et al. (2008); Carini et al. (2013); Bibelnik et al. (2019). Thus, theoretical calculations, which have many degrees of freedom, are calibrated by comparing to a single, global quantity such as a reaction cross-section or the branching ratio to an ionic species Cop and Walser (2018); Cocks et al. (2019). However, accurate determinations of the energy distributions of electrons and ions, routinely employed for molecular beams Siska (1993), offer a high resolution window as to the involved potential energy surfaces (Fig. 1).
Modern determinations of charged fragments angle-resolved energy distributions usually rely on two powerful techniques: Cold Target Recoil Ion Micrsocopy (COLTRIMS), reviewed in Dörner et al. (2000), and Velocity Map Imaging (VMI) Eppink and Parker (1997); Chandler et al. (2017). The merging of these methods with laser-cooling and trapping techniques, offers substantial advantages over beam experiments and opens up new areas of research. Moreover, ultracold samples harbor the possibility of quantum-state preparation, and coherent control of collisional properties Arango et al. (2006). From a nuclear physics point-of-view, a cold, trapped, short-lived (typically s) sample, constitutes the ideal target for precision Beta- Behr and Gwinner (2009), and Beta-delayed-neutron- Yee et al. (2013) decay studies.
Owing to the aforementioned advantages, COLTRIMS has been successfully incorporated with a Magneto-Optical-Trap (MOT) target to create the so-called MOTRIMS devices Brédy et al. (2003). Nevertheless, the cost, complexity and the level of involvement of its operation Weger et al. (2013), as well as the inherently low rates and efficiencies Kling et al. (2014), have limited the use of MOTRIMS to a few groups within the atomic and molecular physics community DePaola et al. (2008); Blieck et al. (2009), and precluded it from being adopted by nuclear physicists.
In this letter we report a successful implementation of a simple, efficient, MOT-VMI device. Utilizing its abilities, we report precise values for penning and associative ionization (PI and AI respectively) branching ratios (BRs), as well as recoil ion energy distribution from cold, optical collisions between trapped metastable neon isotopes. From the energy distributions we extract the potential well depth of the highly excited molecular potential, and compare with ab initio calculations and similar systems.
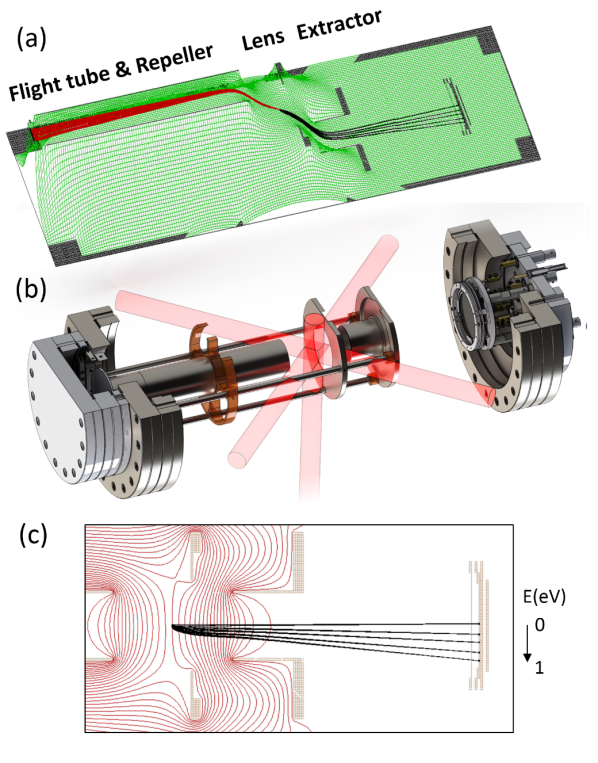
A traditional VMI setup consists of a repeller electrode, a gridless ring electrode acting as an electrostatic lens, and a gridless, grounded ring extractor Eppink and Parker (1997). The voltage difference between the repeller and extractor, along with the size and distance of the imaging detector, sets the scale of energies to be detected. The lens voltage and shape are optimized so as to cancel the effect of the finite source size. Particles with the same momentum, emerging from different locations within the target volume are imaged to the same location on the detector. Once the dynamic range is selected, the device is optimized by fine adjustment of the lens voltage. The energy resolution in most VMI setups is determined by the effective target volume, the quality of focusing and the intrinsic resolution of the detection system. For low to medium ( eV) energy charged particles, most reported values are in the range of , which is accomplished here as well.
Figure 2, presents our adaptation of the VMI geometry to the magneto-optical-trap environment. The cooling and trapping setup includes a dynamically reconfigurable Zeeman-Slower Ohayon and Ron (2015), and a state- and isotope-selective deflection stage in Mardor et al. (2018). For merging the VMI and the MOT, we elected to use the simple, cylindrically-symmetric, three-electrode arrangement, where we merged the repeller with a flight-tube for coincidence time-of-flight (TOF) detection. The radii and positions of various elements are optimized within the geometrical constraints of the MOT using the simulation package SIMION 8.1, to maximize the focusing capabilities for a variety of modes-of-operation.
The internal energy of cold, trapped metastable neon, eV, exceeds the ionization potential of most atoms and molecules. The ionization reaction between a metastable noble atom Rg∗ and a molecule AB may be described schematically as:
where the excited molecule [RgAB]∗ autoionizes instantly to form a nascent ionic complex. The emitted electron takes most of the available energy , while a portion of it is deposited in ro-vibrational levels of the nascent ion. The resulting ionic complex may remain intact, in which case the entire process is called associative ionization (AI), or dissociate to a number of possible channels Sanders and Muschlitz (1977):
| (PI) | ||
| (RI) | ||
| (DI). |
These are labeled penning ionization (PI), rearrangement ionization (RI), and dissociation ionization (DI). Considering both cold collisions within the trap (intra-trap) and with thermal background gasses (inter-trap), all of the aforementioned reactions are present in our system.
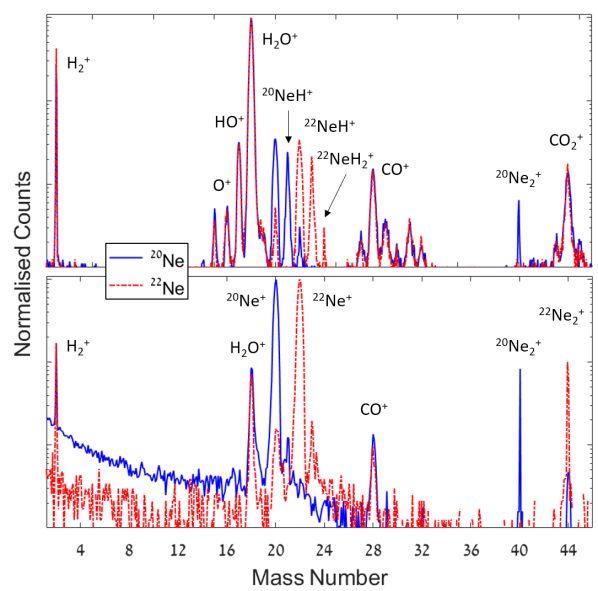
Figure 3 presents the mass-calibrated time-of-flight spectrum of recoil ions detected when trapping 20Ne∗ or 22Ne∗.
| Mass | Eavg | H2O+ | HO+ | O+ | Ref. |
|---|---|---|---|---|---|
| number | meV | % | % | % | |
| 20 | 17 | 96.2(5) | 3.3(5) | 0.46(3) | This Work |
| 22 | 18 | 96.8(5) | 2.8(5) | 0.45(10) | This Work |
| 20+22 | 55 | 96.2(9.6) | 3.2(5) | 0.6(1) | Falcinelli et al. (2015, 2016) |
| 20+22 | 70 | 96.7 | 2.9 | 0.4 | Balucani et al. (2012) |
At moderate vacuum conditions, and low trap density, water peaks are prominent, due to the large ionization cross section of H2O-Ne∗, resulting from their strong attraction Brunetti et al. (2013). We checked that branching ratios (BR) for ions resulting from Ne∗-H2O collisions are stable with changing laser power, detuning, magnetic field strength, and by alternating between 20,22Ne. These are reported in table 1, and are in superb agreement with Balucani et al. (2012), who utilized a crossed-beam technique. In accordance with Balucani et al. (2012), no evidence (BR ) was found for AI, indicated by the lack of NeH2O+ ions.
The trap density is many orders of magnitude higher than the Ne∗ background and so neon ions and dimers result solely from intra-trap collisions. In the presence of a strong, near resonant, light field, half of the atoms are in the 3D3 excited state, where they experience a strong attraction to the metastable 3P2 state, due to the resonant dipole-dipole interaction between them. In these optically-assisted collisions, portrayed in Fig. 1, the two atoms are accelerated toward small internuclear distances where the probability of ionization is significantly larger. This process increases the collision rates by two orders of magnitude Glover et al. (2011).
From mass spectra similar to Fig. 3, we find that the presence of near-resonant laser light, increased the formation of dimers by at least a factor of two, providing strong evidence for photoassociation in cold neon collisions (see the Supplemental Material Sup , which includes refs Oberheide et al. (1997a); Ohayon et al. (2019a, 2015a), for a discussion on the extraction of branching ratios). This enhancement is qualitatively understood from the process portrayed in Fig. 1, where the accelerated dimer at the potential has a larger probability of reaching a small internuclear distance of roughly a.u. where the ionic potentials become strongly attractive, leading to positive difference potentials which promote association. The branching ratios for the creation of neon dimer ions are presented in table 2 along with collision rates from the literature, and compared with results for trapped metastable helium. Previous investigations into optical collisions in neon traps, by Van Drunen (2008) and Glover et al. (2011), did not detect PI and AI separately.
| cm3/s | cm3/s | Ref. | |
|---|---|---|---|
| Ne2++Ne+ | Glover et al. (2011); Kuppens et al. (2002) | ||
| Ne2+/Ne+ | This Work | ||
| He2++He+ | Tol et al. (1999); Stas et al. (2006) | ||
| He2+/He+ | Mastwijk et al. (1998) |
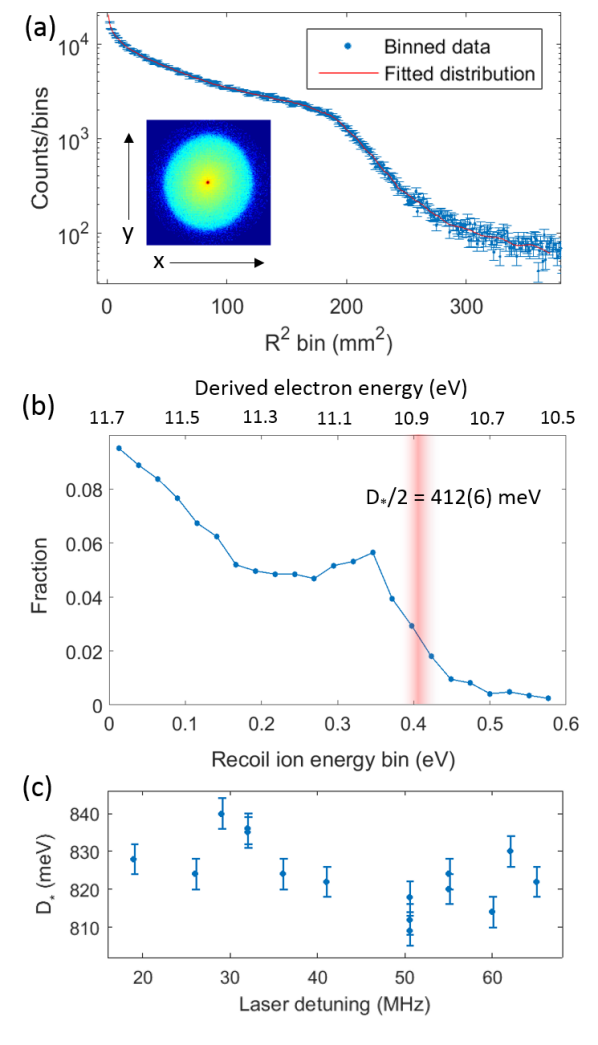
The MOT-VMI enables high-resolution detection of the recoil energy distribution of penning ions from ultra-cold collisions. An example of which, taken without coincidence-detection, with a times less water background, and denser trap, as compared to the conditions of Fig. 3 top, is shown in Fig. 4. Since the reactants are cold, the penning ion kinetic energy , is equal to half of the missing energy of the penning electrons Pieksma et al. (2002)
| (1) |
Thus, it offers a high resolution window, free of the eV offset, into the quantum-governed dynamics of the penning ionization process. As shown in figure 1, the lowest energy electrons, which correspond to the highest energy ions, result from ionization near the minimum of the difference potential . Following the recipe of Miller (1970); Hotop (1974) usually applied to electron spectra, and utilizing Eq. 1, may be extracted in a straightforward manner from the edge at the high energy side of the penning ion distribution (Fig. 4b). To extract information on , we utilize the consistency between various estimations of the location of minima of , at a.u. Doery et al. (1998a); Kotochigova et al. (2000), and the observation that the well-known ionic potentials do not vary substantially from zero around Trevor et al. (1984); Carrington et al. (2002). Thus the well-depth of lowest potential may be evaluated directly from
| (2) |
The results of various determinations of are presented in Fig. 4c, where they are found to not vary substantially with laser detuning. This observation further indicates that most optical ionization collisions in neon occur after the spontaneous emission of a photon, in contrast with the case for He∗ Mastwijk et al. (1998), which has a longer lived excited state and a smaller mass (see Supplemental Material Sup , which includes Refs. Doery et al. (1998b); Gallagher and Pritchard (1989a), for further discussion on the probability for spontaneous emission).
We estimate the uncertainty of the most repulsive as meV resulting from the uncertainty in and conclude that the deepest potential depth for Ne∗(3P2)-Ne∗(3P2) is meV. Kotochigova et. al. Kotochigova et al. (2000), utilized a nonrelativistic multiconfiguration valence-bond method to calculate these potentials at short range ab initio. They report that the deepest attractive potential, labeled , has a well-depth of meV, in strong disagreement with our findings. This discrepancy is to some extent resolved when considering approximate short-range potentials based on Na2 developed by Doery et al. (1998a), where the inclusion of spin-orbit interactions increased the well-depths by roughly meV. Our result is compared with similar collisional systems in table 3.
To conclude, we successfully implemented a simple, versatile, MOT-VMI device, and demonstrated a few of its applications by conducting precise measurements of branching ratios and energy spectra of recoil ions emerging from inter- and intra- trap collisions. The branching ratios for ionizing process in metastable neon colliding with water molecules are in superb agreement with those measured in crossed-beam experiments and may be beneficial for advancing the understanding of the penning ionization processes in planetary atmospheres Falcinelli et al. (2015). Through the increase in the branching ratio for associative ionization in the presence of the trapping laser, we find long sought evidence for photoassociation processes in noble gasses other than helium. Utilizing the imaging capabilities and a fast and simple inversion scheme, we obtain the energy distribution of recoil neon ions from cold optical collisions within the trap. The well-depth of the lowest, highly excited molecular potential, is extracted, and disagrees with nonrelativistic ab initio calculations, demonstrating the dramatic effect of spin-orbit coupling, and the necessity of including relativistic effects in ab initio calculations of highly excited molecular potentials. The simplicity of construction, operation, and data analysis of the MOT-VMI makes it a compelling new tool for investigations of reactive processes in ultracold chemistry, and coherent control of the outcome of ionizing collisions Arango et al. (2006); Carini et al. (2015); Omiste et al. (2018).
Our entire system is located above the beamline of the Soreq Applied Research Accelerator (SARAF) Mardor et al. (2018), and we intend to utilize the MOT-VMI for precision measurements of recoil ions from the beta-decay of short-lived neon isotopes, in search of new physics in the weak sector of the standard model Ohayon et al. (2018).
| He∗(3S) | Ne∗(3P2) | Li(2S) | Na(2S) | |
|---|---|---|---|---|
| He∗(3S) | 850(90)a | 500(100)b | 868(20)c | 740(25)c |
| Ne∗(3P2) | 500(100)b | 824(22)d | 798(30)e | 678(18)f |
| Ar∗(3P2) | 300(50)g | 602(23)f | ||
| a Estimation based on Pieksma et al. (2002) | ||||
| b Ref. Neynaber and Tang (1980a) | c Ref. Hotop et al. (1998) | d This Work | ||
| e Ref. Lorenzen et al. (1986) | f Ref. Schohl et al. (1990) | g Ref. Neynaber and Tang (1980b) |
The work presented here is supported by grants from the Pazy Foundation (Israel), Israel Science Foundation (grants no. 139/15 and 1446/16), and the European Research Council (grant no. 714118 TRAPLAB). BO is supported by the Ministry of Science and Technology, under the Eshkol Fellowship.
I Supplemental Material
I.1 Probability of spontaneous emission
The atomic pair is excited from a weak Van der Waals attractive potential to a strong dipole-dipole potential . Out of the excited molecular potentials, the strongest attractive potentials have coefficients of up to a.u. Doery et al. (1998c).
Within the Gallagher-Pritchard model for optically assisted collisions Gallagher and Pritchard (1989b), the maximal semi-classical excitation rate of the pair, is attained at the Condon distance , corresponding to a.u. for red detunings of MHz. The time it takes to reach a small (few a.u.) interatomic distance, where ionization is probable, is ns. The probability for molecular spontaneous emission, with rate MHz, before the ionization process occurs, is Gallagher and Pritchard (1989b).
We conclude that at the small detunings considered in this work, most collisions occur at the ground Ne*-Ne* potential, following light-induced acceleration. A future direction for this work is the introduction another intense laser beam at large red detuning ( GHz) to induce ionizing collisions in the molecular laser-excited states.
I.2 Extraction of branching ratios
The branching ratios for Ne/Ne+ are extracted from calibrated mass spectra in efficient time-of-flight (TOF) mode. Ions are accelerated in the flight tube by keeping it and the micro-channel-plate (MCP) detector top plate at kV, ensuring similar quantum efficiency for a variety of ionic masses Oberheide et al. (1997b). Electrons are deflected by the flight tube and are efficienctly detected in coincidence on a grounded position sensitive MCP, in which their hit position is monitored. For each measurement sequence, we alternated between trapping of 20Ne and 22Ne by offsetting the trapping laser frequency by their isotope shift of GHz Ohayon et al. (2019b). A degree isotopic-selective deflection stage ensures that only metastable states of the selected isotope reach the trapping volume, and that the trapped cloud is not ionized by VUV radiation emanating from the metastable-source Ohayon et al. (2015b).
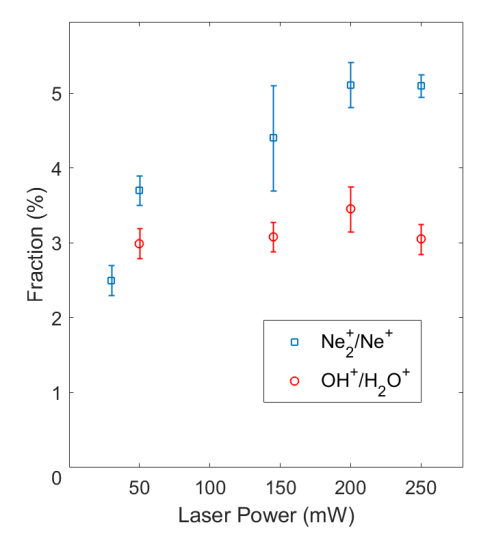
Fig. 5 presents the branching ratios (BR) extracted from mass spectra, as a function of trapping laser power. Uncertainties are dominated by counting statistics due to the small fraction of Ne, as well as employing different models for the background counts. The branching ratio displays a pronounced enhancement when increasing laser power. To test that this enhancement is not an artifact of the change in trap density or position, we extract for each spectra the OH+/H2O+ branching ratio as well, which has similar uncertainty, and does not show such an enhancement. For the minimal laser power, the use of an ion pump to remove the water background precluded the measurement of the OH+/H2O+ BR.
We find that the Ne+/H2O ratio increases by roughly a factor between minimal and maximal trapping laser power, while keeping the neon flux and vacuum conditions constant, indicating a large enhancement of the intratrap ion yield in the presence of laser light. This increase is in accordance with the literature values cited in table II of the main text.
A future direction of this experiment is an implementation of fast-switching of the trapping laser, in coincidence with the detection system, to extract the BR for collisions in the dark.
I.3 Inversion of VMI image
In most cases where a VMI image requires inversion, one uses one of the many fast, efficient and well tested Abel-inversion codes Whitaker (2003b). Nevertheless, we opted to use direct propagation relying on a full Simion 8.1 simulation, taking into account the trap size, magnetic-field, and the shape of the electrodes, detectors, and various ground planes.
For each experimental configuration, a few ions are sampled from a uniform energy and emission angle distributions, and a mm FWHM 3D Gaussian trap volume depending on the laser detuning. The ion trajectories are simulated in the electromagnetic potential generated by the electrodes and magnetic coils, and their hit position on the detector, as well as the starting kinetic energy, are recorded.
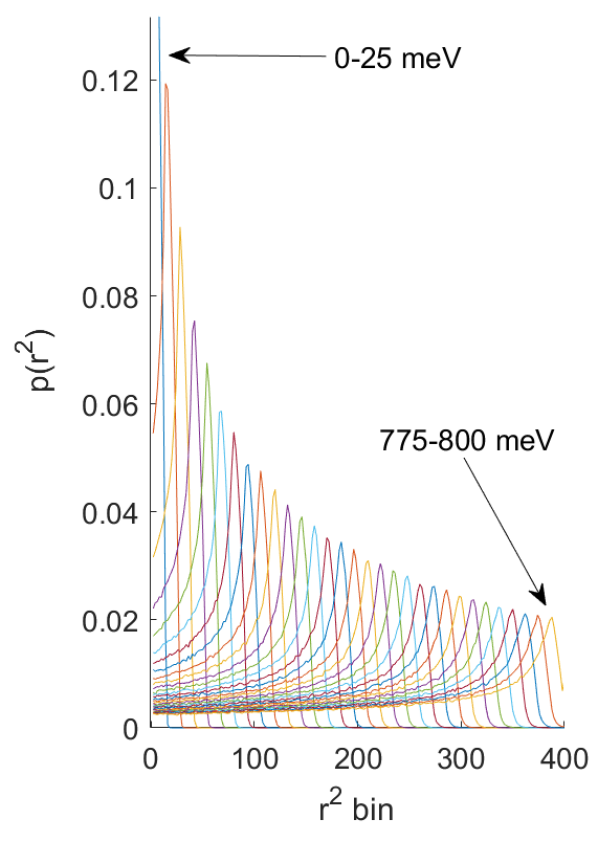
Due to the cylindrical symmetry of the electrode system, and the spherically symmetric collision process in a magneto-optical-trap, we consider the squared hit radius of the ions, where is the detector center. The ions’ are then grouped by starting energy with typically energy bins. For each image, the simulated and measured hits are grouped in bins with identical bin edges.
The matter of extracting ion energy distributions is now reduced to the determination of parameters which correspond to the scaling of a specific simulated energy group histogram, and a background parameter which is independent of hit position. An example of these histograms is shown in Fig. 6.
Fitting to the experimental data is accomplished through a standard minimization of
with the measured number of hits in bin number , and the simulated number of hits in bin number and energy group . The uncertainty is dominated by the statistics of roughly measured events.
References
- Gerlich et al. (2012) D. Gerlich, P. Jusko, Š. Roučka, I. Zymak, R. Plašil, and J. Glosík, The Astrophysical Journal 749, 22 (2012).
- Falcinelli et al. (2015) S. Falcinelli, F. Pirani, and F. Vecchiocattivi, Atmosphere 6, 299 (2015).
- van der Poel and Bethlem (2018) A. P. van der Poel and H. L. Bethlem, EPJ Techniques and Instrumentation 5, 6 (2018).
- Metcalf and Van der Straten (2007) H. J. Metcalf and P. Van der Straten, The Optics Encyclopedia: Basic Foundations and Practical Applications (2007).
- Vassen et al. (2012) W. Vassen, C. Cohen-Tannoudji, M. Leduc, D. Boiron, C. I. Westbrook, A. Truscott, K. Baldwin, G. Birkl, P. Cancio, and M. Trippenbach, Reviews of Modern Physics 84, 175 (2012).
- Hauser et al. (2015) D. Hauser, S. Lee, F. Carelli, S. Spieler, O. Lakhmanskaya, E. S. Endres, S. S. Kumar, F. Gianturco, and R. Wester, Nature Physics 11, 467 (2015).
- Skomorowski et al. (2016) W. Skomorowski, Y. Shagam, E. Narevicius, and C. P. Koch, The Journal of Physical Chemistry A 120, 3309 (2016).
- Kuppens et al. (2002) S. J. M. Kuppens, J. G. C. Tempelaars, V. P. Mogendorff, B. J. Claessens, H. C. W. Beijerinck, and E. J. D. Vredenbregt, Physical Review A 65, 023410 (2002).
- Stas et al. (2006) R. J. W. Stas, J. M. McNamara, W. Hogervorst, and W. Vassen, Physical Review A 73, 032713 (2006).
- Busch et al. (2006) H. C. Busch, M. K. Shaffer, E. M. Ahmed, and C. I. Sukenik, Phys. Rev. A 73, 023406 (2006).
- Glover et al. (2011) R. Glover, J. Calvert, D. Laban, and R. Sang, Journal of Physics B: Atomic, Molecular and Optical Physics 44, 245202 (2011).
- Flores et al. (2016) A. S. Flores, W. Vassen, and S. Knoop, Phys. Rev. A 94, 050701(R) (2016).
- Mastwijk et al. (1998) H. C. Mastwijk, J. W. Thomsen, P. van der Straten, and A. Niehaus, Physical review letters 80, 5516 (1998).
- Deiglmayr et al. (2008) J. Deiglmayr, A. Grochola, M. Repp, K. Mörtlbauer, C. Glück, J. Lange, O. Dulieu, R. Wester, and M. Weidemüller, Phys. Rev. Lett. 101, 133004 (2008).
- Carini et al. (2013) J. L. Carini, J. A. Pechkis, C. E. Rogers, P. L. Gould, S. Kallush, and R. Kosloff, Phys. Rev. A 87, 011401(R) (2013).
- Bibelnik et al. (2019) N. Bibelnik, S. Gersten, A. B. Henson, E. Lavert-Ofir, Y. Shagam, W. Skomorowski, C. P. Koch, and E. Narevicius, Molecular Physics , 1 (2019).
- Cop and Walser (2018) C. Cop and R. Walser, Phys. Rev. A 97, 012704 (2018).
- Cocks et al. (2019) D. G. Cocks, I. B. Whittingham, and G. Peach, Phys. Rev. A 99, 062712 (2019).
- Siska (1993) P. E. Siska, Rev. Mod. Phys. 65, 337 (1993).
- Dörner et al. (2000) R. Dörner, V. Mergel, O. Jagutzki, L. Spielberger, J. Ullrich, R. Moshammer, and H. Schmidt-Böcking, Physics Reports 330, 95 (2000).
- Eppink and Parker (1997) A. T. J. B. Eppink and D. H. Parker, Review of Scientific Instruments 68, 3477 (1997), https://doi.org/10.1063/1.1148310 .
- Chandler et al. (2017) D. W. Chandler, P. L. Houston, and D. H. Parker, The Journal of Chemical Physics 147, 013601 (2017), https://doi.org/10.1063/1.4983623 .
- Arango et al. (2006) C. A. Arango, M. Shapiro, and P. Brumer, Physical review letters 97, 193202 (2006).
- Behr and Gwinner (2009) J. Behr and G. Gwinner, Journal of Physics G: Nuclear and Particle Physics 36, 033101 (2009).
- Yee et al. (2013) R. M. Yee, N. D. Scielzo, P. F. Bertone, F. Buchinger, S. Caldwell, J. A. Clark, C. M. Deibel, J. Fallis, J. P. Greene, S. Gulick, D. Lascar, A. F. Levand, G. Li, E. B. Norman, M. Pedretti, G. Savard, R. E. Segel, K. S. Sharma, M. G. Sternberg, J. VanSchelt, and B. J. Zabransky, Physical review letters 110, 092501 (2013).
- Brédy et al. (2003) R. Brédy, H. Nguyen, H. Camp, X. Fléchard, and B. DePaola, Nuclear Instruments and Methods in Physics Research Section B: Beam Interactions with Materials and Atoms 205, 191 (2003).
- Weger et al. (2013) M. Weger, J. Maurer, A. Ludwig, L. Gallmann, and U. Keller, Optics express 21, 21981 (2013).
- Kling et al. (2014) N. Kling, D. Paul, A. Gura, G. Laurent, S. De, H. Li, Z. Wang, B. Ahn, C. Kim, T. Kim, et al., Journal of Instrumentation 9, P05005 (2014).
- DePaola et al. (2008) B. DePaola, R. Morgenstern, and N. Andersen, Advances In Atomic, Molecular, and Optical Physics 55, 139 (2008).
- Blieck et al. (2009) J. Blieck, X. Fléchard, A. Cassimi, H. Gilles, S. Girard, and D. Hennecart, in Journal of Physics: Conference Series, Vol. 163 (IOP Publishing, 2009) p. 012070.
- Ohayon and Ron (2015) B. Ohayon and G. Ron, Review of Scientific Instruments 86, 103110 (2015).
- Mardor et al. (2018) I. Mardor, O. Aviv, M. Avrigeanu, D. Berkovits, A. Dahan, T. Dickel, I. Eliyahu, M. Gai, I. Gavish-Segev, S. Halfon, et al., The European Physical Journal A 54, 91 (2018).
- Sanders and Muschlitz (1977) R. Sanders and E. Muschlitz, International Journal of Mass Spectrometry and Ion Physics 23, 99 (1977).
- Falcinelli et al. (2016) S. Falcinelli, M. Rosi, F. Pirani, D. Stranges, and F. Vecchiocattivi, The Journal of Physical Chemistry A 120, 5169 (2016).
- Balucani et al. (2012) N. Balucani, A. Bartocci, B. Brunetti, P. Candori, S. Falcinelli, F. Palazzetti, F. Pirani, and F. Vecchiocattivi, Chemical Physics Letters 546, 34 (2012).
- Brunetti et al. (2013) B. G. Brunetti, P. Candori, S. Falcinelli, F. Pirani, and F. Vecchiocattivi, The Journal of chemical physics 139, 164305 (2013).
- (37) See Supplemental Material at… for a discussion on the probability of spontaneous emissions, the extraction of branching ratios for various laser intensities, and details regarding the inversion process.
- Oberheide et al. (1997a) J. Oberheide, P. Wilhelms, and M. Zimmer, Measurement Science and Technology 8, 351 (1997a).
- Ohayon et al. (2019a) B. Ohayon, H. Rahangdale, A. J. Geddes, J. C. Berengut, and G. Ron, Phys. Rev. A 99, 042503 (2019a).
- Ohayon et al. (2015a) B. Ohayon, E. Wåhlin, and G. Ron, Journal of Instrumentation 10, P03009 (2015a).
- Van Drunen (2008) W. J. Van Drunen, Collisional interaction between metastable neon atoms, Ph.D. thesis, Technische Universität Darmstadt (2008).
- Tol et al. (1999) P. J. J. Tol, N. Herschbach, E. A. Hessels, W. Hogervorst, and W. Vassen, Physical Review A 60, R761 (1999).
- Whitaker (2003a) B. J. Whitaker, Imaging in molecular dynamics: technology and applications (Cambridge university press, 2003).
- Pieksma et al. (2002) M. Pieksma, M. Cizek, J. W. Thomsen, P. van der Straten, and A. Niehaus, Physical Review A 66, 022703 (2002).
- Miller (1970) W. H. Miller, The Journal of Chemical Physics 52, 3563 (1970).
- Hotop (1974) H. Hotop, Radiation research 59, 379 (1974).
- Doery et al. (1998a) M. R. Doery, E. J. D. Vredenbregt, S. S. Op de Beek, H. C. W. Beijerinck, and B. J. Verhaar, Physical Review A 58, 3673 (1998a).
- Kotochigova et al. (2000) S. Kotochigova, E. Tiesinga, and I. Tupitsyn, Physical Review A 61, 042712 (2000).
- Trevor et al. (1984) D. Trevor, J. Pollard, W. Brewer, S. Southworth, C. Truesdale, D. Shirley, and Y. Lee, The Journal of chemical physics 80, 6083 (1984).
- Carrington et al. (2002) A. Carrington, D. I. Gammie, J. C. Page, A. M. Shaw, and J. M. Hutson, The Journal of chemical physics 116, 3662 (2002).
- Doery et al. (1998b) M. R. Doery, E. J. D. Vredenbregt, J. G. C. Tempelaars, H. C. W. Beijerinck, and B. J. Verhaar, Phys. Rev. A 57, 3603 (1998b).
- Gallagher and Pritchard (1989a) A. Gallagher and D. E. Pritchard, Physical review letters 63, 957 (1989a).
- Carini et al. (2015) J. L. Carini, S. Kallush, R. Kosloff, and P. L. Gould, Physical review letters 115, 173003 (2015).
- Omiste et al. (2018) J. J. Omiste, J. Floß, and P. Brumer, Phys. Rev. Lett. 121, 163405 (2018).
- Ohayon et al. (2018) B. Ohayon, J. Chocron, T. Hirsh, A. Glick-Magid, Y. Mishnayot, I. Mukul, H. Rahangdale, S. Vaintraub, O. Heber, D. Gazit, et al., Hyperfine Interactions 239, 57 (2018).
- Neynaber and Tang (1980a) R. Neynaber and S. Tang, The Journal of Chemical Physics 72, 5783 (1980a).
- Hotop et al. (1998) H. Hotop, T. Roth, M.-W. Ruf, and A. Yencha, Theoretical Chemistry Accounts 100, 36 (1998).
- Lorenzen et al. (1986) J. Lorenzen, H. Hotop, and M. W. Ruf, Zeitschrift für Physik D Atoms, Molecules and Clusters 1, 261 (1986).
- Schohl et al. (1990) S. Schohl, M. W. Müller, H. A. J. Meijer, M.-W. Ruf, H. Hotop, and H. Morgner, Zeitschrift für Physik D Atoms, Molecules and Clusters 16, 237 (1990).
- Neynaber and Tang (1980b) R. Neynaber and S. Tang, The Journal of Chemical Physics 72, 6176 (1980b).
- Doery et al. (1998c) M. Doery, E. Vredenbregt, J. Tempelaars, H. Beijerinck, and B. Verhaar, Physical Review A 57, 3603 (1998c).
- Gallagher and Pritchard (1989b) A. Gallagher and D. E. Pritchard, Physical review letters 63, 957 (1989b).
- Oberheide et al. (1997b) J. Oberheide, P. Wilhelms, and M. Zimmer, Measurement Science and Technology 8, 351 (1997b).
- Ohayon et al. (2019b) B. Ohayon, H. Rahangdale, A. J. Geddes, J. C. Berengut, and G. Ron, Phys. Rev. A 99, 042503 (2019b).
- Ohayon et al. (2015b) B. Ohayon, E. Wåhlin, and G. Ron, Journal of Instrumentation 10, P03009 (2015b).
- Whitaker (2003b) B. Whitaker, Imaging in Molecular Dynamics: Technology and Applications (Cambridge University Press, 2003).