Linking interlayer twist angle to geometrical parameters of self-assembled folded graphene structures
Abstract
Thin adhesive films can be removed from substrates, torn, and folded in distinct geometries under external driving forces. In two-dimensional materials, however, these processes can be self-driven as shown in previous studies on folded twisted bilayer graphene nanoribbons produced by spontaneous tearing and peeling from a substrate. Here, we use atomic force microscopy techniques to generate and characterize the geometrical structure of naturally self-grown folded nanoribbon structures. Measurements of nanoribbon width and interlayer separation reveal similar twist-angle dependences possibly caused by the anisotropy in the bilayer potential. In addition, analysis of the data shows an unexpected correlation between the height of the folded arc edge -parameterized by a radius R-, and the ribbon width, suggestive of a self-growth process driven by a variable cross-sectional shape. These observations are well described by an energy minimization model that includes the bilayer adhesion energy density as represented by a distance dependent Morse potential. We obtain an analytical expression for the radius R versus the ribbon width that predicts a renormalized bending rigidity and stands in good agreement with experimental observations. The newly found relation between these geometrical parameters suggests a mechanism for tailored growth of folded twisted bilayer graphene- a platform for many intriguing physics phenomena.
Contributed equally to this work \altaffiliationContributed equally to this work
Keywords: twisted bilayer graphene, graphene ribbons, graphene folds
External driving forces are needed to separate and fold thin films from substrates1, 2, 3, however, for the ultimate thin films, i.e. two-dimensional materials4, 5, these same processes can be self-driven due to the growth of folded bilayer structures6. The ultimate configuration is thus stabilized when the balance between the energies involved in bilayer formation, bending, peeling and tearing is reached. In general, the interlayer interaction between two-dimensional crystals is non-isotropic and depends on the interlayer lattice registry7, 8, 9, factors shown to have a strong effect in self-driven structure configurations10, 11, 12. At the same time, the different energies involved depend on the geometric factors of the structure (e.g. length, width, bending radius, etc). Therefore, stable configurations are expected to exhibit correlations between geometric parameters, that may be used as a guide to specifically design bilayers and folded nano-arcs from self-assembly.
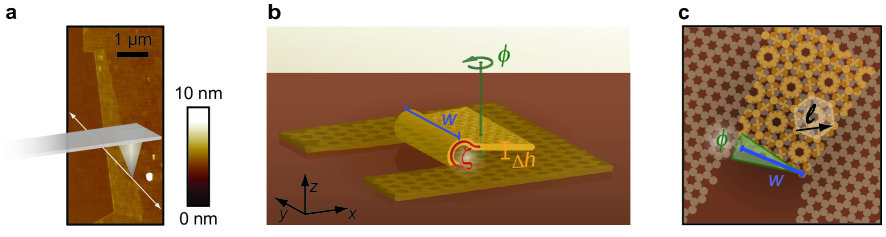
The central subject of our study are graphene ribbons folded out of monolayer graphene (MLG) prepared by mechanical exfoliation of natural graphite onto a silicon dioxide () substrate. Folding events are initiated by scratching graphene via AFM nanomachining (see Methods), whereupon -sized bilayer areas emanate from the ruptured trench or the flake edge (Fig. 1a). Ribbons generally tear out of the mother flake along two paths while staying connected to the bottom via a folded edge (Fig. 1b). Results presented were obtained from the analysis of a set of 16 self-assembled ribbons, from 7 different flakes on top of 6 different substrates. All experiments were carried out in ambient conditions.
Top and bottom lattices of these prepared structures will in general be rotationally misaligned in terms of their respective crystallographic directions (Fig. 1c); i.e. ribbons and their substrate MLG constitute twisted bilayer graphene (TBG) structures. This material system is host to a great variety of interesting physics7, 8, 9, 11, 12, 13, 14, 15, 16, 17, 18, 19 originated in the geometric superposition of the twisted lattices. Superstructures may be strictly periodic or incommensurate, depending on the corresponding rotational mismatch angle 20, 21, 18.
We have determined the interlayer twist angle (see Methods) for a number of self-assembled folded ribbons and observed that most values accumulate between and , as depicted in Fig. 2a. Interestingly, the observed rotational mismatch coincides with low densities of commensurate interlayer configurations around and as marked in the corresponding parameter space shown in Fig. 2b 20, 21, 18.
The underlying reason is likely to be found in the self-assembled nature of this bilayer structure formation, as identified by Annett et al.6: starting from a folded-over flap with only nanometers of overlap onto the underlying MLG, the ribbon’s growth is activated by thermal fluctuations and progressively stabilized by the gain in bilayer adhesion which overcompensates for the energy loss from tearing and peeling from the substrate. Maximal expansion is typically reached on a timescale below the AFM image-frame acquisition.
As the bilayer forms in a forward sliding motion, its growth process is favored by lower friction between the bottom and growing top layer. The extremely low friction condition, termed superlubricity22, 23, has been associated with incommensurate stacking configurations. Very low commensurate and fully incommensurate structures are most likely to be found in the range of values for observed predominantly in our self-assembled TBG (low density of small-wavelength commensuration, green backdrop in Fig. 2b). Alternatively, the assumption of an impeded growth of commensurate structures due to friction, is consistent with the absence of large numbers of commensurate bilayer graphene ribbons (Figs. 2a,b).
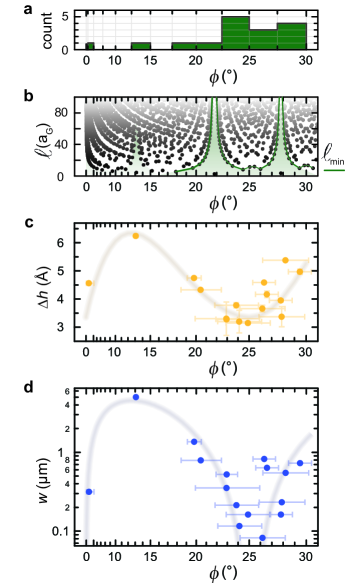
Rotational mismatch does not only determine the growth probability of a self-assembled ribbon but is also a quantitative predictor of its final geometrical structure: Figure 2c depicts the samples’ interlayer distance which is extracted as the difference between ribbon and MLG heights from AFM topography measurements (see Methods). The dependence on the interlayer twist displays an oscillating behavior (gray line, Fig. 2c) with a pronounced dip around . Note that measured values for lie between and , around a median of , beyond theoretically anticipated variations for naturally occurring bilayer structures7, 8, 9, 12. Examples of similarly large interlayer distances have been found in artificially stacked graphene in previous experimental works: values for from 13, and around 5, 14 have been reported for TBG produced from transfered and folded samples respectively.
While it is plausible that the discrepancy between theory and experiment lie in a sparse ordered intercalation of adatoms keeping top and bottom layers apart at a uniform distance, a more intrinsic mechanism involving superlubricity appears more likely. We propose that the existence of a superlubric state22, 23, facilitated by lack of interlayer commensuration, enables the growth of these ribbons in the first place6. Unfortunately, there is a lack of appropriate theory models to describe these incommensurate stacking structures because of the absence of periodicity, in stark contrast with lattice-periodic structures97, 8. Notice that, whichever reason applies, i.e. intercalation or superlubricity, the effect correlates with interlayer twist, suggesting a causal connection between the minimum in and the dip in , situated around a value of relative interlayer orientation of (Figs. 2b,c).
We have observed another interesting correlation between the orientational mismatch and the width of a folded nanoribbon in its final configuration, defined in Fig. 1b as . With values that vary between and , oscillates as a function of the interlayer twist, and displays a pronounced decline towards a minimum value of (Fig. 2d), similar to the dependence observed for .
To understand the origin of these dependencies, we turn to the internal energy of the torn and folded system (see Supplementary Information): from the vanishing of the partial derivative , where is the length of the growing bilayer graphene area (see Fig. 4c), one finds
| (1) |
where , and are the graphene-to-graphene adhesion energy density, graphene-to-substrate adhesion energy density, and tear energy density per ruptured path, respectively. Notice that dissipative contributions due to friction are neglected in the derivation of the expression above, as we assume a superlubric TBG interaction. This relation corresponds to the one obtained in Ref. 6 for taper angles , consistent with measured values across the whole range of our samples.
According to Eq. 1, the twist-angle dependence of may be caused by either of the contributing energy densities, evidence of the high sensitivity of TBG superstructure formation to the specific values of twist angles20, 21, 18 (see Fig 2b). However, a closer analysis suggests the bilayer adhesion energy density to be the most probable cause for the dependence observed. To a lesser degree, is expected to vary slightly, depending on the direction of tearing paths consistent with the measured values of taper angles, while the adhesion energy density between graphene and the amorphous substrate is largely isotropic.
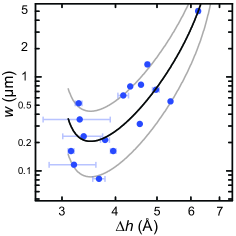
In principle, the bilayer interaction depends on both the twist angle and the interlayer separation, however as Fig. 2c shows, these are not independent variables for self-grown structures making . The relation between and as obtained from the measured samples is analyzed in Fig. 3 that shows data accumulating around the diagonal of the double-logarithmic plot window. This correlation is consistent with the similar -dependencies measured for both magnitudes shown in Fig. 2c, 2d. Note that a local minimum in may be identified around .
To quantify these observations we model the bilayer interaction energy density with the interlayer-distance dependent Morse potential
| (2) |
where defines the maximum adhesive potential strength, adjusts for the spatial extent of the potential and defines the optimal layer separation. We use this expression to represent in Eq. 1, and obtain the function to fit the data. The quantities , and , treated as free parameters, were constrained by corresponding fits of Eq. 2 to theoretically predicted interlayer potentials for AB- and AA-stacked graphene bilayers respectively12 (see Supplementary Information).
The resulting fitting function is displayed as the black curve in Fig. 3: starting at small interlayer distance, the folded width declines up to a minimum, corresponding to a maximal value for beyond the dominion of repulsive short-range interaction. Increasing values of for reflect the waning of the attractive long-range contributions due to an increased interlayer separation.
The corresponding fitting parameters are listed in the caption of Fig. 3: the adjusted values of the Morse potential obtained in the numerical procedure lie in the middle of the range corresponding to those calculated for AA- and AB-stackings12 (see Supplementary Information). Thus, they are consistent with theoretical predictions for less ordered stacking configurations12, 8, 9 as those expected in folded ribbons6. The adjusted adhesion energy density of graphene on lies at the lower end of reported values24, 25, 26 and fits theoretical expectations for an interlayer of water between sample and substrate24, expected in our ambient-conditions setup. Finally, the adjusted value for tearing energy density, , lies somewhat above the expected theoretical minimum of (obtained assuming a straight cut along the zigzag direction at one C-C bond of per lattice constant ). Possible explanations for this discrepancy may lie in the nanoscale structure of the tearing length where torn paths, seemingly straight within the resolution of the AFM, could meander back and forth, increasing the edge length; or several bonds may tear in parallel, e.g. in response to spontaneous strain release, thereby widening the tearing path. Support for these scenarios is provided by the variation in from sample to sample: when allowing for a certain range of values for , as mentioned in the caption of Fig. 3, the full scattering in the data is accounted for while maintaining an unchanged set of the remaining fitting parameters (gray lines at the bottom and top of Fig. 3).
Finally, the bended edge connecting top and bottom layer is unique to the folding approach in the formation of the TBG. In terms of electronics, it is e.g. predicted to give rise to snake states27 and has been linked to transport features independent of perpendicular magnetic field15.
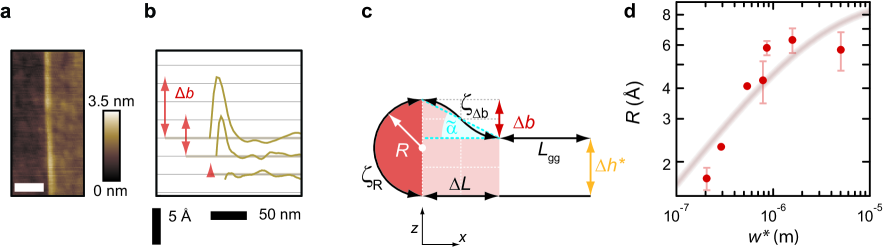
Due to a finite bending rigidity , the folded graphene arc usually protrudes above the TBG plane as resolved in AFM topography (Fig. 4a). We find the bump height to vary between virtually zero and up to (Fig. 4b). To relate the folded section to the above discussed structural parameters, the full arc is divided in two contributions and as depicted in Fig. 4c. The quantities and bending radius , are related to the interlayer distance via
| (3) |
From this expression we deduce magnitudes for between and . These values exhibit a strong correlation with the measured values for the corresponding ribbon’s width , revealing that the self-growth process is driven by a variable cross-sectional shape. The newly found relation corresponds to a different self-growth regime from the one identified in previous experimental studies6 where self-directed growth was dominated by changing widths and assumed to occur with constant cross-sectional shapes (fixed binding energy), or with focus on the bending stiffness28, 29. On the other side, theory studies have addressed conditions for fold formation such as growth beyond a minimal critical length independent of ribbon width30, or fixed interlayer separation of self-folded mono and multi-layer graphene31, with an analysis of transport consequences of folded arcs27. We note that neither of these are applicable to the ribbons reported in this work.
As a consequence, a different picture emerges when a full edge profile of a self-grown ribbon is considered. In this approach, and (related via Eqs. 1 and 2) are considered fixed quantities and within a given sample, both determined by the interlayer twist angle (Fig. 2c, 2d). The folded arc is modeled as a semi-circle of length , where the descending part of length is, for simplicity, parametrized by two independent variables and (see Fig. 4c). Note that the condition imposed by Eq. 1 remains unaffected by these choices (see Supplementary Information for further details). After using Eq. 1 to simplify the expression for the internal energy , we require in the equilibrium condition, obtaining the relation:
| (4) |
where represents the path integral along over the curved region, determining the bending energy associated with the descending arc . This contribution can be parameterized by an effective curvature that can be compared with the one determined by the fixed radius . It is useful also to introduce an effective angle defined by that, combined with Eq. 3, renders (see Fig. 4c). In the regime , we find
| (5) |
where is the renormalized bending rigidity coefficient (see Supplementary Information).
The dependency of on predicted above, is confirmed in our data as shown in Fig. 4d: a fit of Eq. 5 (gray line) captures fairly well the rising trend in bending radius with increasing folded width, including the onset of saturation for large values of (the data presented corresponds to a subset of seven ribbons only, as accurate measurement of the narrow folded arc requires special care in AFM operation).
A key to the qualitative understanding of this behavior is the competition between contributions from bending, adhesion, and tearing energies to the equilibrium condition . Whereas the minimization of bending energy is achieved towards larger values of , minimization of the tearing as well as adhesion energies require a decreasing bending radius. In narrow ribbons (large edge-to-bulk ratio), the equilibrium condition is dominated by the contribution from the tearing edges, which is reflected in small optimal bending radii at small values of . In wide ribbons, the equilibrium condition is dominated by the counteracting contributions from bending and adhesion alone, as both corresponding energies scale proportionally with (in contrast to tearing energy); this renders values of effectively independent of folded width only at large values of .
Quantitatively, the renormalization of the bending rigidity coefficient , accounting for the contributions from the descending part of length , plays a crucial role in understanding the magnitude of values of : From the fitting in Fig. 4d, we find , for values of and obtained with the same fitting procedure used in Fig. 3, but applied on the subset of seven ribbons shown (see Supplementary Information). A comparison with the reported value for 32, renders typical values of . This implies extensions of the order of for the descending arc (Fig. 4c), similar in magnitude to the typical tip radius of the AFM probes used. The apparent lateral extensions of the bumps shown in Fig. 4a, 4b are thus consistent (within the corresponding lateral resolution) with the proposed model and calculated values.
1 Conclusion
In conclusion, our study points toward a pivotal role of interlayer commensuration in twisted bilayer morphology. The strong dependence of the interlayer adhesion energy density with twist angles and corresponding interlayer separations reveals a rich parameter space that can potentially be explored during the growth of folded graphene ribbons. Refinement in nanoindentation techniques in conjunction with a more precise knowledge of sample crystallography may allow for control over interlayer twists. This may ultimately enable tailored ribbon synthesis at preplanned layer separation, as well as customized folded arcs which could be exploited e.g. in devices with built-in ultrahigh pseudo-magnetic fields. Moreover, folded sandwich-structures including an insulating layer (e.g. hexagonal boron nitride) will enable three-dimensional device structures with defined current flow along the cross-sectional arc of the folded edge, and have potential application in the developement of rolled-up capacitors.
2 Methods
AFM nanomachining. Nuclei for fold-growth are seeded by scratching a graphene flake via AFM nanomachining, thereby creating additional edge-surface with rough borders which are prone to fold-overs (Figure 1a). Reliable results are achieved by repetitive contact-mode tracing (some ten repetitions) with a high spring-constant, diamond-coated probe, operating in the -range of spring load.
Twist-angle determination. In TBG prepared by folding of a monolayer, the angle between different crystalline directions in the top and bottom layers can, in general, be deduced from sample geometry15, 17, 18: the folded edge (blue line in Figure 1c) acts as a mirror axis between crystalline symmetry directions (green lines in Figure 1c) in the bottom and folded-over layer respectively. As graphene flakes are terminated by straight armchair- or zigzag-edges in the majority of cases5, 33, a set of clean facets in -increments ( being an integer) are indicative of the crystallography in a given sample. This allows to obtain the magnitude of , via doubling of the angle between the folded edge and the straight flake facet. Depending on image resolution and length of the edges, the accuracy of this geometric approach is . Combination of the honeycomb lattice’s rotational symmetry, and mirror symmetries about the two crystalline directions -armchair and zigzag- renders an angle within the range . As a consequence, structures at and - are herein identical except for a possible translational shift between top and bottom lattice, depending on the axis of rotation20, 21, 18. The determination of the twist angle via AFM-images is given in the SI-Figures 5-8 for some selected samples.
Extraction of interlayer distance. To extract the vertical separation between top and bottom layers of the planar TBG section, we record AFM topography over the folded ribbon and surrounding MLG (Supplementary Fig. 1a). Measurements are undertaken in contact mode, special care is taken to minimize artifacts from mechanical crosstalk that may arise in step measurements over surfaces of different frictional coefficients34, 35: triangular Silicon Nitride probes of force constant are employed for torsional and buckling stability, the scanning speed is limited to , and remaining differences between topography information from trace and retrace directions are averaged out by adding both channels’ data and dividing by two. The topography information is evaluated via a histogram that counts the number of pixels per interval of height as shown in Supplementary Fig. 1b (gray dots). Depicted with a black line, a sum of two Gaussian distributions,
| (6) |
is used to fit the data. Individual contributions from MLG and TBG are plotted in brown and orange respectively. Interlayer distance is extracted from fitting results as , where the error is defined as sum of fitting uncertainties in and .
The authors acknowledge financial support from the DFG within the priority program SPP 1459, the School for Contacts in Nanosystems, and the "Fundamentals of Physics and Metrology" initiative (JCR, CB, SJH, HS, and RJH), NSF-DMR 1508325 (DZ and NS). This work was partially performed at the Aspen Center for Physics, which is supported by NSF grant PHY-1066293 (NS). J. C. Rode acknowledges support from the Hannover School for Nanotechnology. The authors thank Peter Behrens and Hadar Steinberg for helpful discussion.
References
- Hamm et al. 2008 Hamm, E.; Reis, P.; LeBlanc, M.; Roman, B.; Cerda, E. Tearing as A Test for Mechanical Characterization of Thin Adhesive Films. Nat. Mater. 2008, 7, 386–390
- 2 Sen, D.; Novoselov, K. S.; Reis, P. M.; Buehler, M. J. Tearing Graphene Sheets from Adhesive Substrates Produces Tapered Nanoribbons. Small 6, 1108–1116
- Kruglova et al. 2011 Kruglova, O.; Brau, F.; Villers, D.; Damman, P. How Geometry Controls the Tearing of Adhesive Thin Films on Curved Surfaces. Phys. Rev. Lett. 2011, 107, 164303
- Novoselov et al. 2005 Novoselov, K. S.; Jiang, D.; Schedin, F.; Booth, T. J.; Khotkevich, V. V.; Morozov, S. V.; Geim, A. K. Two-Dimensional Atomic Crystals. Proc. Natl. Acad. Sci. U.S.A 2005, 102, 10451–10453
- Geim and Novoselov 2007 Geim, A. K.; Novoselov, K. S. The Rise of Graphene. Nat. Mater. 2007, 6, 183–191
- Annett and Cross 2016 Annett, J.; Cross, G. L. W. Self-Assembly of Graphene Ribbons by Spontaneous Self-Tearing and Peeling from A Substrate. Nature 2016, 535, 271–275
- Berashevich and Chakraborty 2011 Berashevich, J.; Chakraborty, T. Interlayer Repulsion and Decoupling Effects in Stacked Turbostratic Graphene Flakes. Phys. Rev. B 2011, 84, 033403
- Shibuta and Elliott 2011 Shibuta, Y.; Elliott, J. A. Interaction Between Two Graphene Sheets with A Turbostratic Orientational Relationship. Chem. Phys. Lett. 2011, 512, 146 – 150
- Uchida et al. 2014 Uchida, K.; Furuya, S.; Iwata, J.-I.; Oshiyama, A. Atomic Corrugation and Electron Localization due to Moiré Patterns in Twisted Bilayer Graphenes. Phys. Rev. B 2014, 90, 155451
- Wang et al. 2016 Wang, D. et al. Thermally Induced Graphene Rotation on Hexagonal Boron Nitride. Phys. Rev. Lett. 2016, 116, 126101
- Zhu et al. 2017 Zhu, M.; Ghazaryan, D.; Son, S.-K.; Woods, C. R.; Misra, A.; He, L.; Taniguchi, T.; Watanabe, K.; Novoselov, K. S.; Cao, Y.; Mishchenko, A. Stacking Transition in Bilayer Graphene Caused by Thermally Activated Rotation. 2D Materials 2017, 4, 011013
- Peymanirad et al. 2017 Peymanirad, F.; Singh, S. K.; Ghorbanfekr-Kalashami, H.; Novoselov, K. S.; Peeters, F. M.; Neek-Amal, M. Thermal Activated Rotation of Graphene Flake on Graphene. 2D Materials 2017, 4, 025015
- Sanchez-Yamagishi et al. 2012 Sanchez-Yamagishi, J. D.; Taychatanapat, T.; Watanabe, K.; Taniguchi, T.; Yacoby, A.; Jarillo-Herrero, P. Quantum Hall Effect, Screening, and Layer-Polarized Insulating States in Twisted Bilayer Graphene. Phys. Rev. Lett. 2012, 108, 076601
- Kim et al. 2013 Kim, Y.; Yun, H.; Nam, S.-G.; Son, M.; Lee, D. S.; Kim, D. C.; Seo, S.; Choi, H. C.; Lee, H.-J.; Lee, S. W.; Kim, J. S. Breakdown of the Interlayer Coherence in Twisted Bilayer Graphene. Phys. Rev. Lett. 2013, 110, 096602
- Schmidt et al. 2014 Schmidt, H.; Rode, J. C.; Smirnov, D.; Haug, R. J. Superlattice Structures in Twisted Bilayers of Folded Graphene. Nat. Commun. 2014, 5, 5742
- Rode et al. 2016 Rode, J. C.; Smirnov, D.; Schmidt, H.; Haug, R. J. Berry Phase Transition in Twisted Bilayer Graphene. 2D Materials 2016, 3, 035005
- Rode et al. 2016 Rode, J. C.; Belke, C.; Schmidt, H.; Haug, R. J. Interlayer Configurations in Twisted Bilayers of Folded Graphene. arXiv:1608.08133 [cond-mat.mtrl-sci] 2016,
- Rode et al. 2017 Rode, J. C.; Smirnov, D.; Belke, C.; Schmidt, H.; Haug, R. J. Twisted Bilayer Graphene: Interlayer Configuration and Magnetotransport Signatures. Ann. Phys. 2017, 529, 1700025
- Cao et al. 2018 Cao, Y.; Fatemi, V.; Fang, S.; Watanabe, K.; Taniguchi, T.; Kaxiras, E.; Jarillo-Herrero, P. Unconventional Superconductivity in Magic-Angle Graphene Superlattices. Nature 2018, 556, 43–50
- Mele 2010 Mele, E. J. Commensuration and Interlayer Coherence in Twisted Bilayer Graphene. Phys. Rev. B 2010, 81, 161405
- Lopes dos Santos et al. 2012 Lopes dos Santos, J. M. B.; Peres, N. M. R.; Castro Neto, A. H. Continuum Model of the Twisted Graphene Bilayer. Phys. Rev. B 2012, 86, 155449
- Dienwiebel et al. 2004 Dienwiebel, M.; Verhoeven, G. S.; Pradeep, N.; Frenken, J. W. M.; Heimberg, J. A.; Zandbergen, H. W. Superlubricity of Graphite. Phys. Rev. Lett. 2004, 92, 126101
- Liu et al. 2012 Liu, Z.; Yang, J.; Grey, F.; Liu, J. Z.; Liu, Y.; Wang, Y.; Yang, Y.; Cheng, Y.; Zheng, Q. Observation of Microscale Superlubricity in Graphite. Phys. Rev. Lett. 2012, 108, 205503
- Viola Kusminskiy et al. 2011 Viola Kusminskiy, S.; Campbell, D. K.; Castro Neto, A. H.; Guinea, F. Pinning of a Two-Dimensional Membrane on Top of a Patterned Substrate: The Case of Graphene. Phys. Rev. B 2011, 83, 165405
- Ishigami et al. 2007 Ishigami, M.; Chen, J. H.; Cullen, W. G.; Fuhrer, M. S.; Williams, E. D. Atomic Structure of Graphene on SiO2. Nano Lett. 2007, 7, 1643–1648
- Koenig et al. 2011 Koenig, S. P.; Boddeti, N. G.; Dunn, M. L.; Bunch, J. S. Ultrastrong Adhesion of Graphene Membranes. Nat. Nanotechnol. 2011, 6, 543–546
- Rainis et al. 2011 Rainis, D.; Taddei, F.; Polini, M.; León, G.; Guinea, F.; Fal’ko, V. I. Gauge Fields and Interferometry in Folded Graphene. Phys. Rev. B 2011, 83, 165403
- Chen et al. 2014 Chen, X. C.; Zhang, L. Z.; Zhao, Y. Z.; Wang, X. W.; Ke, C. Graphene folding on flat substrates. Appl. Phys. Lett. 2014, 116, 164301
- Chen et al. 2015 Chen, X.; Yi, C.; Ke, C. Bending Stiffness and Interlayer Shear Modulus of Few-Layer Graphene. Appl. Phys. Lett. 2015, 106, 101907
- Meng et al. 2013 Meng, X.; Li, M.; Kang, Z.; Zhang, X.; Xiao, J. Mechanics of Self-Folding of Single-Layer Graphene. J. Phys. D: Appl. Phys. 2013, 46, 055308
- Cranford et al. 2009 Cranford, S.; Sen, D.; Buehler, M. J. Meso-Origami: Folding Multilayer Graphene Sheets. Appl. Phys. Lett. 2009, 95, 123121
- Wei et al. 2013 Wei, Y.; Wang, B.; Wu, J.; Yang, R.; Dunn, M. L. Bending Rigidity and Gaussian Bending Stiffness of Single-Layered Graphene. Nano Lett. 2013, 13, 26–30
- Neubeck et al. 2010 Neubeck, S.; You, Y. M.; Ni, Z. H.; Blake, P.; Shen, Z. X.; Geim, A. K.; Novoselov, K. S. Direct Determination of the Crystallographic Orientation of Graphene Edges by Atomic Resolution Imaging. Appl. Phys. Lett. 2010, 97, 053110
- Warmack et al. 1994 Warmack, R. J.; Zheng, X.; Thundat, T.; Allison, D. P. Friction Effects in the Deflection of Atomic Force Microscope Cantilevers. Rev. Sci. Instrum. 1994, 65, 394–399
- Hoffmann et al. 2007 Hoffmann, A.; Jungk, T.; Soergel, E. Cross-Talk Correction in Atomic Force Microscopy. Rev. Sci. Instrum. 2007, 78, 016101