123
\volnumber1
\hauthorM. Sekeráš et al.
11institutetext:
\lomnica, 11email: skopal@ta3.sk
22institutetext: P. K. Sternberg Astronomical Institute, M. V. Lomonosov
Moscow State University, Russia
33institutetext: Private observatory, 03401 Liptovská Štiavnica,
The Slovak Republic
44institutetext: Institute of Astronomy and National Astronomical Observatory,
Bulgarian Academy of Sciences, 72 Tsarigradsko Shose blvd.,
BG-1784 Sofia, Bulgaria
55institutetext: Tetoora Observatory, 2643 Warragul-Korumburra Road,
Tetoora Road, Victoria 3821, Australia
Photometry of Symbiotic Stars - XIV
Abstract
We present new multicolour photometric observations of symbiotic stars, EG And, Z And, BF Cyg, CH Cyg, CI Cyg, V1016 Cyg, V1329 Cyg, AG Dra, RS Oph, AG Peg, AX Per, and the newly discovered (August 2018) symbiotic star HBHA 1704-05, we carried out during the period from 2011.9 to 2018.75. Historical photographic and visual/ data were collected for HBHA 1704-05, FG Ser and AE Ara, AR Pav, respectively. The main aim of this paper is to present our original observations of symbiotic stars and to describe the most interesting features of their light curves. For example, periodic variations, rapid variability, minima, eclipses, outbursts, apparent changes of the orbital period, etc. Our measurements were obtained by the classical photoelectric photometry (till 2016.1) and the CCD photometry. Main results of our monitoring program are summarized and some specific characteristics are pointed out for future investigation.111Data are at https://www.astro.sk/caosp/Eedition/FullTexts/vol49no1/pp19-66.dat/
keywords:
Catalogs – binaries: symbiotics – Techniques: photometric1 Introduction
Symbiotic stars are the widest interacting binary systems that comprise a cool giant as the donor and a white dwarf (WD) accreting from the giant’s wind (Boyarchuk, 1967; Kenyon, 1986; Mürset & Schmid, 1999). Their orbital periods run from hundreds of days (S-type systems containing a normal giant) to a few times 10–100 years (D-type systems containing a Mira variable)222see Webster & Allen (1975) for details of this classification. The former case is given by our knowledge of the photometric and/or spectroscopic orbital elements (e.g. Belczyński et al., 2000), while the latter is based on the long-term spectroscopic observations and/or imaging (e.g. Parimucha et al., 2002; Matthews & Karovska, 2006). However, they are, in general, unknown.
The accreting WD represents a strong source of the supersoft X-ray to UV radiation ( K, ) in the binary (Muerset et al., 1991; Skopal, 2005; Skopal et al., 2009; González-Riestra et al., 2013; Ramsay et al., 2016; Skopal et al., 2017b) that ionizes a fraction of the wind from the giant giving rise to the nebular emission (e.g. Boyarchuk et al., 1966; Seaquist et al., 1984; Kenyon & Webbink, 1984; Nussbaumer & Vogel, 1987). This configuration represents the so-called quiescent phase of symbiotic binary, during which the symbiotic system releases its energy approximately at a constant rate and temperature. Corresponding optical light curves (LC) are characterized with a well pronounced periodic wave-like variation along the orbit. Analyzes and discussions of this fundamental variability in the optical continuum of symbiotic stars were provided by Boyarchuk et al. (1966), Belyakina (1970), Kenyon (1986), Skopal (2001), Skopal (2008) and Jurdana-Šepić & Munari (2010).
Sometimes symbiotic stars experience unpredictable outbursts characterized by mag (multiple) brightening(s) in the optical, observed on the timescale of a few months to years/decades (see e.g., historical LCs of FN Sgr, Z And, AX Per of Brandi et al., 2005; Leibowitz & Formiggini, 2008; Skopal et al., 2011) with signatures of a mass-outflow (e.g., Fernandez-Castro et al., 1995; Esipov et al., 2000; Skopal, 2006; McKeever et al., 2011; González-Riestra et al., 2013). Outbursts of symbiotic stars are called ‘Z And-type’ outbursts, as they were observed in the past for a prototype of the class of symbiotic stars – Z And (Kenyon, 1986). We name this stage as the active phase.
According to the basic composition of symbiotic binaries (see above), modelling the spectral energy distribution confirmed the presence of three basic components of radiation in their spectrum – two stellar from the giant and the hot component and one nebular from the ionized circumbinary environment. Their contributions in the optical rival each other and are different for different objects, and variable due to activity and/or the orbital phase (see Figs. 2–22 of Skopal, 2005). During active phases, the ionization structure of symbiotic binaries changes significantly (e.g. Cariková & Skopal, 2012), which causes dramatic changes of the LC profiles with respect to the wave-like variation during the quiescence. In special cases, transient narrow minima (eclipses) can emerge in the LC for systems with a high orbital inclination (e.g. Belyakina, 1991), whose position and profile is a function of the stage of the activity (Skopal, 1998).
With respect to the above mentioned principal behaviour of symbiotic stars, their LCs bear a great deal of information about the location and physical properties of the radiative sources in the system. Above all, the multicolour photometry represents an important complement to spectroscopic observations and those obtained at other wavelengths. Their monitoring also plays an important role in discoveries of unpredictable outbursts of symbiotic stars.
In this paper, we present results of our long-term monitoring programme of photometric observations of selected symbiotic stars, originally launched by Hric & Skopal (1989). It continues its part XII (Skopal et al., 2007) and XIII (Skopal et al., 2012) by collecting new data obtained during the period from November, 2011 to December 2018. Their acquisition and reduction are introduced in Sect. 2. Sect. 3 describes the most interesting features of the LCs that deserve further investigation. Conclusions are found in Sect. 4.
| Star | |||||
| Comparison stars in the field of EG And | |||||
| a | 8.574 | 10.114 | 1.965 | 0.819 | 0.759 |
| b | 10.118 | 11.145 | 0.822 | 0.539 | 0.495 |
| Comparison stars in the field of Z And | |||||
| 9.044 | 9.474 | 0.095 | 0.292 | 0.202 | |
| 9.229 | 10.549 | 1.229 | 0.744 | 0.681 | |
| a | 12.748 | 13.525 | 0.375 | 0.437 | 0.402 |
| b | 14.205 | 14.765 | 0.054 | 0.337 | 0.352 |
| c | 14.083 | 15.200 | 0.874 | 0.624 | 0.583 |
| d | 14.913 | 15.791 | 0.293 | 0.488 | 0.473 |
| Comparison stars in the field of BF Cyg | |||||
| a | 11.159 | 11.449 | 0.091 | 0.173 | 0.208 |
| b | 12.417 | 12.708 | 0.182 | 0.155 | 0.173 |
| Comparison stars in the field of CH Cyg | |||||
| b | 9.475 | 10.021 | 0.079 | 0.349 | 0.293 |
| d | 10.227 | 11.288 | 0.810 | 0.564 | 0.453 |
| e | 10.852 | 12.260 | 1.693 | 0.790 | 0.637 |
| f | 12.044 | 12.679 | 0.183 | 0.381 | 0.332 |
| Comparison stars in the field of CI Cyg | |||||
| a | 8.831 | 9.445 | -0.166 | 0.425 | 0.269 |
| b | 11.722 | 11.996 | 0.198 | 0.159 | 0.173 |
| c | 12.353 | 13.170 | 0.073 | 0.376 | 0.368 |
| Comparison stars in the field of V1016 Cyg | |||||
| a | 12.314 | 12.866 | 0.085 | 0.334 | 0.315 |
| b | 12.887 | 13.292 | 0.223 | 0.237 | 0.263 |
| Comparison star in the field of V1329 Cyg | |||||
| b | 12.092 | 13.445 | 1.285 | 0.724 | 0.646 |
| Comparison stars in the field of AG Dra | |||||
| a | 10.459 | 11.018 | 0.015 | 0.333 | - |
| b | 11.124 | 11.857 | 0.183 | 0.416 | 0.330 |
| c | 11.699 | 12.244 | -0.042 | 0.335 | 0.294 |
| d | 11.312 | 12.594 | 1.135 | 0.692 | 0.580 |
| f | 13.221 | 13.707 | 0.045 | 0.321 | 0.257 |
| Comparison stars in the field of Draco C1a | |||||
| 4 | 15.363 | 16.328 | 0.620 | 0.517 | 0.481 |
| 7 | 17.447 | 18.238 | 0.298 | 0.465 | 0.430 |
| 9 | 17.974 | 18.981 | 0.309 | 0.585 | 0.581 |
| 11 | 19.339 | 20.123 | 0.114 | 0.445 | 0.569 |
| 12 | 19.787 | 20.587 | – | 0.407 | 0.643 |
| Star | - | - | - | ||
|---|---|---|---|---|---|
| Comparison stars in the field of RS Oph | |||||
| 9.307 | 10.543 | 0.880 | 0.706 | 0.650 | |
| 11.494 | 12.198 | 0.160 | 0.450 | 0.379 | |
| a | 13.255 | 14.272 | 0.377 | 0.660 | 0.652 |
| Comparison stars in the field of AG Peg | |||||
| a | 10.428 | 11.059 | 0.178 | 0.374 | 0.308 |
| b | 10.672 | 11.505 | 0.528 | 0.508 | 0.430 |
| c | 11.204 | 11.708 | -0.030 | 0.330 | 0.302 |
| d | 11.650 | 12.628 | 0.715 | 0.537 | 0.503 |
| Comparison stars in the field of AX Per | |||||
| 10.201 | 10.290 | -0.177 | 0.023 | 0.043 | |
| 11.156 | 12.323 | 0.993 | 0.608 | 0.531 | |
| a | 12.212 | 12.854 | 0.166 | 0.384 | 0.366 |
| b | 13.012 | 13.025 | -0.448 | 0.004 | 0.057 |
| c | 12.124 | 13.141 | 0.700 | 0.544 | 0.515 |
| Comparison stars in the field of HBHA 1704-05b | |||||
| 120 | 12.627(30) | 12.525(10) | 11.936(5) | 11.581(10) | 11.239(10) |
| 123 | 13.020(30) | 12.873(10) | 12.260(5) | 11.903(10) | 11.549(10) |
| C | 11.981(40) | 11.357(10) | 10.519(5) | 10.039(10) | 9.626(10) |
2 Observations and data reduction
Our photometric measurements were carried out at different observatories using different devices and techniques. Multicolour photometric measurements were obtained mostly at the Stará Lesná observatory (pavilions G1 and G2) operated by the Astronomical Institute of the Slovak Academy of Sciences using two 60 cm, f/12.5 Cassegrain telescopes and one 18 cm, f/10 Maksutov-Cassegrain telescope. New observations cover the period between November 2011 and December 2018.
(i) In the pavilion G2, classical photoelectric observations in the standard Johnson system were obtained by a single-channel photoelectric photometer mounted in the Cassegrain focus of the 60 cm reflector (see Skopal et al., 2004; Vaňko et al., 2014a, b, 2015, in detail). We performed these measurements till February 2016, when they were completely replaced by the observations with CCD detectors. Magnitudes obtained with photoelectric photometer were determined using the comparison stars listed in Table 1 of Skopal et al. (2012). Maximum internal uncertainty of these night-means (rms) is of a few times 0.01 in the filters and up to mag in the passband.
(ii) CCD photometric measurements were obtained in the standard Johnson-Cousins system, using three different CCD cameras. Until January 2016, one of the 60 cm telescope was equipped with Moravian Instruments G4-9000 CCD camera ( px, pixel size: ), for photometry. Currently, we are using the FLI ML3041 CCD camera ( px, pixel size: , scale: 0.4 arcsec/px, FoV: ) mounted at the 60 cm telescope in the G2 pavilion to measure magnitudes, and the SBIG ST10 MXE CCD camera ( px, pixel size: ) in the Cassegrain focus of the 18 cm telescope in the G1 pavilion for photometric observations. As the 18 cm telescope is fixed with the 60 cm one for the mid-resolution () echelle spectroscopy, it is also used to obtain simultaneous photometry for absolute flux calibration of the spectroscopic observations.
Standard reduction of the CCD images was done using the IRAF-package software333IRAF is written and supported by the National Optical Astronomy Observatories (NOAO) in Tucson, Arizona. The corresponding magnitudes were obtained with the aid of the comparison stars of Henden & Munari (2006), listed in Table 1. Each value represents the average of individual measurements during a night. For the conversion of the observed magnitudes to the standard system, we used transformation coefficients determined from photometric measurements of M67 star cluster. We re-measure the system once a year, but also after each change of instrumentation including coating the mirrors.
(iii) From 2016.9, some multicolour photometry was performed at the private observatory in Liptovská Štiavnica by one of us (M.V.) using the 35 cm, f/4.5 Newtonian reflector equipped with Moravian Instruments G2-1600 CCD camera (CCD chip: KAF 1603ME, px, pixel size: ). The CCD images were reduced with the MuniWin-package software444http://c-munipack.sourceforge.net/. Resulting magnitudes agree with the values from G1/G2 stations (see point (ii)) within the errors, which are in the range of mag in the filters. Because the camera has only a weak and unevenly sensitivity in the passband, we present magnitudes only of those symbiotic stars, for which agreement with our data is within mag.
(iv) Additional observations were performed using the 50/70/172 cm Schmidt telescope of the National Astronomical Observatory Rozhen, Bulgaria. A CCD camera FLI PL16803 with the chip size px, arcmin field and the scale 1.08 arcsec/px was used. Some observations were also carried out with the VersArray 1300 B CCD camera (13401300 px, pixel size: 20 m 20 m, scale: 0.258 arcsec/px) on the 2 m and 1.3 m telescopes.
Maximum internal uncertainties of our CCD measurements were in most cases comparable to those determined for the photoelectric photometry (see the point (i) above). In the and passband the night-means (rms) errors were 0.05 mag. However, in most cases the errors are given in tables (see on-line data).
(v) The photographic magnitudes of FG Ser and HBHA 1704-05 were determined using the digitized plates from the archive of the Sternberg Astronomical Institute of the Moscow University (SAI). The plates were obtained with the 40 cm astrograph at the SAI Crimean Observatory. To extract the LC of these objects, we reprocessed the original scans using the latest version of the VaST-package software555http://scan.sai.msu.ru/vast/ featuring the improved photographic aperture photometry calibration technique (Bacher et al., 2005; Sokolovsky et al., 2016).
(vi) In addition, visual magnitude estimates of symbiotic stars AE Ara and AR Pav were performed at the Tetoora Observatory in Australia (R.S.) with the 55 cm, f/3.8 Dobsonian telescope, from 2010. Between 2007 and 2010, estimates of these stars were carried out by Albert Jones6661920–2013 at the Carter Observatory, Wellington 1, New Zealand, using his private 32 cm, f/5 reflector. Comparing visual estimates with independently obtained magnitudes (e.g., from ASASSN survey), we determined their uncertainties to mag for AE Ara (see Figs. 7 and 6 here, and Fig. 3 of Skopal et al. (2007)). For AR Pav we found uncertainties to be even smaller, being of mag (Fig. 23 here and Figs. 1 and 10 in Skopal et al. (2001a) and Skopal et al. (2007)).
Tables with data for individual objects are only available
on-line at
https://www.astro.sk/caosp/Eedition/FullTexts/vol49no1/pp19-66.dat/ .
3 Light curves of the measured objects
3.1 EG And
EG And is one of the brightest symbiotic stars. To date, no outburst was detected during its observational history (Skopal, 1997; Jurdana-Šepić & Munari, 2010, and Fig. 1 here). It is an eclipsing binary consisting of M2.4 III giant and a hot star with a relatively low temperature of in comparison with other symbiotic stars (Oliversen et al., 1985; Kenyon & Fernandez-Castro, 1987; Muerset et al., 1991; Skopal, 2005). The orbital period was most recently determined by Kenyon & Garcia (2016) to days from radial velocities of the cool component derived from echelle spectra observed during more than 20 years. Including their data to all the previously published, they attained an average orbital period of days.
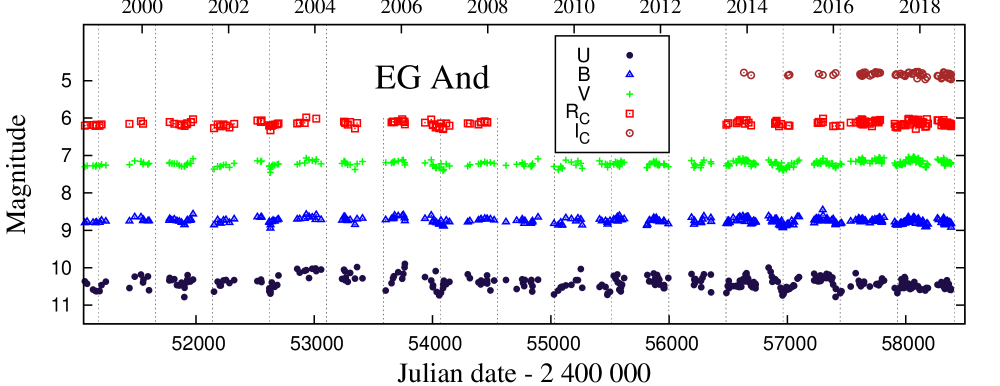
Although EG And persists in a quiescent phase, we can identify a few types of light variability in it’s LC. Figure 2 shows a double-wave light variation along the orbital motion with minima around times of the spectroscopic conjunctions of the binary components. This variability dominates the light curve of EG And in all passbands. The presence of the secondary minimum around the orbital phase 0.5 in the filter is confirmed by the long-term photometry in the Johnson’s filter as published by Percy et al. (2001).
Based on modelling the and LCs of EG And, Wilson & Vaccaro (1997) attributed the double-wave LC to the tidal distortion of the giant. On the other hand, Skopal (2001) proposed a model, where a partially optically thick, non-symmetrical symbiotic nebula can also generate the observed orbitally-related double-wave light variation by producing different contributions of its emission into the line of sight at different orbital phases. This interpretation does not claim the Roche-filling giant, recently confirmed by Kenyon & Garcia (2016). Finally, we note that Jurdana-Šepić & Munari (2010) didn’t find any ellipsoidal variability in their photographic data obtained during 35 years of observations. However, the accuracy of their estimates of mag and the presence of additional mag variation in on the time scale of tens of days (see below) could affect the visibility of the secondary minimum.
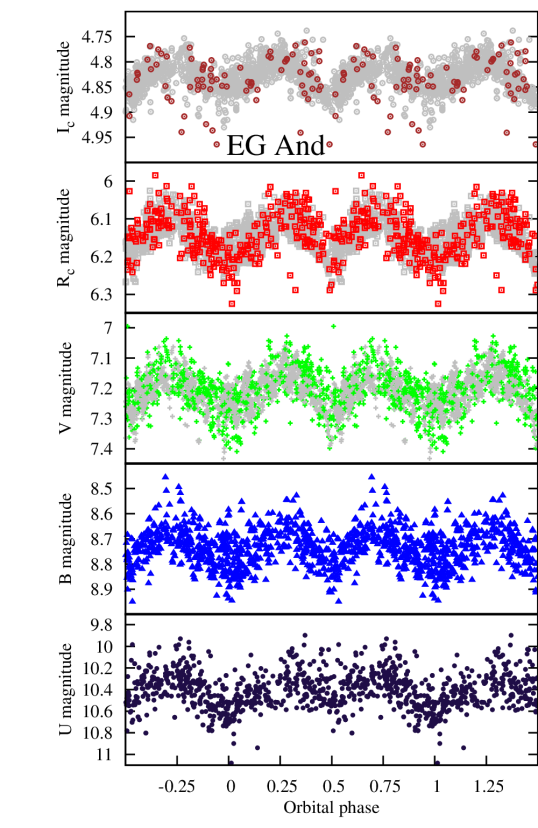
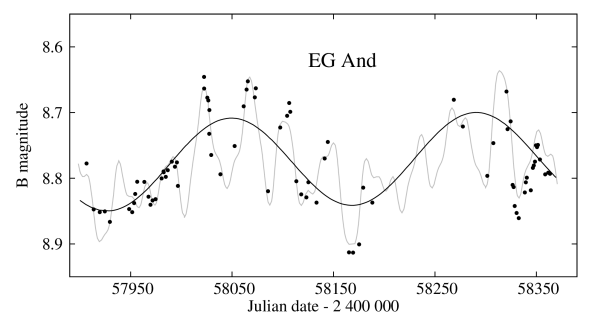
The large scatter of data in all filters shown in the phase diagram (Fig. 2) represents real light variations (Skopal, 1997; Skopal et al., 2012). In our data, this variability is best evident in and after May 2017 (, Fig. 3). The peaks are separated by days. Using Fourier analysis on the time interval between May 2017 and March 2018 we identified two periods of and days. Also, the wavelet analysis revealed a period with the highest WWZ statistic of days. Percy et al. (2001) identified a period of 29 days by analyzing the long-term photometry of EG And. Crowley (2006) suggested, that the period of days with a variation of mag is consistent with small radial pulsations of the red giant photosphere. Although we examined only the short time interval, we found a 28 days period in the data. When using all our data in together with those of Skopal (1997) and Skopal et al. (2012), we identified a period of days. It has, however, lower significance than that of 42 days, which we did not find using all the data. The brightness of the star in filter was observed less frequently and these ”pulsations” are not so obvious. In our data, we found only a period of days after . The light curve with magnitudes shows more chaotic behaviour, with variation up to mag. The observed brightenings could be related to the enhanced mass loss rate from the giant due to pulsations of the giant. The enhanced mass loss from the giant increases the density of the circumstellar matter and hence the accretion rate onto the WD. The enhanced accretion can increase the luminosity of the WD, and thus also the nebular radiation, which dominates the passband (Crowley, 2006; Skopal, 2005; Skopal et al., 2012).
Finally, there is probably present a very long-period light variation on the time-scale of several years. It is apparent mainly in the brightness, which peaks between the years 1986–1989 (Skopal, 1997) and 2004-2006 (Skopal et al., 2012). This light variation has the highest amplitude in ( mag) and lowest in and band ( mag).
3.2 Z And
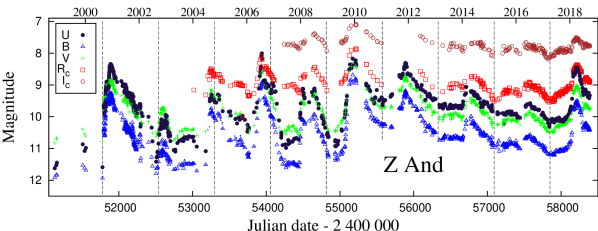
Z And is considered to be a prototype of the class of symbiotic stars. The binary consists of a late-type M4.5 III red giant and a WD accreting from the giant’s wind on the 758-day orbit (e.g. Nussbaumer & Vogel, 1989; Fekel et al., 2000a). The current active phase has begun in September 2000 (Skopal et al., 2000a), being followed with a series of outbursts with the main optical maxima in December 2000, July 2006, December 2009 and December 2011 (see Fig. 4). At/after the 2006 and 2009 maxima, highly collimated bipolar jets were detected as the satellite emission components to H and H lines (Skopal & Pribulla, 2006; Skopal et al., 2018).
Our new photometry is shown in Fig. 4. After the major 2009 outburst, we detected four new main peaks in the LC. The first occurred in November 2011 () with maximum mag). Then the brightness was continuously fading until March 2013 () to mag. The next maximum occurred between February and May 2014 at mag. In June 2016, the star’s brightness slightly increased to mag, and then declined to the lowest level at mag, in April 2017. In October 2017, Z And started the recent most pronounced outburst since that in 2011. The brightness steeply increased to the maximum of mag in April 2018, following a decrease to the present (December 2018).
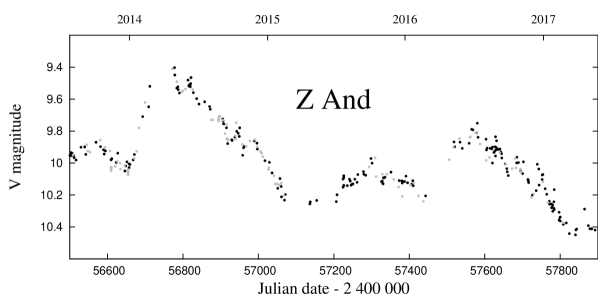
The profiles of the observed outbursts since 2011 are very similar. The steep increase of the brightness, followed by a slower decline and separated from the next increase with a standstill in the brightness. In April 2017, we observed a short decline by mag in just before the phase of relatively constant brightness, close to the orbital phase , as observed in the LC of BF Cyg (see Fig. 30). The and LCs show a double-wave light variation.
Our data supplement well those from the AAVSO database, whereby we can detect a light variation with the period of days, best visible in the LC (Fig. 5).
3.3 AE Ara
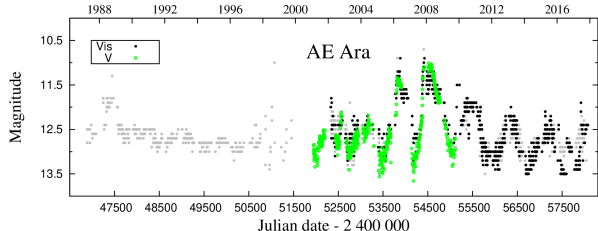
AE Ara was specified as a symbiotic star on the basis of its infrared colours by Allen & Glass (1974). It is an S-type symbiotic star with the orbital inclination of (Fekel et al., 2010), thus no eclipses are observed in the LC. The orbital period of days was determined by Mikołajewska et al. (2003) using the visual photometry during the 1980s and 1990s decades. Using radial velocity measurements from the near-IR spectrum obtained during 2001 – 2009, Fekel et al. (2010) found the value of days.
The published photometric data consist mainly of visual estimates. They are in good agreement with photometric magnitudes published by Skopal et al. (2007) and magnitudes released as a part of the ASAS777All Sky Automated Survey program (Pojmanski, 2002). According to the LC evolution, AE Ara was in quiescent phase until the beginning of 2006, when the system entered a new active phase (see Fig. 3 of Skopal et al., 2007, and Fig. 6 here).
Here we present new visual observations from 2007 (see Sect. 2, point (vi)). Figure 6 shows that AE Ara was in an active phase from 2006 to 2014 with the maximum mag at the beginning of 2008 that was followed by a gradual decrease throughout a few orbital cycles. Applying the Fourier analysis for the AAVSO888 American Association of Variable Star Observers data, magnitudes from ASAS and our measurements between March 2006 and July 2016, we estimated the orbital period of AE Ara to days (Fig. 7). To confirm this result, we also used a different approach. We fitted the data with a function
| (1) |
where the variation of the magnitude with time in Julian days is described by a sinus function with the phase shift and the period . In our approach, the decrease of the amplitude is given by a damping parameter and the star’s brightness declines linearly with time, given by parameters and . The resulting fit (Fig. 7) yields the period days and the decline in the amplitude variations from 2006.2 to 2016.6. During this time, the brightness of the system decreased with a factor of . Our analysis suggests that the orbital period indicated during the transition from the active to the quiescent phase (2006.2 – 2016.6) is larger than that determined during the quiescent phase by Mikołajewska et al. (2003) and that from radial velocities of Fekel et al. (2010).
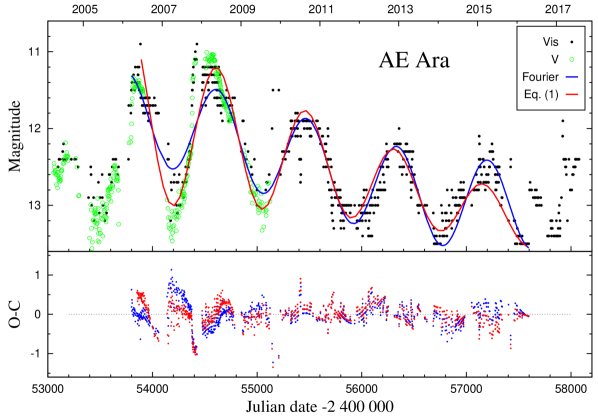
Analysis of the minima positions in the historical LCs of symbiotic stars revealed apparent changes in their orbital periods that are systematic, depending on the level of activity of symbiotic binary (Skopal, 1998). For example, after the main 1895 outburst of BF Cyg the minima were separated with 770 days along the decrease of the star’s brightness, which indicates a longer orbital period than given by the spectroscopic orbit (757.2 days; see Fekel et al., 2001). The nature of the larger apparent orbital period determined for AE Ara during the brightness decline after the 2006 outburst will be probably the same as for BF Cyg. Understanding of this very interesting effect requires a more detailed analysis, which is out of the scope of this paper.
3.4 BF Cyg
Observational history of the eclipsing symbiotic star BF Cyg began more than 120 years ago (Jacchia, 1941, and references therein). The main feature of the LC is a very slow decrease in the brightness, from the 1894 nova-like outburst to 1985, when the brightness in decreased by more than 3 mag (see Fig. 1 of Skopal et al., 1997). Simultaneously, periodic or eruptive variations in the star’s brightness were observed. The historical LC was analyzed by Leibowitz & Formiggini (2006). They identified several periods in the optical LC. Beside the orbital period days, (Pucinskas, 1970; Fekel et al., 2001), they indicated a 798.8-d period, which they attributed to the rotation of the giant. In addition, they showed that the most pronounced outbursts repeat every days, predicting a new outburst for 2007.
A new active phase began around the mid of 2006, reaching the peak in September 2006 (Munari et al., 2006; Iijima, 2006; Skopal et al., 2007; McKeever et al., 2011).
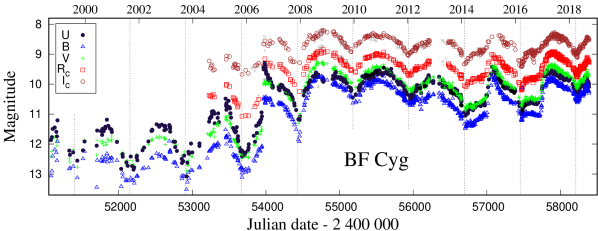
Figure 8 shows the multicolour LCs of BF Cyg from 1999 to our last observations in December 2018. The light variation after the 2006 outburst is modulated by the orbital motion, showing broad minima around the inferior conjunction of the giant (orbital phase ), similar to those observed during quiescent phases. After the rapid descent to the eclipse in December 2013, the LC changed in profile. In 2014 and 2016 the minima were followed by a phase of a relatively constant brightness until . It is of interest to note, that similar light variation was observed also in the LC of AX Per and Z And (see Fig. 30). During the 2014 eclipse, BF Cyg reached the lowest brightness since the deep eclipse in 2007. Thereafter, the overall brightness of the system was gradually increasing. The minima in 2014 (), in 2016 () and in 2018 ( mag) occurred 14, 17 and 20 days after the predicted inferior conjunction of the giant, according to the ephemeris of Fekel et al. (2001). After that we observed a steep increase of the brightness (bursts, see Skopal et al., 2017a, for the 2016/2017 one), which peaked around . A similar profile of the light variation is present in all filters, although in the filter it is less evident. After the most recent minimum in 2018 () the brightness of BF Cyg steeply raised to mag at , but consequently dropped to mag within 30 days as given by our last measurement.
3.5 CH Cyg
The photometric variability of CH Cyg is probably the most intriguing from all well-observed symbiotics. The light variations are observed on very different time-scales, from minutes to decades. It is believed that the rapid light variation (flickering, flares and bursts) and other types of stochastic variability are connected with accretion phenomena in the system. Also possible pulsation of both the cool giant and the hot component, orbital motion(s) in the system of unknown composition (binary or triple star system?) and dust obscuration events make the resulting light and its changes even more complex (e.g. Mikolajewska et al., 1988; Skopal et al., 1996; Iijima, 1998; Motta & Motta, 2000; Corradi et al., 2001; Skopal et al., 2002; Sokoloski & Kenyon, 2003; Bondar’ & Prokof’Eva, 2006; Biller et al., 2006; Taranova & Shenavrin, 2007; Bogdanov & Taranova, 2008; Hinkle et al., 2009; Pedretti et al., 2009; Skopal et al., 2010; Karovska et al., 2010; Sokoloski et al., 2010; Shugarov et al., 2012; Stoyanov et al., 2012; Shugarov et al., 2015; Iijima, 2017; Kondratyeva et al., 2017; Mikayilov et al., 2017; Stoyanov et al., 2018).
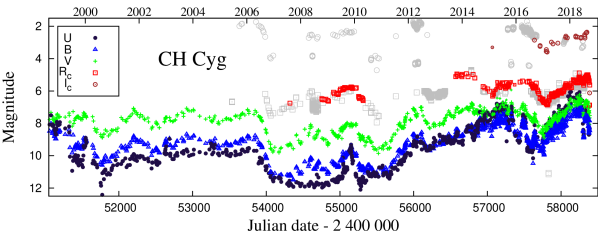
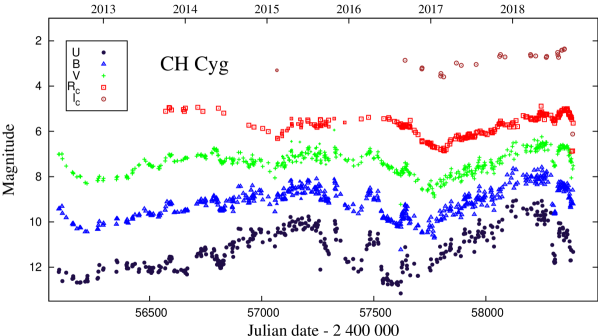
Our observations are shown in Figs. 9 and 10. After the June-December period in 2006, when the LC showed a mag decline of brightness in all colours (Skopal et al., 2007), CH Cyg began to gradually increase its brightness. In 2009, a burst was detected simultaneously in the X-rays and the optical passbands (Mukai et al., 2009; Skopal et al., 2010). Similar bursts were later indicated during October 2015, between February and May 2016 and in September 2016. All bursts were comparable in amplitude ( mag; Fig. 10).
From 2015 we measured a 3 years lasting wave with maxima around July-August 2015 ( mag) and March-April 2018 ( mag) and the broad minimum at the end of 2016 with mag. Times of minima depend on the colour. The largest difference of days is between the minimum in () and () (Fig. 10), although the LC is rather complex during the second half of 2016. It is of interest to note that the 2018 maximum with mag was the highest one after the major 1977-1984 outburst (5 mag). The different time of the maximum in and filters can be caused by the presence of a day period easily recognized in and LCs (see Wallerstein et al., 2010). Further, we observed a sharp minimum at ( mag) and then another decrease by mag until our last observation (see Fig. 10).
3.6 CI Cyg
Since September 2008, when CI Cyg underwent its last major outburst, the return to the quiescent phase was interrupted only by two eruptions of lower magnitude (Fig. 11). The first one, disrupted by the eclipse, was described by Skopal et al. (2012). The second one with two maxima around mag was observed during August-September, 2012. Since then, CI Cyg entered a quiescent phase showing the typical brightness variation strongly modulated by the orbital motion in all filters. A secondary minimum around the was recognizable in the LCs (see Figs. 11 and 12).
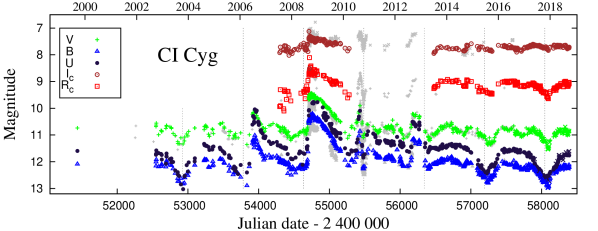
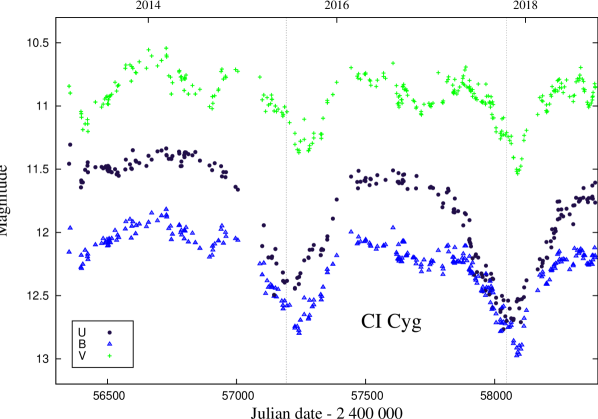
According to the basic composition of symbiotic binaries (see Sect. 1), the amplitude of such variability is wavelength dependent with . Fig. 12 shows that times of the recent wave-like minima are shifted from those predicted by the ephemeris for eclipses. In addition, the shift seems to be a function of the colour. For the 2015 minimum, we determined the light minima by a simple parabolic fit to Min(B)JD 2 457 237.2 and Min(V)JD 2 457 253.8. For the 2017 minimum, we found its timings at Min(B) JD 2 458 074.4 and Min(V)JD 2 458 088.4. During the last orbital cycle, the LC in all filters is modulated by a light variation with the period of days, which is most pronounced in the filter (Fig. 12).
Since 2011 until our last observations, the overall brightness of CI Cyg has been gradually decreasing with a rate of about 0.17 mag per year.
3.7 V1016 Cyg

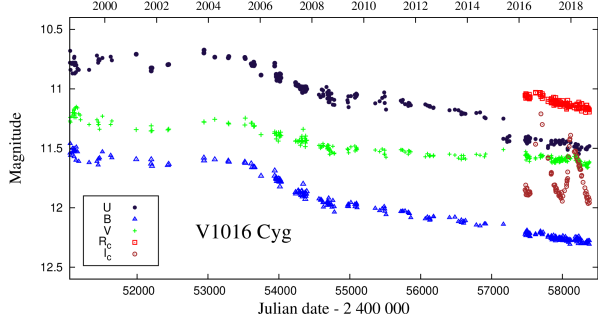
V1016 Cyg underwent a nova-like outburst in 1964 (McCuskey, 1965) when increased its brightness by 6 mag and reached the maximum in 1971. Since then the brightness of the system slowly decreases most of the time. V1016 Cyg is a D-type symbiotic star, with the oxygen-rich cool giant of the Mira-type variable (Harvey, 1974; Schild et al., 1992). Arkhipova et al. (2015) refined the pulsation period of the giant to days with the minimum at .
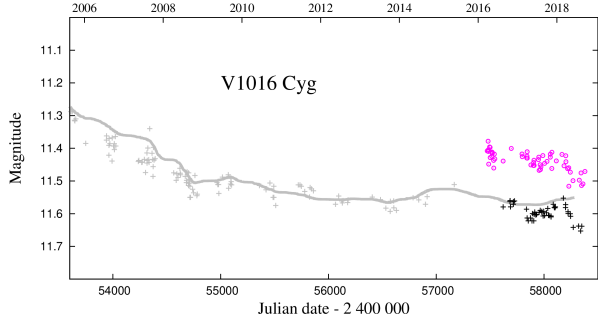
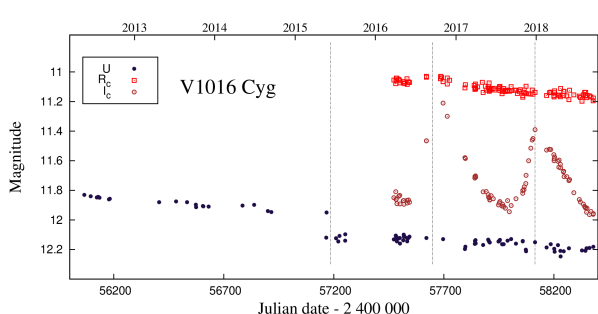
Here, we present photometric observations of V1016 Cyg obtained after March 2016 (Fig. 13). Pulsations of the giant are clearly apparent in the filter. The last maximum was observed at 2 458 114 (Fig. 15). We noticed certain shifts between the data observed in the same passband, but using a different telescope–camera–filter composition (Fig. 14). The shifts are as high as mag in and filter. This is probably caused by the effect usually observed in the LCs of novae during the ‘nebular phase’. The observed flux within a filter is dominated by nebular lines rather than by the underlying continuum. When using the broadband photometric filters, some prominent emission lines can be located close to the edge of the filter sensitivity. Critical emission lines for this case are H, O[III] 4959, 5007 Å, H and Pa, which significantly contribute to the fluxes within , , and filters. Hence, a small difference in the response curve of the filter used can result in some shifts in the observed magnitude (e.g. Munari et al., 2015; Arkhipova et al., 2015). Figure 14 demonstrates the effect of strong nebular lines located near to the short-wavelength edge of the filter for V1016 Cyg.
In May 2015, Arkhipova et al. (2016a, b) observed a sudden decrease in the star’s brightness by about 0.17 mag. Our new observations confirm this brightness drop (see Fig. 13). At the same time and colours became redder (Fig. 16). This reddening could be partly caused by the variable circumstellar extinction due to the dust produced by the Mira variable and/or by the change of the relative intensity of O[III] 4959 and 5007 Å emission lines, because of their different contribution to the and magnitude (see Arkhipova et al., 2015). It is of interest to note that the decline in the and brightness during 2016 occurred around the time of the maximum brightness of the Mira variable for the 465 days pulsation period (at 2 457 184, see Fig. 15).
3.8 V1329 Cyg
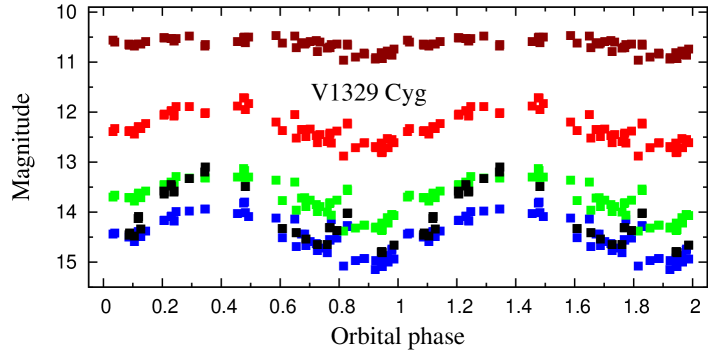
V1329 Cyg was originally an inactive star of about 15 mag displaying 2 mag deep eclipses (Stienon et al., 1974; Schild & Schmid, 1997). In 1964, V1329 Cyg underwent a nova-like eruption when brightened by 3 mag, peaked around 1968 at mag and developed a wave-like orbitally-related variation in its LC (Kohoutek, 1969; Arhipova & Mandel, 1973; Grygar et al., 1979). This type of photometric variability – characteristic for symbiotic binaries during quiescent phases – dominates the LC of V1329 Cyg to the present (e.g. Skopal et al., 2012, and references therein).
Our new observations of V1329 Cyg are shown in Fig. 17, where they are folded as a function of the orbital phase using the ephemeris of the pre-outburst eclipses derived by Schild & Schmid (1997). The data cover the period from November 19, 2009, to December 25, 2017, i.e. 3.1 orbits. Our measurements confirmed the presence of the orbitally-related light variability with a decreasing amplitude to longer wavelengths: , , , and mag. Such the dependence is the result of the superposition of the variable contribution from the nebula and a constant light from the red giant, whose contribution increases to longer wavelengths. Figure 17 also shows that the light minimum precedes the inferior conjunction of the giant by . This effect is caused by a prolate structure of the symbiotic nebula, whose optically thick part is asymmetrically located with respect to the binary axis during quiescent phases of symbiotic stars (see Skopal, 1998, in detail).
3.9 AG Dra
AG Draconis is a well studied bright symbiotic star. It is a yellow symbiotic binary comprising a K2 III giant (Mürset & Schmid, 1999) and a WD accreting from the giant’s wind on a 549-day orbit (Fekel et al., 2000a). There are no signs of eclipses neither in the optical nor far-UV. Based on spectropolarimetric observations, Schmid & Schild (1997) derived the orbital inclination . The system undergoes occasional eruptions, lasting about 1-2 orbital cycles. The star’s brightness abruptly increases (2, 1 mag) showing multiple maxima separated approximately by 400 days, while during quiescent phase the LC shows typical wave-like orbitally-related modulation (e.g. Meinunger, 1979; Skopal, 1998; Hric et al., 2014; Leedjärv et al., 2016, and references therein) The historical LC was analyzed by Formiggini & Leibowitz (2012). They confirmed the days orbital period and -day pulsation period of the K-type giant, originally proposed by Gális et al. (1999). Moreover, they reported also days cycle between the outbursts and suggested -day rotation period of the giant.
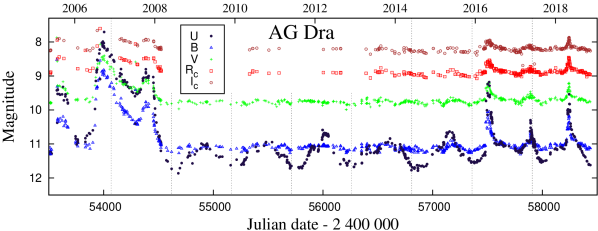
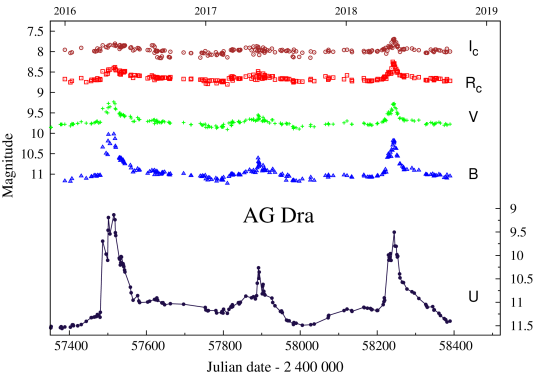
González-Riestra et al. (1999) identified cool and hot outbursts differing in their Zanstra temperatures and the LC profile. The former are more pronounced ( mag) lasting for 1–2 years, while the latter are weaker ( mag), single brightenings lasting for weeks to months. The last cool outburst was observed during 2006–2007. The following quiescent phase was interrupted with two small brightenings in March 2012 and May 2015 ( mag; see Fig. 18). Further, three bright bursts were observed in April 2016 ( mag), in May 2017 ( mag) and in May 2018 ( mag). A multi-peaked profile is apparent especially during the 2016 outburst, where it can be recognized in filters (Fig. 19).
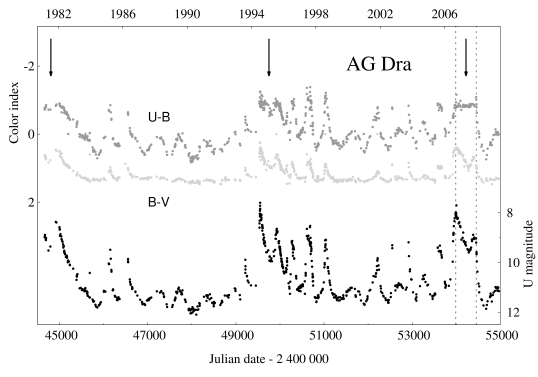
It is of interest to note that the colour practically did not change during the last 2007 major outburst (see Fig. 20). The plateau part of the LC occurred just between its two maxima. However, the LC profile of the index resembles that of individual LCs. This plateau was not so evident during the 1994 major outburst, while that during the 1981-82 outburst was better comparable with the recent one. The plateau phases during major outbursts of AG Dra are probably caused by a strong dominance of the nebular radiation within the and passbands (e.g. Skopal, 2005). Then the star’s brightness decline here is given by that in the nebular emission, which results in more or less constant value of the index. However, the brightness decrease in, e.g., filter is slower than in a bluer one, because of a significant contribution from the giant in , and thus the index is more similar to individual LC profile (see Fig. 20).
3.10 Draco C1
The symbiotic star Draco C1 is located in the Draco dwarf spheroidal galaxy (DdSg). Its symbiotic nature was discovered by Aaronson et al. (1982) within a grating prism survey of the DdSg. The spectrum was characterized by strong emission lines superposed on a carbon star continuum. Draco C1 has been studied photometrically for a long time (Munari, 1991; Skopal et al., 2007; Kinemuchi et al., 2008; Henden & Munari, 2008; Munari et al., 2008; Skopal et al., 2012). Long-term photometry showed a variable LC with 0.1 mag and periodicity around one year, which could be attributed to the orbitally-related variation of quiescent symbiotic stars.
Our new measurements of Draco C1 cover the period between November 6, 2010, and August 6, 2016.
3.11 RS Oph
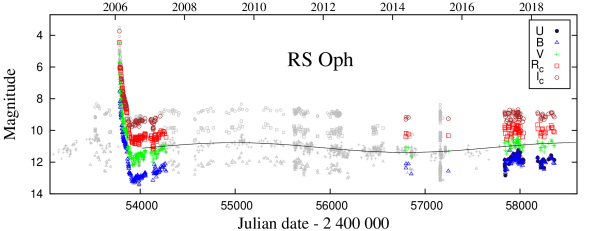
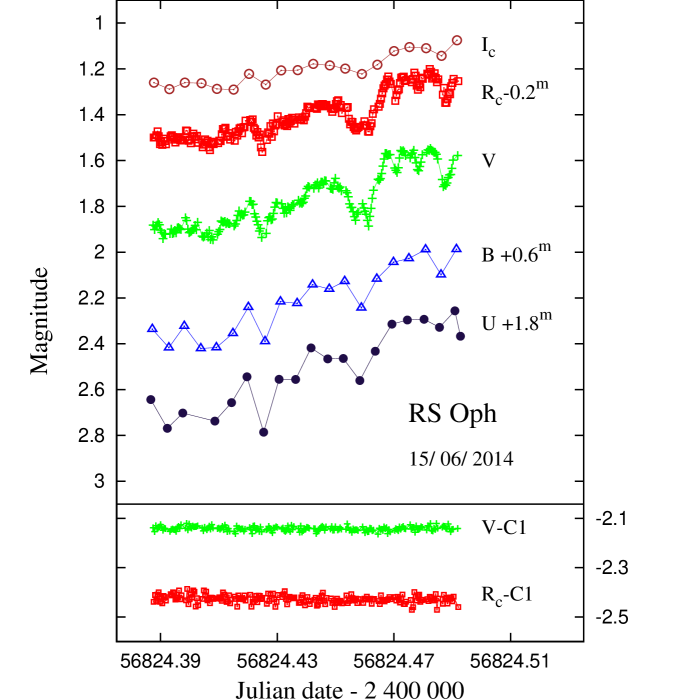
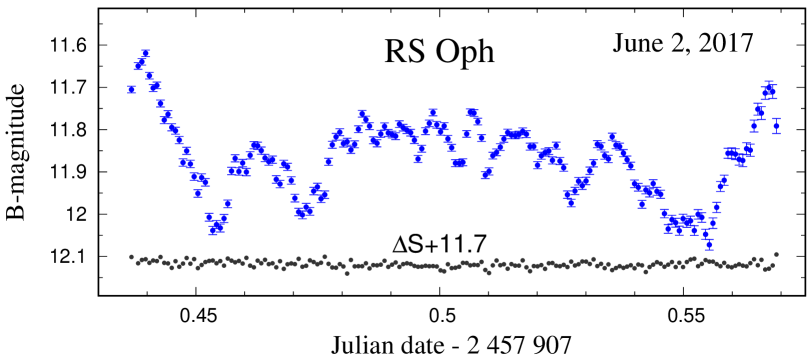
RS Oph is a symbiotic recurrent nova with the orbital period days (Brandi et al., 2009). To the present, six eruptions were recorded in 1898, 1933, 1958, 1967, 1985 and the last one in 2006. Additional two outbursts probably happened in 1907 and 1954. For the former, only a post-eruption dip was observed on archival photographic plates, because of the season gap in observations (Schaefer, 2004). Similarly, the latter was suggested by Oppenheimer & Mattei (1993) according to the presence of such the dip and the fading tail from the eruption, later confirmed by Adamakis et al. (2011). The mean time between the eruptions is 15 years. After the 2006 outburst, RS Oph remains in a quiescent phase, during which the LC shows a sine-like variation with the amplitude mag and a period of 9.4 years (Fig. 21). A large scatter of the data is caused by the presence of flickering with the amplitude of several tenths of a magnitude (e.g. Bruch, 1986; Worters et al., 2007; Zamanov et al., 2015). Our measurements of the rapid light variability of RS Oph are showed in Fig. 22. It is observed in all filters having the amplitude decreasing with increasing wavelength, because of increasing constant contribution from the giant in longer wavelengths.
3.12 AR Pav
AR Pav is eclipsing symbiotic binary with the orbital period of 605 days (Mayall & Shapley, 1937). It consists of an M5 III giant with a mass of 2 (Mürset & Schmid, 1999). According to the observed variations in the UV/optical continuum (e.g. Schild et al., 2001; Skopal et al., 2000b), the hot component is highly variable in brightness, size and the geometry as suggested by very different profiles of minima – eclipses (Bruch et al., 1994; Skopal et al., 2000b, 2001a).
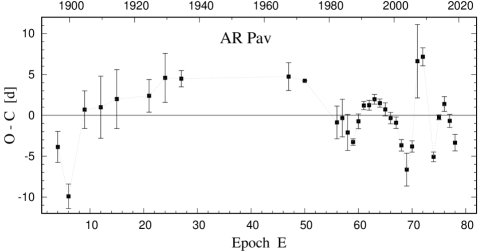
Photographic magnitudes of AR Pav were recorded on Harvard chart plates since 1889 (Mayall & Shapley, 1937). Monitoring this star during 1889-1937, the authors classified it as an eclipsing binary of the P Cyg type with an orbital period of 605 days. Comparing consecutive refinements of the orbital period (see Andrews, 1974; Bruch et al., 1994), complemented with new, 1985-1999, observations, Skopal et al. (2000b) found a decreasing trend of the orbital period. The following observations (see Skopal et al., 2001a, 2004) supported this result until the period felt to the value of days as determined from the minima (66), (67) and (68) (Figs. 23 and 24). The period between Min(69) and Min(70), however, raised up to days (Skopal et al., 2007). Authors ascribed this difference to a strongly variable size, geometry and radiation of the eclipsing object, which affects the variation in the minima depth and the overall profile of the eclipse.
| Epoch | Ref.⋆ | Epoch | Ref.⋆ | ||
|---|---|---|---|---|---|
| 4 | 2413678.41.9 | 1 | 62 | 2448742.60.6 | 1 |
| 6 | 14881.31.5 | 1 | 63 | 49347.80.6 | 1 |
| 9 | 16705.32.3 | 1 | 64 | 49951.80.5 | 1 |
| 12 | 18519.03.8 | 1 | 65 | 50555.50.8 | 1 |
| 15 | 20333.43.6 | 1 | 66 | 51158.90.7 | 2 |
| 21 | 23960.62.0 | 1 | 67 | 51762.80.7 | 2 |
| 24 | 25776.23.0 | 1 | 68 | 52364.50.7 | 3 |
| 27 | 27589.51.0 | 1 | 69 | 52966.02.0 | 4 |
| 47 | 39679.11.7 | 1 | 70 | 53573.30.7 | 4 |
| 50 | 41492.0 | 1 | 71 | 54188.24.5 | tp |
| 56 | 45113.72.0 | 1 | 72 | 54793.21.1 | tp |
| 57 | 45718.72.3 | 1 | 73 | - | |
| 58 | 46321.42.2 | 1 | 74 | 55989.90.6 | tp |
| 59 | 46924.70.4 | 1 | 75 | 56599.20.3 | tp |
| 60 | 47531.70.9 | 1 | 76 | 57205.30.9 | tp |
| 61 | 48138.10.5 | 1 | 77 | 57807.70.8 | tp |
| 78 | 58409.51.0 | tp |
In this paper, we present our (A.J., R.S.) new visual magnitude estimates, which are in good agreement with photoelectric magnitudes (see Skopal et al., 2000b, 2001a, 2004, 2007, and Fig. 23 here). We determined times of new minima between the epoch 71 and 78 using one or several methods (parabolic fit, tracing paper method, Kwee and van Woerden method, sliding integration). Minimum at E = 73 was not determined, because of insufficient data (Fig. 24). Our times of minima (eclipses) together with those published in the literature are listed in Table 2. They correspond to linear ephemeris
| (2) |
Residuals between the observed and predicted times of minima (eclipses) are shown in Fig. 25. The diagram indicates real systematic variation in the minima timing. In general, this can be caused by variable mass transfer and mass accretion resulting in variable size and shape of the eclipsing object, and thus in a variation of times of the light minima.
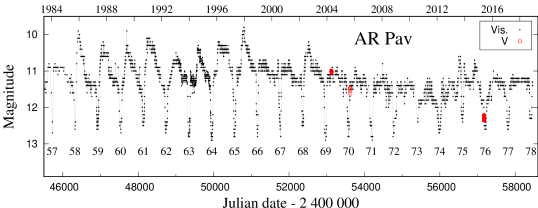
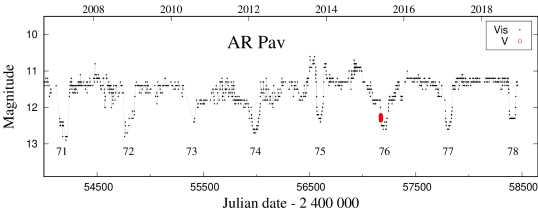
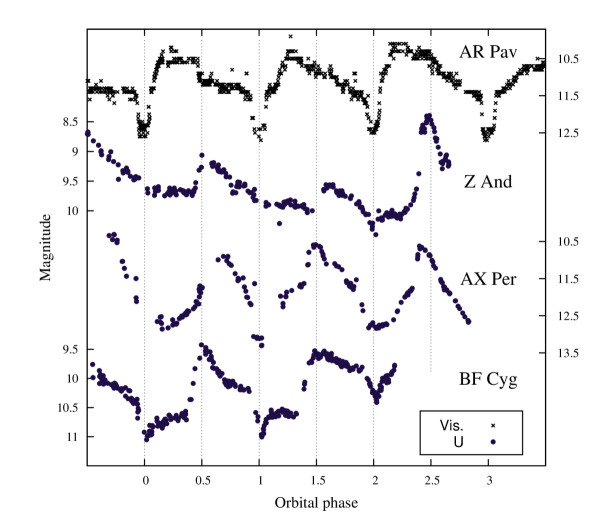
During the higher level of the activity, the LC of AR Pav resembles that of AX Per. However, the maximum light occurs usually around the orbital phase and not during the superior conjunction of the giant (Fig. 30). After 1998, AR Pav reduced its out-of-eclipse activity to only three episodes of the star’s brightening; in 2002, 2013 and 2014 (see Figs. 23 and 24). The flat LC profile between eclipses is observed from 2016.5 to date.
3.13 AG Peg
AG Peg is a symbiotic binary comprising a M3 III giant (Kenyon & Fernandez-Castro, 1987) and a WD on an 818-d orbit (e.g. Fekel et al., 2000b). This system is known as the slowest nova ever recorded (Kenyon et al., 1993). Its nova-like outburst began during 1850 (Lundmark, 1921) when it rose in brightness from to a maximum of mag around 1885. Afterwards, AG Peg followed a gradual decline to around 1997 (Boyarchuk, 1967; Kenyon et al., 2001). Then AG Peg entered a quiescent phase with a typical orbitally-related wave-like light variations with the amplitude mag around the mean of 9.7 mag until June 2015, when erupted again showing a Z And-type outburst (Fig. 26 here, Fig. 1 of Skopal et al., 2017b, and references therein).
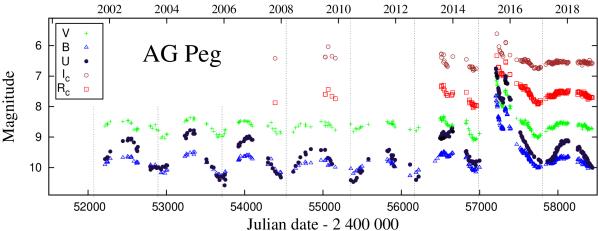
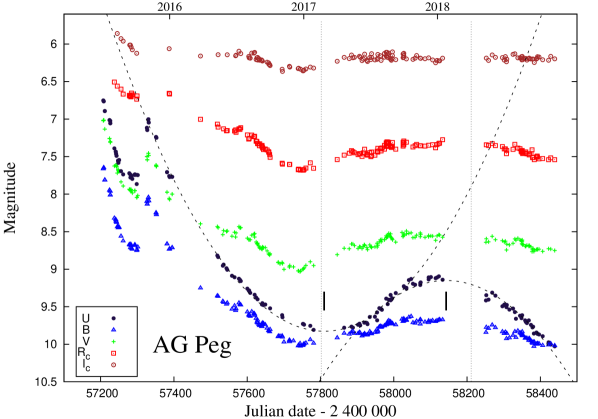
The 2015 outburst was first reported by Waagen (2015). According to our multicolour photometry (Fig. 26 here and Fig. 2 of Skopal et al., 2017b), the outburst started around June 5, 2015 (JD) at mag and mag, reaching a maximum around June 30, 2015 (JD) at mag and mag. After a gradual decline, a sudden re-brightening occurred on October 8, 2015 (JD) with a rise in , and by 1, 0.7 and 0.5 mag, respectively. In contrast to the first maximum, the secondary one was followed by a plateau phase until November 24, 2015, when the brightness began to decrease gradually.
From August 2016 to the end of our observations (December 2018), the LCs developed a wave, signalizing that AG Peg returned to a quiescent phase (see Figs. 26 and 27). The shape of the LC could be compared to quadratic functions, which aid us to determine its extrema. The minimum and maximum occurred at and at the orbital phase and , respectively.
The brightness, the short timescale and the multiple peaks of the 2015 outburst refer to a different type of outburst in comparison with the event in the mid of 19th century. It was shown that the recent outburst was of a Z And-type and that AG Peg obviously entered a new era of its evolution Tomov et al. (2016); Ramsay et al. (2016); Skopal et al. (2017b).
3.14 AX Per
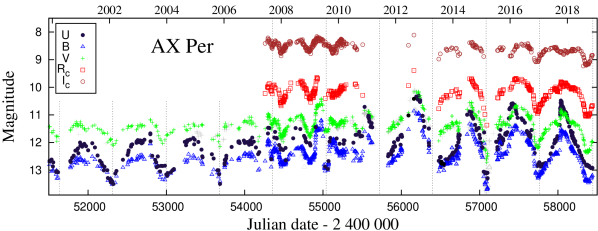
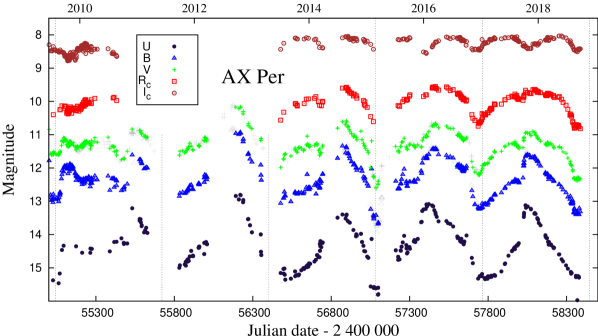

AX Per is an eclipsing binary with the orbital period of days (e.g. Skopal, 1991; Mikolajewska & Kenyon, 1992). The last quiescent phase that lasted from 1995 was interrupted by the mag flare in July 2007 followed with rapid and mag brightenings in , during March 2009 and November 2010, respectively (Fig. 28), supporting a suggestion of a forthcoming major outburst (Munari et al., 2009a, 2010).
Our new photometric observations cover nearly four orbital cycles during a high level of the star activity. A wave-like profile in all colours with the amplitude of mag are typical for each cycle (Figs. 28 and 29). It is of interest to note that such characteristics can be recognized also in LCs of other active symbiotic binaries. Figure 30 shows a comparison for AX Per, BF Cyg, Z And and AR Pav. The light minimum is always observed around the inferior conjunction of the giant, i.e. at the orbital phase , and the maximum light around , when the active object is in front.
During the recent active phase, the minima – eclipses differ significantly from those observed during previous active phases (see Fig. 2 of Skopal et al., 2011). For example, the eclipse measured in March 2015 has a narrow, symmetric V-shaped profile in and with the minimum at , while in the LC is rather flat. The following ‘eclipse’ from December 2016 () is much broader and asymmetric in , and and even flatter in , lasting from to (Fig. 29). We note here that a very similar eclipse profile was observed between 1958 and 1972 (Fig. 31), when AX Per was in quiescent phase (Myalkovskij, 1977; Skopal et al., 2001b). According to , and LCs, the last observed minimum started in August 2018 () showing a broad descending branch. Although our observations end before the predicted eclipse time, it seems that the light minimum precedes this position (Fig. 29). In general, the LC profile changes from cycle to cycle and is dependent on the colour. Such the behaviour reflects complex and variable sources of radiation around the WD as well as within the circumbinary environment.
3.15 FG Ser
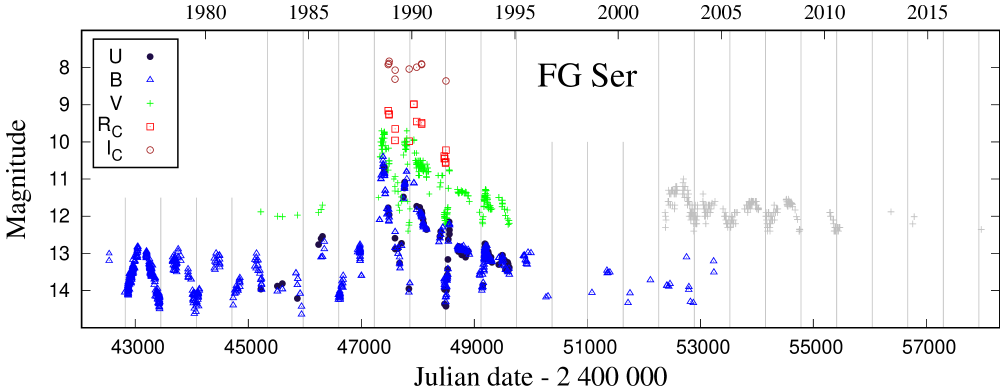
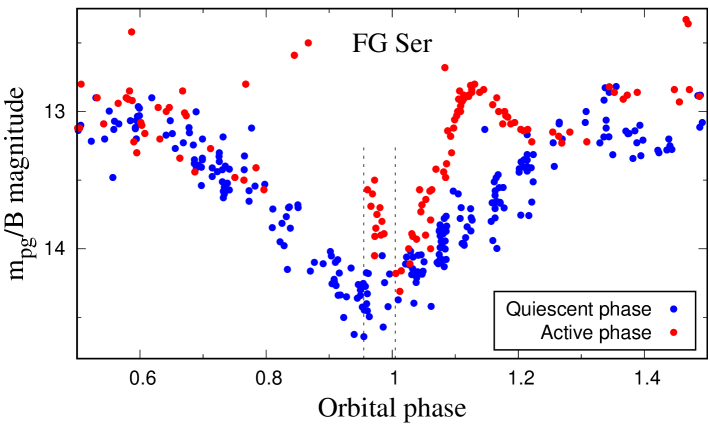
Variability of the symbiotic star FG Ser was discovered by Hoffmeister (1968). The star underwent an outburst in 1988 when its brightness increased by mag and peaked at on July 4, 1988 (Munari & Iijima, 1988). The next monitoring of the star’s brightness showed multiple maxima and minima - eclipses (see Munari et al., 1995, and Fig. 32 here). Using the timing of three eclipses observed during 1989 – 1993 the authors determined the eclipse ephemeris as .
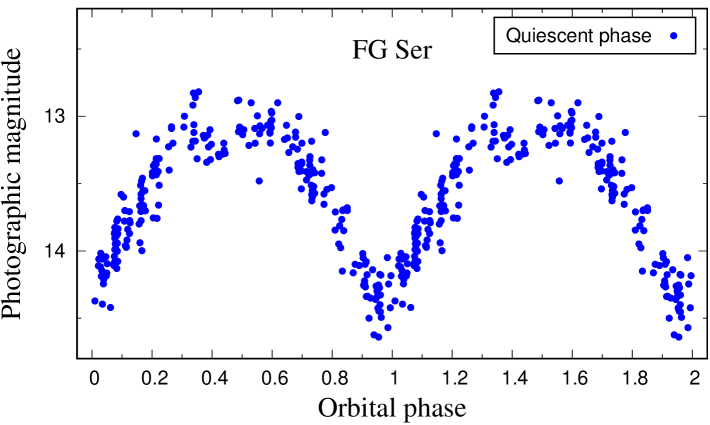
During the quiescent phase, prior to the 1988 outburst, Kurochkin (1993) determined the ephemeris for regular brightness variations (B = 13–14.5) to using the photographic plates from the Sternberg Astronomical Institute archive (SAI; 1949-1987). He also determined the ephemeris of the secondary minimum, which is observed at the phase with the depth of 0.5 mag. Using the same archive of photo-plates, but from 1901, the data of Munari et al. (1992, 1995) and new photometric observations, Shugarov et al. (2014) rectified the minima ephemeris to
| (3) |
For the purpose of this paper, we remeasured magnitudes of FG Ser on photographic plates of the SAI archive (1955–1995; 256 plates) and the Asiago archive (1968–1994; 41 plates). Our data are plotted together with those from literature in Fig. 32. During the quiescent phase (), their phase diagram with the ephemeris (3) shows typical wave-like orbitally-related variation with mag, broad minimum around the inferior conjunction of the giant and a shallow 0.3 mag deep secondary minimum at . During the active phase (1988-94), the minimum (eclipse) became narrower and shifted its position after that from the quiescent phase by (bottom right panel of the figure), which prolongs the minima separation during the transition from quiescence to activity and during the decline from the outburst. This effect of apparent changes of orbital periods in symbiotic binaries was revealed by Skopal (1998). Here, we indicated this effect also for AE Ara (see Sect. 3.3).
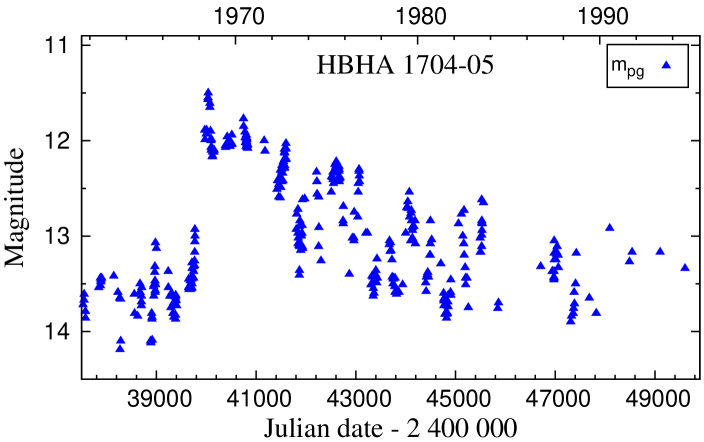

3.16 HBHA 1704-05
The star HBHA 1704-05 was originally classified as an emission-line star (Kohoutek & Wehmeyer, 1999). On the basis of The All Sky Automated Survey for SuperNovae (ASAS-SN), the object was catalogued in the VSX as a semi-regular variable with a periodicity around 418 days. On August 11, 2018, Munari et al. (2018) reported that HBHA 1704-05 is coincident with the star TCP J19544251+1722281 (ASASSN-V J195442.95+172212.6), which brightened from on July 31.945, 2018 to on August 8.938, 2018, showing characteristics of a symbiotic star in outburst.999 http://www.cbat.eps.harvard.edu/unconf/followups/J19544251+1722281.html In the spectrum, they found features of an M-type giant, a strong nebular continuum with superposed emission lines of highly ionized elements (e.g., He II 4686 Å and [Ne V] 3426 Å), confirming the nature of HBHA 1704-05 as a symbiotic star in outburst. Photometric and spectroscopic monitoring of HBHA 1704-05 during the first month of its outburst was presented by Skopal et al. (2019).
We started to monitor HBHA 1704-05 on August 12, 2018, just after the discovery of its outburst. To obtain absolute values of its magnitudes we used standard stars ’120’ and ’123’ as indicated on the AAVSO chart and the check star C = TYC 1620-2479 (). Using the standard stars , ”b”, ”c” in the field of PU Vul and ”a”, ”b”, ”c” in the field of HM Sge (see charts of Henden & Munari, 2006), we determined the magnitudes of the standard stars in the field of HBHA 1704-05. Resulting magnitudes represent mean values with errors obtained during 5 nights (see Table 1).
Our photometry of HBHA 1704-05 is depicted in Fig. 33. The right panel of the figure shows our multicolour CCD photometry during the current outburst. The LCs show a gradual decline, steepness of which depends on the colour. From the August’s 2018 maximum to our last measurements during February 2019, the star’s brightness decreased by 2.6, 2.0, 1.5, 1.1 and 0.6 mag in the , , , and filter, respectively. We also measured photographic magnitudes on the plates collected in the Moscow’s photographic plates archive of the Sternberg Astronomical Institute of Moscow State University. These measurements revealed another 2-mag outburst lasting from 1968 to 1975 (left panel of the figure). A detailed analysis of LCs together with spectroscopic observations of HBHA 1704-05 is planned for another publication.
4 Conclusions
In this paper, we present new multicolour long-term photometry of selected symbiotic stars. Main results of our monitoring program can be summarized as follows.
EG And persists in a quiescent phase. Our observations confirmed a double wave variation along the orbit in all LCs. We also detected several light variations, with the most significant period around 28 days in the LC.
Z And continues its active phase that started during September 2000. The amplitude of the brightness peaks, which appeared around was gradually decreasing from in November 2011, between February and May 2014 to mag in June 2016. The recent outburst began in October 2017, peaking at mag in April 2018. We also indicated a periodic light variation with a -day period, visible in our data.
AE Ara came to quiescent phase from around 2016. During its recent active phase, from 2006 to 2016, we indicated a period of 850–860 days, which is distinctive larger than its orbital period of days from light variations during preceding quiescence or days from radial velocities. Such an apparent change in the orbital period is caused by the change of the ionization structure of the binary during quiescent and active phase (see Skopal, 1998).
BF Cyg remains at a high level of activity since its major outburst in 2006. The overall star’s brightness was gradually declining until the eclipse position in 2014, when the trend turned into the opposite way, with the increasing delay of the minima position. During 2014, 2016 and 2018 the light minimum delayed by 14, 17 and 20 days after the inferior conjunction of the giant. The recent 2018-minimum () was followed by a mag brightening peaked at mag on .
CH Cyg continues its active phase showing extremely complex photometric variability. Its brightness was gradually increasing to 2015 when reached a maximum of mag. During the following descending part of the LCs CH Cyg underwent three bursts with a comparable amplitude of mag. During 2016, the light minima were shifted with increasing wavelength. Then CH Cyg reached its maximum at mag during the first half of 2018, being followed with a sharp minimim in May 2018 and continuing a mag decrease in by the end of 2018 (see Fig. 10).
CI Cyg experienced its last activity in the form of a double-peaked burst at the end of 2012. Then entered a quiescent phase showing pronounced orbitally-related light variation in the LCs. The recent broad minima in 2015 and 2017 differ in their position and profile for different colours. Secondary minima around 0.6 are present in LCs. A days light variation can be recognized in the LC (see Figs. 12 and 11).
V1016 Cyg continued a slow brightness decline in LCs by a few times 0.1 mag during our observing period (from March 2016), whereas the LC reflects pulsations of the Mira-type giant with 0.7 mag. A sudden drop in the magnitude by mag was measured around 2015.4 (see Fig. 15), confirming the previous finding by Arkhipova et al. (2016a, b). A decrease in the and colours (Fig. 16) can be in part caused by the overall star’s brightness decline and a flux decrease of strong emission lines contributing to and passbands.
V1329 Cyg persists in quiescent phase showing well pronounced orbitally-related light variation with a decreasing amplitude at longer wavelengths. Their minima precede the inferior conjunction of the giant by (Fig. 17).
AG Dra continued its quasi-quiescent phase, during which the wave-like variability is occasionally interrupted by short-lasting (3 months) bursts with mag. Bright bursts usually show a multi-peaked structure (see Figs. 18 and 19). We noticed a rather constant colour during the last 2006-08 major outburst, while the index does not show such feature. Similar plateau in the LC was probably present also during the 1980-82 and 1994-95 major outbursts (see Fig. 20).
RS Oph persists at the stage between its recurrent outbursts. The LCs from the last 2006 eruption to the present suggest a smooth variation with the amplitude mag and a period of 9.4 years (Fig. 21). Rapid variability is detected in all filters. High-cadence measurements in demonstrates a stochastic variability with mag on the time-scale of hours and mag on the time-scale of minutes (Fig. 22).
AR Pav reduced its out-of-eclipse activity from around 2004, showing only two mag brightenings in 2013 and 2014 (Fig. 23). We determined positions of new minima from the epoch 71 to 78. All the available minima (1896.3 – 2018.8, Table2) determine the linear ephemeris, . The corresponding diagram indicates real systematic variation in the minima timing (Fig. 25).
AG Peg underwent its first Z And-type outburst in June 2015, after 165 years from its nova-like outburst in 1850 (Fig. 26). This change indicates the beginning of a new era in the AG Peg evolution. After about 1 year AG Peg came to a quiescent phase.
AX Per persists in a low-level active stage from about 2007. The LC profile varies from cycle to cycle and depends on the colour. For example, in 2016, the maximum in preceded those in other filters by days, while in 2017, maxima in and occurred at the same time, around . The LC shows secondary minima around .
FG Ser was in quiescent phase from 1901 to 1987 as documented by re-measuring its archival photographic measurements. We determined a new ephemeris for its minima times, . During the active phase (1988-94), the minimum (eclipse) occurred by after the minima positions from quiescence.
HBHA 1704-05 is the newly (August 9, 2018) discovered symbiotic star in outburst. Our photometry shows that the current outburst is of Z And-type. By inspection of the Moscow’s archive of photographic plates, we revealed another 2-mag-outburst of HBHA 1704-05 in 1968.
Acknowledgements.
We thank the anonymous referee for constructive comments. Evgeni Kolotilov, Kirill Sokolovsky and Alexandra Zubareva are thanked for their assistance in acquisition of some data from the Moscow’s photographic plates archive. Alisa Shchurova is thanked for her assistance in carrying out some CCD observations in the G2 pavilion within her PhD study. This work was supported by the Slovak Academy of Sciences grant VEGA No. 2/0008/17, by the Slovak Research and Development Agency under the contract No. APVV-15-0458 and by the Bulgarian Scientific Research Fund of the Ministry of Education and Science under the grants DN 08-1/2016 and DN 18-13/2017. Sergey Shugarov acknowledges the support from the Program of development of M.V. Lomonosov Moscow State University (Leading Scientific School ’Physics of stars, relativistic objects and galaxies’). We also acknowledge with thanks the variable star observations from the AAVSO International Database contributed by observers worldwide and used in this research.References
- Aaronson et al. (1982) Aaronson, M., Liebert, J., & Stocke, J., Discovery of carbon stars in the Draco dwarf spheroidal galaxy. 1982, ApJ, 254, 507, DOI: 10.1086/159760
- Adamakis et al. (2011) Adamakis, S., Eyres, S. P. S., Sarkar, A., & Walsh, R. W., A pre-outburst signal in the long-term optical light curve of the recurrent nova RS Ophiuchi. 2011, MNRAS, 414, 2195, DOI: 10.1111/j.1365-2966.2011.18536.x
- Allen & Glass (1974) Allen, D. A. & Glass, I. S., Infrared photometry of southern emission-line stars. 1974, MNRAS, 167, 337, DOI: 10.1093/mnras/167.2.337
- Andrews (1974) Andrews, P. J., Photometry of the eclipsing system AR Pavonis. 1974, MNRAS, 167, 635, DOI: 10.1093/mnras/167.3.635
- Arhipova & Mandel (1973) Arhipova, V. P. & Mandel, O. E., On the Photometric History of V1329 Cygni = HBV 475. 1973, Information Bulletin on Variable Stars, 762
- Arkhipova et al. (2008) Arkhipova, V. P., Esipov, V. F., Ikonnikova, N. P., & Komissarova, G. V., Photometric and spectroscopic evolution of the symbiotic nova V1016 Cygni after its outburst. 2008, Astronomy Letters, 34, 474, DOI: 10.1134/S1063773708070062
- Arkhipova et al. (2015) Arkhipova, V. P., Taranova, O. G., Ikonnikova, N. P., et al., Symbiotic nova V1016 Cygni: Evolution of the dust envelope and the gaseous nebula. 2015, Astronomy Letters, 41, 613, DOI: 10.1134/S1063773715110018
- Arkhipova et al. (2016a) Arkhipova, V. P., Taranova, O. G., Ikonnikova, N. P., et al., Half a century after the outburst of the symbiotic nova V1016 Cyg. 2016a, Baltic Astronomy, 25, 35
- Arkhipova et al. (2016b) Arkhipova, V. P., Taranova, O. G., Ikonnikova, N. P., et al., VizieR Online Data Catalog: V1016 Cyg light curves and spectroscopy (Arkhipova+, 2015). 2016b, VizieR Online Data Catalog, 904
- Bacher et al. (2005) Bacher, A., Kimeswenger, S., & Teutsch, P., Photometry from online Digitized Sky Survey plates. 2005, MNRAS, 362, 542, DOI: 10.1111/j.1365-2966.2005.09329.x
- Belczyński et al. (2000) Belczyński, K., Mikołajewska, J., Munari, U., Ivison, R. J., & Friedjung, M., A catalogue of symbiotic stars. 2000, A&AS, 146, 407, DOI: 10.1051/aas:2000280
- Belyakina (1970) Belyakina, T. S., The light variations of AG Peg from 1962 to 1967. 1970, Astrofizika, 6, 49
- Belyakina (1991) Belyakina, T. S., The symbiotic eclipsing variable CI cyg. Results of UBV and UBVRI photometric observations in 1973-1988. 1991, Bulletin Crimean Astrophysical Observatory, 83, 104
- Biller et al. (2006) Biller, B. A., Close, L. M., Li, A., et al., Resolving the Dusty Circumstellar Structure of the Enigmatic Symbiotic Star CH Cygni with the MMT Adaptive Optics System. 2006, ApJ, 647, 464, DOI: 10.1086/505194
- Bogdanov & Taranova (2008) Bogdanov, M. B. & Taranova, O. G., Variations of the parameters of the dust envelope of the symbiotic star CH Cygni. 2008, Astronomy Reports, 52, 403, DOI: 10.1134/S1063772908050065
- Bondar’ & Prokof’Eva (2006) Bondar’, N. I. & Prokof’Eva, V. V., Nonradial pulsations of the hot component of the symbiotic star CH Cyg during its active phase. 2006, Astronomy Reports, 50, 43, DOI: 10.1134/S1063772906010057
- Boyarchuk (1967) Boyarchuk, A. A., The Nature of AG Pegasi. 1967, Soviet Ast., 11, 8
- Boyarchuk et al. (1966) Boyarchuk, A. A., Esipov, V. F., & Moroz, V. I., The Continuous Spectrum of AG Pegasi. 1966, Soviet Ast., 10, 331
- Brandi et al. (2005) Brandi, E., Mikołajewska, J., Quiroga, C., et al., The spectroscopic orbits and other parameters of the symbiotic binary FN Sgr. 2005, A&A, 440, 239, DOI: 10.1051/0004-6361:20042552
- Brandi et al. (2009) Brandi, E., Quiroga, C., Mikołajewska, J., Ferrer, O. E., & García, L. G., Spectroscopic orbits and variations of RS Ophiuchi. 2009, A&A, 497, 815, DOI: 10.1051/0004-6361/200811417
- Bruch (1986) Bruch, A., Optical observations of RS Ophiuchi in quiescence. 1986, A&A, 167, 91
- Bruch et al. (1994) Bruch, A., Niehues, M., & Jones, A. F., The variable light curve of the eclipsing symbiotic star AR Pavonis. 1994, A&A, 287, 829
- Cariková & Skopal (2012) Cariková, Z. & Skopal, A., Ionization structure of hot components in symbiotic binaries during active phases. 2012, A&A, 548, A21, DOI: 10.1051/0004-6361/201219221
- Corradi et al. (2001) Corradi, R. L. M., Munari, U., Livio, M., et al., The Large-Scale Ionized Outflow of CH Cygni. 2001, ApJ, 560, 912, DOI: 10.1086/323062
- Crowley (2006) Crowley, C. 2006, Red Giant Mass-Loss: Studying Evolved Stellar Winds with FUSE and HST/STIS, PhD thesis, School of Physics, Trinity College Dublin, Dublin 2, Ireland Ireland
- Esipov et al. (2000) Esipov, V. F., Kolotilov, E. A., Mikolajewska, J., et al., Evolution of the Symbiotic Star AS338 after Its Strong Outburst in 1983. 2000, Astronomy Letters, 26, 162, DOI: 10.1134/1.20379
- Fekel et al. (2000a) Fekel, F. C., Hinkle, K. H., Joyce, R. R., & Skrutskie, M. F., Infrared Spectroscopy of Symbiotic Stars. II. Orbits for Five S-Type Systems with Two-Year Periods. 2000a, AJ, 120, 3255, DOI: 10.1086/316872
- Fekel et al. (2001) Fekel, F. C., Hinkle, K. H., Joyce, R. R., & Skrutskie, M. F., Infrared Spectroscopy of Symbiotic Stars. III. First Orbits for Three S-Type Systems. 2001, AJ, 121, 2219, DOI: 10.1086/319966
- Fekel et al. (2010) Fekel, F. C., Hinkle, K. H., Joyce, R. R., & Wood, P. R., Infrared Spectroscopy of Symbiotic Stars. VIII. Orbits for Three S-Type Systems: AE Arae, Y Coronae Australis, and SS 73-147. 2010, AJ, 139, 1315, DOI: 10.1088/0004-6256/139/4/1315
- Fekel et al. (2000b) Fekel, F. C., Joyce, R. R., Hinkle, K. H., & Skrutskie, M. F., Infrared Spectroscopy of Symbiotic Stars. I. Orbits for Well-Known S-Type Systems. 2000b, AJ, 119, 1375, DOI: 10.1086/301260
- Fernandez-Castro et al. (1995) Fernandez-Castro, T., Gonzalez-Riestra, R., Cassatella, A., Taylor, A. R., & Seaquist, E. R., The active phase of the hot component of Z Andromedae. 1995, ApJ, 442, 366, DOI: 10.1086/175446
- Formiggini & Leibowitz (2012) Formiggini, L. & Leibowitz, E. M., The historical light curve of the symbiotic star AG Draconis: intense, magnetically induced cyclic activity. 2012, MNRAS, 422, 2648, DOI: 10.1111/j.1365-2966.2012.20829.x
- Gális et al. (1999) Gális, R., Hric, L., Friedjung, M., & Petrík, K., Resonances as the general cause of the outbursts in the symbiotic system AG Draconis. 1999, A&A, 348, 533
- González-Riestra et al. (2013) González-Riestra, R., Selvelli, P., & Cassatella, A., XMM-Newton observations of RR Telescopii: evidence for wind signatures and shocked gas emission. 2013, A&A, 556, A85, DOI: 10.1051/0004-6361/201321358
- González-Riestra et al. (1999) González-Riestra, R., Viotti, R., Iijima, T., & Greiner, J., IUE observations of the high-velocity symbiotic star AG Draconis. III. A compendium of 17 years of UV monitoring, and comparison with optical and X-ray observations. 1999, A&A, 347, 478
- Grygar et al. (1979) Grygar, J., Hric, L., Chochol, D., & Mammano, A., The Symbiotic Variable V 1329 Cygni (= HBV 475)- a Decade After Its Discovery. 1979, Bulletin of the Astronomical Institutes of Czechoslovakia, 30, 308
- Hachisu et al. (2008) Hachisu, I., Kato, M., Kiyota, S., et al., Optical Light Curves of RS Oph (2006) and Hydrogen Burning Turnoff. 2008, in Astronomical Society of the Pacific Conference Series, Vol. 401, RS Ophiuchi (2006) and the Recurrent Nova Phenomenon, ed. A. Evans, M. F. Bode, T. J. O’Brien, & M. J. Darnley, 206
- Harvey (1974) Harvey, P. M., Infrared variability of V1016 Cygni. 1974, ApJ, 188, 95, DOI: 10.1086/152689
- Henden & Munari (2000) Henden, A. & Munari, U., UBV(RI)_C photometric comparison sequences for symbiotic stars. 2000, A&AS, 143, 343, DOI: 10.1051/aas:2000183
- Henden & Munari (2006) Henden, A. & Munari, U., UBV(RI)C photometric sequences for symbiotic stars. III. 2006, A&A, 458, 339, DOI: 10.1051/0004-6361:20065662
- Henden & Munari (2008) Henden, A. & Munari, U., Multi-Epoch UBVRcIc Photometric Catalog of Symbiotic Stars. 2008, Baltic Astronomy, 17, 293
- Hinkle et al. (2009) Hinkle, K. H., Fekel, F. C., & Joyce, R. R., Infrared Spectroscopy of Symbiotic Stars. VII. Binary Orbit and Long Secondary Period Variability of CH Cygni. 2009, ApJ, 692, 1360, DOI: 10.1088/0004-637X/692/2/1360
- Hoffmeister (1968) Hoffmeister, C., Mitteilungen über neuentdeckte Veränderliche Sterne (S 10153- S 10375). 1968, Astronomische Nachrichten, 290, 277, DOI: 10.1002/asna.19672900512
- Hric et al. (2014) Hric, L., Gális, R., Leedjärv, L., Burmeister, M., & Kundra, E., Outburst activity of the symbiotic system AG Dra. 2014, MNRAS, 443, 1103, DOI: 10.1093/mnras/stu1162
- Hric & Skopal (1989) Hric, L. & Skopal, A., Call for a Campaign of Long-Term Photometry of Symbiotic Stars. 1989, Information Bulletin on Variable Stars, 3364
- Iijima (1998) Iijima, T., Eclipsing phenomena of the symbiotic star CH Cygni. 1998, MNRAS, 297, 77, DOI: 10.1046/j.1365-8711.1998.01452.x
- Iijima (2006) Iijima, T., BF Cygni. 2006, Central Bureau Electronic Telegrams, 633
- Iijima (2017) Iijima, T., A New Active Stage of the Symbiotic Star CH Cygni. 2017, The Astronomer’s Telegram, 10142
- Jacchia (1941) Jacchia, L., Notes on Variable Stars. ;. 1941, Harvard College Observatory Bulletin, 915, 17
- Jurdana-Šepić & Munari (2010) Jurdana-Šepić, R. & Munari, U., Symbiotic Stars on Asiago Archive Plates. 2010, PASP, 122, 35, DOI: 10.1086/650319
- Karovska et al. (2010) Karovska, M., Gaetz, T. J., Carilli, C. L., et al., A Precessing Jet in the CH Cyg Symbiotic System. 2010, ApJ, 710, L132, DOI: 10.1088/2041-8205/710/2/L132
- Kenyon (1986) Kenyon, S. J. 1986, The symbiotic stars (Cambridge: Cambridge University Press)
- Kenyon & Fernandez-Castro (1987) Kenyon, S. J. & Fernandez-Castro, T., The cool components of symbiotic stars. I - Optical spectral types. 1987, AJ, 93, 938, DOI: 10.1086/114379
- Kenyon & Garcia (2016) Kenyon, S. J. & Garcia, M. R., EG Andromedae: A New Orbit and Additional Evidence for a Photoionized Wind. 2016, AJ, 152, 1, DOI: 10.3847/0004-6256/152/1/1
- Kenyon et al. (1993) Kenyon, S. J., Mikolajewska, J., Mikolajewski, M., Polidan, R. S., & Slovak, M. H., Evolution of the symbiotic binary system AG Pegasi - The slowest classical nova eruption ever recorded. 1993, AJ, 106, 1573, DOI: 10.1086/116749
- Kenyon et al. (2001) Kenyon, S. J., Proga, D., & Keyes, C. D., The Continuing Slow Decline of AG Pegasi. 2001, AJ, 122, 349, DOI: 10.1086/321107
- Kenyon & Webbink (1984) Kenyon, S. J. & Webbink, R. F., The nature of symbiotic stars. 1984, ApJ, 279, 252, DOI: 10.1086/161888
- Kinemuchi et al. (2008) Kinemuchi, K., Harris, H. C., Smith, H. A., et al., The Variable Stars of the Draco Dwarf Spheroidal Galaxy: Revisited. 2008, AJ, 136, 1921, DOI: 10.1088/0004-6256/136/5/1921
- Kohoutek (1969) Kohoutek, L., HBV475: a New Peculiar Emission Object in Cygnus. 1969, Information Bulletin on Variable Stars, 384
- Kohoutek & Wehmeyer (1999) Kohoutek, L. & Wehmeyer, R., Catalogue of H-alpha emission stars in the Northern Milky Way. 1999, A&AS, 134, 255, DOI: 10.1051/aas:1999101
- Kondratyeva et al. (2017) Kondratyeva, L. N., Rspaev, F. K., Krugov, M. A., & Serebryanskiy, A. V., Active Stage of the Object CH Cyg B in 2014-2015. 2017, Astrophysics, 60, 153, DOI: 10.1007/s10511-017-9471-z
- Kurochkin (1993) Kurochkin, N. E., A new type of cataclysmic variability: FG serpentis and QW sagittae. 1993, Astronomical and Astrophysical Transactions, 3, 295, DOI: 10.1080/10556799308230567
- Leedjärv et al. (2016) Leedjärv, L., Gális, R., Hric, L., Merc, J., & Burmeister, M., Spectroscopic view on the outburst activity of the symbiotic binary AG Draconis. 2016, MNRAS, 456, 2558, DOI: 10.1093/mnras/stv2807
- Leibowitz & Formiggini (2006) Leibowitz, E. M. & Formiggini, L., Multiperiodic variations in the last 104-yr light curve of the symbiotic star BF Cyg. 2006, MNRAS, 366, 675, DOI: 10.1111/j.1365-2966.2005.09895.x
- Leibowitz & Formiggini (2008) Leibowitz, E. M. & Formiggini, L., Activity cycle of the giant star of Z Andromedae and its spin period. 2008, MNRAS, 385, 445, DOI: 10.1111/j.1365-2966.2008.12847.x
- Lundmark (1921) Lundmark, K., Ein neuer Veränderlicher vom P Cygni-Typus. 1921, Astronomische Nachrichten, 213, 93, DOI: 10.1002/asna.19212130604
- Matthews & Karovska (2006) Matthews, L. D. & Karovska, M., First Resolved Images of the Mira AB Symbiotic Binary at Centimeter Wavelengths. 2006, ApJ, 637, L49, DOI: 10.1086/500303
- Mayall & Shapley (1937) Mayall, M. W. & Shapley, H., A new eclipsing star of unusual character. 1937, Annals of Harvard College Observatory, 105, 491
- McCuskey (1965) McCuskey, S., Activity in H emission object. 1965, IAU Circ., 1916
- McKeever et al. (2011) McKeever, J., Lutz, J., Wallerstein, G., Munari, U., & Siviero, A., High-Dispersion Spectroscopy of BF Cygni at the Beginning of the 2006 Outburst. 2011, PASP, 123, 1062, DOI: 10.1086/662076
- Meinunger (1979) Meinunger, L., Discovery of a Period in the Symbiotic Star AG Draconis. 1979, Information Bulletin on Variable Stars, 1611
- Mikayilov et al. (2017) Mikayilov, K. M., Rustamov, B. N., Alakbarov, I. A., & Rustamova, A. B., Rapid Spectral Variability of the Symbiotic Star CH Cyg During One Night. 2017, in Astronomical Society of the Pacific Conference Series, Vol. 510, Stars: From Collapse to Collapse, ed. Y. Y. Balega, D. O. Kudryavtsev, I. I. Romanyuk, & I. A. Yakunin, 170
- Mikolajewska & Kenyon (1992) Mikolajewska, J. & Kenyon, S. J., On the nature of the symbiotic binary AX Persei. 1992, AJ, 103, 579, DOI: 10.1086/116085
- Mikołajewska et al. (2003) Mikołajewska, J., Quiroga, C., Brandi, E., et al., The Spectroscopic Orbit and Other Parameters of AE Arae. 2003, in Astronomical Society of the Pacific Conference Series, Vol. 303, Symbiotic Stars Probing Stellar Evolution, ed. R. L. M. Corradi, J. Mikolajewska, & T. J. Mahoney, 147
- Mikolajewska et al. (1988) Mikolajewska, J., Selvelli, P. L., & Hack, M., IUE low resolution observations of the symbiotic star CH Cygni in 1979-1986. 1988, A&A, 198, 150
- Motta & Motta (2000) Motta, M. E. & Motta, A., Ultra-Short Variability in CH Cygni. 2000, Journal of the American Association of Variable Star Observers (JAAVSO), 28, 106
- Muerset et al. (1991) Muerset, U., Nussbaumer, H., Schmid, H. M., & Vogel, M., Temperature and luminosity of hot components in symbiotic stars. 1991, A&A, 248, 458
- Mukai et al. (2009) Mukai, K., Kennea, J. A., Luna, G. J. M., & Sokoloski, J. L., Increased X-ray Activities of the Symbiotic Star, CH Cygni. 2009, The Astronomer’s Telegram, 2245
- Munari (1991) Munari, U., BVI Photometry of the Symbiotic Star C-1 in the Draco Dwarf Galaxy. 1991, Information Bulletin on Variable Stars, 3605
- Munari et al. (2018) Munari, U., Dallaporta, S., Valisa, P., et al., HBHa 1704-05: a bright and newly discovered symbiotic star, currently undergoing an “hot-type” outburst. 2018, The Astronomer’s Telegram, 11937
- Munari & Iijima (1988) Munari, U. & Iijima, T., AS 296. 1988, IAU Circ., 4622
- Munari et al. (2015) Munari, U., Maitan, A., Moretti, S., & Tomaselli, S., 500 days of Stromgren b, y and narrow-band [OIII], H photometric evolution of gamma-ray Nova Del 2013 (=V339 Del). 2015, New A, 40, 28, DOI: 10.1016/j.newast.2015.03.008
- Munari et al. (2010) Munari, U., Siviero, A., Corradi, R. L. M., et al., AX Persei. 2010, Central Bureau Electronic Telegrams, 2555
- Munari et al. (2009a) Munari, U., Siviero, A., Dallaporta, S., et al., AX Persei. 2009a, Central Bureau Electronic Telegrams, 1757
- Munari et al. (2006) Munari, U., Siviero, A., Moretti, S., et al., BF Cygni. 2006, Central Bureau Electronic Telegrams, 596
- Munari et al. (2008) Munari, U., Siviero, A., Ochner, P., et al., Long term BVRCIC photometry of carbon and symbiotic stars in the Draco dwarf galaxy. 2008, Information Bulletin on Variable Stars, 5855
- Munari et al. (2009b) Munari, U., Siviero, A., Ochner, P., et al., The 2006-2008 Outburst of AG Draconis. 2009b, PASP, 121, 1070, DOI: 10.1086/606169
- Munari et al. (1992) Munari, U., Whitelock, P. A., Gilmore, A. C., et al., The ongoing outburst of the eclipsing symbiotic nova AS 296 - The first 1200 days. 1992, AJ, 104, 262, DOI: 10.1086/116238
- Munari et al. (1995) Munari, U., Yudin, B. F., Kolotilov, E. A., & Gilmore, A. C., The ongoing outburst of the eclipsing symbiotic nova AS 296 = FG SER. 2: UBV-JHKL photometry over days 1200-2300. 1995, AJ, 109, 1740, DOI: 10.1086/117403
- Mürset & Schmid (1999) Mürset, U. & Schmid, H. M., Spectral classification of the cool giants in symbiotic systems. 1999, A&AS, 137, 473, DOI: 10.1051/aas:1999105
- Myalkovskij (1977) Myalkovskij, M. I., Observations of three symbiotic stars: Z Andromedae, AX Persei, and CI Cygni. 1977, Peremennye Zvezdy Prilozhenie, 3, 71
- Nussbaumer & Vogel (1987) Nussbaumer, H. & Vogel, M., A new approach to symbiotic stars. 1987, A&A, 182, 51
- Nussbaumer & Vogel (1989) Nussbaumer, H. & Vogel, M., Z Andromedae and the symbiotic phenomenon. 1989, A&A, 213, 137
- Oliversen et al. (1985) Oliversen, N. A., Anderson, C. M., Stencel, R. E., & Slovak, M. H., Observational studies of the symbiotic stars. III High-dispersion IUE and H-alpha observations of EG Andromedae. 1985, ApJ, 295, 620, DOI: 10.1086/163404
- Oppenheimer & Mattei (1993) Oppenheimer, B. & Mattei, J. A., An Analysis of Longterm AAVSO Observations of the Recurrent Nova RS Ophiuchi. 1993, in Bulletin of the American Astronomical Society, Vol. 25, American Astronomical Society Meeting Abstracts, 1378
- Parimucha et al. (2000) Parimucha, S., Arkhipova, V. P., Chochol, D., et al., Long-term photometry of the symbiotic nova V1016 Cyg. 2000, Contributions of the Astronomical Observatory Skalnate Pleso, 30, 99
- Parimucha et al. (2002) Parimucha, Š., Chochol, D., Pribulla, T., Buson, L. M., & Vittone, A. A., Multiwavelength evidence for a 15-year periodic activity in the symbiotic nova V1016 Cygni. 2002, A&A, 391, 999, DOI: 10.1051/0004-6361:20020847
- Pedretti et al. (2009) Pedretti, E., Monnier, J. D., Lacour, S., et al., Detection of non-radial pulsation and faint companion in the symbiotic star CH Cyg. 2009, MNRAS, 397, 325, DOI: 10.1111/j.1365-2966.2009.14906.x
- Percy et al. (2001) Percy, J. R., Wilson, J. B., & Henry, G. W., Long-Term VRI Photometry of Small-Amplitude Red Variables. I. Light Curves and Periods. 2001, PASP, 113, 983, DOI: 10.1086/322153
- Pojmanski (2002) Pojmanski, G., The All Sky Automated Survey. Catalog of Variable Stars. I. 0 h - 6 hQuarter of the Southern Hemisphere. 2002, Acta Astron., 52, 397
- Pucinskas (1970) Pucinskas, A., On some periodicity phenomena in symbiotic stars. 1970, Vilnius Astronomijos Observatorijos Biuletenis, 27, 24
- Ramsay et al. (2016) Ramsay, G., Sokoloski, J. L., Luna, G. J. M., & Nuñez, N. E., Swift observations of the 2015 outburst of AG Peg - from slow nova to classical symbiotic outburst. 2016, MNRAS, 461, 3599, DOI: 10.1093/mnras/stw1546
- Schaefer (2004) Schaefer, B. E., RS Ophiuchi. 2004, IAU Circ., 8396
- Schild et al. (1992) Schild, H., Boyle, S. J., & Schmid, H. M., Infrared spectroscopy of symbiotic stars - Carbon abundances and C-12/C-13 isotopic ratios. 1992, MNRAS, 258, 95, DOI: 10.1093/mnras/258.1.95
- Schild et al. (2001) Schild, H., Dumm, T., Mürset, U., et al., High resolution spectroscopy of symbiotic stars. VI. Orbital and stellar parameters for AR Pavonis. 2001, A&A, 366, 972, DOI: 10.1051/0004-6361:20000338
- Schild & Schmid (1997) Schild, H. & Schmid, H. M., Spectropolarimetry and nebular geometry of the symbiotic star HBV 475. 1997, A&A, 324, 606
- Schmid & Schild (1997) Schmid, H. M. & Schild, H., Spectropolarimetry of symbiotic stars: AG Draconis. 1997, A&A, 321, 791
- Seaquist et al. (1984) Seaquist, E. R., Taylor, A. R., & Button, S., A radio survey of symbiotic stars. 1984, ApJ, 284, 202, DOI: 10.1086/162399
- Shugarov et al. (2012) Shugarov, S., Kolotilov, E., Komissarova, G., Skopal, A., & Zemko, P., Photometric Activity of the Symbiotic Star CH Cyg during 2008–2011. 2012, Baltic Astronomy, 21, 184, DOI: 10.1515/astro-2017-0375
- Shugarov et al. (2014) Shugarov, S., Kolotilov, E., & Sokolovsky, K., Improvement of the orbital period of the symbiotic binary FG Ser by using archival photographic and new photoelectric observations. 2014, in Astroplate 2014, 115–118
- Shugarov et al. (2015) Shugarov, S., Skopal, A., Sekeráš, M., Komissarova, G., & Wolf, M., Rapid Photometric Variability Of The Symbiotic System CH Cyg During 2008-15. 2015, in EAS Publications Series, Vol. 71, EAS Publications Series, 107–108
- Siviero et al. (2009) Siviero, A., Munari, U., Dallaporta, S., et al., The ongoing 2008-09 outburst of CI Cyg. 2009, MNRAS, 399, 2139, DOI: 10.1111/j.1365-2966.2009.15414.x
- Skopal (1991) Skopal, A., New Ephemeris of the Eclipsing Symbiotic Star AX Per. 1991, Information Bulletin on Variable Stars, 3603
- Skopal (1997) Skopal, A., Is the symbiotic binary EG And an eclipsing system? 1997, A&A, 318, 53
- Skopal (1998) Skopal, A., On the nature of apparent changes of the orbital period in symbiotic binaries. 1998, A&A, 338, 599
- Skopal (2001) Skopal, A., What mimics the reflection effect in symbiotic binaries? 2001, A&A, 366, 157, DOI: 10.1051/0004-6361:20000217
- Skopal (2005) Skopal, A., Disentangling the composite continuum of symbiotic binaries. I. S-type systems. 2005, A&A, 440, 995, DOI: 10.1051/0004-6361:20034262
- Skopal (2006) Skopal, A., Broad H wings from the optically thin stellar wind of the hot components in symbiotic binaries. 2006, A&A, 457, 1003, DOI: 10.1051/0004-6361:20064935
- Skopal (2008) Skopal, A., How to Understand the Light Curves of Symbiotic Stars. 2008, Journal of the American Association of Variable Star Observers (JAAVSO), 36, 9
- Skopal et al. (2002) Skopal, A., Bode, M. F., Crocker, M. M., et al., The symbiotic star CH Cygni - IV. Basic kinematics of the circumstellar matter during active phases. 2002, MNRAS, 335, 1109, DOI: 10.1046/j.1365-8711.2002.05715.x
- Skopal et al. (1996) Skopal, A., Bode, M. F., Lloyd, H. M., & Tamura, S., Eclipses in the symbiotic system CH CYG. 1996, A&A, 308, L9
- Skopal et al. (2000a) Skopal, A., Chochol, D., Pribulla, T., & Vanko, M., UBV Photometry of the Symbiotic Star Z And During its 2000 Outburst. 2000a, Information Bulletin on Variable Stars, 5005
- Skopal et al. (2000b) Skopal, A., Djurašević, G., Jones, A., et al., A photometric study of the eclipsing symbiotic binary ARPavonis. 2000b, MNRAS, 311, 225, DOI: 10.1046/j.1365-8711.2000.03040.x
- Skopal et al. (2001a) Skopal, A., Kohoutek, L., Jones, A., & Drechsel, H., The historical, 1889-2002, light curve of the eclipsing symbiotic binary AR Pav. 2001a, Information Bulletin on Variable Stars, 5195
- Skopal & Pribulla (2006) Skopal, A. & Pribulla, T., The first detection of the bipolar jets from the symbiotic prototype Z And. 2006, The Astronomer’s Telegram, 882
- Skopal et al. (2004) Skopal, A., Pribulla, T., Vaňko, M., et al., Photometry of symbiotic stars. XI. EG And, Z And, BF Cyg, CH Cyg, CI Cyg, V1329 Cyg, TX CVn, AG Dra, RW Hya, AR Pav, AG Peg, AX Per, QW Sge, IV Vir and the LMXB V934 Her. 2004, Contributions of the Astronomical Observatory Skalnate Pleso, 34, 45
- Skopal et al. (2017a) Skopal, A., Sekeras, M., Shugarov, S., & Shagatova, N., New burst of the active symbiotic star BF Cyg at the beginning of 2017. 2017a, The Astronomer’s Telegram, 10086
- Skopal et al. (2009) Skopal, A., Sekeráš, M., González-Riestra, R., & Viotti, R. F., The origin of the supersoft X-ray-optical/UV flux anticorrelation in the symbiotic binary AG Draconis. 2009, A&A, 507, 1531, DOI: 10.1051/0004-6361/200811418
- Skopal et al. (2019) Skopal, A., Sekeráš, M., Kundra, E., et al., First glance to the recently discovered symbiotic star HBHA 1704-05 during its current outburst. 2019, \caos, 49, 1
- Skopal et al. (2010) Skopal, A., Shugarov, S., & Chochol, D., Recent optical burst of the symbiotic star CH Cygni. 2010, The Astronomer’s Telegram, 2394
- Skopal et al. (2012) Skopal, A., Shugarov, S., Vaňko, M., et al., Recent photometry of symbiotic stars. 2012, Astronomische Nachrichten, 333, 242, DOI: 10.1002/asna.201111655
- Skopal et al. (2017b) Skopal, A., Shugarov, S. Y., Sekeráš, M., et al., New outburst of the symbiotic nova AG Pegasi after 165 yr. 2017b, A&A, 604, A48, DOI: 10.1051/0004-6361/201629593
- Skopal et al. (2011) Skopal, A., Tarasova, T. N., Cariková, Z., et al., Formation of a disk structure in the symbiotic binary AX Persei during its 2007-10 precursor-type activity. 2011, A&A, 536, A27, DOI: 10.1051/0004-6361/201116969
- Skopal et al. (2018) Skopal, A., Tarasova, T. N., Wolf, M., Dubovský, P. A., & Kudzej, I., Repeated Transient Jets from a Warped Disk in the Symbiotic Prototype Z And: A Link to the Long-lasting Active Phase. 2018, ApJ, 858, 120, DOI: 10.3847/1538-4357/aabc11
- Skopal et al. (2001b) Skopal, A., Teodorani, M., Errico, L., et al., A photometric and spectroscopic study of the eclipsing symbiotic binary AX Persei. 2001b, A&A, 367, 199, DOI: 10.1051/0004-6361:20000413
- Skopal et al. (2007) Skopal, A., Vaňko, M., Pribulla, T., et al., Recent photometry of symbiotic stars. 2007, Astronomische Nachrichten, 328, 909, DOI: 10.1002/asna.200710822
- Skopal et al. (1997) Skopal, A., Vittone, A., Errico, L., et al., A photometric and spectroscopic study of the symbiotic binary BF CYG. 1997, MNRAS, 292, 703, DOI: 10.1093/mnras/292.3.703
- Sokoloski & Kenyon (2003) Sokoloski, J. L. & Kenyon, S. J., CH Cygni. I. Observational Evidence for a Disk-Jet Connection. 2003, ApJ, 584, 1021, DOI: 10.1086/345901
- Sokoloski et al. (2010) Sokoloski, J. L., Zamanov, R., Stoyanov, K., Bryson, S., & Still, M., Cessation of optical flickering from the symbiotic star CH Cygni. 2010, The Astronomer’s Telegram, 2707
- Sokolovsky et al. (2016) Sokolovsky, K. V., Kolesnikova, D. M., Zubareva, A. M., Samus, N. N., & Antipin, S. V., Variable stars identification in digitized photographic data. 2016, arXiv e-prints [[arXiv]1605.03571]
- Stienon et al. (1974) Stienon, F. M., Chartrand, III, M. R., & Shao, C. Y., The emission-line variable HBV 475. 1974, AJ, 79, 47, DOI: 10.1086/111529
- Stoyanov et al. (2012) Stoyanov, K., Zamanov, R., & Sokoloski, J. L., Optical flickering from the symbiotic star CH Cygni is still missing. 2012, The Astronomer’s Telegram, 4316
- Stoyanov et al. (2018) Stoyanov, K. A., Martí, J., Zamanov, R., et al., Optical flickering of the symbiotic star CH Cyg. 2018, Bulgarian Astronomical Journal, 28, 42
- Taranova & Shenavrin (2007) Taranova, O. G. & Shenavrin, V. I., Unusual infrared fading of CH Cygni in 2006. 2007, Astronomy Letters, 33, 531, DOI: 10.1134/S106377370708004X
- Tomov et al. (2016) Tomov, T. V., Stoyanov, K. A., & Zamanov, R. K., AG Pegasi - now a classical symbiotic star in outburst? 2016, MNRAS, 462, 4435, DOI: 10.1093/mnras/stw2012
- Vaňko et al. (2015) Vaňko, M., Kollár, V., Komžík, R., Koza, J., & Pribulla, T., Photoelectric photometry era at the Astronomical Institute of the Slovak Academy of Sciences III. Fast photometry. 2015, Contributions of the Astronomical Observatory Skalnate Pleso, 45, 99
- Vaňko et al. (2014a) Vaňko, M., Komžík, R., Kollár, V., & Sekeráš, M., Photoelectric photometry era at the Astronomical Institute of the Slovak Academy of Sciences I. Instrumentation, colour system and extinction. 2014a, Contributions of the Astronomical Observatory Skalnate Pleso, 44, 77
- Vaňko et al. (2014b) Vaňko, M., Komžík, R., Kollár, V., & Sekeráš, M., Photoelectric photometry era at the Astronomical Institute of the Slovak Academy of Sciences II. Software and reduction techniques. 2014b, Contributions of the Astronomical Observatory Skalnate Pleso, 44, 91
- Waagen (2015) Waagen, E. O., Very rare outburst of the symbiotic variable AG Peg. 2015, AAVSO Alert Notice, 521
- Wallerstein et al. (2010) Wallerstein, G., Munari, U., Siviero, A., Dallaporta, S., & Dalmeri, I., The Spectrum and Light Curve of CH Cygni during its Recent Broad Minimum. 2010, PASP, 122, 12, DOI: 10.1086/648563
- Webster & Allen (1975) Webster, B. L. & Allen, D. A., Symbiotic stars and dust. 1975, MNRAS, 171, 171, DOI: 10.1093/mnras/171.1.171
- Wilson & Vaccaro (1997) Wilson, R. E. & Vaccaro, T. R., Ellipsoidal variation in EG Andromedae. 1997, MNRAS, 291, 54, DOI: 10.1093/mnras/291.1.54
- Worters et al. (2007) Worters, H. L., Eyres, S. P. S., Bromage, G. E., & Osborne, J. P., Resumption of mass accretion in RS Oph. 2007, MNRAS, 379, 1557, DOI: 10.1111/j.1365-2966.2007.12066.x
- Yudin et al. (2005) Yudin, B. F., Kolotilov, E. A., Shenavrin, V. I., Tatarnikova, A. A., & Tatarnikov, A. M., UBV photometry of the classical symbiotic star BF Cygni. 2005, Astronomical and Astrophysical Transactions, 24, 447, DOI: 10.1080/10556790500524155
- Zamanov et al. (2015) Zamanov, R., Latev, G., Boeva, S., et al., Optical flickering of the recurrent nova RS Ophiuchi: amplitude-flux relation. 2015, MNRAS, 450, 3958, DOI: 10.1093/mnras/stv873