Systematic Differences due to High Energy Hadronic Interaction Models in Air Shower Simulations in the 100 GeV-100 TeV Range
Abstract
The predictions of hadronic interaction models for cosmic-ray induced air showers contain inherent uncertainties due to limitations of available accelerator data and theoretical understanding in the required energy and rapidity regime. Differences between models are typically evaluated in the range appropriate for cosmic-ray air shower arrays (- eV). However, accurate modelling of charged cosmic-ray measurements with ground based gamma-ray observatories is becoming more and more important.
We assess the model predictions on the gross behaviour of measurable air shower parameters in the energy (0.1-100 TeV) and altitude ranges most appropriate for detection by ground-based gamma-ray observatories. We go on to investigate the particle distributions just after the first interaction point, to examine how differences in the micro-physics of the models may compound into differences in the gross air shower behaviour. Differences between the models above 1 TeV are typically less than 10%. However, we find the largest variation in particle densities at ground at the lowest energy tested (100 GeV), resulting from striking differences in the early stages of shower development.
I Introduction
Ground based gamma-ray astronomy uses the particle shower initiated when a very high energy ( GeV) gamma-ray interacts with an atom in the Earth’s atmosphere, to detect and reconstruct the primary particles of the primary gamma-rays. Such reconstruction is performed either by directly detecting the energetic particles formed in the shower at ground level (as in the HAWC gamma-ray observatory HAWC_CRAB ) or detecting the Cherenkov light emitted as the relativistic particles pass through the atmosphere using Imaging Atmospheric Cherekov Telescopes (IACTs), as in the H.E.S.S., MAGIC and VERITAS experiments HESS_Performance ; MAGIC_Performance ; VERITAS_Performance . Event reconstruction in all these instruments is performed in combination with detailed Monte Carlo simulations of the air shower development, which is typically very well understood for gamma-ray induced air showers.
Both experiment types also observe the flux from air showers induced from hadronic cosmic rays, which constitutes the major background for gamma-ray ray observations. Although they can be largely rejected, some cosmic-ray contamination will remain which must be estimated. This can be problematic as lack of knowledge of microscopic hadronic physics in the energy range of interest, leads to significant variations in the air shower predictions. In most observations of gamma-ray sources this uncertainty can be negated by instead using positions within the instrument field of view which contain no gamma-ray emission to estimate the background contamination (e.g. berge ). However, in the case of extremely large or truly diffuse sources, no such signal free region exists and the background contamination may need to be estimated from simulated data (like for example the Fermi-Bubbles FermiBubble and the Halo around Geminga HAWCGeminga in the case of IACTs).
This is even more apparent in non gamma-ray observations, as most pointedly seen in the measurement of the cosmic ray electron spectrum HESS_electrons ; HESS_electrons2 ; VERITAS_electrons ; MAGIC_electrons where the background contamination must be estimated from comparison to Monte Carlo simulations, in which case the systematic uncertainties in the hadronic interactions quickly become the dominant form of uncertainty in the measurement. Or in the case when these observatories are used to perform measurement of the hadronic cosmic rays (for example HAWCCRSpec ). Finally, hadron simulations are required to estimate the sensitivity of future gamma-ray observatories, such as the Cherenkov Telescope Array (CTA) CTA , the Southern Gamma-ray Survey Observatory (SGSO) SGSO , and the Large High Altitude Air Shower Observatory (LHAASO) LHAASO which could be affected by the choice of models.
The advent of LHC measurements has provided large amounts of data at never before probed energies LHCmod and at extreme rapidities LHCF1 ; LHCF2 . This data glut promises improvements to hadronic interaction models by facilitating model tuning in energy ranges not before possible and has resulted in the creation of a new generation of air shower focused hadronic interaction models EPOS-LHC ; QGSJetII-04 ; Sibyll2.3c tuned to this data set.
Although many detailed tests have been performed on this model generation, most have concentrated on the predictions in the energy range from eV to eV PAO , where measurements such as the primary particle mass can be critically dependent on the model used. Such studies lie far beyond the energy range of interest for gamma-ray instruments from eV to eV. In order to investigate the model behaviour in this energy regime, we have therefore studied the effects of the most commonly used hadronic interaction model versions included in the air shower simulation package CORSIKA corsika , concentrating on model predictions relevant to ground-based gamma-ray astronomy with both atmospheric Cherenkov telescopes and particle detectors at observation levels appropriate to these detector types.
In this publication we concentrate on understanding the gross behaviour of the shower, in terms of the particles or Cherenkov light arriving at ground level. We compare the spread of predictions in this energy range, quantifying the level of systematic uncertainties in measurements due to the use of hadronic interaction models and testing the hypothesis that the tuning of models to a wider range of data will inevitably lead to a convergence of model predictions. We then go on to compare the particle production of the first interaction to understand how the differences in air shower development stem from differences in the interaction characteristics of individual particles. It should be noted that the average distributions presented here do not necessarily correspond directly to measurables at gamma-ray observatories and biases in observations might expose different systematic differences between the model predictions.
II Air Shower Simulations
| Energy | Particle | Cherenkov | First |
|---|---|---|---|
| Distributions | Distributions | Interaction | |
| 100 GeV | 106 | 106 | 106 |
| 1 TeV | 105 | 105 | 106 |
| 10 TeV | 104 | 104 | 106 |
| 100 TeV | 103 | 103 | 106 |
To test the prediction of the models in gamma-ray observatories a series of simulation sets were created using CORSIKA with the Cherenkov light option activated. Protons showers were simulated at zenith, with CORSIKA v7.64 using (at the time of writing) the latest versions of the high energy hadronic interaction models EPOS-LHC, QGSJet-II-04 and SIBYLL 2.3c (assumed to be valid at energies 80 GeV, the default transition energy in CORSIKA). Each of the above mentioned high energy hadronic interaction models was combined with the UrQMD UrQMD low energy hadronic interaction model with the cross over energy set at 80 GeV. The electromagnetic shower component was simulated with the EGS4 EGS4 model. Energy cuts were placed on both electrons and muons of 0.3 and 300 MeV respectively within the CORSIKA simulations. Finally to better understand the transition between high end low energy interaction models, showers were also simulated using only the UrQMD model in the lowest energy bands tested. To best calculate the relevant parameters for the two types of gamma-ray observatories currently operating the ground level of the simulations were set to 4100 m (which corresponds the elevation of the HAWC gamma-ray observatory) and 1800 m (corresponding to the elevation of the H.E.S.S. experiment). Protons make up the dominant source of background in these experiments, hence no simulations were performed with heavier nuclei. Vertical showers were simulated in the typical energy range of the background of gamma-ray observations at 4 fixed energies (100 GeV, 1 TeV, 10 TeV and 100 TeV) for both observation levels, the number of simulated events is detailed in table 1.
II.1 Ground Level Particle Distributions
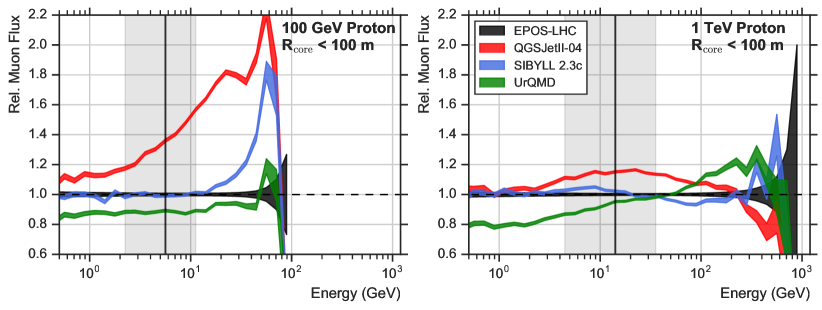
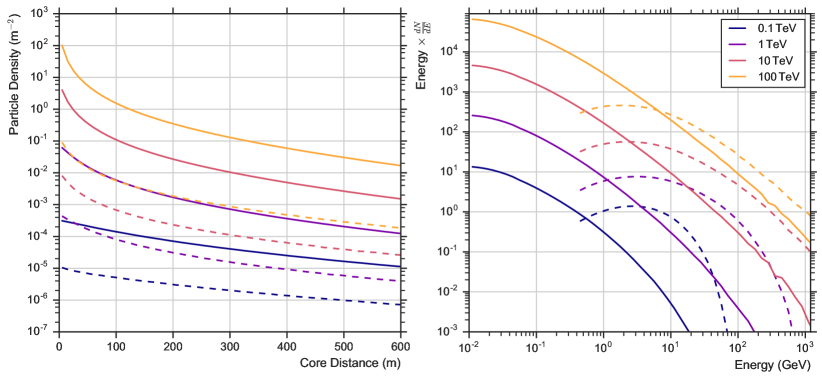
Figure 1 shows the averaged lateral distribution function (LDF) of particles (left) and the particle spectrum (right) at 4100 m altitude for the EPOS model. This figure demonstrates the both the comparative steepness of the LDF of electrons and gammas when compared to the muon LDF with the electromagnetic component being more concentrated toward the shower core. The spectra show that most muons lie in the range from 1 to 10 GeV, while most electrons and gammas lie at somewhat lower energies.
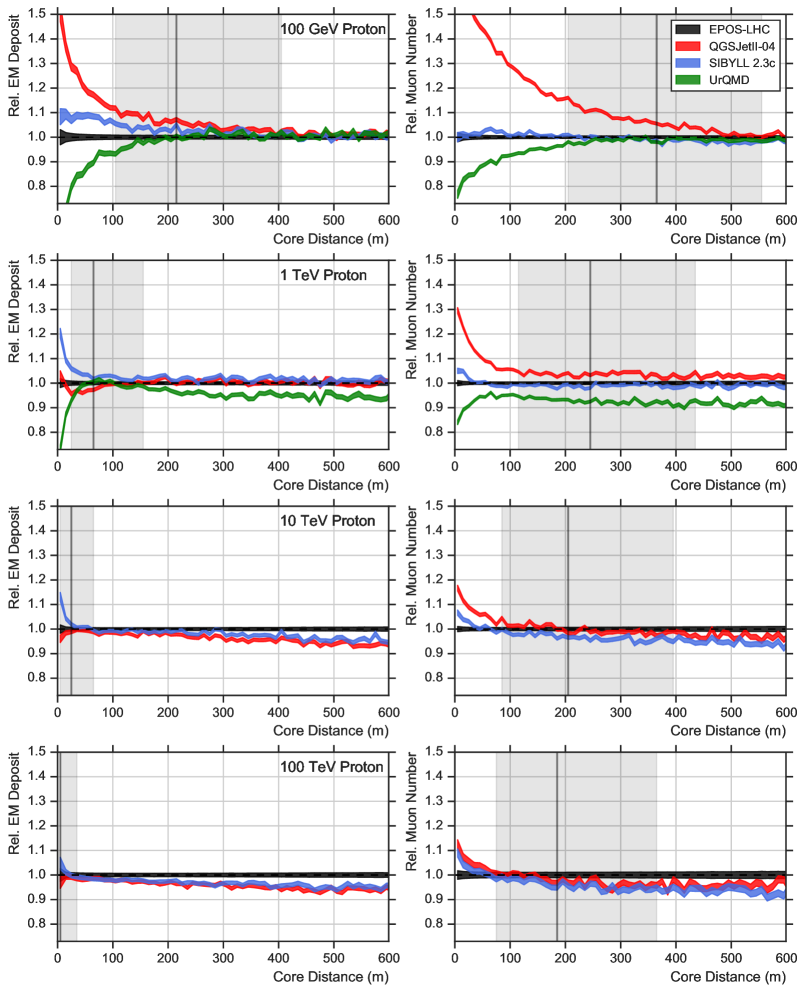
Figure 2 shows the fractional deviation of QGSJet, SIBYLL and UrQMD (for 100 GeV and 1 TeV only) from EPOS for both the sum of energy deposited at ground level by photons, electrons and positrons (hereafter EM energy deposit) [left] and the muon number [right]. The choice of parameters roughly mimics the behaviour of a HAWC-like obsevatory, where the EM component of the air shower generates a particle cascade within the detector, depositing all of its energy, whereas muons simply pass through depositing a fixed amount of energy. The trend in the relative values of both energy deposit and muon number is clearly seen to be evolving as a function of energy, with the deviations being largest at the lowest energies. At all energies, the difference between the models in both the energy deposit and muon number seems to be largest in the region near the shower axis.
At 100 GeV SIBYLL shows a 10% larger energy deposit than EPOS at 10 m from the shower core. When using QGSJet this difference becomes even larger with more than 40% increase in energy deposit and a more than 50% larger muon density below 10 m. Although some extreme differences are seen in the LDF shape, the differences in total particle production remains rather small, with QGSJet producing only 10% larger total EM deposit and 10% more muons. UrQMD on the other hand shows the opposite behaviour as QGSJet, showing a 30% reduction in EM energy deposit and 20% lower muon number close to the shower core.
Such large deviations in LDF shape for the different models at 100 GeV is rather surprising as the energy range of interactions within these showers lies well within the range of energies described by existing accelerator data. This result is made all the more surprising when one considers the transition energy between the high and low energy hadronic models at 80 GeV (all simulations share UrQMD as low energy model), so it seems quite likely that the differences in the high energy models arise dominantly from the differing treatment of the first interaction(s) of the shower.
At 1 TeV and 10 TeV the differences are somewhat smaller, showing a spread in the predicted energy deposit of 5% or less and a similar spread of the muon density. However, at small impact distances the significant increase in relative particle number at ground of QGSJet remains, most clearly seen in the muon number. Similarly the lower EM energy deposit and muon number seen in UrQMD is still seen at a reduced level at 1 TeV. The 10 and 100 TeV simulations show a similar consistency between models, however interestingly the order of the relative production level of muons has reversed, with QGSJet and SIBYLL now producing around a few percent smaller EM deposit and muons number than EPOS at all impact distances over 50 m.
When one considers the spectrum of muons at ground level in the central 100 m from the shower cores (figure 3) it becomes clear that the excess of muons seen close to the shower core at 100 GeV is caused by an excess of energetic (2 GeV) muons. These energetic muons are certainly produced in the earliest interactions in the shower development and are therefore quite indicative of a significant difference in the pion production spectrum in the 100 GeV range (investigated in later sections). UrQMD shows a similar increase in the number of energetic muons, however when one considers the energy range where most muons lie, UrQMD shows a deficit of around 10%. As primary energy increases the difference in the high energy muon spectra decreases. Already at 1 TeV the model discrepancies are significantly reduced, most clearly in the highest energy muons. For example at 1 TeV QGSJet now produces around 10% more muons in the peak energy range.
II.2 Cherenkov Photon Distribution
To evaluate the impact of hadronic interaction models on the intensity of Cherenkov light seen by IACTs we also simulate the lateral distribution of Cherenkov photons arriving at an observation level of 1800 m with the CORSIKA standard atmospheric absorption tables applied. The relative normalisation of the Cherenkov LDF defines the energy scale of the detected cosmic ray induced air showers. In contrast to air shower array detection the Cherenkov light originates all altitudes within the air shower (although atmospheric absorption reduces the contributions from high altitudes), therefore relates to the full air shower development rather than relying on only the energetic particles that make it to ground-level.
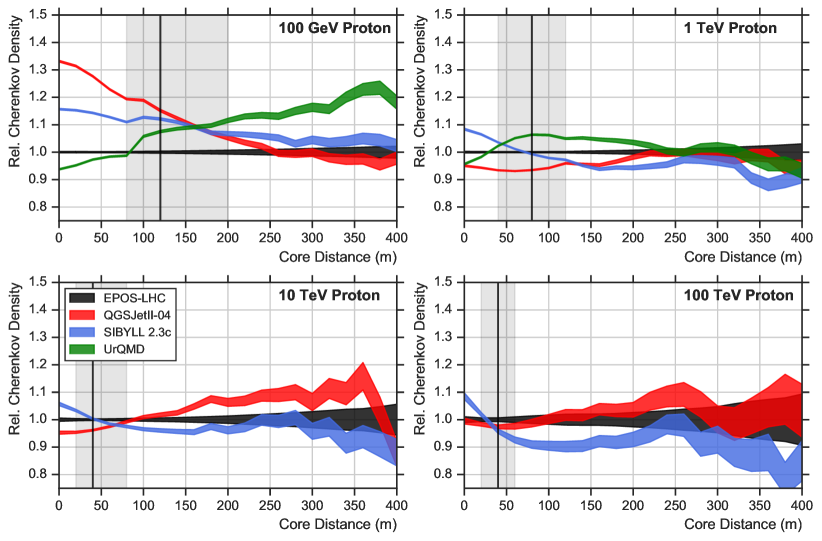
Figure 4 shows the comparison of lateral photon distributions between the interaction models from 100 GeV to 100 TeV.
At 100 GeV, like in the ground-level particle distributions (figure 2), the largest spread in model prediction is seen. In addition, the ordering of the relative Cherenkov light below 75 m impact distance is the same as the EM energy deposit. While for the EM energy deposit all the models seem to converge at large impact distances, this is not the case for the Cherenkov density, where UrQMD shows the largest deviation at larger core distance.
At 1, 10 and 100 TeV the relative behaviour of the models again change. The LDF looks similar in all models, differences between the models fluctuate around the 5% level.
III Early Shower Development
The differences in the air shower prediction are most obvious at 100 GeV primary energy. However, the energy where the simulation switches between low and high energy interaction models at 80 GeV. Therefore differences must already occur in the very early stages of shower development. To investigate the first interaction more thoroughly, simulations were generated a fixed interaction of primary proton with a Nitrogen nucleus. We evaluate the particle distributions 1 cm below the interaction point.
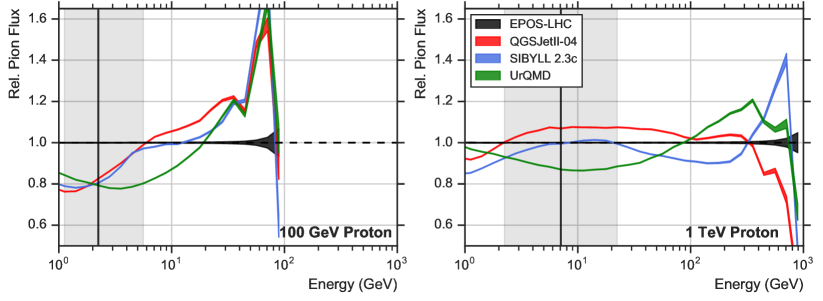
As the deviations are most apparent in the muon distributions 2, we evaluate the distributions of charged pions as their decay is the dominant channel for muon production. Figure 5 shows the relative comparison of the pion energy spectrum for different hadronic interaction models.
Significant differences between the model predictions are seen in the pion production at all energies but are again most apparent at 100 GeV. For pions around 1 GeV EPOS produces around 20% more muons than the other high and low energy interaction models, while in the range 50-100 GeV between 30 and 60% more muons are seen.
As illustrated by the relative pion energy spectrum for 1 TeV protons, at higher primary particle energies differences between the models are typically below 15%, with the exception when the energy transfer to charge pions approaches the energy of the primary proton.
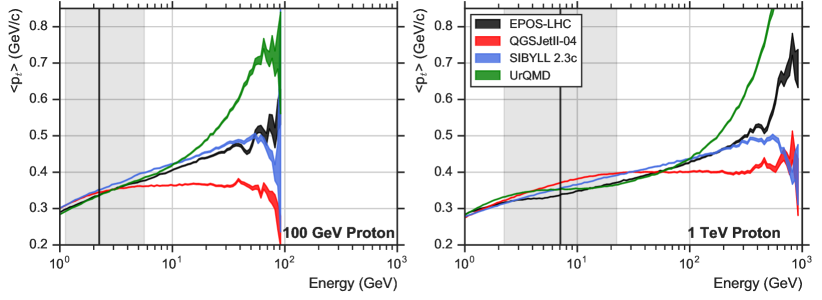
Finally, figure 6 shows the average transverse momentum to secondary pions as a function of the pion energy. Across the proton energy range at energies less than 5% of the primary energy there is an excellent agreement between all models. However, at all incident proton energies the transverse momentum of secondary pions above 10% energy fraction seems to diverge. Again this is most apparent at 100 GeV primary energy with EPOS and SIBYLL producing roughly consistent predictions which increase with energy fraction. QGSJet on the other hand seems to flatten out, imparting around 25% less transverse momentum, while UrQMD imparts around 25% more to the most energetic pions. At 1,TeV the reduced pt transfer is still present in QGSJet, but EPOS now seems to peak in pt transfer for the most energetic particles. Similar behaviour is observed for the gammas produced shortly after the first interaction.
IV Discussion
The major differences between the air shower predictions are summarised by the following points:
-
•
The largest differences in air shower prediction are seen at 100 GeV, decreasing with energy
-
•
At low energies QGSJet shows a significantly steeper lateral distribution of both the EM energy deposit and muon number than SIBYLL and EPOS, while UrQMD shows the opposite behaviour and has significant flatter lateral distributions.
-
•
The excess muons close to the shower core in QGSJet are mostly energetic particles
-
•
The lateral distribution of Cherenkov photons shows a steeper behaviour in QGSJet and SIBYLL at low energies than EPOS, the opposite behaviour is seen in UrQMD
The differences in the behaviour of the 100 GeV and 1 TeV showers can be largely understood by the dominance of the behaviour of the first interaction at this energy. Showers in this energy range are not well defined with only a few generations of particles being produced since the majority of the pions produced in the hadronic interactions (those that only carry a small fraction of the particle energy) quickly decay without further interaction. As the first interactions occur high in the atmosphere, the decay products from these pions are unable to reach ground level, also Cherenkov light from such particles are strongly absorbed.
Therefore, it is clear that when measuring low energy air showers at ground level the most important events are those where a large fraction of the primary particle energy is passed to a single pion. Such events have an important impact on the ground level particle distributions for two main cases. In the case that such a pion undergoes another hadronic interaction, the start of shower development is effectively postponed, pushing further particle production closer to ground level. Whereas energetic charged pions that do not interact further will produce energetic muons that are able to reach the ground without decaying (for a 20 km pion decay altitude typically muons below around 3 GeV will decay before reaching ground level).
In this context the air shower predictions can be better understood by considering the behaviour of the first interactions. One can see in figures 5 & 6 that the behaviour of low energy (5% proton energy) pions is quite consistent between the models. However, for the more important energetic pions the results are quite different. At both 100 GeV and 1 TeV QGSJet produces more (charged) pions in the 5-50 GeV range than SYBILL and EPOS while UrQMD produces fewer. Such an increased number of energetic pions in QGSJet could potentially be explained by the extreme defferences in the production spectrum shown in SPSrho0 . This difference in pion production number likely correlated the relative enhancement and deficit in muons numbers seen in QGSJet and UrQMD respectively. In addition, the regime in the transverse momentum distribution where are single pion gets a large fraction of the primary energy, helps to concentrate particles in the shower core for QGSJet whilst widening the particle distribution for UrQMD.
As discussed above, at the lowest energies the shower observables are biased towards showers that develop deeply in the atmosphere, however as the energy increases this is no longer the case. Therefore the influence of the first interaction in shower development becomes less and less important with increasing primary energy for the ground level observables. In addition, as the primary particle energy increases the differences in the pion production spectrum at the first interaction point between the models generally become smaller. However the differences in the production spectrum at low energies can still play an important role in governing the particle distribution at ground as these low energy interactions now represent the most numerous interactions in the shower and now take place closer to the detector level.
V Conclusions
In this paper we have demonstrated that, a good agreement (10% level) is seen between air shower predictions from different hadronic interaction models at energies above 10 TeV. However, contrary to typical assumption, the predictions in gross air shower behaviour do not converge at lower energies but rather diverge in the simple predictions tested. The primary reason for this divergence in behaviour seems to be chiefly related to the early stage of shower development and the differing predictions in energy and momentum distributions of pions.
It is clear from this comparison that even though these showers lie at the lowest boundary of the model validity range, more tuning to accelerator data is required to reproduce the average air shower behaviour at this low energy limit. However, it seems quite likely that accelerator data may not be readily available in the relevant psuedorapidity range. In order to better tune these models we should also attempt to leverage the air shower data from current and future gamma-ray detectors to provide further cosmic ray measurements for the comparison of model results. Although the gross average air shower behaviour studied here is not strictly representative of the most important measurables used in gamma-ray instruments in this energy range, it is indicative for the overall shower behaviour. Additionally the large differences seen between model behaviours suggest it will be possible to construct observables with gamma-ray observatories which provide useful input for model tuning and will help to improve the reliability of predictions in future. Such tests might be developed for air shower arrays such as HAWC or future facilities such as SGSO, however some assumptions of the cosmic ray composition would have to be made. Muon LDF and production height measurements should also be possible with the Cherenkov telescope array MitchellMuon , however measurements in the 100ĠeV to 1 TeV range may be challenging. Particularly the combination of ground particles and Cherenkov light measured by LHAASO may help to better distinguish between model predictions.
VI Acknowledgements
The authors thank the MPIK non-thermal astrophysics group for fruitful discussions about the paper, in particular J.A. Hinton for providing helpful comments. We would also like to thank T. Pierog and S. Ostapchenko for useful suggestions for the manuscript.
References
-
(1)
Abeysekara, A. U., et al.,
Observation of the crab
nebula with the HAWC gamma-ray observatory, The Astrophysical Journal
843 (1) (2017) 39.
URL http://stacks.iop.org/0004-637X/843/i=1/a=39 - (2) Aharonian, F., et al., Observations of the Crab nebula with HESS, A&A 457 (2006) 899–915. arXiv:astro-ph/0607333, doi:10.1051/0004-6361:20065351.
- (3) Aleksić, J., et al., The major upgrade of the MAGIC telescopes, Part II: A performance study using observations of the Crab Nebula, Astroparticle Physics 72 (2016) 76–94. arXiv:1409.5594, doi:10.1016/j.astropartphys.2015.02.005.
- (4) Park, N. et al., Performance of the VERITAS experiment, in: 34th International Cosmic Ray Conference, 2015, p. 771. arXiv:1508.07070.
- (5) Berge, D., et al., Background modelling in very-high-energy -ray astronomy, A&A 466 (2007) 1219–1229. arXiv:astro-ph/0610959, doi:10.1051/0004-6361:20066674.
- (6) Ackermann, M., et al., The spectrum and morphology or the fermi bubbles, The Astrophysical Journal 793 (1) (2014) 64. doi:10.1088/0004-637x/793/1/64.
-
(7)
Abeysekara, A. U., et al.,
Extended gamma-ray
sources around pulsars constrain the origin of the positron flux at earth,
Science 358 (6365) (2017) 911–914.
arXiv:http://science.sciencemag.org/content/358/6365/911.full.pdf,
doi:10.1126/science.aan4880.
URL http://science.sciencemag.org/content/358/6365/911 - (8) Aharonian, F., et al., Energy Spectrum of Cosmic-Ray Electrons at TeV Energies, Physical Review Letters 101 (26) (2008) 261104. arXiv:0811.3894, doi:10.1103/PhysRevLett.101.261104.
- (9) Aharonian, F., et al., Probing the ATIC peak in the cosmic-ray electron spectrum with H.E.S.S., Astronomy & Astrophysics 508 (2009) 561–564. arXiv:0905.0105, doi:10.1051/0004-6361/200913323.
- (10) Archer, A., et al., Measurement of cosmic-ray electrons at tev energies by veritas, Physical Review D 98. doi:10.1103/PhysRevD.98.062004.
- (11) Borla Tridon, D., Measurement of the cosmic electron spectrum with the MAGIC telescopes, International Cosmic Ray Conference 6 (2011) 47. arXiv:1110.4008, doi:10.7529/ICRC2011/V06/0680.
-
(12)
Alfaro, R., et al.,
All-particle
cosmic ray energy spectrum measured by the hawc experiment from 10 to 500
tev, Phys. Rev. D 96 (2017) 122001.
doi:10.1103/PhysRevD.96.122001.
URL https://link.aps.org/doi/10.1103/PhysRevD.96.122001 -
(13)
CTA-Consortium,
Science with the
Cherenkov Telescope Array, WORLD SCIENTIFIC, 2019.
arXiv:https://www.worldscientific.com/doi/pdf/10.1142/10986, doi:10.1142/10986.
URL https://www.worldscientific.com/doi/abs/10.1142/10986 - (14) Albert, A., et al., Science case for a wide field-of-view very-high-energy gamma-ray observatory in the southern hemisphere (2019). arXiv:arXiv:1902.08429.
- (15) Di Sciascio, G. et al., The LHAASO experiment: From Gamma-Ray Astronomy to Cosmic Rays, Nuclear and Particle Physics Proceedings 279 (2016) 166–173. arXiv:1602.07600, doi:10.1016/j.nuclphysbps.2016.10.024.
- (16) d’Enterria, D., et al., Constraints from the first LHC data on hadronic event generators for ultra-high energy cosmic-ray physics, Astroparticle Physics 35 (2011) 98–113. arXiv:1101.5596, doi:10.1016/j.astropartphys.2011.05.002.
-
(17)
The LHCf collaboration, et al.,
Measurement of inclusive
forward neutron production cross section in proton-proton collisions at
=13 tev with the lhcf arm2 detector, Journal of High Energy
Physics 2018 (11) (2018) 73.
doi:10.1007/JHEP11(2018)073.
URL https://doi.org/10.1007/JHEP11(2018)073 -
(18)
Adriani, O., et al.,
Measurement
of forward photon production cross-section in proton–proton collisions at
=13 tev with the lhcf detector, Physics Letters B 780 (2018) 233
– 239.
doi:https://doi.org/10.1016/j.physletb.2017.12.050.
URL http://www.sciencedirect.com/science/article/pii/S0370269317310365 -
(19)
Pierog, T., et al.,
Epos lhc: Test of
collective hadronization with data measured at the cern large hadron
collider, Phys. Rev. C 92 (2015) 034906.
doi:10.1103/PhysRevC.92.034906.
URL https://link.aps.org/doi/10.1103/PhysRevC.92.034906 -
(20)
Ostapchenko, S.,
Monte carlo
treatment of hadronic interactions in enhanced pomeron scheme: Qgsjet-ii
model, Phys. Rev. D 83 (2011) 014018.
doi:10.1103/PhysRevD.83.014018.
URL https://link.aps.org/doi/10.1103/PhysRevD.83.014018 -
(21)
Riehn, F., et al., The hadronic
interaction model Sibyll 2.3c and Feynman scaling, in: 35th International
Cosmic Ray Conference, PoS(ICRC2017)301, 2017.
URL https://pos.sissa.it/301/851/ - (22) The Pierre Auger Collaboration, et al., Inferences on Mass Composition and Tests of Hadronic Interactions from 0.3 to 100 EeV using the water-Cherenkov Detectors of the Pierre Auger Observatory, arXiv e-prints (2017) arXiv:1710.07249arXiv:1710.07249.
- (23) Heck, D., et al., CORSIKA: a Monte Carlo code to simulate extensive air showers., Forschungszentrum Karlsruhe GmbH, 1998.
-
(24)
Bass, S., et al.,
Microscopic
models for ultrarelativistic heavy ion collisions, Progress in Particle and
Nuclear Physics 41 (1998) 255 – 369.
doi:https://doi.org/10.1016/S0146-6410(98)00058-1.
URL http://www.sciencedirect.com/science/article/pii/S0146641098000581 -
(25)
Nelson, W. R., et al.,
Electron-photon transport
using the egs4 (electron gamma shower) monte carlo code, United States,
1986.
URL https://www.osti.gov/servlets/purl/6800853 -
(26)
Aduszkiewicz, A., et al.,
Measurement of meson
resonance production in interactions at sps energies, The
European Physical Journal C 77 (9) (2017) 626.
doi:10.1140/epjc/s10052-017-5184-z.
URL https://doi.org/10.1140/epjc/s10052-017-5184-z - (27) Mitchell, A. M. W., et al., Potential for measuring the longitudinal and lateral profile of muons in TeV air showers with IACTs, Astroparticle Physics 111 (2019) 23–34. arXiv:1903.12040, doi:10.1016/j.astropartphys.2019.03.005.