22institutetext: Key laboratory of Modern Astronomy and Astrophysics, Nanjing University, Ministry of Education, Nanjing 210093, China
33institutetext: Max-Planck-Institut für Kernphysik, Saupfercheckweg 1, 69117 Heidelberg, Germany
Tentative evidence of spatially extended GeV emission from SS433/W50
We analyze 10 years of Fermi-LAT data towards the SS433/W50 region. With the latest source catalog and diffuse background models, the -ray excess from SS433/W50 is detected with a significance of in the photon energy range of 500 MeV - 10 GeV. Our analysis indicates that an extended flat disk morphology is preferred over a point-source description, suggesting that the GeV emission region is much larger than that of the TeV emission detected by HAWC. The size of the GeV emission is instead consistent with the extent of the radio nebula W50, a supernova remnant being distorted by the jets, so we suggest that the GeV emission may originate from this supernova remnant. The spectral result of the GeV emission is also consistent with an supernova remnant origin. We also derive the GeV flux upper limits on the TeV emission region, which put moderate constrains on the leptonic models to explain the multiwavelength data.
Key Words.:
-rays: binaries (SS433)1 Introduction
SS 433 is a Galactic X-ray binary system containing a compact object (either a black hole or a neutron star) accreting matter from a companion star (Gies et al. 2002; Eikenberry et al. 2001). It is the prototype of microquasars and has been studied intensively due to its exceptional brightness and power (for a review, see e.g., Mirabel & Rodríguez 1999). It is located close to the geometric centre of the radio nebula W50, which is most likely a supernova remnant (SNR). Several X-ray hotspots located west of the central binary (w1 and w2) and east (e1, e2, e3) are observed (Safi-Harb & Ögelman 1997). These regions are bright at X-rays due to the interaction between the jets and the ambient medium (Safi-Harb & Ögelman 1997; Safi-Harb & Petre 1999; Brinkmann et al. 2007). Two bright radio ears to the east and west of the nebula are generally believed to be punched out by two oppositely directed relativistic jets (Abell & Margon 1979; Fabian & Rees 1979; Margon et al. 1979; Milgrom 1979; Dubner et al. 1998) moving outwards from SS433 (Margon 1984; Elston & Baum 1987; Goodall et al. 2011b, a; Farnes et al. 2017). The entire radio morphology of the SS433/W50 system is thus seen as an approximately elliptical shell that is in projection on the sky (Geldzahler et al. 1980). S433/W50 lies at a distance of kpc (Blundell & Bowler 2004; Lockman et al. 2007), implying a physical size of (Goodall et al. 2011b).
Bordas et al. (2015) reports for the first time the GeV emission is tentatively associated with SS433/W50 using five years of Fermi-LAT data. Recently, the HAWC telescope detected very-high-energy (VHE) emission () around two X-ray hotspots e1 and w1 regions with a significance of (Abeysekara et al. 2018). The spatial extension analysis of the two hotspots yield upper limits on the angular size of the emission regions being for the east hotspot and for the west hotspot at 90% confidence (Abeysekara et al. 2018). The spectral results indicate that the broadband spectral energy distribution (SED) at the e1 region can be naturally explained within a pure leptonic model, in which the same population of relativistic electrons with energies up to hundreds of TeV produce the radio to X-ray emission by the synchrotron radiation and up-scatter photons from the cosmic microwave background (CMB) to the TeV -rays. Xing et al. (2019) analyzes ten years of Fermi-LAT data using the preliminary LAT 8-year point source list (FL8Y)111https://fermi.gsfc.nasa.gov/ssc/data/access/lat/fl8y/ and finds excess GeV emission around the western X-ray hotspot w1 region. However, we note that the point source FL8Y J1913.3+0515, which is consistent with the position of W50 (SNR G039.7-02.0), has been included in their background model, leading to a reduction of the excess -ray emission from the north-east region. Rasul et al. (2019) focuses on the temporal behavior of GeV emission and finds tentative evidence for periodicity at the precession period. They analyze nine years of Fermi-LAT data using the Fermi-LAT 4-year catalog (3FGL, Acero et al. 2015) and the foreground models gll_iem_v06.fits and iso_P8R3_SOURCE_V2.txt222https://fermi.gsfc.nasa.gov/ssc/data/access/lat/BackgroundModels.html.
Different from the previous works, in this paper, we use the most recent Fermi-LAT products to reanalyze the SS433/W50 region. We focus on the spatial extension of the GeV emission using multiple spatial templates. In Section 2 we perform a detailed spatial analysis on the Fermi-LAT data towards SS433. In Section 3, we present the spectrum and discuss the radiation mechanism. Section 4 is the discussion and conclusion.
2 Spatial analysis of the Fermi-LAT data
We analyze Fermi-LAT Pass 8 database toward the SS433/W50 system from August 4, 2008 (MET 239557417) until December 18, 2018 (MET 566826221). We select both the front and back converted photons at energies from to . A square region centred at the nominal position of SS433 is considered as the region of interest (ROI). We use the ”source” event class, recommended for individual source analysis, the recommended expression to exclude time periods when some spacecraft event has affected the data quality. To reduce the background contamination from the Earth’s albedo, only the events with zenith angles less than are included for the analysis. The data have been processed through the current Fermitools from conda distribution333https://github.com/fermi-lat/Fermitools-conda/ together with the latest version of the instrument response functions (IRFs) P8R3_SOURCE_V2. We utilize the python module that implements a maximum likelihood optimization technique for a standard binned analysis444https://fermi.gsfc.nasa.gov/ssc/data/analysis/scitools/python_tutorial.html. For the complex structures at low latitude, it’s more reasonable to re-optimize for Test Statistic (TS) fits through setting the keyword tsmin = true.
In our background model, we use Fermi-LAT 8-year catalog (4FGL, The Fermi-LAT collaboration 2019) by running the make4FGLxml script555https://fermi.gsfc.nasa.gov/ssc/data/analysis/user/make4FGLxml.py within the region of ROI enlarged by . We leave the normalizations and spectral indices free for all sources within 6 degrees away from SS433. For the foreground components, we use the latest Galactic diffuse model gll_iem_v07.fits and isotropic emission model iso_P8R3_SOURCE_V2_v1.txt666https://fermi.gsfc.nasa.gov/ssc/data/access/lat/BackgroundModels.html with their normalization parameters free.
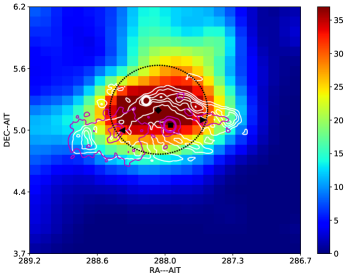
Generally, high energy maps with higher angular resolution are more suitable for the spatial analysis, but low statistics in the higher energy range may prevent any improvement. Therefore, to balance the effects of these two factors, we select the data in the energy range of 500 MeV - 10 GeV for the analysis. We use the gttsmap tool to evaluate a residual TS map by removing the contribution from all the known sources in our background model defined above. The TS value for each pixel is defined as , where is the maximum-likelihood value for null hypothesis and is the maximum likelihood with the additional source under consideration. The spectral type of all the added sources for the likelihood ratio test in this section are assumed to be a simple power-law. As shown in Figure 1, a strong -ray excess near the SS433’s nominal position is apparent after the fitting and subtraction of -rays from the background sources by performing the TS analysis.
At the eastern interaction region, there’s almost no GeV emission, which is roughly consistent with the results reported by Bordas et al. (2015), while TeV excess has been detected by HAWC’s observation in this region. Abeysekara et al. (2018) has argued that the TeV emission originates from the jet termination shock, thus the above difference indicates that the GeV emission likely originates from the other regions, e.g., one of the possibilities, the SNR W50 itself.
2.1 Single point-like source model
We add a point-like source model encompassing the SS433’s nominal position into our background model, and optimize the localization using the gtfindsrc tool. The derived best-fit position of the excess above 500 MeV is [R.A., Dec.] (the ”diamond” in Figure 1), with 1 and 2 error radii of 0.4∘ and 0.6∘, and away from the nominal position. Moreover, the SS433’s nominal position, e1 and w1 lie within 2 positional errors of the best-fit position. As shown in Table 10, under the assumption of single point-like source model, the significance of the excess -ray emission is () and the best-fit photon index is .
In the following, to investigate the morphology and extension of the -ray emission, we consider several spatial templates as the alternative hypothesis, and the above single point-like source model as the null hypothesis. Then we compare the overall maximum likelihood of the alternative hypothesis () with that of the null hypothesis (), and define the significance of the alternative hypothesis model following the paper Lande et al. (2012).
2.2 Two point-like source model
The e1 and w1 regions detected by HAWC (Abeysekara et al. 2018) lie within 2 positional errors of the best-fit position, we cannot yet rule out the possibility that the -ray emission originates from the regions of the excess TeV emission. To study whether the extended nature of this GeV emission is caused by a superposition of two separate point-like sources, we calculate maximum likelihood value for the most possible combination of two point-like sources, i.e., one point-like source at the e1 location and one point-like source at the w1 position (see Figure 1). Given that (), this model is disfavored statistically. Thus the GeV emission probably does not originate from the regions of the TeV emission.
2.3 Uniform disk tests for spatial extension
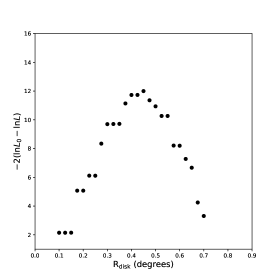
To investigate whether the -ray excess is extended beyond a point source spatially, we assume that the -ray source has uniform surface brightness inside the SNR boundary, and produce several uniform disk templates centered at the best-fit position with various radii from to in steps of . The derived significance of the excess -ray emission is with 1 additional degrees of freedom relative to single point source. As shown in Figure 2, the extension likelihood is peaked at the disk radius of ( error), which is roughly compatible with the extension of the radio emission (Geldzahler et al. 1980) longitudinally. The peak significance of is a tentative evidence that the excess -ray emission at the SS433/W50 system is spatially extended. The photon index is , and -ray luminosity can be estimated as .
2.4 Radio and X-ray templates
To check if the -ray emission distribution traces the observed radio and X-ray emission, we consider three additional templates. We create two radio emission templates based on the measurements of the Green Bank Observatory at 4.8 GHz with and without two lateral ”ears”. And the X-ray template is produced from the observation with ROSAT PSPC at 1.2 keV, taken from the Virtual Observatory 777https://skyview.gsfc.nasa.gov/current/cgi/titlepage.pl. The contours of the radio and X-ray emission are overlaid in Figure 1, in white and magenta, respectively. In Table 10 we list the fitting results for the three templates using the binned likelihood analysis. The significances of the two radio templates relative to single point source model, both with , shows no improvement. The significance derived from the case of the X-ray template is significantly lower than the single point source model. This is expected since the excess -ray emission distribution is basically inconsistent with the region of the X-ray emission. Therefore, we reject the hypothesis that the -ray emission originates from the extended region of the X-ray emission.
2.5 Extension analysis using alternative diffuse background model
We also use the previous Galactic interstellar emission model gll_iem_v06.fits 888https://fermi.gsfc.nasa.gov/ssc/data/access/lat/BackgroundModels.html to replace the gll_iem_v07.fits in our background model, and repeat the above spatial analyses. In this case, the morphology of the TS map is roughly consistent with the one derived from the latest Galactic interstellar emission model. Under the assumption of single point-like source model, the derived best-fit position of the excess above 500 MeV is [R.A., Dec.], which is away from the nominal position, and the significance is . An uniform disk template () can fit the -ray excess with an improvement of relative to the single point-like source model. This shows that inclusion of the latest diffuse background model gll_iem_v07.fits significantly reduces the detection significance, as well as the detected -ray flux. A dedicated analysis on the possible systematic errors due to the diffuse background models is needed.
3 Spectral analysis
The results from spatial analysis show that the uniform circle disk template with a radius of is preferred over the point source for the -ray emission towards the SS433/W50 system, with an improvement of 3.5 to 5. Thus we fix the uniform circle disk as the spatial model of the extended -ray emission towards the SS433/W50 system to extract the spectral information. The logparabola function, , can best fit the global spectral shape of the -ray emission with a , and the parameters are , , and .
3.1 Modelling the spectral energy distribution
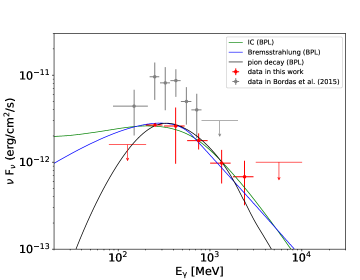
To investigate the origin of the extended GeV emission and the underlying particle spectra that give rise to the observed spectrum of photons, we derive the spectral energy distribution (SED) of SS433/W50 via the maximum likelihood estimation in seven logarithmically spaced energy bins from 80 MeV - 10 GeV. For the first and last energy bands, which are detected with a significance of less than , we only free the normalization parameters in the iterative model derived from above spatial and spectral fits and calculate the upper limits within confidence level. The energy dispersion correction is applied to the first energy bin. The derived SED of SS433/W50 in this work along with the SED from Bordas et al. (2015) are plotted in Figure 3. We notice that while the spectral shape is consistent with that in Bordas et al. (2015), the normalization is reduced by a factor of more than 2. This is consistent with a lower detection significance derived in this work (about for point source for 10 years data in this work, in comparison with more than for 6 years data in Bordas et al. (2015)). We attribute the difference also to the different choice of the galactic diffuse background.
We use Naima999http://naima.readthedocs.org/en/latest/index.html# (Zabalza 2015) to fit the SED. Naima is a numerical package that includes a set of non-thermal radiative models and a spectral fitting procedure. The code allows us to implement different functions and perform Markov chain Monte Carlo (MCMC; Foreman-Mackey et al. 2013) fitting of non-thermal radiative processes to the data.
To phenomenologically interpret the SED in the GeV band, we adopt both an exponential cut-off power-law (ECPL) and a more complex broken power-law (BPL) distribution of the radiating electrons or protons. The former is in the form of
| (1) |
treating , , , and as free parameters for the fit, and the later is
| (2) |
with the , , , and left as free parameters.
In the hadronic scenario, we attribute the observed -rays to the decay of neutral pions produced by the pp collision between the relativistic protons (and nuclei) in the SNR W50 and the protons in the interstellar medium, using the cross-section approximation of Kafexhiu et al. (2014). The average number density of the target protons is assumed to be as in Bordas et al. (2015). On the other hand, we test the leptonic scenario assuming the -ray emission is produced by the IC up-scattering of seed photons, or through the bremsstrahlung of the relativistic electrons embedded in the SNR W50 or matter from the surrounding medium. For the interstellar radiation field of the IC, except for the Cosmic Microwave Background (CMB), we also adopt the infrared and optical emissions from dust and starlight of the local interstellar radiation field calculated by Popescu et al. (2017). For the relativistic bremsstrahlung, we assume the target particle density of (Bordas et al. 2015). We adopt the formalism described in Aharonian & Atoyan (1981) and Khangulyan et al. (2014) for the IC photon spectrum calculation and the relativistic bremsstrahlung spectra from Baring et al. (1999), respectively.
Table 11 lists the best-fit parameters as well as the total energy of the electrons or protons, , with statistical errors, searched using the maximum log-likelihood (MML). Figure 3 shows the radiation models with the maximum likelihood values correspondingly. It is evident that the decay model is the best one to match the flux points, which reveal a pion-bump feature. The parameters are , , , and the total energy of the high-energy protons . The leptonic model of GeV emission leads to a significant decrease in the maximum likelihood of the fitting, as shown in Table 11. The constraints on leptonic models are mainly from the first two energy bins, which can hardly be addressed by either IC or Bremsstrahlung process except we assume a very sharp low energy cutoff of the low energy electron spectrum. Such a hadronic origin can also explain the lower significance of the spatial analysis results by using radio templates. The radio emissions are mainly from the synchrotron radiation of electrons and can have a different spatial distribution than that of the proton content which is responsible for the -ray emission.
3.2 Upper limits on GeV emission from the e1 region
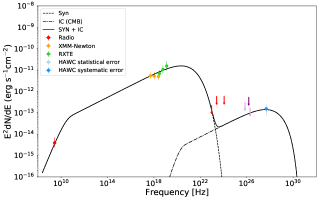
Although no GeV emission is significantly detected at the east hotspot region e1 of SS433/W50, the upper limit flux can provide constrains on the leptonic model reported in Abeysekara et al. (2018). We add a point-like source with a power-law spectral type at the e1 position into our iterative model, and obtain upper limits within a confidence level. As shown in Figure 4, we consider the one zone leptonic model as in Abeysekara et al. (2018), namely, the relativistic electrons scatter CMB photons to GeV - TeV energies via IC process (dot-dashed line) and produce radio to low energy -ray emissions by the synchrotron process (dashed line). We also assume a power-law electron distribution with an exponential cutoff, that is, . The solid line presents the sum of the IC and synchrotron radiation. We find the first upper limit in the energy range of 300 - 500 MeV can effectively constrain the , and the fitting results are roughly consistent with Abeysekara et al. (2018). The best-fit values of the parameters are , , , and the total energy of the electrons with energy above 10 GeV is . It is interesting that the current best-fit model already predicts a turnover in the energy spectrum in the HAWC energy range. Such kind of feature can be directly tested with more HAWC observations in the future. And the next generation TeV -ray detectors, such as CTA (Actis et al. 2011) and LHAASO (Di Sciascio & LHAASO Collaboration 2016), will definitely provide a clear test on the leptonic model in the termination region of the jet.
4 Discussion and Conclusion
We have analyzed 10-year Fermi-LAT data towards SS433/W50 region and found tentative evidence for spatially extended GeV emission in this region (with a significance of 3.5 to , depending on the choice of the diffuse background). The extension of the sub-GeV to GeV -ray emission are roughly consistent with the size of SNR W50. The SED of these -ray emission reveals a pion-bump shape and can be well explained by the pion-decay emissions from a population of protons with a low break energy in the spectrum interacting with the ambient gas. Such a slightly accelerated proton population can be injected along the jet or at the jet termination shock (Bordas et al. 2015). The acceleration mechanism should be rather inefficient, given that the -ray spectrum extends only up to a few GeVs. Recently, Rasul et al. (2019) has found tentative evidence for periodicity at the precession period of the GeV emissions in SS433. If this is true, at least part of these GeV emissions should be produced in the basement of the jet, rather than in the termination region or the SNR. However, we note that the significance of the variability is only about . And we note that their analysis are performed with old diffuse background models. As mentioned in Section 2.5, the update to the latest diffuse background models has significantly reduced the detection significance. A further detailed systematic investigation of diffuse background models in this region are needed to clarify these features. On the other hand, due to the spatial coincidence of the sub-GeV to GeV -ray emission and the SNR itself, it is more likely that these protons are accelerated in the SNR. We also found that a broken power-law proton spectrum can best fit the -ray SED. Such a broken power-law shape spectrum is also observed in other mid-age SNRs, such as IC433 and W44 (Ackermann et al. 2013). However the break energy here is much lower than those in other mid-age SNRs. Such a low-energy break may reflects the inefficient acceleration in this SNR due to the presence of the jet. On the other hand, Malkov et al. (2011) has explained the energy break in these mid-age SNRs as the result of Alfven waves evanescence caused by strong ion-neutral collisions. In this case the break energy is determined by the neutral and ion density, as well as the gas temperatures, which can be very different in W50 due to the influence of the jet.
Due to the different spatial morphology, the -ray emissions observed by Fermi-LAT may have a different origin than that of the TeV emissions observed by HAWC which is believed to originate from the termination region of the microquasar jet (Abeysekara et al. 2018). Under this assumption we also extract the upper limits on the TeV emission region in Fermi-LAT energy band. We found that the current data can already put interesting constraints on the maximum electron energy in the leptonic model. It is interesting that the current best-fit leptonic model predicts an turnover in the energy spectrum in HAWC energy range, which can be tested by the further data release of HAWC, as well as the observations of the forthcoming CTA and LHASSO.
| Spatial Model | Energy Flux | Power-law Index | b𝑏bb𝑏b | DoFc𝑐cc𝑐cAdditional degrees of freedom. |
|---|---|---|---|---|
| () | ||||
| Aa𝑎aa𝑎aModel A corresponds to point source model with a power-law spectrum at the best-fit location in Figure 1. | 2.80 0.13 | 3.31 0.02 | 0 | 0 |
| 0.65 0.17 | 2.88 0.10 | 3.4 | 2 | |
| 2.35 0.83 | 3.29 0.24 | |||
| Uniform circle disk () | 1.79 0.05 | 2.62 0.02 | 12 | 1 |
| Radio (4.8 GHz) | 2.94 0.16 | 3.23 0.04 | 0.1 | 0 |
| Radio (4.8 GHz, no ears) | 0.87 0.01 | 2.45 0.03 | ¡ 0 | 0 |
| X-ray (240 PHz) | 2.03 0.69 | ¡ 0 | 0 |
Each uniform disk model is centered at the best-fit position. All the associated uncertainty refers to the 68% statistic errors. Details see the context in Section 2.
| Radiation | Parent particle | a𝑎aa𝑎aTotal energy of the electrons or protons. The is calculated based on the protons and the is calculated based on the electrons . | b𝑏bb𝑏bMaximum log-likelihood (MLL). | |||
|---|---|---|---|---|---|---|
| model | distribution | ( erg) | () | |||
| pp | ECPL | 11.9 | 2.10.2 | 2.7 | 1 (fixed) | -1.6 |
| ECPL | 12.1 | 2.1 | 2.8 | 1.10.3 | -1.6 | |
| BPL | 11.40.5 | 2.10.2 | 2.4 | 4.00.4 | -1.0 | |
| IC | ECPL | 2.8 | 1.50.1 | 9.51.2 | 1 (fixed) | -31.4 |
| ECPL | 3.70.3 | 1.70.1 | 12 | 5.30.7 | -13.3 | |
| BPL | 3.4 | 1.60.1 | 8.3 | 6.4 | -10.3 | |
| Rel. bremsstrahlung | ECPL | 1.60.1 | 1.60.2 | 1.0 | 1 (fixed) | -10.6 |
| ECPL | 1.50.1 | 1.70.2 | 1.40.3 | 1.8 | -10.8 | |
| BPL | 1.50.1 | 1.50.3 | 0.7 | 3.7 | -7.5 |
Acknowledgements
X.N. Sun thanks Yunfeng Liang for helpful discussions. This work is supported by the NSFC under grants 11625312 and 11851304, and the National Key R&D program of China under the grant 2018YFA0404203.
References
- Abell & Margon (1979) Abell, G. O. & Margon, B. 1979, Nature, 279, 701
- Abeysekara et al. (2018) Abeysekara, A. U., Albert, A., Alfaro, R., et al. 2018, Nature, 562, 82
- Acero et al. (2015) Acero, F., Ackermann, M., Ajello, M., et al. 2015, ApJS, 218, 23
- Ackermann et al. (2013) Ackermann, M., Ajello, M., Allafort, A., et al. 2013, Science, 339, 807
- Actis et al. (2011) Actis, M., Agnetta, G., Aharonian, F., et al. 2011, Experimental Astronomy, 32, 193
- Aharonian & Atoyan (1981) Aharonian, F. A. & Atoyan, A. M. 1981, Ap&SS, 79, 321
- Baring et al. (1999) Baring, M. G., Ellison, D. C., Reynolds, S. P., Grenier, I. A., & Goret, P. 1999, ApJ, 513, 311
- Blundell & Bowler (2004) Blundell, K. M. & Bowler, M. G. 2004, ApJ, 616, L159
- Bordas et al. (2015) Bordas, P., Yang, R., Kafexhiu, E., & Aharonian, F. 2015, ApJ, 807, L8
- Brinkmann et al. (2007) Brinkmann, W., Pratt, G. W., Rohr, S., Kawai, N., & Burwitz, V. 2007, A&A, 463, 611
- Di Sciascio & LHAASO Collaboration (2016) Di Sciascio, G. & LHAASO Collaboration. 2016, Nuclear and Particle Physics Proceedings, 279, 166
- Dubner et al. (1998) Dubner, G. M., Holdaway, M., Goss, W. M., & Mirabel, I. F. 1998, AJ, 116, 1842
- Eikenberry et al. (2001) Eikenberry, S. S., Cameron, P. B., Fierce, B. W., et al. 2001, ApJ, 561, 1027
- Elston & Baum (1987) Elston, R. & Baum, S. 1987, AJ, 94, 1633
- Fabian & Rees (1979) Fabian, A. C. & Rees, M. J. 1979, MNRAS, 187, 13P
- Farnes et al. (2017) Farnes, J. S., Gaensler, B. M., Purcell, C., et al. 2017, MNRAS, 467, 4777
- Foreman-Mackey et al. (2013) Foreman-Mackey, D., Hogg, D. W., Lang, D., & Goodman, J. 2013, PASP, 125, 306
- Geldzahler et al. (1980) Geldzahler, B. J., Pauls, T., & Salter, C. J. 1980, A&A, 84, 237
- Gies et al. (2002) Gies, D. R., Huang, W., & McSwain, M. V. 2002, ApJ, 578, L67
- Goodall et al. (2011a) Goodall, P. T., Alouani-Bibi, F., & Blundell, K. M. 2011a, MNRAS, 414, 2838
- Goodall et al. (2011b) Goodall, P. T., Blundell, K. M., & Bell Burnell, S. J. 2011b, MNRAS, 414, 2828
- Kafexhiu et al. (2014) Kafexhiu, E., Aharonian, F., Taylor, A. M., & Vila, G. S. 2014, Phys. Rev. D, 90, 123014
- Khangulyan et al. (2014) Khangulyan, D., Aharonian, F. A., & Kelner, S. R. 2014, ApJ, 783, 100
- Lande et al. (2012) Lande, J., Ackermann, M., Allafort, A., et al. 2012, ApJ, 756, 5
- Lockman et al. (2007) Lockman, F. J., Blundell, K. M., & Goss, W. M. 2007, MNRAS, 381, 881
- Malkov et al. (2011) Malkov, M. A., Diamond, P. H., & Sagdeev, R. Z. 2011, Nature Communications, 2, 194
- Margon (1984) Margon, B. 1984, ARA&A, 22, 507
- Margon et al. (1979) Margon, B., Ford, H. C., Grandi, S. A., & Stone, R. P. S. 1979, ApJ, 233, L63
- Milgrom (1979) Milgrom, M. 1979, A&A, 76, L3
- Mirabel & Rodríguez (1999) Mirabel, I. F. & Rodríguez, L. F. 1999, ARA&A, 37, 409
- Popescu et al. (2017) Popescu, C. C., Yang, R., Tuffs, R. J., et al. 2017, MNRAS, 470, 2539
- Rasul et al. (2019) Rasul, K., Chadwick, P. M., Graham, J. A., & Brown, A. M. 2019, MNRAS
- Safi-Harb & Ögelman (1997) Safi-Harb, S. & Ögelman, H. 1997, ApJ, 483, 868
- Safi-Harb & Petre (1999) Safi-Harb, S. & Petre, R. 1999, ApJ, 512, 784
- The Fermi-LAT collaboration (2019) The Fermi-LAT collaboration. 2019, arXiv e-prints 1902.10045
- Xing et al. (2019) Xing, Y., Wang, Z., Zhang, X., Chen, Y., & Jithesh, V. 2019, ApJ, 872, 25
- Zabalza (2015) Zabalza, V. 2015, Proc. of International Cosmic Ray Conference 2015, in press