Performance evaluation of the Boron Coated Straws detector with Geant4
Abstract
The last decade has witnessed the development of several alternative neutron detector technologies, as a consequence of upcoming neutron sources and upgrades, as well the world-wide shortage of 3He. One branch of development is the family of 10B-based gaseous detectors. This work focuses on the boron coated straws (BCS) by Proportional Technologies Inc., a commercial solution designed for use in homeland security and neutron science. A detailed Geant4 simulation study of the BCS is presented, which investigates various aspects of the detector performance, e.g. efficiency, activation, absorption and the impact of scattering on the measured signal. The suitability of the BCS detector for Small Angle Neutron Scattering (SANS) and direct chopper spectrometry is discussed.
keywords:
Boron Coated Straws, Boron10, Geant4, neutron detector, neutron scattering1 Introduction
For many years 3He-based detectors have been dominant in the field of neutron scattering science, as they satisfied scientific requirements and 3He was available in sufficient quantities at an affordable price. The situation has changed in recent years due to the worldwide 3He crisis [1, 2] that necessitated the development of alternative neutron detector technologies based on 10B4C [3, 4, 5, 6, 7, 8, 9], 6LiF [10, 11, 12] and scintillators [13, 14, 15, 16, 17, 18, 19, 20].
More importantly though, these new technologies are required to exceed the scientific capabilities of previous detectors, as imposed by future instrument upgrades and upcoming research facilities. Such a facility is the European Spallation Source (ESS) ERIC [21, 22] that aspires to lead neutron scattering research. The cutting edge neutron scattering instruments set high requirements for the detectors, that could otherwise become the bottleneck of the instrument’s scientific performance. It is therefore important to understand every aspect of detector performance before qualifying it for a particular neutron technique.
Monte Carlo simulations could and should play a key role in the development and characterisation of detectors as a reliable, cheap and versatile tool [23]. Simulations not only make it easier to analyse and compare detectors and detector arrangements without building a physical prototype every time, but also enable the quantification of otherwise unmeasurable properties. The primary goal of this work is to perform a comprehensive characterisation of the BCS detector – a promising 3He detector replacement technology developed initially for homeland security applications –, using Monte Carlo simulations. The study includes the efficiency of the detectors, the absorption and activation of the materials thereof, and the impact of the material budget on scattering. A generic detector geometry is implemented in Geant4 [24, 25, 26], which can serve the needs of various neutron scattering techniques. The following sections introduce the detector specifics and the respective model, define appropriate figures of merit and discuss the evaluation of the BCS performance.
2 Detector technology and simulation model
2.1 The BCS detector
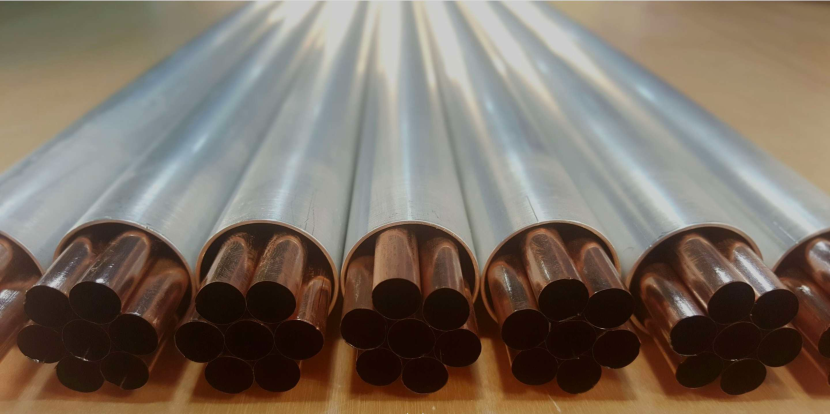
BCS is a position sensitive 10B-based gaseous neutron detector developed by Proportional Technologies, Inc. (PTI) [27]. It consists of a long thin-walled aluminium tube, containing seven copper straws arranged hexagonally with one in the centre (see Fig. 1). The inner wall of the straws is coated with a 1 m thin B4C converter layer enriched in 10B by 95%. The straws are filled with an Ar/CO2 mixture (90/10 by volume) at 0.7 atm. A bias voltage is applied between the tube and resistive Stablohm wires tensioned in the center of each straw as anodes, making them work in proportional mode [28]. The charge is read out at both ends of the detector using charge division to acquire longitudinal position information along the straws.
The length and diameter of the straws, and therefore of the tubes, can vary depending on the application. It is claimed that a straw diameter of 2 mm up to 15 mm or even more can be achieved [5], but in most publications either 4 mm or 7.5 mm is used [29, 30, 31]. Generally, several BCS tubes are placed behind each other in successive layers in order to achieve the desired coverage, uniformity and detection efficiency. The main application field of the BCS detectors is homeland security but they have the potential to be used as large area position-sensitive detectors for SANS and chopper spectrometers.
2.2 Geant4 model
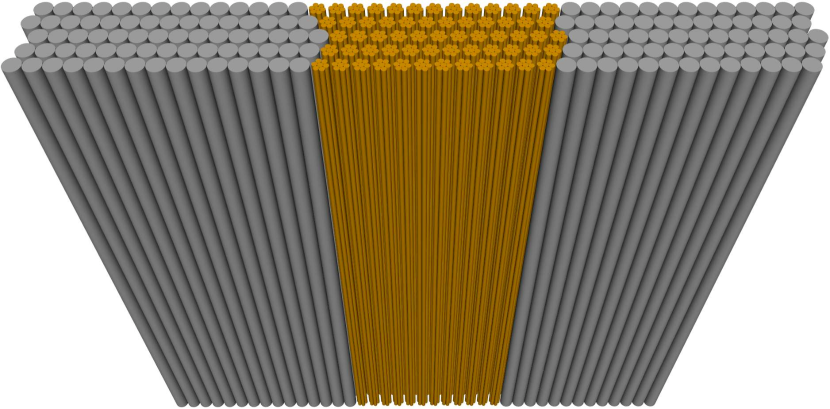
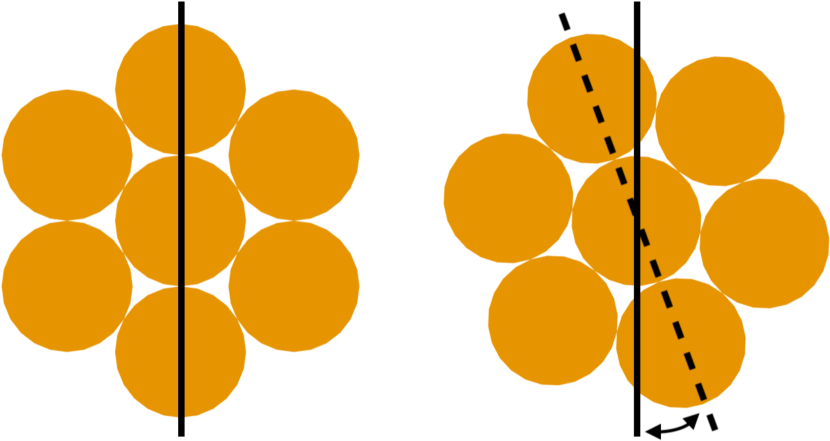
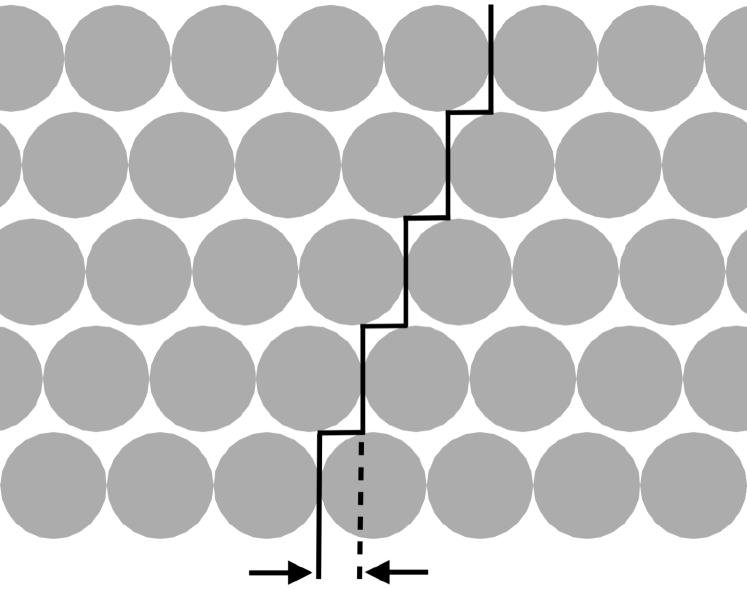
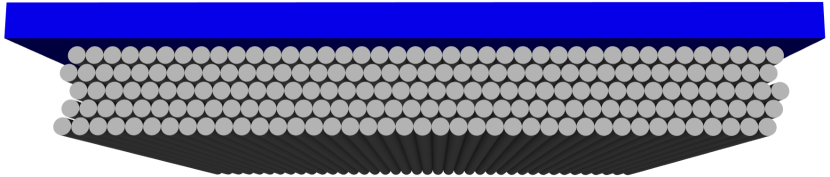
The Geant4 geometry model implemented for this study is a generic 1 m2 detector arrangement that consists of 5 consecutive detector panels with 40 tubes in each (see Fig. 2). For higher uniformity in the conversion efficiency, the tubes are rotated by 20∘ around their cylindrical axes and a relative horizontal shift of 10.16 mm is applied for adjacent panels (see Fig. 3) to avoid high differences in the path length in the B4C converter layer [32].
The model of a single BCS detector consists of the aluminium tube that contains the 7 copper straws arranged hexagonally with 1 enriched B4C layers on their inner surface. The void inside a tube is filled with the Ar/CO2 mixture (90/10 by volume) at 0.7 atm. The exact parameters of the full scale model are listed in table 1.
| Tube diameter | 25.4 [ | mm] |
| Tube thickness | 0.94 [ | mm] |
| Straw diameter | 7.5 [ | mm] |
| Straw thickness | 25 [ | m] |
| B4C thickness | 1 [ | m] |
| Tube&straw length | 1 [ | m] |
All materials are selected from the Geant4 database of NIST materials, except for Al and Cu. The latter are described with the use of the NCrystal library [34, 35, 23], as their crystalline structure is important for the correct treatment of their interaction with neutrons. The density of the NCrystal aluminium and copper are =2.70 g/cm3 and =8.93 g/cm3 respectively. The Geant4 physics list used is QGSP_BIC_HP.
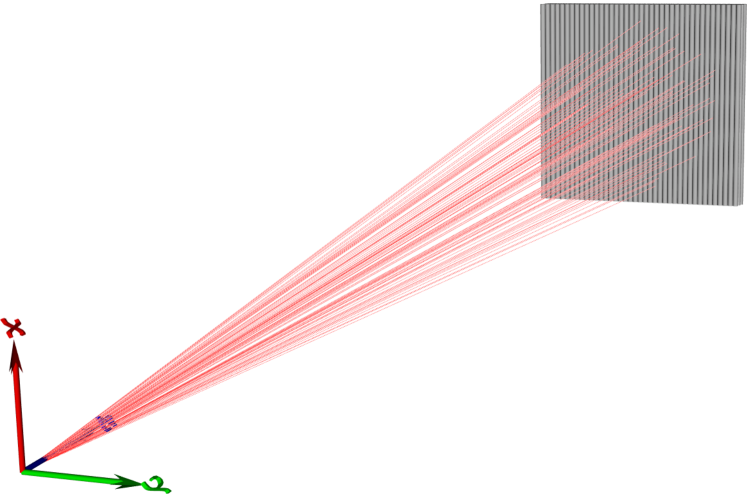
The detector system is illuminated with neutrons from a point source at a 5 m distance from the centre of the geometry in vacuum. The neutron source is an isotropic, monochromatic conical beam with an opening angle of 10.6∘; this ensures that the direct beam crosses all 5 panels to minimise edge effects.
The model does not contain the anode wires in the straws and therefore neither the charge collection nor the readout are simulated. A detection event is recorded if a neutron’s conversion products deposit more energy in the counting gas than a preset threshold applied to mimic discrimination of the gamma background. In different studies of BCS detectors, different thresholds are reported, e.g. 30 keV [36], 73 keV [5] and 200 keV [29]. Based on these values, in the simulations of this study an energy threshold of 120 keV is applied, which corresponds to an appropriate threshold for 10B detectors to achieve sufficient /thermal neutron discrimination for neutron scattering applications [37, 38, 39].
The simulation of each neutron is completely independent so pile-up is not possible. If a neutron enters the copper straw in a BCS detector, it is counted as incident for that straw. If the neutron is converted in the B4C layer, it is counted as converted. The detection event’s two coordinates perpendicular to the straw are defined by the virtual position of the wire in the center of the straw. In order to get the third, longitudinal coordinate, first the weighted average of the deposited energy by the conversion products is determined, then a Gaussian distribution with that mean value is sampled. The full width at half maximum (FWHM) for this smearing is set to 0.6 cm based on experimental results [29, 32]. Although the longitudinal resolution for a tube detector depends on the position along its length (higher in the centre than closer to the ends [31]), and is very much a function of the analogue quality and signal treatment in the electronic readout, this study assumes uniform resolution.
3 Detector efficiency
Detection efficiency is one of the key performance parameters of a detector. With new and stronger sources coming up it is important to fully exploit the high brilliance of a neutron pulse and accommodate a larger number of users. This aspect of neutron detectors has come to focus with the replacement detector technologies. A simulation tool like Geant4 can shed a lot of light in the response of a complex geometry like that of BCS.
The functional unit of a BCS detector is a single straw. The straw detection efficiency can be expressed in several valid ways. In this work the following definition is used:
-
1.
Detection efficiency is the number of neutrons detected in a straw divided by the number of incident neutrons in that straw from every direction. A neutron is counted as incident every time it enters the copper of the straw from the outside.
(1)
The replacement of the number of detected neutrons with the number of converted neutrons in the numerator results in the respective conversion efficiencies.
Another relevant quantity is the detection to conversion ratio (DCR), that is the fraction of detected neutrons over converted ones. As previously mentioned, to get a detection event after a conversion, at least one of the conversion products has to leave the boron carbide layer and deposit enough energy in the counting gas to overcome the preset threshold. Detailed calculations of this exist [40, 41, 42] For BCS it is claimed that for 1 m of B4C, one of the two charged conversion products has a 78% probability to escape the converter and ionise the counting gas in the straw [30]. This is the theoretical maximum for DCR, with no energy threshold. With the applied threshold of 120 keV, the simulated DCR is 70%, regardless of the wavelength of the converted neutrons, due to the small thickness of the B4C layer. This value also gives an upper limit for the detection efficiency, as it is the convolution of the conversion efficiency and the DCR. The higher the threshold is, the lower the DCR and therefore the lower the detection efficiency will be. The optimal value depends on the gamma background of the measurement and ought to be chosen carefully.
The detection efficiency for each straw with monochromatic 0.6 Å, 3 Å and 11 Å neutrons is depicted in Fig. 4. The efficiency of a single straw is quite low with an average of 3%, 12% and 31% respectively. This is why 7 of them are packed together in a BCS tube and this is why employing even more overlapping straws in consecutive panels of detectors is necessary for most applications. The detection efficiency of the straws is quite uniform for a particular wavelength across all panels. This is because of the monoenergetic neutron sources, but a previous study with polyenergetic neutrons demonstrated significant differences between the panels, attributed to the hardening of the neutron spectra and the thermalisation of the neutrons via scattering [33]. The slightly lower efficiencies in the last panels for 11 Å indicate that the thermalisation through scattering occurs indeed, and leads to neutrons with lower wavelength in the neutron spectrum and therefore lower average efficiency for the straws in the back, but also show that it is a minor effect compared to the hardening of the neutron spectra.
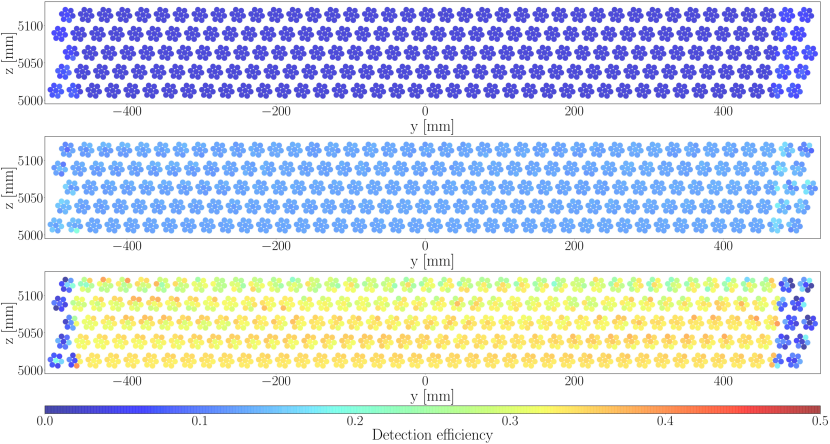
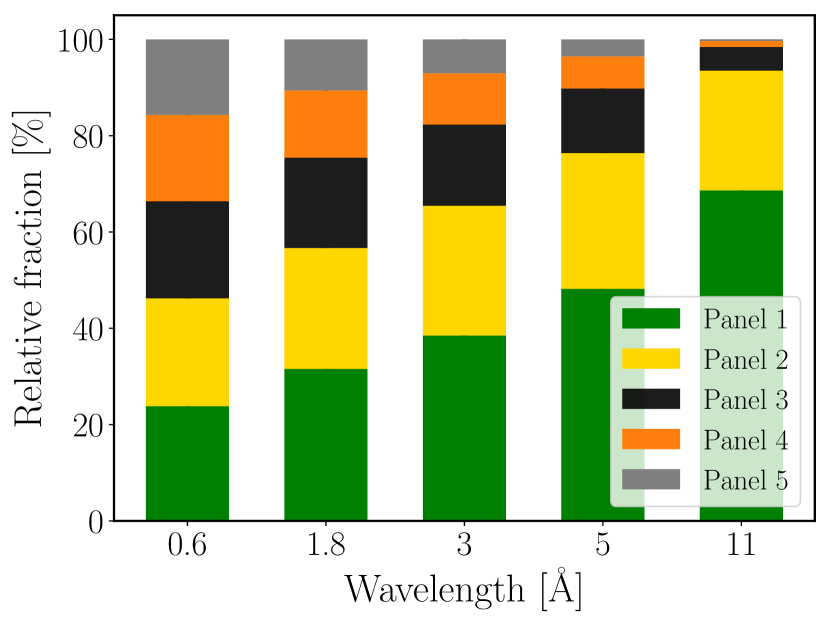
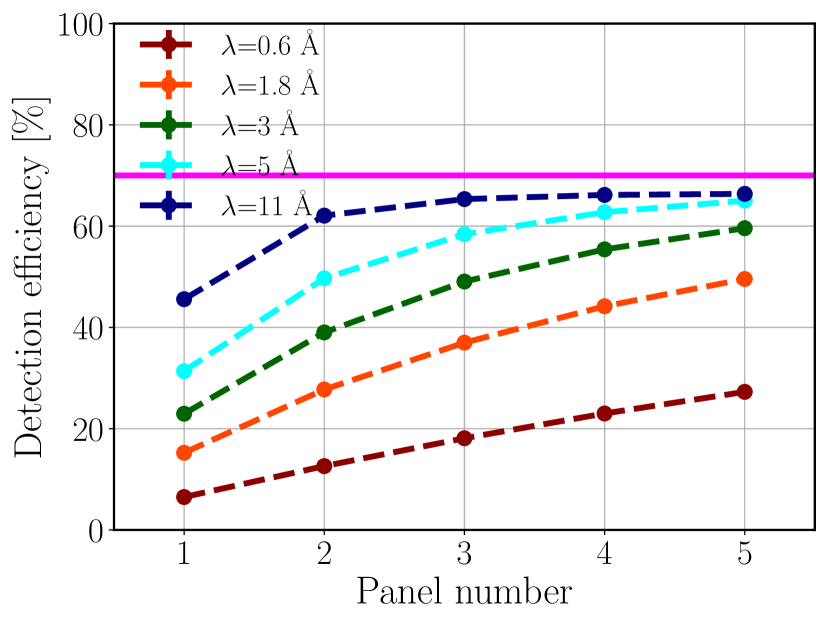
Fig. 5 depicts the contribution of each panel to the total number of detection events and the resulting global detection efficiency. For all wavelengths the first panel registers most of the detection events and the impact of the additional panel becomes lower and lower. This is more noticeable for high wavelengths where the efficiency saturates 4-5% below the maximum of 70% defined by the DCR. The detectors in the fifth panel contribute only a 0.21–4.27% to the global detection efficiency for the simulated neutron wavelengths. These results imply that depending on the application and the optimum wavelength thereof, using 4 panels might be a more cost efficient solution.
The results presented are derived from simulations with all 5 panels in place. This means that efficiencies with fewer than 5 panels are somewhat overestimated because of the back-scattered neutrons from later panels, but the simulations with fewer panels showed that this effect means a 0.5% difference only.
It is worth mentioning that the thickness of the converter layer has an impact on the detection efficiency. As previously said, the latter results from the convolution of the conversion efficiency and the DCR. The conversion efficiency could be increased by using a thicker conversion layer but that would lower the escape probability of the conversion products and consequently the DCR [5, 6, 40]. The cumulative effect of the converter layer thickness is wavelength dependent and not straightforward. The simulations show that for high wavelengths the global detection efficiency could be increased with lower B4C thickness due to the increase of DCR but for lower wavelengths the decrease of the conversion efficiency overrules it and the detection efficiency decreases. In the other direction, the efficiency for low wavelengths can slightly benefit from thicker converter layers but for higher wavelengths where the conversion efficiency is already high, the lower DCR lowers the detection efficiency. In this study the commercial converter layer thickness of 1 m is used. A more detailed investigation of converter thicknesses and efficiency optimisation is out of scope here.
4 Absorption in detector components
The previous section demonstrates that for achieving a higher detection efficiency it is necessary to use multiple panels of detectors. This does not only increase the number of conversion and detection events but as a consequence the undesired absorption in the non-converting materials of the detector, namely aluminium and copper also increases. However, it is not only these two materials that can absorb neutrons without leading to a detection but B4C too. As mentioned before, not all conversion events result in a detection event because in some cases the conversion products do not exit the converter layer or they do not deposit sufficient energy in the detector gas to overcome the applied threshold. In addition, there is a rather small amount of neutron absorption in carbon and 11B without conversion products to trigger a detection event. These two event classes together are hereinafter referred to as absorption in B4C.
In a single Geant4 simulation it is possible to register the number of neutrons absorbed in aluminium, copper and B4C separately and compare the effect of these materials. The latter could also be done with multiple simulations using different models with the materials out of focus replaced with vacuum to eliminate their effect on each other, but these effects change the results by 3% so we present the numbers using the model with all materials in place. In Fig. 6 the relative absorption is depicted for simulations with five different neutron wavelengths. The relative absorption in any material or materials is defined as the number of neutrons absorbed in that material over the number of incident neutrons for the entire detector system.
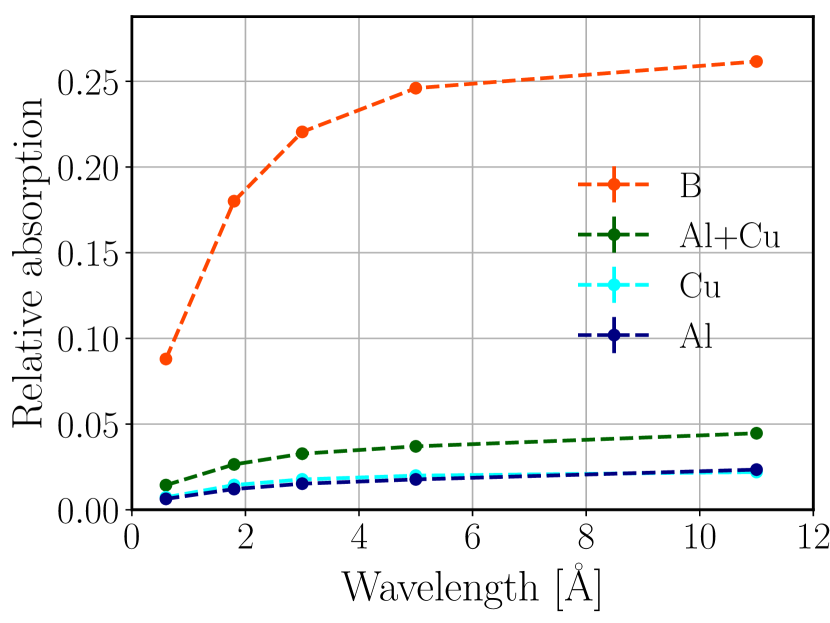
Most of the undesired absorption occurs in the converter layer. This is not surprising with 30% of the converted neutrons not triggering a detection event (70% DCR). The absorption in the copper is higher than in aluminium except for the highest wavelength (11 Å), but the difference is rather small in every case. This might be unexpected as the absorption cross-section of copper is approximately 16 times higher for these wavelengths (see Fig. 32 in appendix), but the total volume of aluminium is 17.6 times higher than that of copper, therefore the average path length of the neutrons in aluminium is much longer, an effect that compensates the cross-section difference.
It is possible to make a ‘naive’ analytical estimation of the absorption in a material using Eq. 2:
| (2) |
where is the macroscopic absorption cross section given by Eq. 3 and is the path length in a material.
| (3) |
where is the microscopic absorption cross section, is the atomic density, is the mass density, is the molar mass of the material and is the Avogadro number.
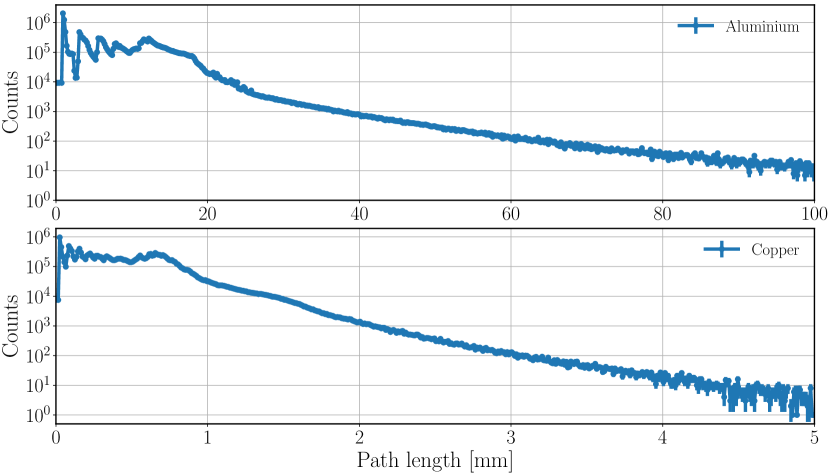
For a specific neutron wavelength each parameter is known except the path length in the materials. One way to estimate the latter is to assume that a neutron stops halfway through the detector system after crossing an aluminium wall 2 times and a copper wall 6 times frontally in each panel. Using the wall thicknesses provided in Tab. 1 the results are =4.7 mm and =0.375 mm. The path length of the neutrons is of course not constant even for a specific wavelength, as presented in Fig. 7. For aluminium, the beginning of the first peak in the histogram corresponds to the wall thickness of a tube, because that is the minimum distance in aluminium that a neutron has to pass to be absorbed in a straw. Due to the circular tube geometry and the conical beam, most of the neutrons do not enter the tube wall perpendicularly, so the neutrons absorbed in the first tube they enter can have a path length in aluminium longer than this minimum, that results in the first peak. The beginning of the second peak corresponds to three times the wall thickness of the tube, as the that is the minimum distance in aluminium for a neutron that is absorbed in the second tube it enters. The upcoming peaks are more and more blurred as the path length difference in different directions, and the number of scattered neutrons become more and more important. The last broad peak corresponds to the neutrons that pass through all panels without being absorbed and the rest of the histogram contains only scattered neutrons. Similar effects appear for copper because of the straws, but with more overlapping layers and complex geometry.
With the average path length of the neutrons extracted from the simulations a more accurate estimate can be made proving the relevance of the formula in Eq. 2 and supporting the results. The relative absorptions from the two estimation methods and the results from simulation are presented in Table 2. The estimations using the average path lengths are in very good agreement with the simulations. All results are within 2.5%, except for the the lowest wavelength but even there the difference is less than 13%. This shows how well such an easy formula describes the process of absorption in the detectors. The naive estimation also gives acceptable results, given that it’s a rough estimation. Some numbers are off by a factor 3.3, but for medium wavelengths the difference is less than 70%. For wavelengths where the average path length is longer than the used fixed number, the results are underestimated, and the other way around, overestimated path lengths lead to overestimated absorptions. More accurate estimations could be made with more sophisticated formula but even in this state, both estimations support the simulation results.
| [Å] | Rel. Abs.naive [%] | [mm] | Rel. Abs.est [%] | Rel. Abs.sim [%] | ||||
|---|---|---|---|---|---|---|---|---|
| Al | Cu | Al | Cu | Al | Cu | Al | Cu | |
| 0.6 | 0.23 | 0.40 | 11.90 | 0.66 | 0.57 | 0.71 | 0.65 | 0.79 |
| 1.8 | 0.65 | 1.19 | 8.43 | 0.45 | 1.17 | 1.44 | 1.20 | 1.44 |
| 3 | 1.13 | 2.00 | 6.38 | 0.33 | 1.52 | 1.78 | 1.51 | 1.76 |
| 5 | 1.85 | 3.30 | 4.44 | 0.22 | 1.75 | 1.97 | 1.76 | 1.98 |
| 11 | 4.02 | 7.11 | 2.69 | 0.11 | 2.32 | 2.19 | 2.30 | 2.15 |
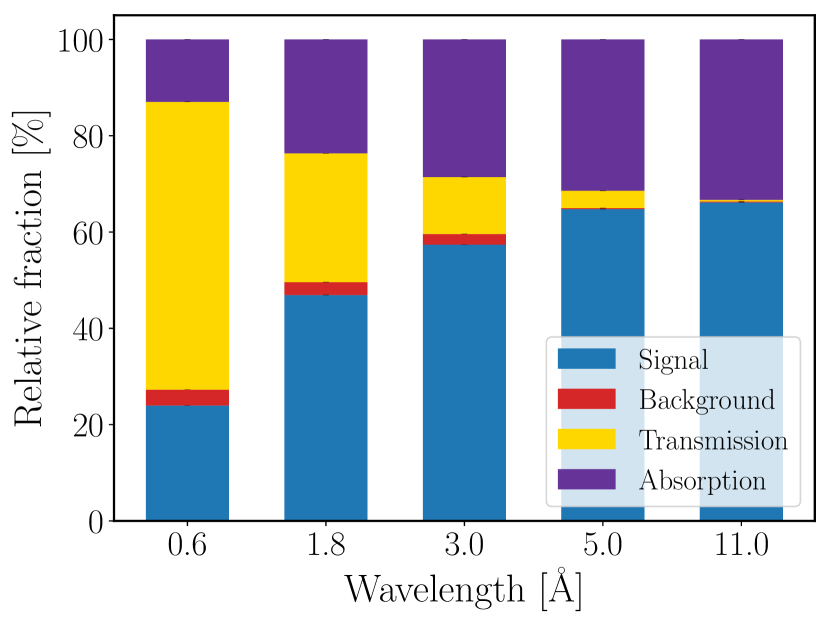
Fig. 8 shows the proportion of absorption in different materials, transmission and detection from simulations. As all neutrons enter the detector system, the proportion of detection events is by definition the global detection efficiency described in the previous section.
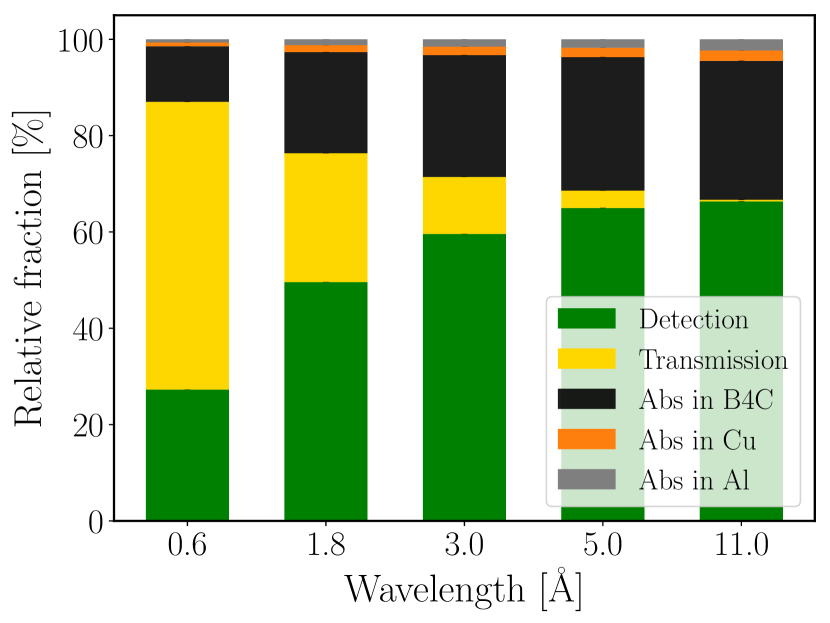
The results indicate that for the lowest wavelengths 60-30 % of the neutrons leave the detector system even with 5 panels but for the highest wavelength this value drops below 0.5%. This high transmission number at lower and medium wavelengths emphasises the need for a shielding layer behind the panels. Proportion of absorption in aluminium and copper together is approximately 1.5% for low wavelengths and stays below 4.5% even for the highest wavelength. For the neutron wavelengths that are more relevant to neutron scattering techniques, the absorption of this scale is acceptable and justify the use of successive detection panels.
The obtained results correspond to pure unalloyed materials; alloyed materials and impurities may significantly increase the absorption due to the presence of isotopes with high absorption cross-section despite their low concentration. For example, the macroscopic absorption cross section of Al5754 [43], an aluminium alloy typically used in nuclear science for mechanical structures, can be 18% higher than the pure aluminium mainly due to its manganese content.
5 Activation
Neutron absorption in the detector materials potentially has another negative effect besides lowering the detection efficiency, namely the neutron activation of these materials. Activation might interfere with the normal operation of the detectors in two ways. Firstly, the gamma rays and particles emitted by the excited nucleus and the decay products might form a background during measurements in addition to that of prompt gammas. Secondly, after the measurements, the radiation coming from the radioactive nuclei might not allow anyone to get close to the detectors (e.g. for maintenance) owing to the high gamma dose rate. The purpose of this section is both to determine whether the background from the activation is significant for the measurements, and to find out how much time one has to wait after the measurements to be safe to approach the detectors.
This is intended to be a generic study, therefore the activation is calculated for pure aluminium and copper instead of a specific alloy. The activation of the previously mentioned aluminium alloy is already investigated in [44]. In that work it is also concluded that the activation of the Ar/CO2 is a minor effect compared to the same of the aluminium-housing, and the beta radiation is negligible both in terms of background and radiation protection, so these aspects are not addressed here.
At spallation sources the detectors are irradiated in pulses, but as the pulses and repetition times are much shorter than activation and decay times of the relevant isotopes, a constant average flux with the same integral can be used to determine activation. The calculations are performed for a constant flux of 109 n/cm2/s on a 1 cm3 cubic sample, assuming 5% of neutrons are scattered toward the detectors. These numbers represent a worst case scenario for an intended SANS application [33] but the results to be presented scale linear with the flux, making it is easy to adopt them to any other particular application. This assumption gives an incident flux of n/cm2/s for the 1 m2 detector system, that means a neutron intensity of n/s. Using this number as source intensity for the previously introduced simulation arrangement, the intensity of neutron absorption in each material can be calculated for different monoenergetic beams using the relative absorption results from Table 2. The results of these monoenergetic beams covering the most relevant wavelength range can be used to give estimation for a particular neutron spectrum by choosing the most representative wavelength or by corresponding segmentation using the upper wavelength for each range. The estimation presented here is done for 3 Å neutrons, with 1.51% and 1.76% of neutrons absorbed in aluminium and copper, respectively. From the neutron absorption intensity, the activation of an isotope is calculated for the irradiation duration with Eq. 4,
| (4) |
where is the neutron absorption intensity and is the decay constant of the regarded isotope. Pure aluminium contains only the 27Al isotope, but copper has two natural isotopes – 63Cu and 65Cu, so the absorption intensity is shared between them with respect to the their natural abundance and absorption cross-section. Neutron activation of the activation products (secondary activation) is neglected due to the low probability of the multiple neutron capture by the same nucleus. The irradiation time for the calculations is 106 s (11.5 days), that will be approximately an operation cycle for ESS.
The activity of an isotope after irradiation and cooling time is given by Eq. 5,
| (5) |
where is the activity reached by the end of the irradiation.
In order to express the results in activity concentration, the total activity of the isotopes are normalised with the total volume of the respective material. The volume of aluminium and copper for the five detector panels are VAl=14447 cm3 and VCu=822 cm3. The activity concentration of the isotopes of interest during irradiation and cooling are presented in Fig. 9.
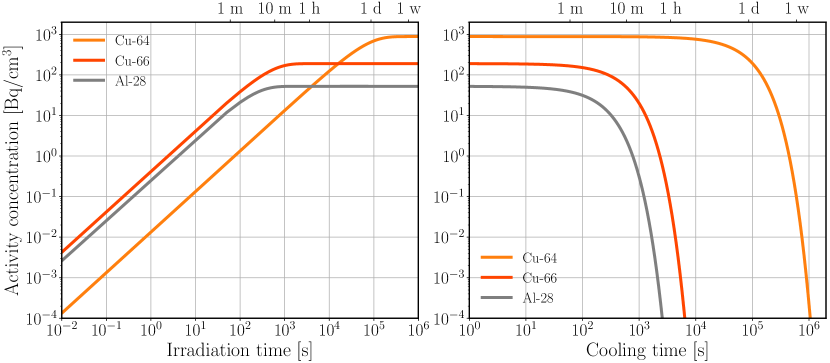
The results show that the activity concentration of the produced radionuclei saturates by the end of irradiation time. These end values are used to calculate the decay gamma emission of these radionuclei from a unit volume per second. In this study the gamma efficiency is approximated conservatively with 10-7 [5, 38] for all photon energies. Due to the constant gamma efficiency, only the total number of photons per decay has to be determined regardless of the photon energies. In order to do that, the yields of the possible decay gamma lines presented in Table 3 are summed, resulting in a gamma yield of =1.0, =4.7310-2, =9.2210-2 photons per decay. In addition to decay gammas, 64Cu emits a positron in 17.40% of the decays, that will produce 2 photons of 511 keV by annihilation. These photons dominate the total gamma yield of 64Cu, that is =0.353. The x-rays from decay and the bremsstrahlung of the emitted electrons are neglected due to their low energy compared to a reasonable pulse height threshold.
| Isotope | E [keV] | Yield [%] | Flux to dose [] |
|---|---|---|---|
| Al-28 | 1778.969 | 100 | 0.02473 |
| Cu-64 | 1345.84 | 0.473 | 0.02028 |
| Cu-64* | 511 | 34.8 | 0.00907 |
| Cu-66 | 833.537 | 0.220 | 0.01387 |
| Cu-66 | 1039.231 | 9 | 0.01666 |
| Cu-66 | 1333.120 | 0.0037 | 0.02013 |
With the saturation activity concentration values of AAl-28=52.3 Bq, ACu-64=881 Bq and ACu-66=190 Bq, the gamma intensities are Id,Al-28=52.3 s-1, Id,Cu-64=331 s-1 and Id,Cu-66=17.5 s-1 for a unit volume. For the total volume of aluminum and copper, the gamma intensity is I=7.55105 s-1 and I=2.70105 s-1. The total decay gamma intensity for the whole detector system is I=1.025106 s-1.
The prompt gamma intensity () for aluminium and copper is calculated as the product of the neutron absorption intensity and the total prompt gamma yield per absorption () for each material (see Eq. 6).
| (6) |
The number of prompt gammas per absorption is estimated as the ratio of the sum of the gamma line specific cross-sections () and the absorption cross-section () [47]. Due to the gamma cascades, this ratio is not unity, the resulting yields are =1.978 and =2.665. The prompt gamma intensities are IAl=1.493106 s-1, ICu=2.345106 s-1 and the total prompt gamma intensity is I=3.839106 s-1.
The total prompt and decay gamma intensity of aluminium and copper is Iγ=4.864106 s-1. This intensity is so low that it is overruled by the intensity of photons from the conversion process. In about 94% of the neutron conversions in 10B, a 0.48 MeV gamma is emitted [48]. Using the relative absorption ratio of B4C for 3 Å neutrons from the absorption section, neglecting the neutron absorption of carbon and 11B, 25.31% of the incident neutrons are converted. This translates to a gamma intensity of I=1.190107 s-1 from the converter layer. As this is the key source of photons, the total gamma intensity of the detector system for the observed neutron flux is on the order of 107 for all relevant wavelengths. With a gamma efficiency of the BCS detectors on the order of 10-7, the gamma background coming from the detector itself is negligible compared to the detected neutron intensity on the order of 107 n/s.
In terms of dose rate after the irradiation, the detector system can be approximated as a surface source of 100100 cm2, emitting photons with the source intensity and energy corresponding to the decay gamma intensity and energy of the activated isotopes. The resulting fluxes at the end of the irradiation time are =37.75 cm-2s-1, =12.78 cm-2s-1, =0.72 cm-2s-1. The fluxes are dominated by the 1778.969 keV, 511 keV and 1039.231 keV energy photons, respectively, so the fluxes are turned into dose rate with the corresponding flux to dose rate conversion factors presented in Table 3. The resulting dose rates are =0.934 Svh-1, =0.116 Svh-1 and =0.012 Svh-1 with the total value of =1.062 Svh-1. The dose rate after certain cooling time can be calculated in the same way and the results can be scaled for similar detector setups.
As already mentioned, the obtained results correspond to pure unalloyed materials; alloyed materials and impurities may significantly increase the activity and dose rate due to isotopes with high cross-section or long half-life. This investigation assumed cold neutrons and single neutron activation, but for fast neutrons other reaction, like 63Cu(n,)60Co or 63Cu(n,p)63Ni must be taken into consideration.
6 Scattering
Another side effect of the increased detector material budget due to the multi panel layout is the scattering of neutrons. In contrast to absorption, scattering can degrade the detector performance by producing intrinsic background, which in turn can impact the signal to background ratio. The latter is a driving requirement in particular for inelastic neutron instruments and has to be carefully considered in the detector design process.
The definition of signal and background depends on the detector application, as different quantities might be relevant for the respective measurement technique. Moreover, there are different ways to quantify scattering in a detector, each giving a different but still valid insight. A series of studies have already quantified the effect for the Multi-Blade and the Multi-Grid detectors [49, 50, 51]. In the study that follows, rather than only look at the SANS application initially foreseen for BCS; all quantities of interest are looked at, so that the results may be considered in the context of all techniques, i.e. reflectometry, diffraction and spectroscopy.
6.1 Quantities of interest
The following raw (in boldface font) and derived quantities are of interest for the scattering study:
-
1.
X: position along the straws (along the wire).
-
2.
Y: position perpendicular to the straws.
-
3.
TOF: neutron time of flight from the source until the detection.
-
4.
: polar angle calculated from the source and the detection event X and Y positions.
-
5.
: azimuthal angle calculated from the source and the detection event X and Y positions.
-
6.
: neutron wavelength calculated from the distance between the source and the detection event position (SDD) and the TOF, using Eq. 7 as
(7) where is the Planck constant, is the neutron mass and the velocity.
-
7.
E: neutron energy calculated from .
-
8.
Q: scattering vector calculated from and , using Eq. 8 (SANS definition):
| (8) |
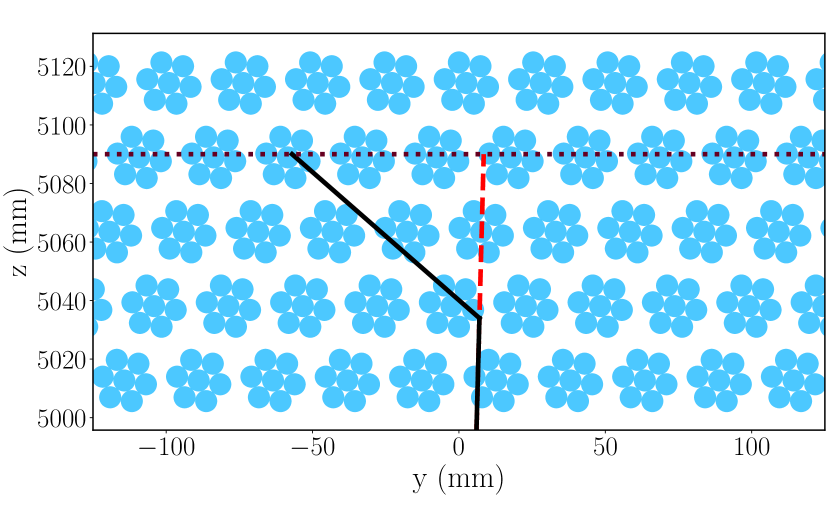
Scattering, elastic and inelastic, leads to a change in the detection coordinates and subsequently in all derived quantities in almost every case. To quantify this change, the ideal values of these quantities must be defined for each neutron. These values correspond to a non-scattered neutron generated with the same initial parameters. Without scattering, the neutron and direction ( and ) remain unaltered. The ideal values of these parameters are easy to define. Q is derived from and so its ideal value is also straightforward to estimate. For the remaining quantities an ideal detection point and time have to be defined. This could be done in many ways but for this study it is defined as the position extrapolated from the source’s position and the neutron’s initial and to the Z plane of the actual detection event, as demonstrated in Fig.10. From the ideal detection coordinates the ideal X, Y and TOF values are calculated. The difference of the simulated and ideal quantities are referred to hereinafter as X (=Xsim-Xideal), Y, and so on.
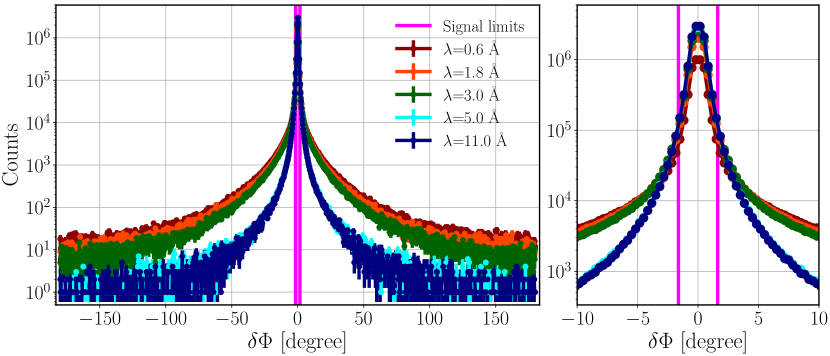
Due to the statistical behavior of the detection process, and discrete Y and Z detection coordinates defined by the anode wires, the quantities are not zero even for the non-scattered neutrons. Therefore, in order to decide what is signal and what is background, an upper and a lower limit are selected for all quantities. The detection events with a value within the limits are counted as signal for the respective quantity.
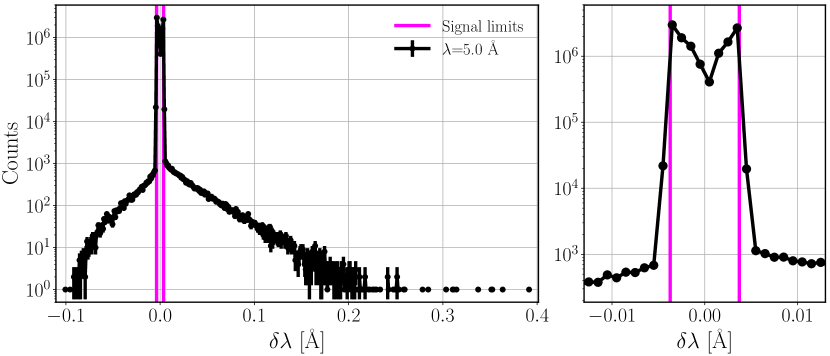
Fig. 11 demonstrates the process of finding the signal limits for X.
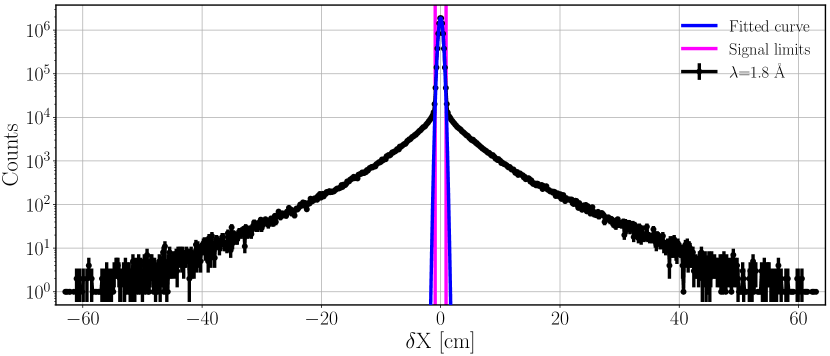
A Gaussian function is fitted to the distribution, and the limits are defined as the mean value 3. The same method cannot be applied to Y, as Fig. 12 shows clearly that a Gaussian fit is not appropriate. The shape in the centre is the result of using the position of the wire in the centre of the straw instead of the exact coordinates of the detection event. The maximum difference in Y caused by using the wire coordinate is the outer radius of the converter layer. The peak corresponds to this difference so all neutrons which follow a straight line until their conversion are contained in it. This means that the straightforward limit for the separation of signal and background is the outer radius of the converter layer, which is the same as the inner radius of the straw.
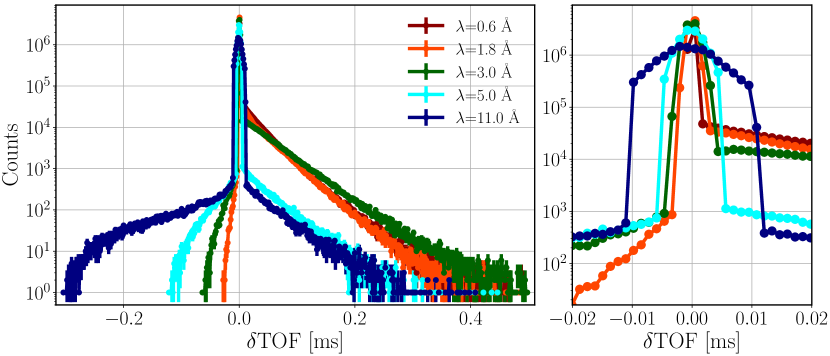
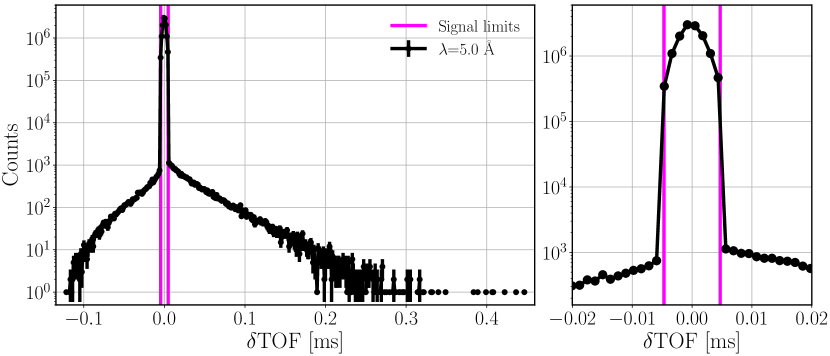
TOF is the difference of the simulated TOF and the ideal TOF. The former is the time until the neutron reaches its conversion point from the source plus the time until the conversion products deposit enough energy to overcome the applied detection threshold. The TOF of the conversion products is negligible compared to the TOF of the neutrons for any relevant distance because they have a much higher velocity due to their initial kinetic energy, so the simulated TOF is practically the TOF of the neutrons until the conversion point. The ideal TOF is calculated from the initial wavelength and the distance between the source and the ideal detection point. For a non-scattered neutron the wavelength, and therefore the velocity does not change, so TOF comes from the different distances from the source to the conversion point and to the ideal detection point. This distance is related to the ion range, that appears to agree with the radius of the straws. Therefore, the TOF limits to separate signal and background are calculated from the TOF difference caused by this spatial difference, that depends on the neutron velocity so different limits are defined for the wavelengths of interest.
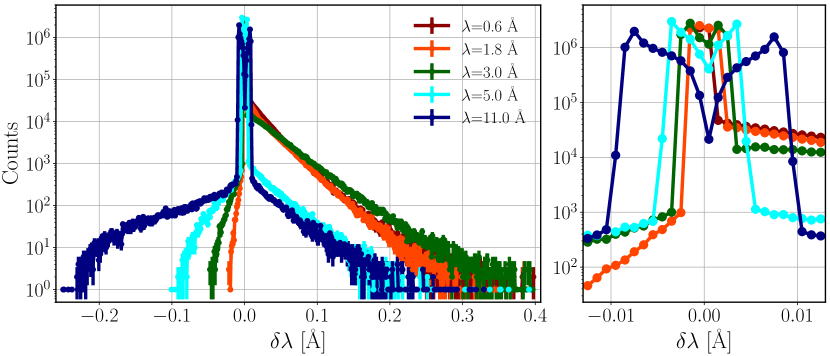
The effect of the discrete Y and Z detection coordinates also appears for . The ideal is calculated from the TOF and the source to detection point distance (SDD) according to Eq. 7, but for the simulated , the distance between the source and the detection event wire coordinates (SWD) is used. The maximum difference between source to detection point distance and source to detection event’s wire coordinates distance is the inner radius of the straw. The resulting difference for a non-scattered neutron is calculated using Eq. 9
| (9) |
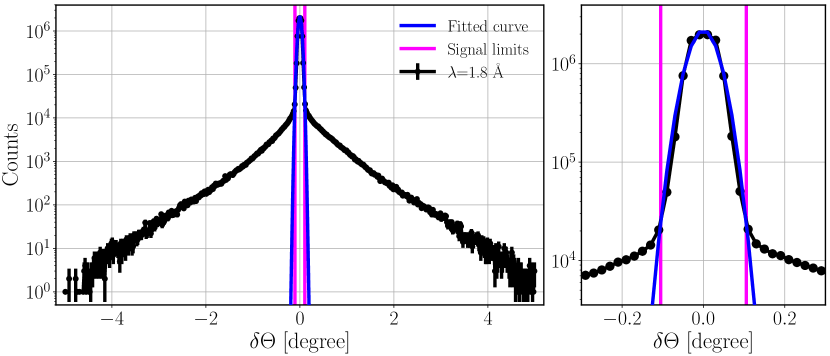
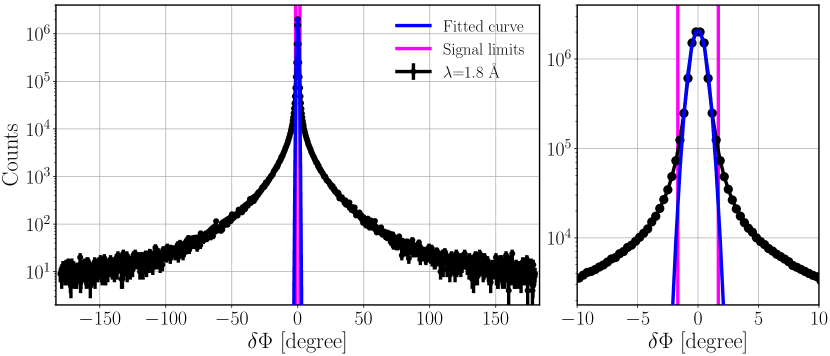
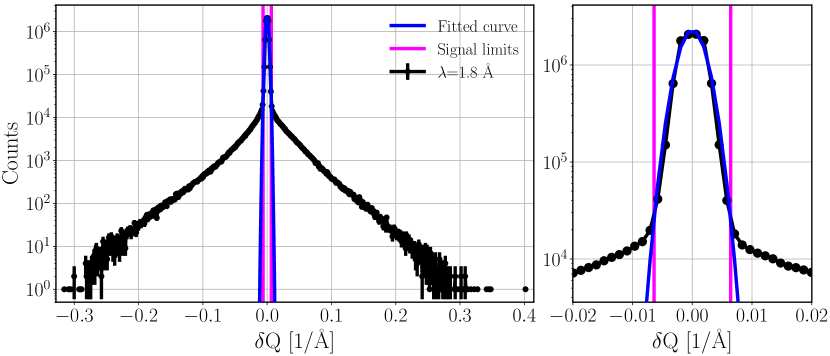
depends on the SDD and the corresponding TOF. The highest difference, that gives good limits for the signal and background separation appears for the shortest SDD, that is 5 m. The TOF and therefore the limits depend on the initial velocity of the neutrons, so different limits are defined for the 5 wavelengths of interest. Neutron energy is calculated directly from , so the signal and background separation for is valid for E, and therefore not repeated. The limits for , and Q are defined the same way as for X, by fitting a Gaussian function. The Q limits are wavelength dependent, so they are defined for each wavelength of interest.
For all quantities where the limits are defined by the parameters of the fitted Gaussian function, the mean is at least 3 orders of magnitude lower than the standard deviation, so for simplicity zero is used instead. This means that the range for any quantity, within which a detection event is considered as signal is the corresponding limit. The width of all signal ranges are presented in Tab. 4 and Tab. 5. The figures showing the limits visually, similarly as for X (Fig. 11) and Y (Fig. 12), are placed in appendix (see Fig. 33–37). The separation of signal and background using the limits is applied on the raw data instead of the histograms, to avoid possible distortions caused by the arbitrary binning choices.
| Quantity | Width of signal range |
|---|---|
| X [cm] | 1.75 |
| Y [cm] | 0.75 |
| [degree] | 0.21 |
| [degree] | 3.25 |
| Quantity | Width of signal ranges for different wavelengths | ||||
|---|---|---|---|---|---|
| 0.6 Å | 1.8 Å | 3 Å | 5 Å | 11 Å | |
| TOF [s] | 0.57 | 1.70 | 2.83 | 4.71 | 10.63 |
| [Å] | 4.510-4 | 1.3410-3 | 2.2410-3 | 3.7310-3 | 8.2010-3 |
| Q [1/Å] | 1.9510-2 | 6.310-3 | 3.810-3 | 2.210-3 | 1.010-3 |
6.2 Impact of scattering on spatial resolution
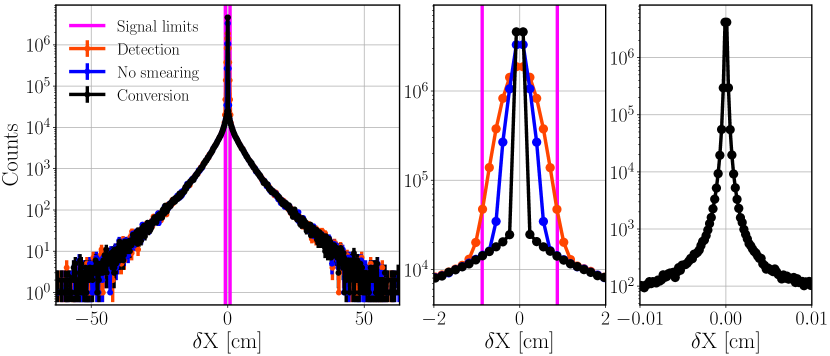
The FWHM of the X distribution is 0.67 cm, which is a convolution of the detection coordinate approximation with the weighted average of the deposited energy by the conversion products and the applied smearing with a FWHM of 0.6 cm. Small local scatterings could also cause the broadening of the peak. In order to evaluate this effect, the X distribution is shown in Fig. 13 consecutively estimated with the neutron conversion coordinates, the approximated detection coordinates and finally with the application of position smearing on top of the latter. The results demonstrate that the broadening of the peak because of scattering inside the detector is negligible compared to the other processes of the detection. This means that scattering inside the detector does not affect the spatial resolution of the detector.
6.3 Impact of panels and material budget
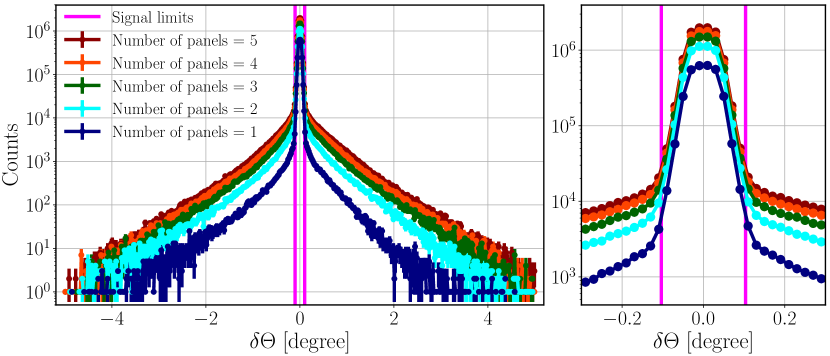
Fig. 14 depicts for a different number of detector panels for 1.8 Å neutrons. It can be seen that the overall fraction of scattered background increases with the number of panels. The increase of the scattered background with every additional panel has two components. First, there are scattered neutrons detected in the downstream panels. Second, there are neutrons backscattered from the downstream panels that are detected upstream.
In order to distinguish the scattering effects of the different materials, simulations are performed with 4 different detector models derived from the original one by leaving out some of the materials. All of the models included the Ar/CO2 gas and the B4C layer as they are indispensable for the detection. One of the models had nothing more in it, and two others included either the copper straws or the aluminium tubes. The last one was the original model with both aluminium and copper in place.
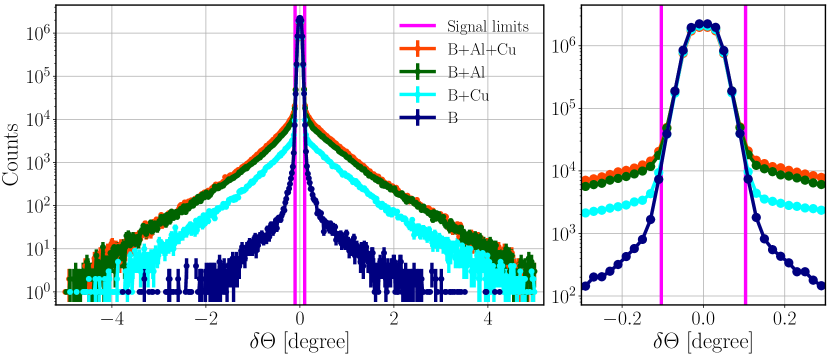
Fig 15. depicts for the different detector models with 1.8 Å neutrons. Though the quantitative approach to determine the amount of relative scattering is presented in section 6.5, it is already visually clear that the original model that contains all materials produces the highest scattered background. From the simulations with either aluminium or copper left out, it is clear that aluminium is the main source of the scattering. Similarly to absorption, the scattering cross-section of copper is generally much higher (approximately 5 times higher for 1.8 Å), but in this case the difference is not high enough to compensate the presence of 17.6 times more aluminium.
For the rest of the quantities the scattered background shows similar trends as a function of number of panels and detector materials, therefore only their wavelength dependence is presented using the original model of 5 detector panels with all materials in place.
6.4 Impact of neutron wavelength
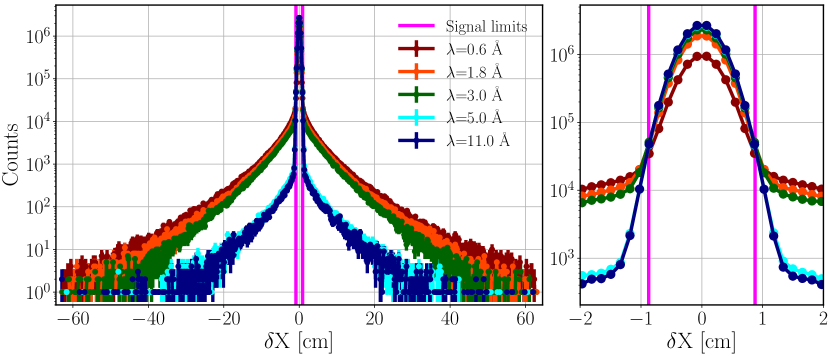
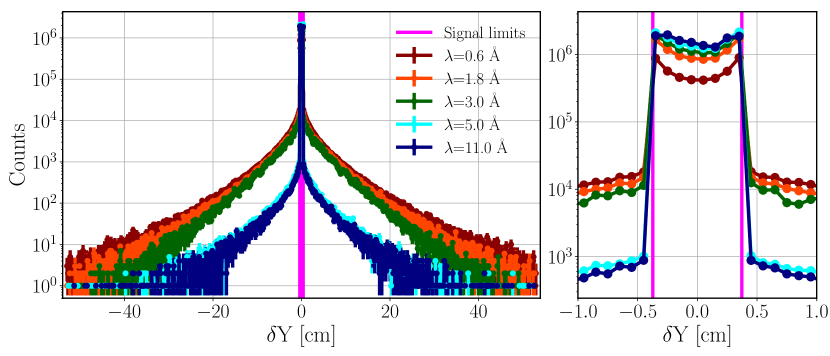
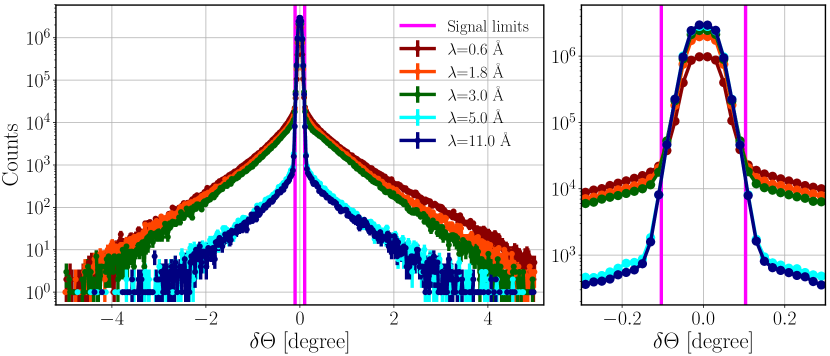
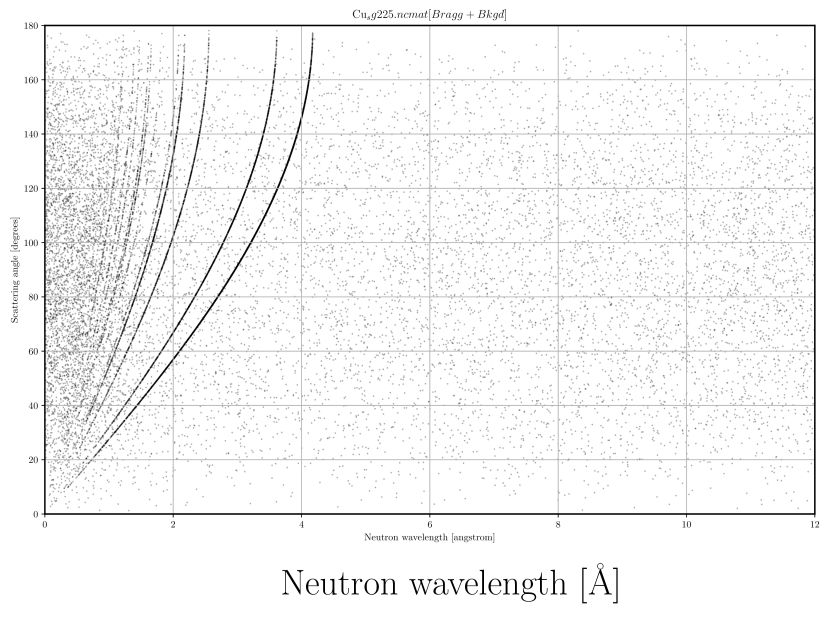
Fig. 16 depicts X for various monoenergetic neutron beams. For all wavelengths there is a peak inside the signal range and tails on both sides outside the limits, so it is visually easy to separate the signal and the scattered background. The first and most notable thing is that for higher wavelengths the background gets lower. This is not a trivial result, because in some regions the total scattering cross-section of aluminium and copper increases, and with the higher conversion and detection efficiency due to the also increased absorption cross-section of the B4C, more and more of the scattered neutrons are detected. On the other hand, the increased absorption in the converter layers reduces the average path length of the neutrons in aluminium and copper, and therefore the amount of scattering. The results show the latter effect is stronger. The significant drop in the background between 3 Å and 5 Å is the result of the Bragg cut-off that is at 4.174 Å for copper and 4.676 Å for aluminium (see Fig. 32 in appendix). Above these wavelengths, there is no Bragg scattering in the materials, only incoherent, and coherent inelastic scattering. Figures 17–19 demonstrate the same effects for Y, and . Even though shows non-gaussian shape, the signal defined by the limits from fitting Gaussian function is in good accordance with signal from other quantities.
The simulated is not necessarily equal to the physical wavelength of the detected neutron. It is a measured that is calculated from TOF with Eq. 7, hence and TOF are closely connected. Scattering inside the detector can change the TOF in two ways: by changing the direction and the wavelength of the neutron, in case of inelastic scattering. Both effects have a complex impact on TOF, leading to either increase or decrease thereof. A change in the direction can greatly increase the path length of a neutron inside the detector but it can also decrease it in case the next converter layer is closer in the new direction. Thermalisation through scattering generally leads the neutrons toward thermal neutron wavelength but for the wavelength range of interest between 0.6–11 Å this can mean both increase and decrease. With increased wavelength the neutrons travel slower inside the detector, which could result in higher TOF. On the other hand, higher wavelength also implies a higher absorption cross-section and therefore possibly a shorter path length, and the other way around. The cumulative effect is shown in Figs. 20 and 21. For shorter wavelengths clearly the positive values are dominant. This means that for these neutrons TOF generally increases due to scattering and so does the resulting . Going for longer initial wavelengths, the negative side becomes more and more significant. This proves that shorter measured TOF and as a result of scattering can be just as important as longer.
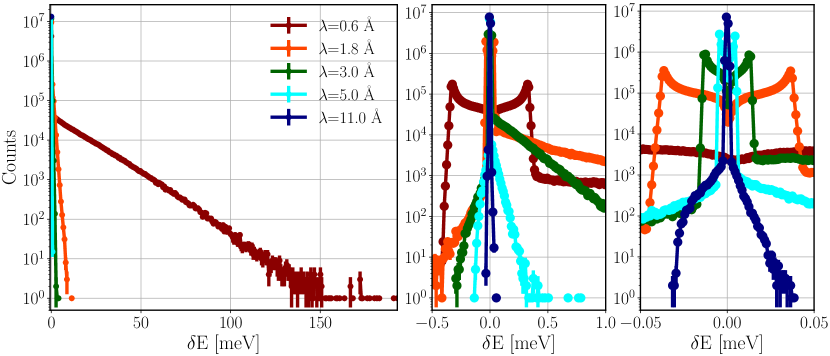
The change in the measured due to scattering inside the detector can be expressed in terms of change in the measured neutron energy, that can be important when observing energy transfer in real samples. Fig. 22 depicts the change in the measured energy for different wavelengths. The scale of E depends on the initial , so different ranges are highlighted in the subplots to provide information about the relevant wavelengths.
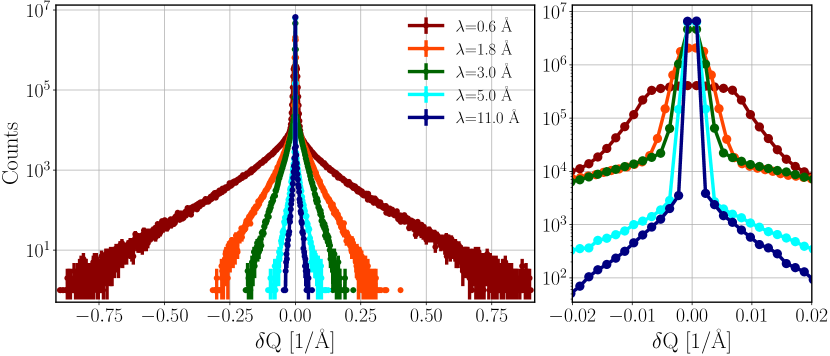
Q is derived from and (see Eq. 8) so Q depends on all phenomena mentioned earlier in connection with these quantities. The results are depicted in Fig. 23. The wavelength dependency of both the signal and the background is visible. Simulations with low values give higher scattered background and broader signal peaks.
6.5 Definition of fractional scattering
Signal and background relation can be characterised by several quantities. A common way to express it in neutron scattering is the peak-to-tail ratio, that can be visually extracted from the presented figures. However, this ratio does not quantitatively reflect the total amount of signal or background and in addition it is sensitive to the histogram binning. Instead, a different figure of merit is used that provides fractional scattering in terms of integrals, as defined by Eq. 10:
| (10) |
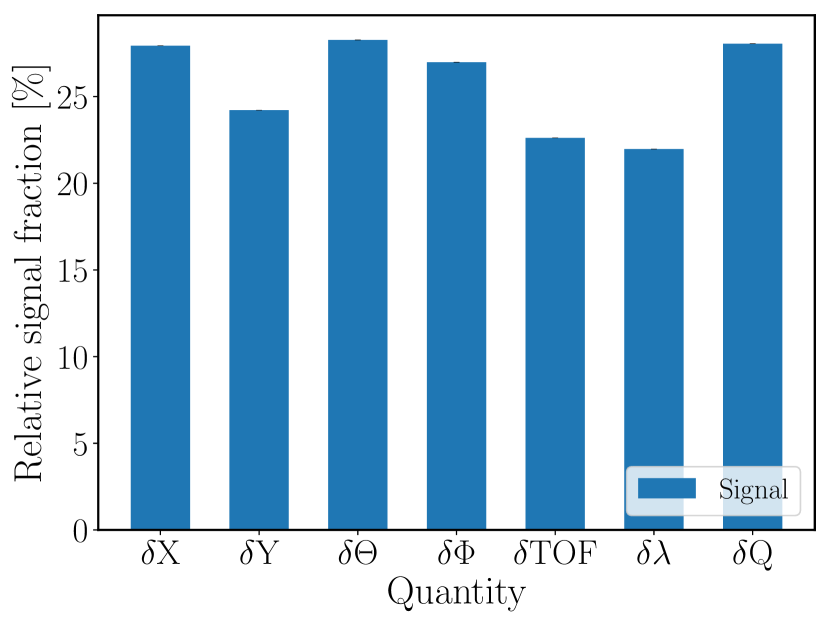
where and denote the number of detected neutrons considered as signal and background respectively. Although the shape of signal and background varies for the observed quantities, Fig. 24 demonstrates that the integrals of the previously defined signal ranges are similar within less than a 3% range. This means that any of the quantities and the signal limits thereof lead to essentially the same fractional scattering values. The following results are acquired using for signal-background separation.
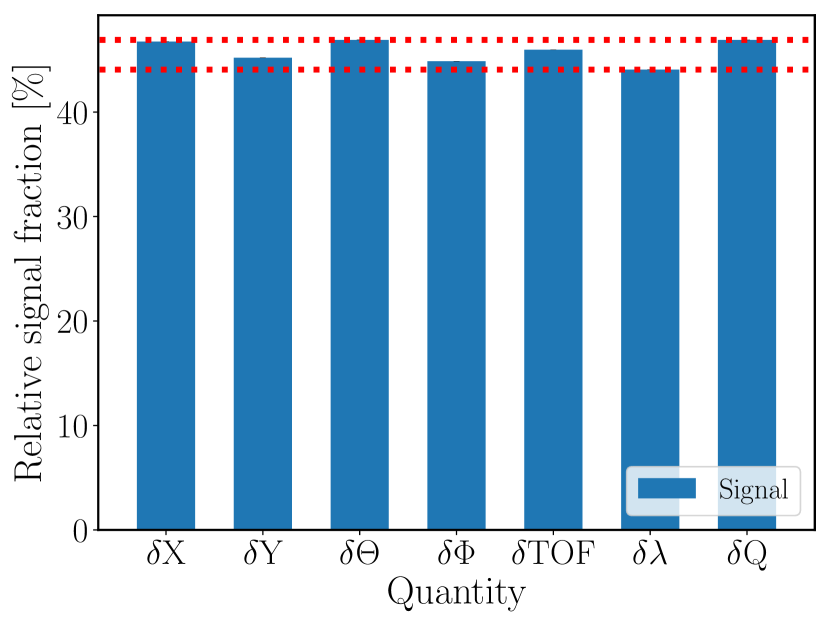
Fig. 25 depicts the fractional scattering for 3 wavelengths for a different number of panels, as the latter are added one-by-one to the geometry. It was shown before that additional panels not only increase the signal, but the scattered background as well as, via the detection of more scattered neutrons and the back-scattering of neutrons to upstream panels. This result shows that the ratio of signal to background degrades with the additional panels, because the fractional scattering increases monotonously. This is more notable for low wavelengths, where the differences are higher, but the tendency is the same for 11.0 Å. For the same number of panels, fractional scattering is always higher for neutrons with shorter initial .
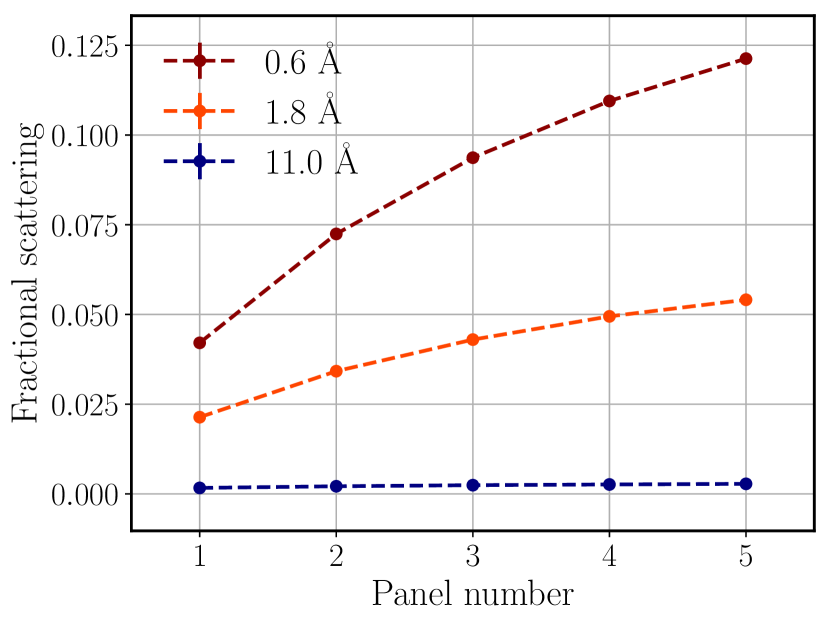
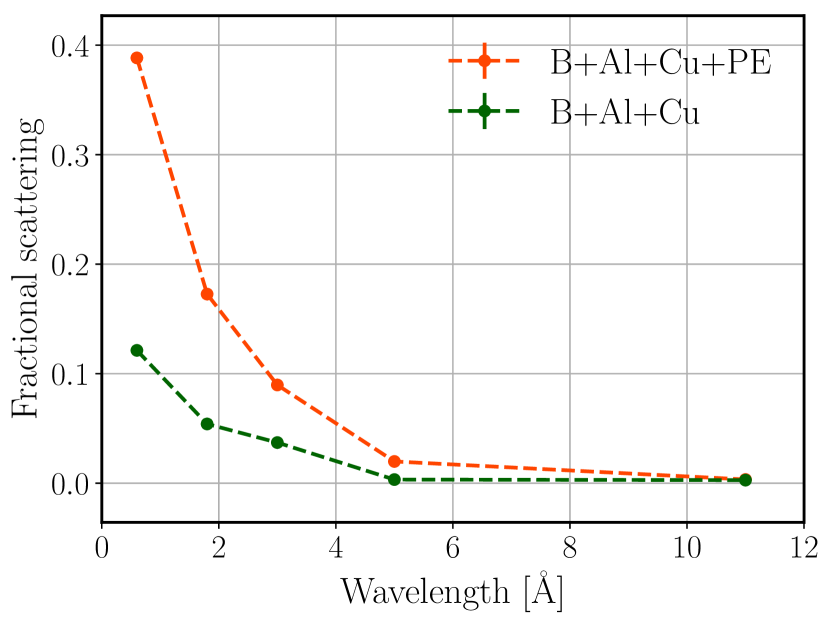
Fig. 26 demonstrates the fractional scattering for different wavelengths with 5 panels of detectors, using the 4 models with reduced materials, mentioned earlier in this section. Additional materials increase the fractional scattering for all and in agreement with previous results, aluminium has a higher impact on scattering than copper, which manifests itself in higher fractional scattering values too. It can be seen that scattering is a very important background effect to be minimized below the Bragg cut-off.
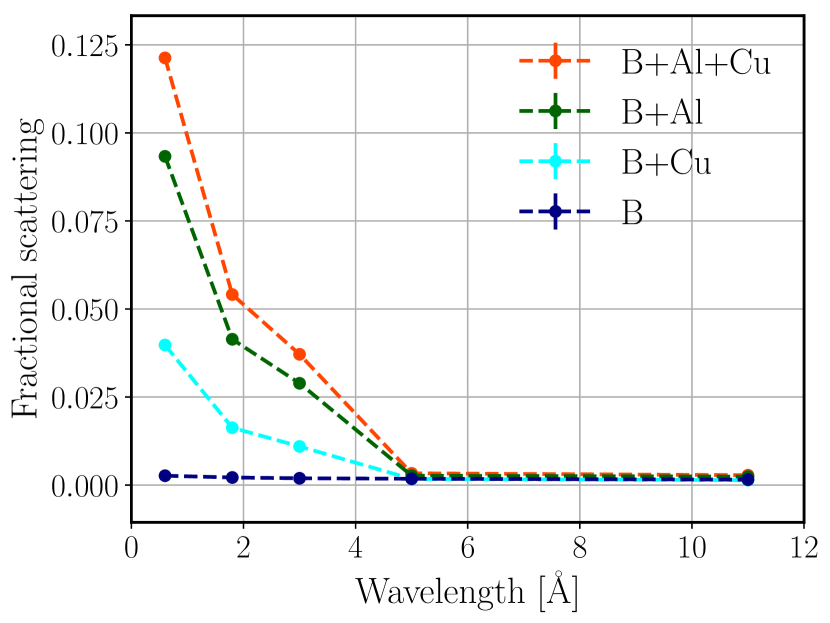
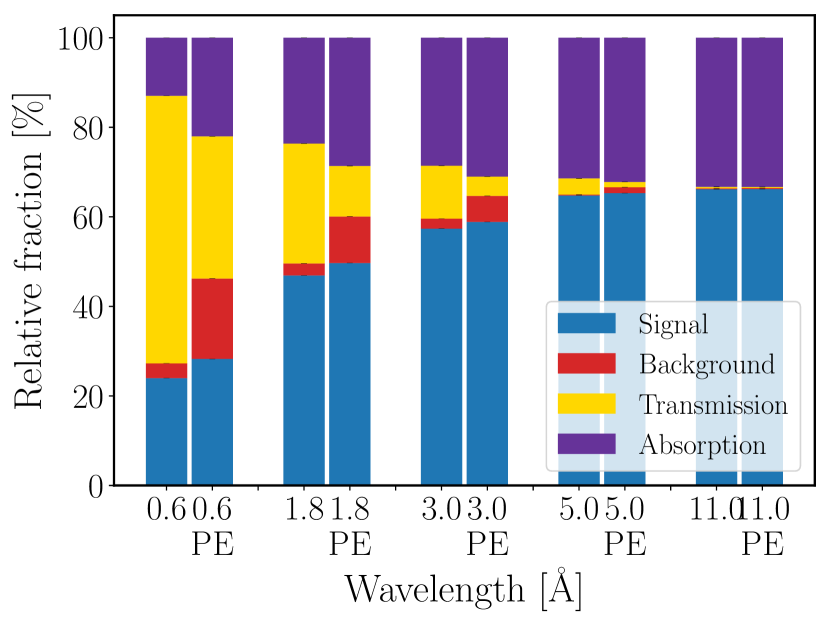
Fig. 27 presents similar information to Fig. 8 with two changes. First, the absorption in different materials is merged in a single color (purple). Second, the detection is separated into signal and background using limits once again.
7 Polyethylene “afterburner” block behind the detector
As previously demonstrated, for short wavelengths such as 0.6–1.8 Å respectively 60–27% of the neutrons can escape even 5 panels of detectors without being absorbed in any of the materials. The detector performance could be possibly improved by applying additional panels of detectors but that might not be the most cost-efficient solution, taking into account that there is little to gain for longer wavelengths. However, there is a cheap and easy option to increase detection efficiency by placing a strongly scattering material at the backside of the detectors [52]. The principle is to back-scatter any transmitted neutron forcing it to enter the detectors again, giving it a further opportunity for conversion and detection. In the study cited above it was shown that the detection efficiencies can be enhanced by applying a single layer of polyethylene (PE) behind the detectors. It is emphasised, however, that as a side effect the scattering in the back-scatterer layer has a negative impact on the resolution of the detector so the combined effect should be carefully examined.
The definition of signal and background from the previous section offers a practical way to decide whether this technique is advantageous or not for the BCS detector. To investigate this, a PE layer is placed closely behind the fifth panel of detectors as illustrated in Fig. 28. The Geant4 physics list used for these simulation is ESS_QGSP_BIC_HP_TS [52].
The highest gain from the back-scattering of transmitted neutrons is achieved for low wavelengths. Fig. 29 demonstrates the impact of the additional PE layer on for the lowest observed wavelength, =0.6 Å. This result shows a significantly increased background with a slightly increased signal.
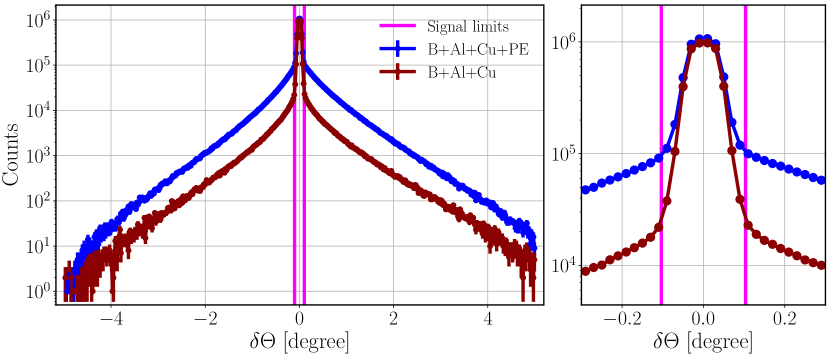
Fig. 30 demonstrates that the PE layer has a different effect on the different quantities. The signal defined by the limits for is 6.3% higher than for . This difference is more than double of any previously experienced. This implies that the fractional scattering depends much more on the signal definition.
The focus here is on the case with the highest gain, so the fractional scattering results presented in Fig. 30 are calculated with the highest signal from . Even with this favourable definition, the ratio of the scattered background appears to be higher with the back-scattering layer than without it. For the highest wavelength there is no difference but going to lower where the PE should help, the fractional scattering becomes significantly worse.
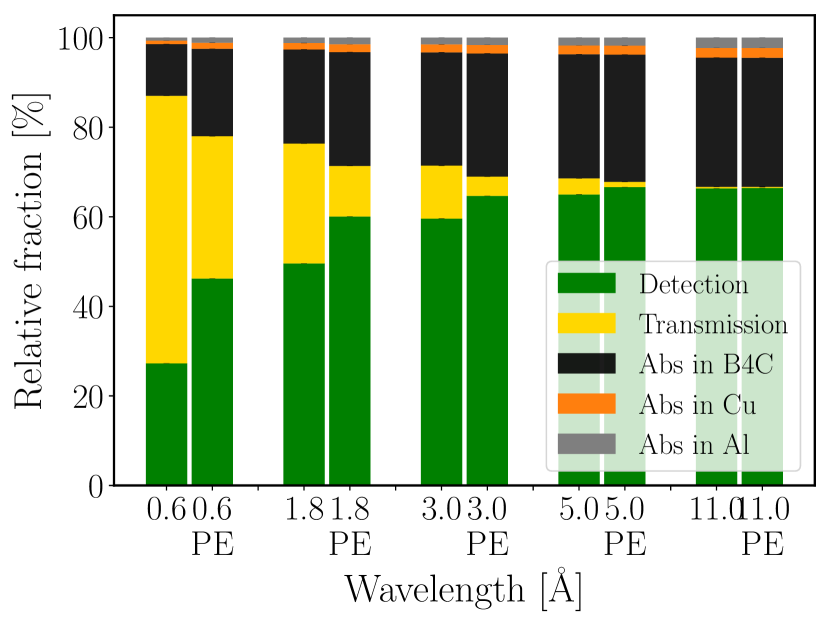
This is in agreement with what can be derived from Fig. 31 showing the effects of PE from various aspects. For higher wavelengths, where the transmission is negligible, there is practically no change but for lower wavelengths the significant drop in the transmission leads to increase in all other areas. Due to the longer path length in copper and aluminium there is more absorption in these materials, nevertheless it remains a minor effect. The vast majority of the back-scattered and not transmitted neutrons are absorbed in the converter layer with the usual detected/not detected ratio. This means that the detection efficiency is effectively enhanced by the PE layer. On the other hand the separation of detection events into signal and background shows that the additionally detected neutrons mostly increase the background, not the signal. Where most gain is expected, for =0.6 Å, the 4.3% increase in the ratio of the signal is followed by a 14.6% increase in the background. This implies that the only application where a PE afterburner may be beneficial is homeland security, where position resolution is not a concern. These results re-emphasise that it is vital to ensure that whilst polyethylene or other hydrogen containing materials are ubiquitous in neutron shielding, next to the detector, the shielding material must have no albedo effect from scattering of thermal neutrons.
8 Conclusions
A generic BCS detector model is implemented for Geant4 simulations. With this, a complex analysis is carried out in order to evaluate various aspects of the BCS detector performance. This study is made in the context of most realistic applications that might be envisaged. The aim is to have a complete set of generally applicable results.
The detection efficiency of a single straw, and even of complete detector tubes with seven straws are shown to be low, as expected. Therefore, overlapping layers (panels) of detectors are needed to achieve a decent efficiency. The cost-efficient number of panels depends on the application and the relevant neutron wavelength range.
The absorption (not resulting in conversion to detectable particles) in B4C is 6.5–8 times more than in Al and Cu combined. The absorption from these two mechanical materials in the detector is in the range of 1.5–4.5% of the incident neutrons depending on the wavelength. Pure unalloyed material was modeled in the study; alloyed materials and impurities may significantly increase this and need to be considered. At smaller wavelengths the fraction of neutrons transmitted through the detector is high (50–60% at 0.6 Å) and therefore absorbant shielding behind the detector is a must for applications below 5Å.
Activation analysis of such a detector has been implemented. The activation is dominated by copper, as expected, with a cooling time of a few days. The radiation background from activated materials will not interfere with the data acquisition. The activation during operation at ESS is not expected to be a limitation for maintenance. The calculated numbers have been presented in a fashion that could be scaled to real applications.
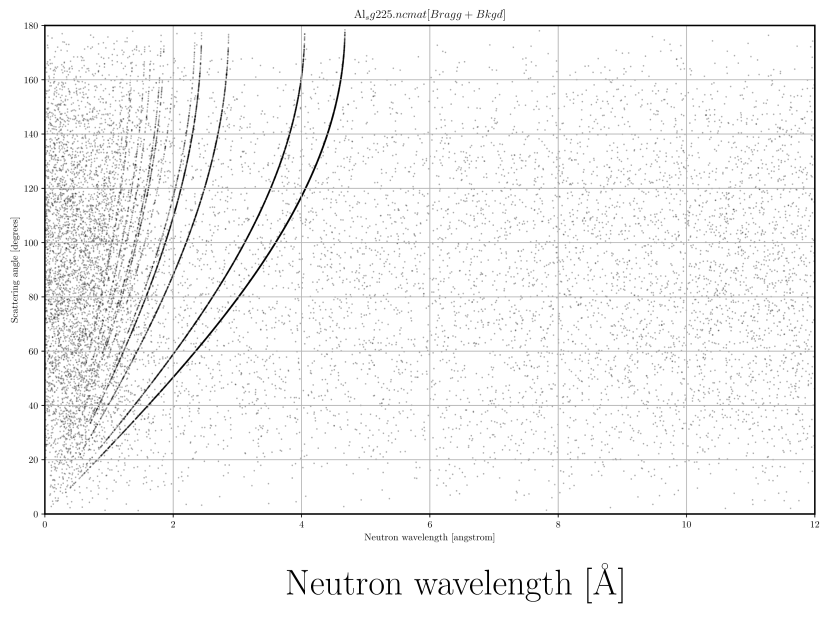
The scattering has been studied in detail, namely its effect on X, Y, TOF, , , , E and Q in terms of the fraction of neutrons that end up as signal, scattered background, transmission through the detector or absorbed and non-detected. The effect of the detector geometry on the natural shape of the resolution function is shown. Scattering is highest at low wavelengths and is significant below the Bragg cut-off. It can be considered to be at acceptable levels for applications such as SANS and diffraction, however, may be considerable for applications which are highly sensitive to it such as spectroscopy. Any application for spectroscopy would need detailed consideration of its effect on performance.
A polyethylene “afterburner” block placed behind the detector was investigated and found to increase signal by up to 4%, however, background correspondingly increased up to 15%. Therefore this is not a good solution for most applications. It also re-emphasises the need for the layer of shielding closest to the detector to be made of materials with very low neutron albedo.
Acknowledgements
This work has been supported by the In-Kind collaboration between ESS ERIC (contract number: NIK5.4 #10 [ESS]) and the Hungarian Academy of Sciences, Centre for Energy Research (MTA EK). The authors would like to thank the DMSC Computing Centre [53] which provided the computing resources for the simulations. Richard Hall-Wilton and Kalliopi Kanaki would like to acknowledge support from BrightnESS [EU Horizon2020 grant 676548].
Appendix
The capabilities of Geant4 are enhanced by the NCrystal library [34, 35] in order to treat the thermal neutron transport correctly in crystalline materials by taking into account the material structure and effects of inter-atomic bindings. With this tool aluminium and copper are treated as crystalline materials with the cross-sections presented in Fig. 32.
Figures 33–34 demonstrate the signal limits defined for and (similarly as Figures 11–12 demonstrated the limits for X and Y). In addition, as an example, Figures 35–37 depict the signal limits for TOF, and Q for one of the wavelengths of interest.
References
References
- [1] A. Cho, Helium-3 Shortage Could Put Freeze On Low-Temperature Research, Science 326 (5954) (2009) 778–779. doi:10.1126/science.326_778.
- [2] T. M. Persons, G. Aloise, Technology Assessment: Neutron Detectors: Alternatives to Using Helium-3, GAO-11-753.
- [3] O. Kirstein, et al., Neutron Position Sensitive Detectors for the ESS, PoS Vertex2014 (2014) 029. arXiv:1411.6194, doi:10.22323/1.227.0029.
- [4] I. Stefanescu, et al., A 10B-based neutron detector with stacked MultiWire Proportional Counters and macrostructured cathodes, Journal of Instrumentation 8 (12) (2013) P12003–P12003. doi:10.1088/1748-0221/8/12/p12003.
- [5] J. L. Lacy, et al., The Evolution of Neutron Straw Detector Applications in Homeland Security, IEEE Transactions on Nuclear Science 60 (2) (2013) 1140–1146. doi:10.1109/TNS.2013.2248166.
- [6] A. Khaplanov and others, Multi-Grid Detector for Neutron Spectroscopy: Results Obtained on Time-of-Flight Spectrometer CNCS, JINST 12 (2017) P04030. doi:10.1088/1748-0221/12/04/P04030.
- [7] A. Muraro and others, Performance of the high-efficiency thermal neutron BAND-GEM detector, Prog. Theor. Exp. Phys. 023H01. doi:10.1093/ptep/pty005.
- [8] L. Margato, A. Morozov, Boron-10 lined RPCs for sub-millimeter resolution thermal neutron detectors: conceptual design and performance considerations, Journal of Instrumentation 13 (08) (2018) P08007–P08007. doi:10.1088/1748-0221/13/08/p08007.
- [9] L. Margato, et al., Boron-10 lined RPCs for sub-millimeter resolution thermal neutron detectors: Feasibility study in a thermal neutron beam, Journal of Instrumentation 14 (01) (2019) P01017–P01017. doi:10.1088/1748-0221/14/01/p01017.
- [10] R. Qiao, et al., Charge reconstruction study of the dampe silicon-tungsten tracker with ion beams, Nuclear Instruments and Methods in Physics Research Section A: Accelerators, Spectrometers, Detectors and Associated Equipment 886. doi:10.1016/j.nima.2018.01.007.
- [11] A. Mazzone, et al., GEANT4 simulations of a novel 3He-free thermalization neutron detector, Nuclear Instruments and Methods in Physics Research Section A: Accelerators, Spectrometers, Detectors and Associated Equipment 889. doi:10.1016/j.nima.2018.02.011.
- [12] A. Kok, et al., Silicon sensors with pyramidal structures for neutron imaging, Journal of Instrumentation 9 (04) (2014) C04011–C04011. doi:10.1088/1748-0221/9/04/c04011.
- [13] J. Sykora, et al., ZnO:Zn/6LiF scintillator - A low afterglow alternative to ZnS:Ag/6LiF for thermal neutron detection, Nuclear Instruments and Methods in Physics Research, Section A: Accelerators, Spectrometers, Detectors and Associated Equipment 883 (2018) 75–82. doi:10.1016/j.nima.2017.11.052.
- [14] G. J. Sykora, et al., Large area wavelength shifting fibre thermal neutron detectors using 64 channel flat panel PMTs, in: 2015 IEEE Nuclear Science Symposium and Medical Imaging Conference (NSS/MIC), 2015, pp. 1–4. doi:10.1109/NSSMIC.2015.7581838.
- [15] C. L. Wang, et al., Wavelength-Shifting-Fiber Scintillation Detectors for Thermal Neutron Imaging at SNS, IEEE Nuclear Science Symposium Conference Record HE4-3.
- [16] S. Jaksch and others, Recent Developments SoNDe High-Flux Detector Project, JPS, Proceedings of International Conference on Neutron Optics (NOP2017).
- [17] S. Jaksch, et al., Cumulative Reports of the SoNDe Project, arXiv:1707.08679.
- [18] M. Katagiri, Neutron detectors with scintillators using ZnS: Ag phosphor: Development summary, IEEE NSS, Anaheim (He-2-2).
- [19] K. Sakasai, et al., Development of neutron detector for engineering materials diffractometer at j-parc, Nuclear Instruments and Methods in Physics Research Section A: Accelerators, Spectrometers, Detectors and Associated Equipment 600 (1) (2009) 157 – 160. URL http://www.sciencedirect.com/science/article/pii/S0168900208016884
- [20] Z. W. Bell, Thermal Neutron Detection System Based on ZnS/LiF Scintillator, Proceedings of IEEE NSS conference, Anaheim (He-2-1).
- [21] S. Peggs, et al., ESS Technical Design Report, ESS 2013-001, http://esss.se/scientific-technical-documentation (2013).
- [22] R. Garoby, et al., The European Spallation Source Design, Physica Scripta 93 (1) (2018) 014001. URL http://stacks.iop.org/1402-4896/93/i=1/a=014001
- [23] K. Kanaki, et al., Simulation tools for detector and instrument design, Physica B: Condensed Matter 551 (2018) 386 – 389, the 11th International Conference on Neutron Scattering (ICNS 2017). URL http://www.sciencedirect.com/science/article/pii/S0921452618302175
- [24] S. Agostinelli, et al., GEANT4: A Simulation toolkit, Nucl. Instrum. Meth. A506 (2003) 250–303. doi:10.1016/S0168-9002(03)01368-8.
- [25] J. Allison, et al., Geant4 developments and applications, IEEE Trans. Nucl. Sci. 53 (2006) 270. doi:10.1109/TNS.2006.869826.
- [26] J. Allison, et al., Recent developments in Geant4, Nucl. Instrum. Meth. Adoi:10.1016/j.nima.2016.06.125.
- [27] I. Proportional Technologies, https://proportionaltech.myshopify.com/.
- [28] F. Sauli, Gaseous Radiation Detectors: Fundamentals and Applications, Cambridge University Press, 2014.
- [29] Z. Xie, et al., Experimental study of boron-coated straws with a neutron source, Nuclear Instruments and Methods in Physics Research Section A: Accelerators, Spectrometers, Detectors and Associated Equipment 888 (2018) 235 – 239. URL http://www.sciencedirect.com/science/article/pii/S0168900218301232
- [30] J. L. Lacy, et al., Initial performance of sealed straw modules for large area neutron science detectors, in: 2011 IEEE Nuclear Science Symposium Conference Record, 2011, pp. 431–435. doi:10.1109/NSSMIC.2011.6154533.
- [31] H. Yu, et al., A multiplex readout method for position sensitive boron coated straw neutron detector, Nuclear Instruments and Methods in Physics Research Section A: Accelerators, Spectrometers, Detectors and Associated Equipment 797 (2015) 324 – 329. URL http://www.sciencedirect.com/science/article/pii/S0168900215006786
- [32] Davide Raspino, Performance of boron lined straw tubes, url: http://icnd.org/index.php?article_id=15&file=raspino_strasbourg_2016.pdf (2016).
- [33] K. Kanaki, et al., Detector rates for the Small Angle Neutron Scattering instruments at the European Spallation Source, Journal of Instrumentation 13 (07) (2018) P07016. URL http://stacks.iop.org/1748-0221/13/i=07/a=P07016
- [34] X.-X. Cai, T. Kittelmann, NCrystal : a library for thermal neutron transport, Submitted to Computer Physics Communications (2019) arXiv:1901.08890.
-
[35]
NCrystal: a library for thermal
neutron transport in crystals.
URL https://github.com/mctools/ncrystal/wiki,https://doi.org/10.5281/zenodo.853186 - [36] A. Athanasiades, et al., Straw detector for high rate, high resolution neutron imaging, in: IEEE Nuclear Science Symposium Conference Record, 2005, Vol. 2, 2005, pp. 623–627. doi:10.1109/NSSMIC.2005.1596338.
- [37] G. Croci, et al., Measurements of -ray sensitivity of a GEM based detector using a coincidence technique, Journal of Instrumentation 8 (04) (2013) P04006–P04006. doi:10.1088/1748-0221/8/04/p04006.
- [38] A. Khaplanov, et al., Investigation of gamma-ray sensitivity of neutron detectors based on thin converter films, Journal of Instrumentation 8 (2013) P10025. doi:10.1088/1748-0221/8/10/P10025.
- [39] G. Mauri and others, Fast neutron sensitivity of neutron detectors based on boron-10 converter layers, JINST 13 (2018) P03004.
- [40] F. Piscitelli, P. V. Esch, Analytical modeling of thin film neutron converters and its application to thermal neutron gas detectors, Journal of Instrumentation 8 (2013) P04020. doi:10.1088/1748-0221/8/04/P04020.
- [41] F. Piscitelli, Boron-10 layers, neutron reflectometry and thermal neutron gaseous detectors, Doctoral thesis.
- [42] Á. C. Basañez, K. Kanaki, F. Piscitelli, DECal, a Python tool for the efficiency calculation of thermal neutron detectors based on thin-film converters arXiv:1801.07124.
- [43] MakeItFrom.com, 5754 aluminium, https://www.makeitfrom.com/material-properties/5754-AlMg3-3.3535-A95754-Aluminum/.
- [44] E. Dian, et al., Neutron activation and prompt gamma intensity in Ar/CO2-filled neutron detectors at the European Spallation Source, Applied Radiation and Isotopes 128. doi:10.1016/j.apradiso.2017.06.003.
- [45] T. L. N. D. Search, http://nucleardata.nuclear.lu.se/toi/.
- [46] ESS-0019931, rev. 3, Ess procedure for designing shielding for safety (2017).
- [47] R. Firestone, et al., Database of prompt gamma rays from slow neutron capture forelemental analysis doi:10.2172/882898.
- [48] G. F. Knoll, Radiation detection and measurement; 4th ed., Wiley, New York, NY, 20 URL https://cds.cern.ch/record/1300754
- [49] G. Galgóczi, et al., Investigation of neutron scattering in the multi-blade detector with geant4 simulations, Journal of Instrumentation 13 (2018) P12031–P12031. doi:10.1088/1748-0221/13/12/P12031.
- [50] E. Dian, et al., Scattered neutron background in thermal neutron detectors, Nuclear Instruments and Methods in Physics Research Section A: Accelerators, Spectrometers, Detectors and Associated Equipment 902 (2018) 173 – 183. URL http://www.sciencedirect.com/science/article/pii/S0168900218305710
- [51] E. Dian, et al., Suppression of intrinsic neutron background in the multi-grid detector, Journal of Instrumentation 14 (01) (2019) P01021–P01021. doi:10.1088/1748-0221/14/01/p01021.
- [52] T. Kittelmann, et al., Using backscattering to enhance efficiency in neutron detectors, IEEE Transactions on Nuclear Science 64 (6) (2017) 1562–1573. doi:10.1109/TNS.2017.2695404.
- [53] Data Management & Software Centre webpage, https://europeanspallationsource.se/data-management-software/computing-centre.