Role of Landau-Rabi quantization of electron motion on the crust of magnetars within the nuclear energy density functional theory
Abstract
Magnetic fields of order G have been measured at the surface of some neutron stars, and much stronger magnetic fields are expected to be present in the solid region beneath the surface. The effects of the magnetic field on the equation of state and on the composition of the crust due to Landau-Rabi quantization of electron motion are studied. Both the outer and inner crustal regions are described in a unified and consistent way within the nuclear-energy density functional theory.
pacs:
21.10.Dr, 21.60.Jz, 26.60.Gj, 26.60.KpI Introduction
The catastrophic gravitational-core collapse of massive stars during supernova explosions can produce so called magnetars, i.e. neutron stars endowed with extremely high magnetic fields exceeding G td92 . This huge magnetic energy is thought to power soft-gamma ray repeaters (SGRs) and anomalous X-ray pulsars (AXPs), as evidenced by measurements of surface magnetic fields up to a few times G (see, e.g. Ref. kaspi17 for a review). Numerical simulations have shown that the internal magnetic field of a neutron star could potentially reach G (see, e.g. Refs. kiuchi2008 ; frieben2012 ; pili17 ; chatterjee2015 and references therein).
The effects of a high magnetic field on a magnetar are most prominent in the outer crust, which consists of a succession of different strata made of atomic nuclei with proton number and mass number in a charge-compensating electron background. We have previously shown that the composition and the equation of state in this region can be drastically modified due to Landau-Rabi quantization of electron motion chapav12 ; bjp2013 ; chasto15 ; chamut17 (see also Ref. blacha18 for a general review). The magnetic condensation of the surface layers ruderman71 ; lai01 leads to a strong stiffening of the equation of state. Introducing the characteristic magnetic field strength
| (1) |
(with the electron mass, the speed of light, the elementary electric charge, and the Planck-Dirac constant), the increase of the mean baryon number density with the pressure is approximately given by chapav12
| (2) |
where is the density at the stellar surface (made of iron), MeV fm-3, is the proton fraction, and . With increasing magnetic field strength, the maximum density at which a nuclide is present exhibits typical quantum oscillations as electrons fill fewer and fewer Landau-Rabi levels chamut17 . If electrons are confined to the lowest level, increases linearly with (ignoring the lattice correction). The magnetic field is strongly quantizing in all regions of the outer crust if chasto15 ; chamut17 . For such fields, the equilibrium composition of the outer crust is significantly changed chapav12 ; chamut17 .
At high enough pressure, neutrons drip out of nuclei, marking the transition to the inner crust, where neutron-proton clusters thus coexist with unbound neutrons. In the presence of a magnetic field, the onset of neutron emission is shifted to lower or higher densities depending on the magnetic field strength chapav12 ; chasto15 . In the strongly quantizing regime, the neutron-drip pressure and density increase almost linearly with . Accurate analytical formulas can be found in Ref. chasto15 . The role of Landau-Rabi quantization of electrons on the inner crust of a magnetar was previously studied in the Thomas-Fermi approximation nandi2011 . The clusters were predicted to be larger and separated by a smaller distance than in the absence of magnetic fields, whereas the neutron liquid was found to be more dilute. However, these effects were significant only for the extremely high value of the magnetic field strength. Because nuclear shell effects were neglected in this study, the number of protons in clusters varied continuously with increasing density. However, shell effects are known to play a very important role in determining the equilibrium composition of unmagnetized neutron-star crusts, favoring layers made of clusters with specific ‘magic’ proton numbers (see, e.g. Ref. pearson2018 ). Unlike the equation of state, elastic and transport properties are very sensitive to the crustal composition and this has implications for the seismic frequencies nandi2016 and the cooling of the star vigano2013 ; potchab2018 .
In this paper, we present new calculations of magnetar crusts based on the nuclear-energy density functional theory duguet2014 . We have recalculated the properties of the outer crust using updated experimental atomic mass data supplemented with the Brussels-Montreal atomic mass model HFB-24 gor13 . Moreover, we have extended our investigations of highly-magnetized matter to the inner crust of a magnetar. To this end, we have employed the same functional BSk24 that underlies the HFB-24 model thus providing a unified and consistent treatment of both the outer and inner regions of the crust. Results are compared to those obtained for unmagnetized neutron stars using the same functional pearson2018 .
II Model of magnetar crusts
II.1 Outer crust
We determine the properties of the outer crust of a magnetar adopting a model that we have previously presented in detail in Ref. chapav12 . The crust is supposed to be stratified into different layers, each of which consists of a perfect crystal made of a single nuclear species embedded in a charge neutralizing relativistic electron Fermi gas that is fully degenerate. The lattice correction is taken into account but higher-order corrections, such as electron exchange and screening, are ignored. As in the absence of magnetic fields, nuclei are arranged on a body-centered cubic lattice kozhberov2016 . However, the equilibrium composition can be altered due to the quantization of the electron motion perpendicular to the magnetic field. The energy levels of a relativistic electron Fermi gas in a magnetic field were first calculated by Rabi rabi28 . Corresponding expressions for the electron pressure and energy density can be found, e.g., in Ref. chapav12 . The equilibrium properties of any crustal layer at pressure and magnetic field strength are determined by minimizing the Gibbs free energy per nucleon (see, e.g., Appendix of Ref. chafant15 ), given by chapav12
| (3) |
| (4) |
where is the electron Fermi energy, is the pressure of the ideal electron Fermi gas, is the crystal structure constant baiko01 , and is the nuclear mass (including the rest mass of nucleons and electrons). The latter can be obtained from the atomic mass after subtracting out the binding energy of the atomic electrons (see Eq. (A4) of Ref. lpt03 ). In principle, the presence of a high magnetic field may change the structure of nuclei pen11 ; stein16 , inducing additional changes in the crustal composition bas15 . However, complete nuclear mass tables accounting for the effects of the magnetic field are not yet available. We have therefore considered nuclear masses in the absence of magnetic fields.
In our previous investigations chapav12 ; chasto15 ; chamut17 , we made use of experimental atomic mass data from the 2012 Atomic Mass Evaluation (AME) ame12 . In the present work, we have determined the equilibrium composition of the outer crust using the data from the 2016 AME ame16 supplemented by recent mass measurements of copper isotopes welker2017 , as in Ref. pearson2018 for unmagnetized neutron stars. For the masses that have not been measured, we have adopted as in Ref. pearson2018 the theoretical nuclear mass table HFB-24 from the BRUSLIB database111 http://www.astro.ulb.ac.be/bruslib/. These masses were obtained from self-consistent deformed Hartree-Fock-Bogoliubov (HFB) calculations using the generalized Skyrme functional BSk24 gor13 . This microscopic model was fitted to the 2353 measured masses of nuclei with neutron number and proton number from the 2012 AME ame12 , with a root-mean-square deviation of 0.549 MeV. This model provides an equally good fit to the 2408 measured masses of nuclei with and from the 2016 AME.
II.2 Inner crust
Ignoring neutron band-structure effects, the boundary between the outer and inner crust is determined by the condition , where is the neutron mass (see, e.g. Refs. cfzh15 ; chasto15 for a detailed discussion). We have extended our studies of magnetar crusts to the inner part by implementing the effects of Landau-Rabi quantization in the computer code developed by the Brussels-Montreal collaboration onsi2008 ; pearson2012 ; pearson2015 . This code is based on the fourth-order extended Thomas-Fermi method with proton shell and pairing corrections added perturbatively using the Strutinsky integral theorem. This ETFSI method is a computationally very fast approximation to the HFB equations. Nuclear clusters are supposed to be unaffected by the presence of the magnetic field, and are further supposed to be spherical. This assumption may be questionable in the bottom layers of the crust, where nucleons could arrange themselves in so called nuclear “pastas”. Indeed, instabilities in the densest part of unmagnetized neutron star crusts were previously reported within the same framework pearson2018 . Since the magnetic fields that we consider here are not expected to have any significant effect on this crustal region, we restrict ourselves to densities below fm-3. The Coulomb lattice is described following the approach of Wigner and Seitz. Nucleon density distributions in the Wigner-Seitz cell are parameterized as ( for neutrons or protons respectively)
| (5) |
in which are the background nucleon number densities, are nucleon number densities characterizing the clusters, and the cluster shape is described by the function
| (6) |
where is the cluster radius defined as the half width at half maximum, the diffuseness of the cluster surface, and is the radius of the Wigner-Seitz cell. The numbers of protons and neutrons in the Wigner-Seitz cell are given by
| (7) |
| (8) |
respectively.
The equation of state of nuclear clusters and free neutrons is calculated from the same nuclear energy density functional BSk24 gor13 , as that underlying the nuclear mass model HFB-24 used in the outer crust. This functional was not only fitted to nuclear masses but was also constrained to reproduce the microscopic neutron-matter equation of state labelled ‘V18’ in ls08 , as obtained from the Brueckner Hartree-Fock approach using realistic two- and three-body forces. We thus believe that this functional is well suited for describing the neutron-rich matter of the inner crust of a neutron star. The analytical approximations implemented in the routines developed by Potekhin and Chabrier eosmag were adopted to calculate the equation of state of the cold magnetized electron Fermi gas.
Minimizing the Gibbs free energy per nucleon at fixed pressure is numerically more delicate in the inner crust than in the outer crust because the pressure also depends on the density of free neutrons. Instead, it is more convenient to minimize the energy per nucleon at fixed average baryon number density (see, e.g., Ref. pearson2012 for a discussion). We have thus followed the same approach as in our previous studies of unmagnetized neutron stars. The energy per nucleon is given by
| (9) |
where denotes the total number of nucleons in the Wigner-Seitz cell. The energy density is calculated as in Ref. pearson2018 except that the kinetic energy density of the electron Fermi gas is now determined taking into account the presence of a magnetic field. Similarly, the pressure is calculated as described in Ref. pearson2018 but now including the magnetic field effects on the electron contribution.
III Equilibrium composition and equation of state of magnetar crusts
III.1 Outer crust
The composition of the shallowest layers of the crust of a neutron star is completely determined by experimental atomic mass measurements. Detailed results for unmagnetized neutron stars can be found in Ref. pearson2018 . The crust was found to be stratified in a succession of layers made of 56Fe, 62Ni, 64Ni, 66Ni, 86Kr, 84Se, 82Ge, and 80Zn with increasing pressure. In the deeper regions, the HFB-24 model predicts the occurrence of progressively more neutron rich nuclei that are less bound: 78Ni, 80Ni, 124Mo, 122Zr, 121Y, 120Sr, 122Sr, and 124Sr. At some pressure MeV fm-3, neutrons drip out of the nuclei 124Sr, delimiting the boundary between the outer and inner regions of the crust.
We have recalculated the equilibrium composition of the outer crust for different magnetic field strengths. Results are collected in Tables 1, 2 and 3. As in our earlier study chapav12 , we find that the mean baryon number density at the stellar surface (where the pressure vanishes) is dramatically increased due to magnetic condensation, reaching the value fm-3 for . The equation of state in the region beneath is well described by Eq. (2). When comparing our new results for the composition with the ones bjp2013 ; chamut17 obtained using the 2012 AME ame12 , we notice several differences. First of all, the pressure between some adjacent crustal layers and their mean baryon densities are slightly shifted due to refined mass measurements. For instance, the mass excess of 56Fe now estimated as MeV ame16 instead of MeV ame12 leads to a small increase of the maximum pressure up to which 56Fe is present, from MeV fm-3 to MeV fm-3 for . Likewise, the maximum density increases from fm-3 to fm-3. These changes can be understood from the approximate condition determining the transition between two adjacent layers made of nuclei (, ) and (, ) respectively chamut17
| (10) |
where
| (11) |
The layer lying beneath that made of 56Fe contains 62Ni. The slight decrease of the mass of 56Fe thus entails an increase of , hence also of and of . Revisions in the atomic mass estimates are more significant for exotic nuclei. In particular, the mass excess of 130Cd, which was previously estimated as MeV ame12 has been revised to MeV ame16 . Making use of the 2012 AME with the HFB-24 mass model, this nuclide was predicted to appear in the crust of a neutron star for chamut17 . With the 2016 AME, 130Cd is no longer favored up to the highest field considered. Since the publication of our previous works, new masses of neutron-rich nuclei have been measured. These include that of 79Cu welker2017 , which was previously estimated using the mass model HFB-24. This nuclide, which was found up to chamut17 , is now disfavored. For the highest magnetic fields considered here namely , we observe that 121Y and 80Zn have disappeared, whereas 124Zr has appeared.
| 26 | 56 | 9.96 | 2.63 | 2.00 |
| 28 | 62 | 2.72 | 1.10 | 6.23 |
| 28 | 64 | 1.14 | 1.42 | 1.01 |
| 38 | 88 | 1.45 | 1.55 | 1.16 |
| 36 | 86 | 1.60 | 2.60 | 3.21 |
| 34 | 84 | 2.69 | 3.88 | 6.82 |
| 32 | 82 | 4.02 | 5.22 | 1.16 |
| 30 | 80 | 5.43 | 6.71 | 1.78 |
| 28 | 78 | 7.01 | 8.46 | 2.61 |
| 28 | 80 | 8.68 | 8.96 | 2.79 |
| 42 | 124 | 9.30 | 1.07 | 3.68 |
| 40 | 122 | 1.10 | 1.18 | 4.25 |
| 39 | 121 | 1.20 | 1.21 | 4.32 |
| 38 | 120 | 1.23 | 2.18 | 5.06 |
| 38 | 122 | 2.22 | 2.74 | 6.20 |
| 38 | 124 | 2.79 | 2.91 | 6.56 |
| 26 | 56 | 2.29 | 5.05 | 3.15 |
| 28 | 62 | 5.24 | 2.22 | 1.23 |
| 38 | 88 | 2.34 | 3.37 | 2.68 |
| 36 | 86 | 3.47 | 5.49 | 7.06 |
| 34 | 84 | 5.67 | 8.08 | 1.46 |
| 32 | 82 | 8.37 | 1.08 | 2.44 |
| 50 | 132 | 1.12 | 1.15 | 2.58 |
| 30 | 80 | 1.15 | 1.32 | 3.40 |
| 46 | 128 | 1.38 | 1.71 | 5.22 |
| 44 | 126 | 1.75 | 1.85 | 5.82 |
| 42 | 124 | 1.91 | 2.19 | 7.69 |
| 40 | 122 | 2.26 | 2.42 | 8.81 |
| 40 | 124 | 2.46 | 2.48 | 8.99 |
| 38 | 120 | 2.52 | 2.64 | 9.85 |
| 38 | 122 | 2.69 | 2.85 | 1.11 |
| 38 | 124 | 2.90 | 2.95 | 1.15 |
| 26 | 56 | 3.72 | 7.36 | 3.89 |
| 28 | 62 | 7.65 | 3.11 | 1.57 |
| 38 | 88 | 3.30 | 5.33 | 4.45 |
| 36 | 86 | 5.48 | 8.55 | 1.13 |
| 34 | 84 | 8.83 | 1.24 | 2.30 |
| 32 | 82 | 1.29 | 1.50 | 3.13 |
| 50 | 132 | 1.56 | 2.01 | 5.26 |
| 46 | 128 | 2.11 | 2.61 | 8.13 |
| 44 | 126 | 2.69 | 2.83 | 9.03 |
| 42 | 124 | 2.91 | 3.34 | 1.19 |
| 40 | 122 | 3.44 | 3.66 | 1.34 |
| 40 | 124 | 3.72 | 3.80 | 1.40 |
| 38 | 120 | 3.87 | 3.99 | 1.50 |
| 38 | 122 | 4.06 | 4.31 | 1.69 |
| 38 | 124 | 4.38 | 4.45 | 1.74 |
III.2 Neutron-drip transition
As discussed in our previous studies (see, e.g. Ref. chasto15 ), the onset of neutron drip is shifted to much higher pressures in the presence of a strongly quantizing magnetic field. In particular, we have found that the neutron-drip transition occurs at pressure MeV fm-3 for instead of MeV fm-3 in the absence of magnetic field. In comparison, the neutron-drip density is only moderately increased from fm-3 to fm-3. As found in our previous works, the equilibrium nuclide at the neutron-drip point remains 124Sr independently of the magnetic field strength.
III.3 Inner crust
Determining the equilibrium properties of the inner crust can be numerically tricky. The energy minimum may be not only very flat in parameter space, but differences between local minima also tend to decrease with increasing density (see e.g. Ref. pearson2018 ). The occurrence of quantum oscillations, especially in the weakly quantizing regime in which many Landau-Rabi levels are filled (see, e.g., Ref. chamut17 ), adds to the difficulty.
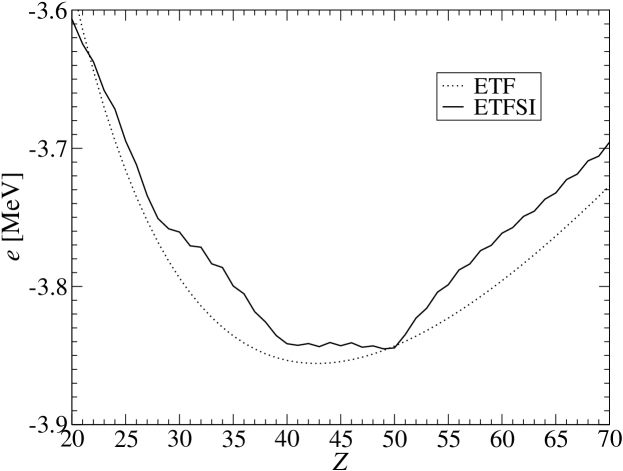
To test our inner crust code, we have computed the properties of different crustal layers in the limit of a relatively low magnetic field by setting . As shown in Table 4, the results for weakly magnetized neutron stars are in very good agreement with those obtained with the code for strictly unmagnetized neutron stars. The small deviations could be attributed to the interpolations implemented in the routines of Ref. eosmag . To further test our inner crust code, we have compared the neutron-drip properties with those obtained using our outer crust code. Results are summarized in Table 5. Whereas the discrepancies for the pressure and the energy per nucleon are found to be of the same order as in the absence of magnetic fields, those for the proton number and neutron number appear to be larger especially for . As discussed in Ref. pearson2012 , we do not expect a perfect matching between the two codes since the outer and inner regions of the crust are described using different approximations. Moreover, we cannot exclude the possibility that our inner crust code converged to a local minimum energy configuration instead of the true equilibrium state. Indeed, the numerical search for the absolute minimum is made difficult by the extremely small energy differences that can exist between different configurations. In particular, the energy per nucleon at the neutron-drip point for appears to be very flat for lying between 40 and 50, as illustrated in Fig. 1. The configuration with differs by about 2.5 keV per nucleon from the configuration with . The figure also illustrates the importance of proton shell and pairing corrections for determining the equilibrium composition.
| 3.03750 | 5.46740 (5.47181) | -1.52400 (-1.52387) |
| 5.47367 | 7.47651 (7.49487) | -6.54916 (-6.54893) |
| 9.86374 | 1.17275 (1.17361) | 4.98938 (4.99243) |
| 1.77748 | 2.15441 (2.15216) | 7.20421 (7.20375) |
| 3.20307 | 4.43514 (4.42966) | 1.45537 (1.45530) |
| 5.77204 | 9.60512 (9.60349) | 2.32853 (2.32851) |
| 1.04014 | 2.08081 (2.07968) | 3.38692 (3.38697) |
| 1.87437 | 4.34014 (4.33952) | 4.63934 (4.63936) |
| 3.37767 | 8.60910 (8.60561) | 6.04953 (6.04951) |
| 6.08667 | 1.77762 (1.77714) | 7.60048 (7.60046) |
| 1000 | 2.91 | 41 (38) | 96 (86) | -2.17 (-2.25) | 6.65 (6.56) |
|---|---|---|---|---|---|
| 2000 | 2.95 | 41 (38) | 95 (86) | -3.82 (-3.90) | 1.14 (1.15) |
| 3000 | 4.45 | 49 (38) | 113 (86) | -3.85 (-3.92) | 1.75 (1.74) |
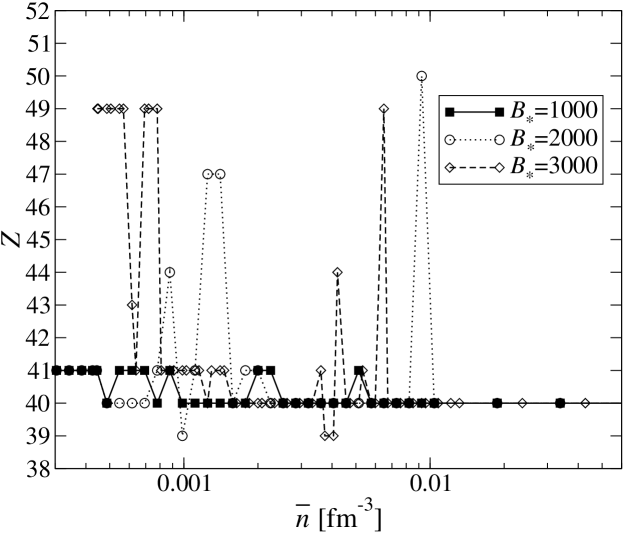
In the absence of magnetic fields, most regions of the inner crust of a neutron star were previously found to be made of nuclear clusters with up to a mean density fm-3 pearson2018 . The inner crust of a magnetar is still predicted to contain nuclear clusters with but other values of also appear to be energetically favored in some layers depending on the magnetic field strength, as shown in Fig. 2. Most remarkably, high-enough magnetic fields lead to the appearance of odd values of around the ‘magic’ values 40 and 50. The discontinuous changes in with density are reflected in the cluster size, as shown in Figs. 3, 4 and 5. However, the cluster shape, as characterized by the diffusenesses and the densities , remain unaltered, as can be seen in Figs. 6 and 7. Likewise, the magnetic field is not found to have any significant effect on the density of the neutron liquid, as show in Fig. 8. Since these conclusions hold for all three considered magnetic field strengths, only the results for have been plotted.


The mean proton fraction , which is plotted in Fig. 9, varies smoothly with and exhibits typical fluctuations due to Landau-Rabi quantization. It should be remarked that the filling of Landau-Rabi levels does not necessarily increase monotonically with pressure. This stems from the fact that the composition also changes. For instance, in descending towards deeper layers in the crust for , the lowest Landau-Rabi level is first fully populated at density fm-3 corresponding to the electron Fermi energy MeV. However, further compression leads to a slight decrease of below the threshold. The lowest level is fully occupied again at density fm-3. This leads to additional variations of in this density range, as can be seen in Fig. 9. At high enough densities, becomes essentially independent of the magnetic field strength and matches that obtained for unmagnetized neutron stars.

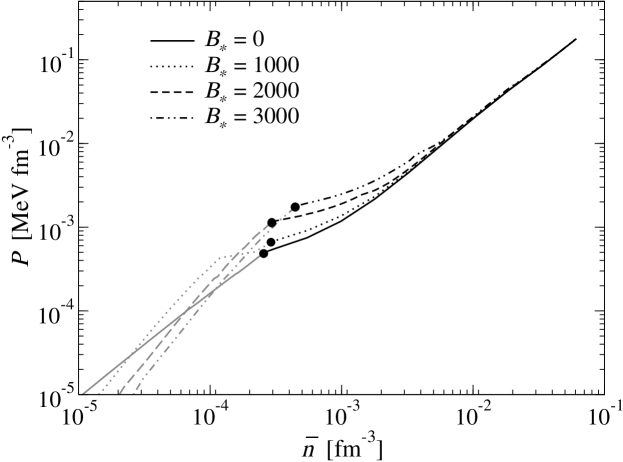
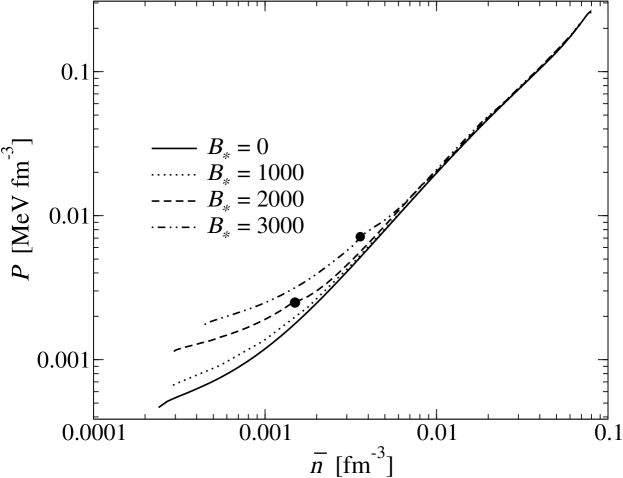
The equation of state of the outer and inner regions of the crust is plotted in Fig. 10 for different magnetic field strengths. As previously found in Ref. chapav12 , the effects of the magnetic field are most prominent in the outermost region of the crust, and become less and less important with increasing density as more and more Landau-Rabi Levels are filled by electrons. As shown in Fig. 11, the magnetic field is strongly quantizing in the inner crust (lowest level partially occupied) up to a mean baryon density fm-3 and fm-3 for and respectively. For , several levels are populated in any region of the inner crust so that the magnetic field has a much smaller impact on the equation of state. In all three cases, the equation of state almost exactly matches that obtained in the absence of magnetic fields at densities above fm-3.
IV Conclusion
We have studied the role of Landau-Rabi quantization of electron motion on the equilibrium properties of magnetar crusts, treating consistently both the outer and inner regions in the framework of the nuclear-energy density functional theory. For the outer crust, we have made use of experimental data from the 2016 AME ame16 and recent measurements of copper isotopes welker2017 , supplemented with the HFB-24 atomic mass model gor13 . For the inner crust, we have employed the ETFSI method with the same functional BSk24 as that underlying the HFB-24 model.
The effects of the magnetic field on the crustal properties are most prominent in the strongly quantizing regime, whereby electrons occupy the lowest Landau-Rabi level only. The magnetic field alters the stratification of the outer crust: the pressure at the interface between two adjacent layers and their densities are shifted; the composition may change as well depending on the magnetic field strength. For G, the outer crust contain the new nuclides 88Sr, 126Ru, 128Pd, 132Sn and 124Zr, whereas 64Ni, 66Ni, 78Ni, 80Ni, 80Zn and 121Y are no longer present. The nuclides 130Cd and 79Cu that were previously predicted using the 2012 AME chapav12 ; chamut17 have now been ruled out by the latest experimental data. The internal constitution of the inner crust is found be moderately modified. Most regions are still predicted to be made of nuclear clusters with as in unmagnetized neutron stars pearson2018 although other values may be favored depending on the density and on the magnetic field strength. Proton shell and pairing effects, which were neglected in previous investigations nandi2011 , are found to play a crucial role for determining the equilibrium composition. Although the shift in changes the cluster size, their shape remain essentially unaffected by the magnetic field. Likewise, the magnetic field is not found to have any significant effect on the neutron liquid.
The magnetic condensation of the outermost layers due to the confinement of electrons in the lowest Landau-Rabi level makes the equation of state very stiff. However, the role of the magnetic field is mitigated by the increasingly larger number of occupied levels in the deeper region of the crust. The equation of state of the inner crust thus remains almost unchanged for magnetic fields below G. For higher magnetic fields of order G, the equation of state is moderately modified in the shallowest layers of the inner crust but matches smoothly that of unmagnetized crust at densities above fm-3.
The properties of magnetar crusts may be further altered due to the effects of the magnetic field on nucleons. These effects, which have been previously studied within the Thomas-Fermi approximation for fixed proton fractions lima2013 , may become important for magnetic field strength exceeding G. This deserves further studies.
Acknowledgments
This work was financially supported by Fonds de la Recherche Scientifique - FNRS (Belgium), NSERC (Canada), and the Bulgarian Academy of Sciences through the program for support of young scientists under contract No. DFNP-17-167/03.08.2017. The work of Y. D. M. was also supported by a Short Term Scientific Mission (STSM) grant from the European Cooperation in Science and Technology (COST) Action CA16214. Y. D. M. and Z. S. also acknowledge “Science Forge” and MedTech.bg initiative for aspiring scientists.
References
- (1) C. Thompson and R. C. Duncan, Astrophys. J. 392, L9 (1992)
- (2) V. Kaspi, and A. M. Beloborodov, Ann. Rev. Astron. Astrophys. 55, 261 (2017)
- (3) K. Kiuchi, S. Yoshida, Phys.Rev.D 78, 044045 (2008).
- (4) J. Frieben, L. Rezzolla, Mon. Not. R. Astron. Soc.427, 3406 (2012).
- (5) A. G. Pili, N. Bucciantini, L. Del Zanna, Mon. Not. R. Astron. Soc.470, 2469 (2017).
- (6) D. Chatterjee, T. Elghozi, J. Novak, M. Oertel, Mon. Rot. R. Astron. Soc. 447, 3785 (2015).
- (7) N. Chamel, R. L. Pavlov, L. M. Mihailov, Ch. J. Velchev, Zh. K. Stoyanov, Y. D. Mutafchieva, M. D. Ivanovich, J. M. Pearson, and S. Goriely, Phys. Rev. C 86, 055804 (2012).
- (8) N. Chamel, R. L. Pavlov, L. M. Mihailov, Ch. J. Velchev, Zh. K. Stoyanov, Y. D. Mutafchieva, M. D. Ivanovich, Bulg. J. Phys. 40, 275 (2013).
- (9) N. Chamel, Zh. K. Stoyanov, L. M. Mihailov, Y. D. Mutafchieva, R. L. Pavlov, and Ch. J. Velchev, Phys. Rev. C 91, 065801 (2015).
- (10) N. Chamel, Y.D. Mutafchieva, Zh.K. Stoyanov, L.M. Mihailov, R.L. Pavlov, in Quantum Systems in Physics, Chemistry, and Biology, Progress in Theoretical Chemistry and Physics, 30, A. Tadjer et al. (eds.) (Springer, 2017), pp. 181-191.
- (11) D. Blaschke and N. Chamel, in The Physics and Astrophysics of Neutron Stars, Rezzolla et al. (eds) (Springer, 2018).
- (12) M. Ruderman, Phys. Rev. Lett. 27, 1306 (1971).
- (13) D. Lai, Rev. Mod. Phys. 73, 629 (2001)
- (14) R. Nandi, D. Bandyopadhyay, I. N. Mishustin, W. Greiner, Astrophys. J.736, 156 (2011).
- (15) J. M. Pearson, N. Chamel, A. Y. Potekhin, A. F. Fantina, C. Ducoin, A. K. Dutta, S. Goriely, Mon. Not. Roy. Astron. Soc. 481, 2994 (2018)
- (16) R. Nandi, P. Char, D. Chatterjee, D. Bandyopadhyay, Phys. Rev. C 94, 025801 (2016).
- (17) D. Viganò, N. Rea, J. A. Pons, R. Perna, D. N. Aguilera, J. A. Miralles, Mon. Not. Roy. Astron. Soc. 434, 123 (2013).
- (18) A. Y. Potekhin, G. Chabrier, Astron. Astrophys. 609, A74 (2018).
- (19) T. Duguet in Lect. Notes Phys. 879, 293 (Springer-Verlag, Berlin 2014).
- (20) S. Goriely, N. Chamel, J. M. Pearson, Phys. Rev. C 88, 024308 (2013).
- (21) A. A. Kozhberov, Astrophys. Space Sci. 361, 256 (2016).
- (22) I. I. Rabi, Zeits. Phys. 49, 507 (1928).
- (23) N. Chamel, A. F. Fantina, Phys. Rev. D 92, 023008 (2015).
- (24) D. A. Baiko, A. Y. Potekhin, D. G. Yakovlev, Phys. Rev. E 64, 057402 (2001).
- (25) D. Lunney, J. M. Pearson, and C. Thibault, Rev. Mod. Phys. 75, 1021 (2003).
- (26) D. Pea Arteaga, M. Grasso, E. Khan, P. Ring, Phys. Rev. C 84, 045806 (2011).
- (27) M. Stein, J. Maruhn, A. Sedrakian, P.-G. Reinhard, Phys. Rev. C 94, 035802 (2016).
- (28) D. Basilico, D. Pea Arteaga, X. Roca-Maza and G. Coló, Phys. Rev. C 92 035802 (2015).
- (29) G. Audi., M. Wang, A. H. Wapstra, F. G. Kondev, M. MacCormick, X. Xu, B. Pfeiffer, Chinese Physics C 36, 1287 (2012)
- (30) M. Wang, G. Audi, F. G. Kondev, W. J. Huang, S. Naimi, X. Xu, Chinese Physics C 41, 030003 (2017)
- (31) A. Welker A. et al., Phys. Rev. Lett. 119, 192502 (2017)
- (32) N. Chamel, A. F. Fantina, J. L. Zdunik, P. Haensel, Phys .Rev. C 91, 055803 (2015).
- (33) M. Onsi, A. K. Dutta, H. Chatri, S. Goriely, N. Chamel, J. M. Pearson, Phys. Rev. C 77, 065805 (2008).
- (34) J. M. Pearson, N. Chamel, S. Goriely, C. Ducoin, Phys. Rev. C85, 065803 (2012).
- (35) J. M. Pearson, N. Chamel, A. Pastore, and S. Goriely, Phys. Rev. C 91, 018801 (2015).
- (36) Z. H. Li and H.-J. Schulze, Phys. Rev. C78, 028801 (2008).
- (37) A. Y. Potekhin and G. Chabrier, Astron. Astrophys. 550, A43 (2013).
- (38) R. C. R. de Lima, S. S. Avancini, and C. Providência, Phys. Rev. C 88, 035804 (2013).