Nowcasting Influenza Incidence with CDC Web Traffic Data: A Demonstration Using a Novel Data Set
Abstract
Influenza epidemics result in a public health and economic burden around the globe. Traditional surveillance techniques, which rely on doctor visits, provide data with a delay of 1–2 weeks. A means of obtaining real-time data and forecasting future outbreaks is desirable to provide more timely responses to influenza epidemics. In this work, we present the first implementation of a novel data set by demonstrating its ability to supplement traditional disease surveillance at multiple spatial resolutions. We use Internet traffic data from the Centers for Disease Control and Prevention (CDC) website to determine the potential usability of this data source. We test the traffic generated by ten influenza-related pages in eight states and nine census divisions within the United States and compare it against clinical surveillance data. Our results yield = 0.955 in the most successful case, promising results for some cases, and unsuccessful results for other cases. These results demonstrate that Internet data may be able to complement traditional influenza surveillance in some cases but not in others. Specifically, our results show that the CDC website traffic may inform national and division-level models but not models for each individual state. In addition, our results show better agreement when the data were broken up by seasons instead of aggregated over several years. In the interest of scientific transparency to further the understanding of when Internet data streams are an appropriate supplemental data source, we also include negative results (i.e., unsuccessful models). We anticipate that this work will lead to more complex nowcasting and forecasting models using this data stream.
1 School of Mathematical and Statistical Sciences, Arizona State University, Tempe, AZ
2 X Computational Physics Division, Los Alamos National Laboratory, Los Alamos, NM
3 Analytics, Intelligence, and Technology Division, Los Alamos National Laboratory, Los Alamos, NM
1 Introduction
Every year, an estimated 5% to 20% of people in the United States become infected with influenza [1]. The typical influenza season begins in October and ends in May, with the peak occuring in the winter months. Annually, 3,000–50,000 people die from the flu, with another 200,000 requiring hospitalization [15]. The yearly flu burden is estimated to cost around $87 billion in lost productivity [15]. Timely surveillance of influenza can help reduce this burden, allowing health care facilities to more adequately prepare for the influx of patients when flu levels are high [13].
One common surveillance measure is the fraction of patients presenting with influenza-like illness (ILI), consisting of a fever of at least 100 F ( C) and a cough or sore throat with no other known cause [16]. ILI data are collected from about 2,900 volunteer health care providers throughout the United States, although each week only about 1,800 report their data. These data are then aggregated and made public, after a time lag of about 1–2 weeks [2, 3, 4, 1, 5, 6]. Because the ILI data are collected from volunteer providers, the data set is incomplete. If policies were enacted to provide incentive for reporting health care providers, or to make reporting compulsory, the result would be a more complete data set. Other surveillance systems include virological data from the World Health Organization, emergency department visits, electronic health records, crowd-sourced ILI reports, Widely Internet Sourced Distributed Monitoring, Influenzanet, and Flu Near You [17, 20].
1.1 Internet data streams
In the United States, 87% [7] of adults use the Internet. Of those Internet users, 72% [7] have used the Internet to search for health information within the last year. The most common health-related searches are for information regarding a specific disease or condition (66%) and information about a specific treatment or procedure (56%) [7, 8].
There are two main types of health-related Internet activity. The first is health sharing, in which Internet users post about health-related topics (e.g., a tweet about being sick). The second is health seeking, in which users utilize the Internet to obtain information about health-related topics [2]. In this paper, we focus on health-seeking behavior. Previous studies have shown that analyzing online health-seeking behavior can improve early detection of disease incidence by detecting changes in disease activity [9, 5, 21, 23, 25, 28]. Similarly, other studies have shown that Internet data emerging from search queries can aid detection of outbreaks in areas with large populations of Internet users [10], because online health-related search queries and epidemics are often strongly correlated [10, 11].
Internet data have been used to forecast disease incidence in other models. Polgreen et al. developed linear influenza forecasting models with lags of 1 to 10 weeks for each of the 9 U.S. census regions using search queries from Yahoo [5]. The best performing models had lags of 1–3 weeks and an average of 0.38 (with a high of 0.57 in the East-South-Central region) [5]. These low values demonstrate potential problems in relying on search information alone. Ginsberg et al. were able to predict influenza epidemics two weeks in advance using Google search queries to fit linear models using log-odds of ILI visits and related searches [9].
Using a Poisson distribution and LASSO regression, McIver and Brownstein obtained an value of 0.946 using Wikipedia data [4], although some data were excluded from analyses due to increased media attention and higher than normal influenza activity. Generous et al. used Wikipedia data to train a statistical model with linear regression, which demonstrated its potential for forecasting disease incidence around the globe, including influenza in the United States, which had an of 0.89 [3]. Hickmann et al. conducted a similar study of linear regression models which showed that using Wikipedia to forecast influenza in the United States for the 2013–2014 season resulted in an value greater than 0.9 in some instances [1].
Integrating both Wikipedia data and Google Flu Trends, Bardak et al. obtained values of 0.94 and 0.91 using ordinary least squares (OLS) and ridge regression, respectively, for forecasting influenza outbreaks [12]. For OLS nowcasting, the value was 0.98 in the best case. For the best fit, the weekly data was offset by one week [12].
As part of the CDC’s 2013–2014 Predict the Influenza Season Challenge, 9 teams used digital data sources to create forecasting models. The digital sources these teams utilized were Wikipedia, Twitter, Google Flu Trends, and HealthMap. The teams used either mechanistic or statistical models to create their forecasts, with the most successful team using multiple data sources, which may have reduced biases usually associated with Internet data streams [18]. Broniatowski et al. used Twitter data to detect increasing and decreasing influenza prevalence with 85% accuracy [19]. Zhang et al. used Twitter data to inform stochastically, spatially structured mechanistic models of influenza in the United States, Italy, and Spain [26].
Internet data streams have also been used to supplement traditional surveillance techniques with nowcasting models. Paul et al. used Twitter along with ILI data from the CDC to produce nowcasting influenza models as well as nowcasting models using solely ILI data. They conclude that the addition of Twitter data led to more accurate nowcasting models [22]. Santillana et al. combined Google Trends data and CDC-reported ILI data to create models for nowcasting and forecasting influenza [24]. Lampos et al. used search query data to explore both linear and nonlinear nowcasting models [27]. Yang et al. used Google search data to create an influenza tracking model with autoregression [29].
In contrast, we consider data on page views of the CDC website rather than search data from sites not solely devoted to public health. We use this data set because we expect it to be inherently less noisy because of its focus on public health issues. We use ordinary least squares to nowcast influenza nationally, across the 9 U.S. census divisions, and across 8 states using access data from 10 influenza-related CDC pages. Our nowcasting models cover influenza seasons from 2013 to 2016, with the 2012–2013 season being partially included because our data set begins Jan. 1, 2013. The inclusion of an incomplete influenza season serves to inform whether this data set can be used given a more restrictive time frame. We include both positive and negative results to advance our knowledge regarding when Internet data may or may not work. The negative results are crucial to advancing the field of disease surveillance using Internet data, as they demonstrate when these data sources contribute to unreliable surveillance. We focus on answering the following two research questions:
Q1: Can CDC page visits be used as an additional data source for monitoring disease incidence?
Q2: What is the appropriate shift needed to obtain the best data fit?
2 Methods
2.1 Data Sources
We used page view data provided by the Centers for Disease Control and Prevention (CDC). Each data point contains the page name, date and time of access, and the geographic location from where the page was viewed. These data are available at geographic resolutions of national and state levels and include some metropolitan areas (e.g., New York City). The data are available at a number of temporal resolutions beginning on January 1, 2013. For these models, we use weekly page view data to coincide with the ILI data temporal resolution. The data are available as raw page view counts and normalized page view counts, and we consider the latter for this work. We selected pages associated with general influenza information, treatment, and diagnosis. Pages were sometimes renamed, but we were able to follow the evolution of each selected page by utilizing key words in the page titles as well as the date ranges for available data.
Because the majority of health-related Internet searches concern specific conditions, treatments, and procedures [8], we selected pages related to those topics. These pages also align with Johnson et al., who used pages in the categories of Diagnosis/Treatment and Prevention/Vaccination for influenza surveillance [14]. Specifically, we used the following pages: antivirals, flu basics, FluView, high risk complications, key facts, prevention, symptoms, treating influenza, treatment, and vaccine. We then aggregate the page views of interest for each of our models. A complete list of pages can be found in Appendix A.
The states we selected were based on severity of flu (determined from FluView) during the available seasons and the availability of ILI data, which is not standardized and is dependent on each state’s reporting mechanism. ILI data for each state include the week ending or starting date as well as the percentage of influenza-like illness for the specified week. While some states also report additional data, such as school closures and hospitalizations, these data are not made available by every state. Note that the ILI reporting and accessibility vary across all the states. The states we selected were
1) California,
2) Maine,
3) Missouri,
4) New Jersey,
5) New Mexico,
6) North Carolina,
7) Texas, and
8) Wisconsin
. With the exception of Texas, these states did not release ILI data outside of the typical flu season. A complete list of the data sources for the state ILI can be found in Appendix B, and the clinical data are available in Appendix E.
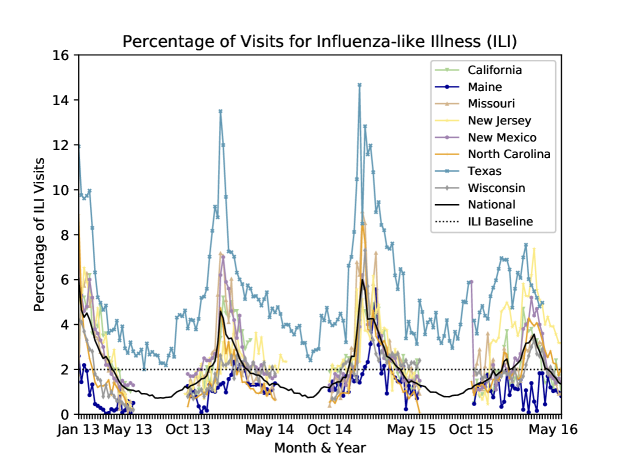
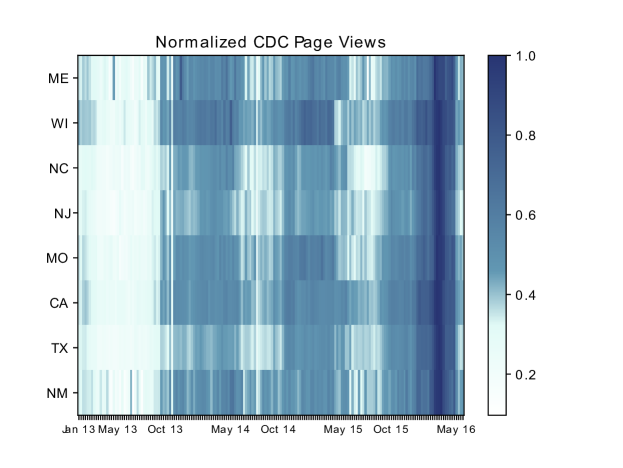
Fig 1 shows the percentage of ILI visits for each state considered in this study as well as the national percentage of ILI visits. We see distinct spikes that indicate the peaks of the flu seasons. With the exception of Maine, which behaves as an outlier at times, the figure shows spikes indicating there are “peak” weeks for influenza-related page views. Texas also exhibits outlier behavior with ILI percentages consistently higher than the typical national baseline of 2%, which is used to determine when the flu has reached epidemic status. These two outliers are shown in teal (Texas) and dark blue (Maine). The national ILI is shown in black. The remaining states exhibit behavior consistent with the national ILI trend. Fig 2 shows the CDC page view data as a heat map: weeks with more page views are shown darker than weeks with fewer page views.
In addition to selected states, we also considered the 9 U.S. census divisions: New England, Middle Atlantic, East North Central, West North Central, South Atlantic, East South Central, West South Central, Mountain, Pacific. For a list of states included in each division, see Appendix C. Data for the census divisions were obtained from the CDC and can be viewed in Appendix D.
2.2 Linear Regression
We used statsmodels version 0.9.0, a statistical analysis module for Python, to perform linear regression on our data sets using OLS. This creates a linear model of the form
where are the regression coefficients, and is the vector of CDC page view data, with representing the number of CDC pages used for the model, ranging from 1 to 10. We correlate ILI and CDC page views for the same week or with a one-week shift. In the shifted cases, we shift the ILI data forward by one week, so that the model associates the current week’s page views with the following week’s ILI data. This shifting is performed to account for the incubation period of influenza and the time between the onset of symptoms and the first doctor visit. Statsmodels uses the CDC page view and ILI data to determine the appropriate regression coefficients, fits parameters with OLS, and computes the goodness of fit, , also referred to as the coefficient of determination. The value measures how well two time series correlate. An indicates a perfect fit, while an value of 0 indicates no correlation. Although is not necessarily the best metric to use for judging goodness of fit [2], it is nonetheless the most common metric used and still provides one with a decent overall sense of fit quality. Additionally, we examined the root mean squared error (RMSE) and the normalized root mean squared error (NRMSE) using Python’s sklearn libraries.
3 Results
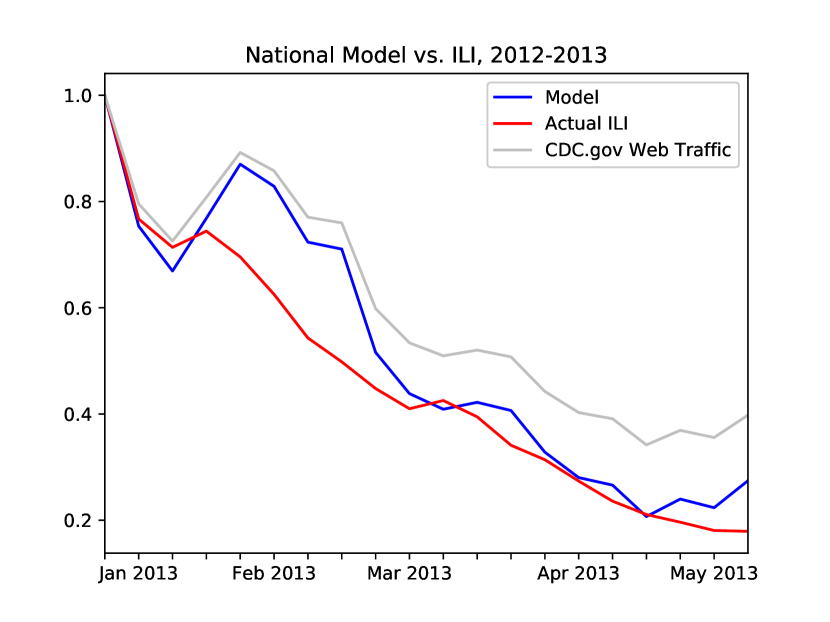
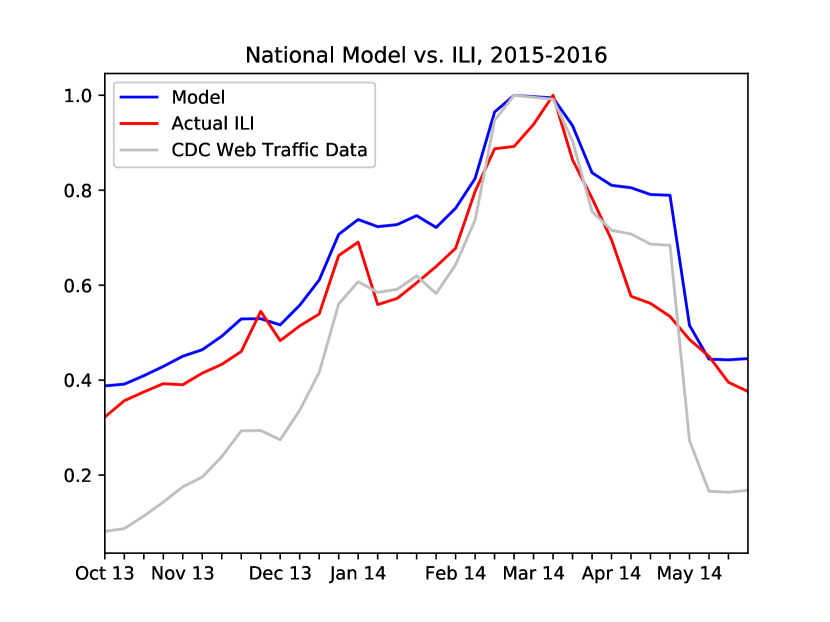
We analyzed the data at the national, division, and state levels and computed the for each geographic resolution. In this section, we discuss the results of our experiments, both successes and failures. We include figures of models at the national, census division, and state levels. Because of the varying scales between page views and ILI percent, we choose to normalize the data and our models in order to plot them on the same axes. We use raw data to create the models, and then we normalize the each model with respect to its maximum. We also normalize the ILI data and CDC.gov web traffic data with respect to their maximums for the given time period so that all three curves may appear in the same plot.
3.1 National Results
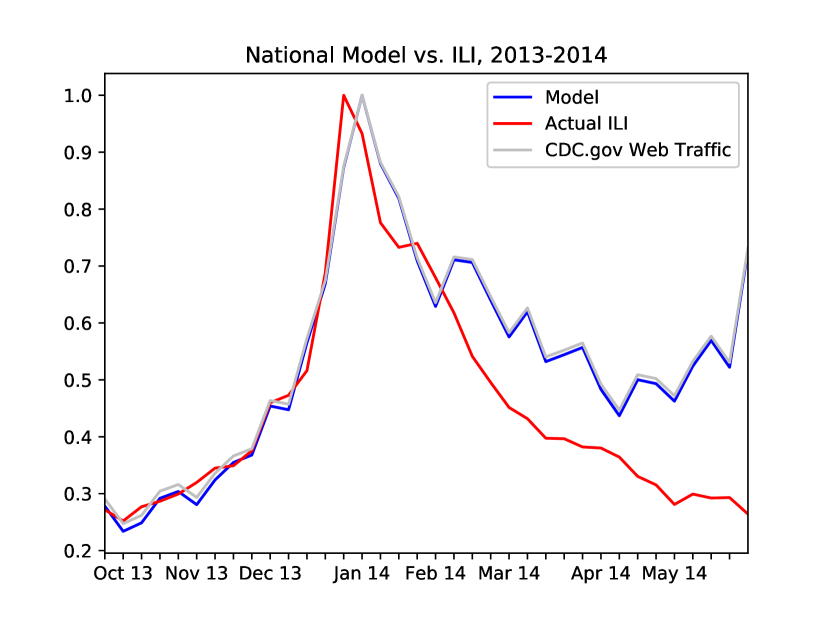
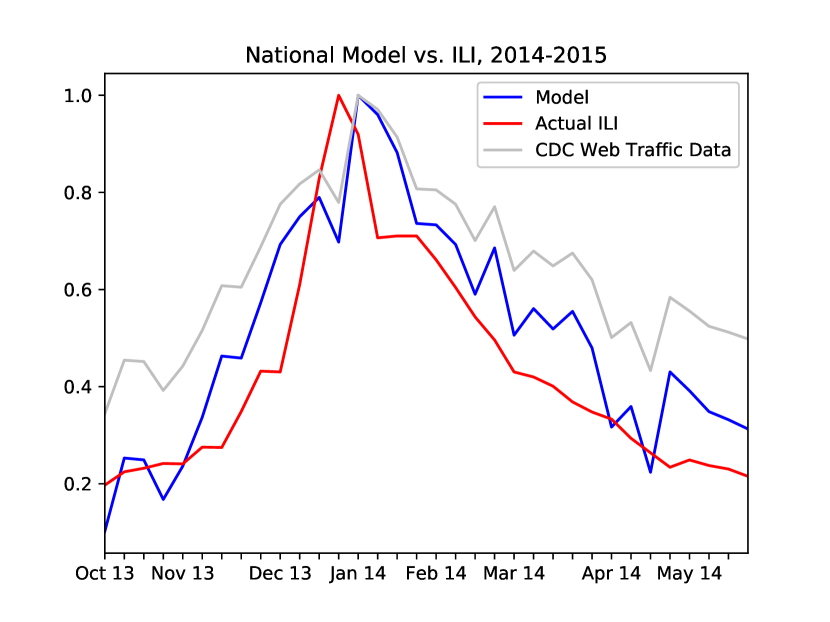
We selected pages that corresponded to the topics most often searched during online health-seeking activites. When we combined all ten pages, we were able to achieve an value of 0.889 for the national 2012–2013 influenza season after implementing a one-week shift. We also had success modeling the national 2015–2016 influenza season with no shift, achieving an value of 0.834. We obtained better results when limiting the pages to FluView, Symptoms, and Treatment, which we attribute to the information on these pages aligning with topics most commonly used for Internet health seeking. For these pages, the most successful models did not have a shift. For the 2012–2013 influenza season, we achieved an of 0.906. The model for the 2015–2016 season had an value of 0.891. Table 1 shows the most successful model for each influenza season included in this study. Fig. 3 shows these models.
| Pages | Season | Shift | RMSE | NRMSE | |
| FluView, Symptoms, Treatment | 2012–2013 | None | 0.912 | 0.423 | 0.070 |
| Symptoms | 2015–2016 | None | 0.892 | 0.213 | 0.060 |
| FluView | 2013–2014 | None | 0.802 | 0.510 | 0.111 |
| Antivirals, Prevention | 2014–2015 | None | 0.778 | 0.615 | 0.103 |
3.2 Census Division Results
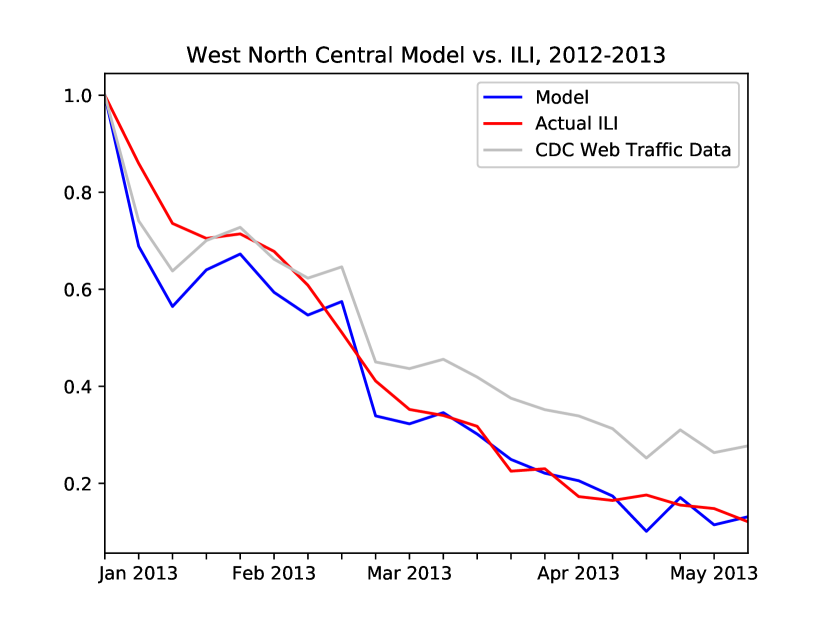
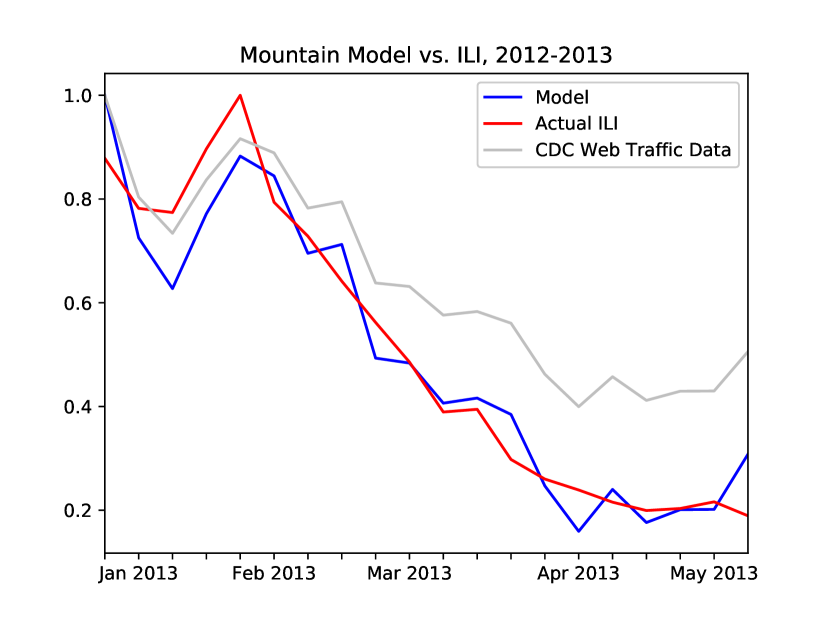
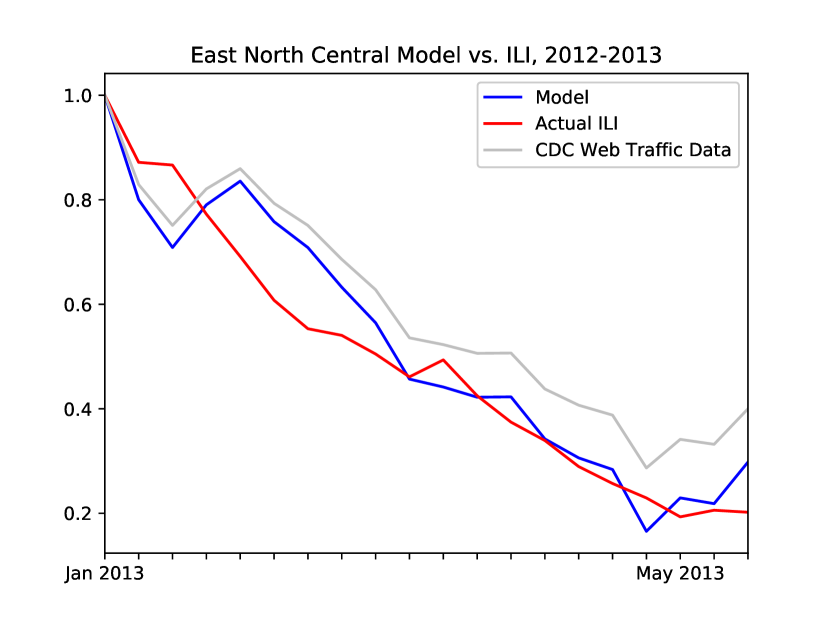
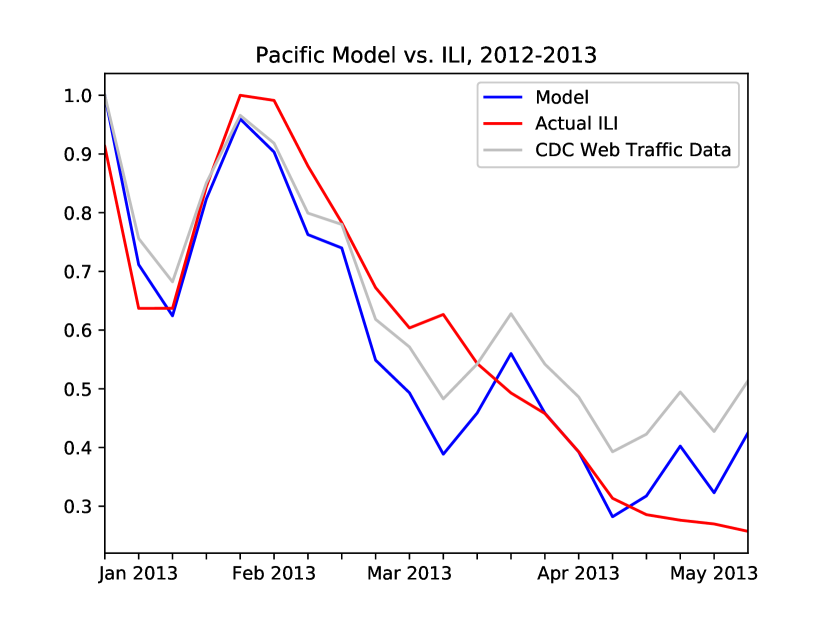
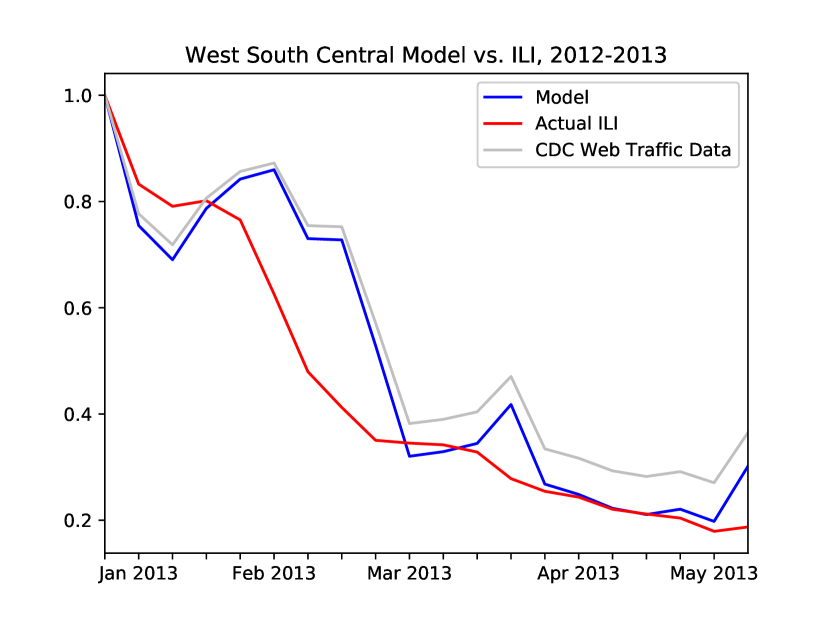
Using the data for each of the nine census divisions, we were able to achieve in at least one case for each division. We considered all seasons together and separately, with the better results coming from modeling each individual season. We considered all pages together and pages most closely associated with topics most commonly searched by health-seeking individuals. In the most successful case, the model was able to closely match the 2015–2016 influenza season for the West North Central division with an of 0.955 using the FluView, Symptoms, and Treatment pages. Although we had successes using all 10 pages, the most successful model for each division involved only these three pages. Fig. 4 shows some of these models, and Table 2 highlights these successes.
| Division | Season | Shift | RMSE | NRMSE | |
| West North Central | 2012–2013 | None | 0.955 | 0.367 | 0.057 |
| Mountain | 2012–2013 | None | 0.921 | 0.336 | 0.077 |
| New England | 2015–2016 | None | 0.920 | 0.096 | 0.096 |
| East North Central | 2012–2013 | 1 Week | 0.899 | 0.331 | 0.076 |
| South Atlantic | 2015–2016 | None | 0.893 | 0.218 | 0.065 |
| Middle Atlantic | 2015–2016 | None | 0.861 | 0.302 | 0.073 |
| Pacific | 2012–2013 | None | 0.849 | 0.503 | 0.094 |
| West South Central | 2012–2013 | None | 0.828 | 0.986 | 0.105 |
| East South Central | 2015–2016 | 1 Week | 0.793 | 0.365 | 0.082 |
3.3 State Results
We found for each of the states considered in this study, using a variety of pages and page combinations. Table 3 lists the most successful model for each state, the season, the data shift, and the value.
| State | Page(s) | Season | Shift | RMSE | NRMSE | |
|---|---|---|---|---|---|---|
| Texas | All | 1 week | 0.917 | 0.730 | 0.073 | |
| Wisconsin | FVST | None | 0.833 | 0.533 | 0.127 | |
| New Jersey | All | 1 week | 0.832 | 0.767 | 0.117 | |
| Missouri | FVST | 1 week | 0.823 | 0.801 | 0.127 | |
| North Carolina | FVST | 1 week | 0.781 | 0.455 | 0.106 | |
| New Mexico | All | 1 week | 0.771 | 1.184 | 0.197 | |
| California | FVST | 1 week | 0.758 | 0.777 | 0.125 | |
| Maine | Antivirals | None | 0.662 | 0.445 | 0.171 |
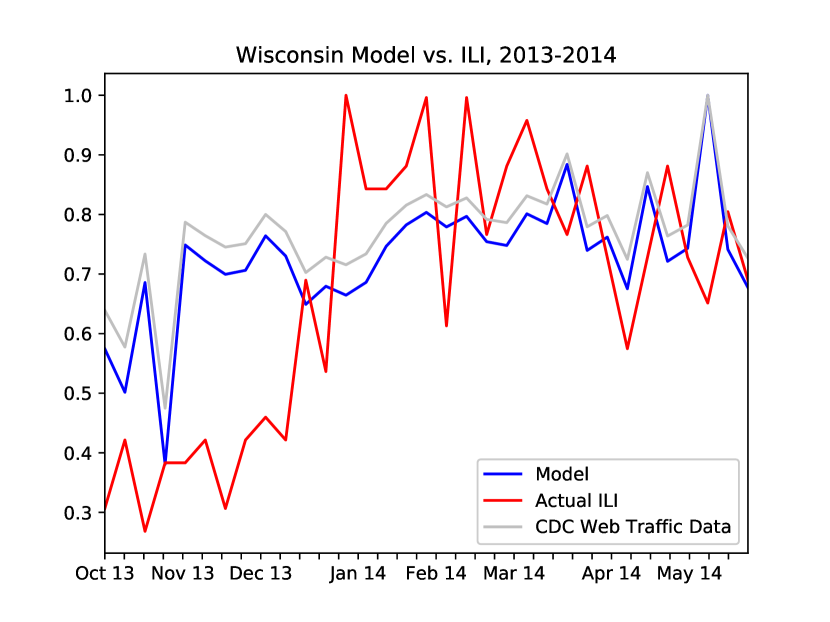
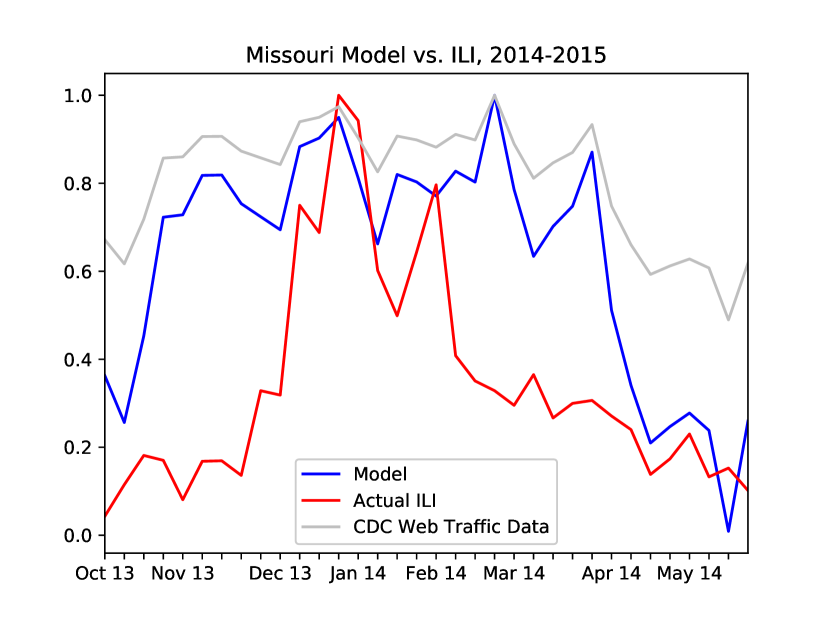
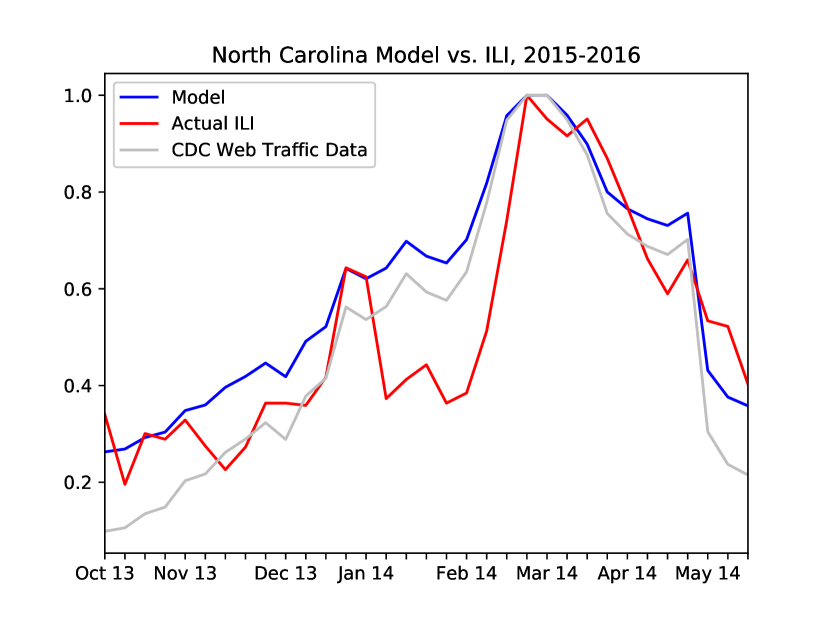
Fig 5 shows both successes and failures at the state level. Adding all of the pages together, we were able to obtain values of 0.917 and 0.801 for Texas (see Fig 5(a)) and Wisconsin (see Fig 5(e)), respectively, for the 2012–2013 influenza season. For the 2013–2014 season, the highest value was 0.187 for Wisconsin (see Fig 5(b)). For the 2014–2015 season, the highest value was 0.322 for Missouri (see Fig 5(c)). For the 2015–2016 season, the highest value was 0.647 for North Carolina (see Fig 5(d)).
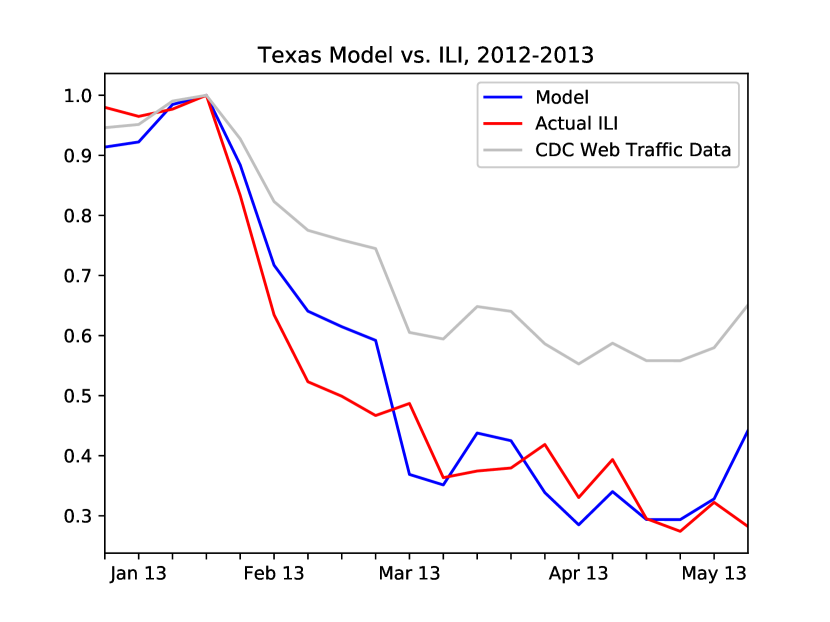
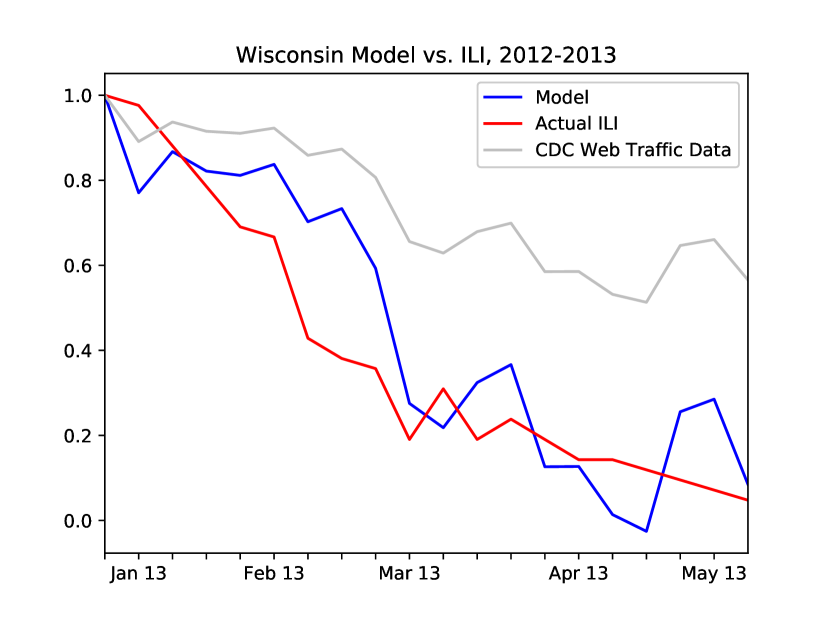
We were not surprised that Texas had the best fit. Texas was the only state we included that provided ILI data not only for the typical influenza season but also for the off-season. This additional data likely contributed to the success of the Texas models. The lack of success we encountered in modeling Maine was also expected because of Maine’s outlier behavior in ILI, having values considerably lower and out of pattern with other states. The models in Fig 5 included all 10 pages aggregated together. However, as indicated by the individual state results, this does not always lead to the best fit. Successful models often included a combination of select pages (such as FluView, Symptoms, and Treatment) but not an aggregation of all 10. Furthermore, aside from Texas, we did not have ILI data for the states outside of the typical flu season. Without this additional data, we are unable to determine how strongly the lower page views in the off-season correlate with off-season ILI.
We then shifted the ILI data forward by one week. The regression analysis yielded 7 state/season combinations with values greater than 0.7 (see Table 4). The table also includes both the regular and normalized root mean squared errors
| State | Season | RMSE | NRMSE | |
|---|---|---|---|---|
| Texas | 2012–2013 | 0.930 | 0.667 | 0.067 |
| New Jersey | 2012–2013 | 0.832 | 0.767 | 0.117 |
| New Mexico | 2015–2016 | 0.771 | 1.184 | 0.197 |
| California | 2012–2013 | 0.746 | 0.797 | 0.129 |
| Wisconsin | 2012–2013 | 0.727 | 0.626 | 0.153 |
| North Carolina | 2015–2016 | 0.708 | 1.028 | 0.204 |
| Missouri | 2012–2013 | 0.702 | 1.039 | 0.165 |
Adding only the FluView, Symptoms, and Treatment pages, we obtained for 6 state/season combinations. For the 2013–2014 season, the highest values were 0.612 for California and 0.568 for Wisconsin. While this is still less than desired, it is a vast improvement upon the values found from adding all 10 pages. For the 2014–2015 season, the highest was 0.575 for Missouri. Again, although the correlation appears to be weak, it is a stronger correlation than taking all 10 pages together. Using these same three pages and implementing a one-week shift, we obtained for 10 state/season combinations. For the 2014–2015 season, the highest value was 0.548 for Missouri.
3.4 Model Failures
We generally found the models to be successful when considering pages most closely related to typical health-seeking behavior and when considering each flu season individually. When trying to model multiple influenza seasons together, we had a number of unsuccessful models. Considering all pages and national ILI data, the model combining the 2012-2013 and 2013-2014 influenza seasons had an of 0.061 and RMSE of 0.553. The combined 2013-2014 and 2014-2015 model had an of 0.241 and RMSE of 0.208. The combined 2014-2015 and 2015-2016 model had an of 0.251 and RMSE of 0.286. At the state level, combining all pages resulted in a number of unsuccessful models. For the 2013-2014 season, the Wisconsin model had an value of 0.187 and RMSE of 0.523. For the 2014-2015 season, the Missouri model had an value of 0.322 and RMSE of 1.845.
We speculate that a number of factors could contribute to these negative results. While influenza is a seasonal disease, similar strains can span multiple years, affecting the susceptible populations in subsequent years. Our data stream may be biased toward individuals with more awareness of the CDC. Furthermore, individuals who search for influenza information in one season may not search for that information the next year. Finally, with the exception of Texas, we only have ILI data for the influenza season itself. Thus, while we do have Internet data for off-season influenza page views, we do not have corresponding ILI data.
4 Conclusions
Internet surveillance data has proven beneficial in predicting ILI incidence during flu seasons. However, our results show that the benefit of Internet data streams on informing disease is inconclusive. That is, our work shows that the CDC website traffic can be informative in some cases (e.g., national level) but not in others (e.g., state level). To determine the extent, we must return to our original research questions.
Q1: Given the successes of some of our models, we can conclude that CDC page view data can be used as an additional data source for monitoring disease incidence in some cases (for example, at the national level). The degree to which this data can be used appears to rely on the page selection and time frame. We obtained successful nowcasts when selecting pages related to topics most commonly used for online health queries (specific diseases and treatments) during the time span of a typical influenza season. Longer time spans and pages less associated with specific diseases and treatments led to less successful models. These results can assist others in selecting appropriate supplemental data sets for disease surveillance.
Q2: We obtained our most successful results using a one-week shift. Two-week shifts were successful in some cases but were overall less correlated than one-week shifts. Using no shift at all proved successful in some cases but not in others. We surmise that the shift required for the best fit depends upon the incubation period for the disease in question as well as the time period of reporting. The CDC Internet data are available daily; however, ILI data are available weekly, so we are limited in the types of shifts we can apply to the data sets.
We conclude that more studies on Internet data streams are needed to understand when and why Internet data works. Our methods are consistent with other feasibility studies and provide insight into conditions under which Internet data streams may inform influenza models. Future work should include rigorously testing the predictive power of the models by separating data into training and testing sets [2].
References
- [1] Hickmann KS, Fairchild G, Priedhorsky R, Generous N, Hyman JM, et al. Forecasting the 2013-2014 influenza season using Wikipedia. PLoS Comput Biol. 2015 May;11(5):e1004239.
- [2] Priedhorskey R, Osthus DA, Daughton A, Moran K, Generous N, et al. Measuring global disease with Wikipedia: success, failure, and a research agenda. Proceedings of the 2017 ACM Conference on Computer Supported Cooperative Work and Social Computing. ACM, 2017.
- [3] Generous N, Fairchild G, Deshpande A, Del Valle SY, Priedhorskey R. Global disease monitoring and forecasting with Wikipedia. PLoS Comput Biol. 2014 Nov;10(11):e1003892.
- [4] McIver DJ, Brownstein JS. Wikipedia usage estimates prevalence of influenza-like illness in the United States in near real-time. PLoS Comput Biol. 2014 Apr;10(4):e1003581.
- [5] Polgreen PM, Chen Y, Pennock DM, Nelson FD, Weinstein RA. Using Internet searches for influenza surveillance. Clinical infectious diseases. 2008 Dec;47(11):1443-1448.
- [6] Kim EK, Seok JH, Oh JS, Lee HW, Kim KH. Use of Hangeul Twitter to track and predict human influenza infection. PLoS ONE. Jul;8(7):e69305.
- [7] Pew Research Center. Health fact sheet [Internet]. PewInternet. 2013 [cited 11 July 2016]. Available from: http://www.pewInternet.org/fact-sheets/health-fact-sheet/
- [8] Pew Research Center. Health topics [Internet]. PewInternet. 2011 [cited 11 July 2016]. Available from: http://www.pewInternet.org/2011/02/01/health-topics-2/
- [9] Ginsberg J, Mohebbi MH, Patel RS, Brammer L, Smolinski MS et al. Detecting influenza epidemics using search engine query data. Nature. 2009 Feb;457(7232):1012-1014.
- [10] Xu D, Liu Y, Zhang M, Ma S, Cui A et al. Predicting epidemic tendency through search behavior analysis. InIJCAI Proceedings-International Joint Conference on Artificial Intelligence. 2011 Jul;22(3):2361.
- [11] Jia-xing B, Bcn-fu L, Geng P, Na L. Gonorrhea incidence forecasting research based on Baidu search data. InManagement Science and Engineering (ICMSE), 2013 International Conference on 2013 Jul 17. p. 36-42. IEEE.
- [12] Bardak B, Tan M. Prediction of influenza outbreaks by integrating Wikipedia article access logs and Google flu trend data. InBioinformatics and Bioengineering (BIBE), 2015 IEEE 15th International Conference on 2015 Nov 2. p. 1-6. IEEE.
- [13] Dugas AF, Jalalpour M, Gel Y, Levin S, Torcaso F et al. Influenza forecasting with Google Flu Trends. PLoS ONE. Feb;8(2):e56176.
- [14] Johnson HA, Wagner MM, Hogan WR, Chapman W, Olszewski RT et al. Analysis of Web logs for surveillance of influenza. Stud Health Technol Inform. 2004;107(Pt 2):1202-1206.
- [15] Molinari NM, Ortega-Sanchez IR, Messonnier ML, Thompson WW, Wortley PM, et al. The annual impact of seasonal influenza in the US: Measuring disease burden and costs. Vaccine. 2007 25(27):5086-5096.
- [16] Centers for Disease Control and Prevention. Glossary of Influenza (Flu) Terms. https://www.cdc.gov/flu/glossary/index.htm, accessed 11 Oct. 2018.
- [17] Baltrusaitis K, Brownstein JS, Scarpino SV, Bakota E, Crawley A, et al. Comparison of crowd-sourced, electronic health records based, and traditional health-care based influenza-tracking systems at multiple spatial resolutions in the United States of America. BMC Infectious Diseases. 2018 Dec;18(1):403.
- [18] Biggerstaff M, Alper D, Dredze M, Fox S, Fung IC, et al. Results from the centers for disease control and prevention’s predict the 2013–2014 Influenza Season Challenge. BMC Infectious Diseases. 2016 Dec;16(1):357.
- [19] Broniatowski DA, Paul MJ, Dredze M. National and local influenza surveillance through Twitter: an analysis of the 2012–2013 influenza epidemic. PloS one. 2013 Dec 9;8(12):e83672.
- [20] Santillana M, Nguyen AT, Dredze M, Paul MJ, Nsoesie EO, et al. Combining Participatory Influenza Surveillance with Modeling and Forecasting: Three Alternative Approaches. JMIR Public Health and Surveillance. 2017 Oct;3(4).
- [21] Chretien JP, George D, Shaman J, Chitale R, McKenzie FE. Influenza Forecasting in Human Populations: A Scoping Review. PloS one. 2014 Apr 8;9(4):e94130.
- [22] Paul MJ, Dredze M, Broniatowski D Twitter Improves Influenza Forecasting. PloS currents. 2014 Oct 28;6.
- [23] Perrotta D, Tizzoni M, Paolotti D. Using Participatory Web-based Surveillance Data to Improve Seasonal Influenza Forecasting in Italy. Proceedings of the 26th International Conference on World Wide Web. International World Wide Web Conferences Steering Committee. 2017 Apr 3;303–310.
- [24] Santillana M, Nguyen A, Dredze M, Paul MJ, Nsoesie EO, et al. Combining Search, Social Media, and Traditional Data Sources to Improve Influenza Surveillance. PloS Computational Biology. 2015 Oct 29;11(10):e1004513.
- [25] Shaman J, Karspeck A. Forecasting seasonal outbreaks of influenza. Proceedings of the National Academy of Sciences. 2012 Dec 11;109(50):20425–30.
- [26] Zhang Q, Perra N, Perrotta D, Tizzoni M, Paolotti D, et al. Forecasting Seasonal Iinfluenza Fusing Digital Indicators and a Mechanistic Disease Model. Proceedings of the 26th International Conference on World Wide Web. International World Wide Web Conferences Steering Committee. 2017 Apr 3;311–319.
- [27] Lampos V, Miller AC, Crossan S, Stefansen Christian. Advances in nowcasting influenza-like illness rates using search query logs. Scientific Reports. 2015 Aug 3;5:12760.
- [28] Lampos V, Zou B, Cox IJ. Enhancing Feature Selection Using Word Embeddings: The Case of Flu Surveillance. Proceedings of the 26th International Conference on World Wide Web. International World Wide Web Conferences Steering Committee. 2017 Apr 3;695–704.
- [29] Yang S, Santillana M, Kou SC. Accurate estimation of influenza epidemics using Google search data via ARGO. Proceedings of the National Academy of Sciences. 2015 Nov 24;112(47):14473-8.
Appendix A
CDC Pages
This section contains the names and time frames for each page used. Some of the pages were renamed during the time period covered here.
Antivirals
| Dates | Page Name |
|---|---|
| 12/30/12–10/20/13 | CDC–Seasonal Influenza (Flu)–Antivirals |
| 10/20/13–8/10/14 | CDC–Antiviral Dosage Health Professionals |
| Seasonal Influenza (Flu) | |
| 8/24/14–5/28/16 | Antiviral Dosage Health Professionals Seasonal Influenza (Flu) |
Flu Basics
| Dates | Page Name |
|---|---|
| 12/30/12–10/13/13 | CDC–Seasonal Influenza (Flu)–Seasonal Influenza Q & A: Flu Basics |
| 10/13/13–6/8/14 | CDC–Seasonal Influenza: Flu Basics Seasonal Influenza (Flu) |
| 6/8/14–7/27/14 | Seasonal Influenza: Flu Basics Seasonal Influenza (Flu) |
| 7/27/14–8/31/14 | Seasonal Influenza: Flu Basics About (Flu) CDC |
| 8/31/14–5/28/16 | Seasonal Influenza: Flu Basics Seasonal Influenza (Flu) CDC |
FluView
| Dates | Page Name |
|---|---|
| 12/30/12–10/26/14 | CDC–Seasonal Influenza (Flu)–FluView Interactive |
| 10/26/14–5/28/16 | FluView Interactive Seasonal Influenza (Flu) CDC |
High Risk Complications
| Dates | Page Name |
|---|---|
| 12/30/12–10/13/13 | CDC–Seasonal Influenza (Flu)–People at High Risk |
| of Developing Flu-Related Complications | |
| 10/13/13–6/8/14 | CDC–People at High Risk of Developing |
| Flu-Related Complications Seasonal Influenza (Flu) | |
| 6/8/14–7/27/14 | CDC–People at High Risk of Developing |
| Flu-Related Complications Seasonal Influenza (Flu) | |
| 8/17/14–5/28/16 | CDC–People at High Risk of Developing |
| Flu-Related Complications Seasonal Influenza (Flu) CDC |
Key Facts
| Dates | Page Name |
|---|---|
| 12/30/12–10/27/13 | CDC–Seasonal Influenza (Flu)–Key Facts |
| About Seasonal Flu Vaccine | |
| 10/27/13–7/13/14 | CDC–Key Facts About Seasonal Flu Vaccine |
| Seasonal Influenza (Flu) | |
| 7/13/14–7/27/14 | Key Facts About Seasonal Flu Vaccine |
| Seasonal Influenza (Flu) | |
| 7/27/14–5/28/16 | Key Facts About Seasonal Flu Vaccine |
| Seasonal Influenza (Flu) CDC |
Prevention
| Dates | Page Name |
|---|---|
| 12/30/13–10/20/13 | CDC–Seasonal Influenza (Flu)–Prevention Strategies |
| for Seasonal Influenza in Healthcare Settings | |
| 10/27/13–6/1/14 | CDC–Prevention Strategies |
| for Seasonal Influenza in Healthcare Settings Healthcare | |
| Professionals S… | |
| 6/8/14–5/28/16 | Prevention Strategies |
| for Seasonal Influenza in Healthcare Settings Health | |
| Professionals Seasona… |
Symptoms
| Dates | Page Name |
|---|---|
| 12/30/12–10/13/13 | CDC–Seasonal Influenza (Flu)–Flu Symptoms & Severity |
| 10/20/13–6/8/14 | CDC–Flu Symptoms & Severity Seasonal Influenza (Flu) |
| 6/15/14–7/27/14 | Flu Symptoms & Severity Seasonal Influenza (Flu) |
| 7/27/14–8/31/14 | Flu Symptoms & Severity About (Flu) CDC |
| 9/7/14–5/28/16 | Flu Symptoms & Severity Seasonal Influenza (Flu) CDC |
Treating Influenza
| Dates | Page Name |
| 12/30/12–2/28/16 | CDC–Seasonal Influenza (Flu)–Q & A: Treating the Flu |
Treatment
| Dates | Page Name |
|---|---|
| 12/30/12–10/13/13 | CDC–Seasonal Influenza (Flu)–H3N2v Treatment |
| 10/13/13–6/8/14 | CDC–Treatment–Antiviral Drugs Seasonal Influenza (Flu) |
| 6/8/14–7/27/14 | Treatment–Antiviral Drugs Seasonal Influenza (Flu) |
| 7/27/14–5/28/16 | Treatment–Antiviral Drugs Seasonal Influenza (Flu) CDC |
Vaccine
| Dates | Page Name |
|---|---|
| 12/20/12–9/7/14 | CDC–Seasonal Influenza (Flu)–Vaccination |
| 8/31/14–5/28/16 | Cell-based Flu Vaccines Seasonal Influenza (Flu) CDC |
Appendix B
State ILI Sources
This section contains the sources used for the listed states’ ILI percents.
California
ILI data were obtained from the California Department of Public Health website at the following URL:
-
•
http://www.cdph.ca.gov/data/statistics/Pages/CISPDataArchive.aspx
Maine
ILI data were obtained from the State of Maine Department of Health and Human Services website at the following URL:
-
•
http://www.maine.gov/dhhs/mecdc/infectious-disease/epi/influenza/influenza-surveillance-archives.htm
Missouri
ILI data were obtained from the Missouri Department of Health & Senior Services website at the following URL:
-
•
http://health.mo.gov/living/healthcondiseases/communicable/influenza/reports.php
New Jersey
ILI data were obtained from the State of New Jersey Department of Health website at the following URLs:
-
•
http://www.state.nj.us/health/flu/archives/shtml
-
•
http://www.state.nj.us/health/flu/fluinfo.shtml
New Mexico
ILI data were obtained from the New Mexico Department of Health website at the following URL:
-
•
https://nmhealth.org/about/erd/ideb/isp/data/
North Carolina
ILI data were obtained from the North Carolina Health and Human Services website at the following URLs:
-
•
http://epi.publichealth.nc.gov/cd/flu/figures/flu1213.pdf
-
•
http://epi.publichealth.nc.gov/cd/flu/figures/flu1314.pdf
-
•
http://epi.publichealth.nc.gov/cd/flu/figures/flu1415.pdf
-
•
http://flu.nc.gov/data/documents/flu1516.pdf
Texas
ILI data were obtained from the Texas Department of State Health Services website at the following URLs:
-
•
www.dshs.texas.gov/idcu/disease/influenza/surveillance/2013/
-
•
www.dshs.texas.gov/idcu/disease/influenza/surveillance/2014/
-
•
www.dshs.texas.gov/idcu/disease/influenza/surveillance/2015/
Wisconsin
ILI data were provided by Thomas E. Haupt of Wisconsin Department of Health Services.
Appendix C
Census Divisions
This section lists the states that comprise each of the U.S. census division.
East North Central
-
•
Illinois
-
•
Indiana
-
•
Michigan
-
•
Ohio
-
•
Wisconsin
East South Central
-
•
Alabama
-
•
Kentucky
-
•
Mississippi
-
•
Tennessee
Middle Atlantic
-
•
New Jersey
-
•
New York
-
•
Pennsylvania
Mountain
-
•
Arizona
-
•
Colorado
-
•
Idaho
-
•
Montana
-
•
New Mexico
-
•
Nevada
-
•
Utah
-
•
Wyoming
New England
-
•
Connecticut
-
•
Maine
-
•
Massachusetts
-
•
New Hampshire
-
•
Rhode Island
-
•
Vermont
Pacific
-
•
Alaska
-
•
California
-
•
Hawaii
-
•
Oregon
-
•
Washington
South Atlantic
-
•
Delaware
-
•
Florida
-
•
Georgia
-
•
Maryland
-
•
North Carolina
-
•
South Carolina
-
•
Virginia
-
•
West Virginia
West North Central
-
•
Iowa
-
•
Kansas
-
•
Minnesota
-
•
Missouri
-
•
Nebraska
-
•
North Dakota
-
•
South Dakota
West South Central
-
•
Arkansas
-
•
Louisiana
-
•
Oklahoma
-
•
Texas
Appendix D
Regional and National ILI
The ILI data at both the census division and national levels are available in RegionalNationalILI.csv.
Appendix E
State ILI
The ILI data for the states used in this study are available in StateILI.csv.