Systematic Raman study of optical phonons in Ba2Cu3O6+δ ( = Y, Dy, Gd, Sm, Nd): Antiferromagnetic coupling strength versus lattice parameters
Abstract
We present a systematic study of the interplay between lattice parameters and the energy of the optical phonons as well as the antiferromagnetic coupling strength, , in the high- superconducting cuprate Ba2Cu3O6+δ (-123, Y, Dy, Gd, Sm, Nd) with hole doping (). The energy of the mode at cm-1 has been found to relate systematically to the inverse of the lattice parameter . Our results confirm the temperature dependent phonon splitting for Nd-123 at low doping, which has been reported for optimally doped Nd-123. Surprisingly, is independent of for the first four families, and a general consistency between and , as suggested in a previous investigation, could not be confirmed.
pacs:
74.25.ndI Introduction
Ba2Cu3O6+δ (-123) hosts a variety of electronic and magnetic properties. The mechanisms leading to the complexity of its phase diagram, e.g., antiferromagnetic (AFM), pseudogap, metallic, superconducting states are still unresolved quantummatter ; SC . Its physical properties depend on the temperature, and doping, which is controlled by the oxygen content charge ; Jorgensen . At optimal hole doping (), it reaches a superconducting transition temperature of K TcmaxY ; TcmaxNd . At low doping () it is an AFM Mott insulator Mott ; mottinsulator with an AFM coupling strength on the order of meV J ; ev . The Heisenberg model describes the long-range AFM ordering via nearest-neighbor interaction of the spin carriers but does not explain the doping dependence. The generally accepted Hubbard model deals with the doped case although it fails to explain the material dependent systematics, for example, the properties of the refractive sum shannon . The Heisenberg and Hubbard models in their simplest form are related at strong coupling via , where is the hopping parameter and the on-site interaction.
Our study focuses on the electronic and magnetic properties of -123 by analyzing the phonon modes and two-magnon scattering from Raman scattering experiments. The required energy for a spin-flip process depends on and relates to the Raman shift of the two-magnon peak, Parkinson ; conversiontoJ ; Chubukov ; Weidinger . Since is not expected to vary between materials, measurements of actually reflect on , a parameter that is relevant at all doping.
The lattice parameters are controlled by the radius of the rare-earth () ion, . Our -123 samples ( Y, Dy, Gd, Sm, Nd) order antiferromagnetically. The magnetic moment resides on the Cu ion, which lie within the crystallographic plane. These samples have a hole-doping content of (see Table 1) in which the lattice parameters and are equal spacegroup ; space . Reference values of and the lattice parameter and were obtained from a neutron diffraction study by Guillaume et al. Guillaume and are found in Table 2.
II Experimental
Long-range magnetic order decreases with increasing temperature; hence the two-magnon data was collected at K. A helium flow cryostat (KONTI-cryostat-Mikro) cooled the samples in a vacuum environment. The micro-Raman setup (Jobin-Yvon, LabRAM HR) operates with a liquid nitrogen cooled CCD camera (Horiba, Spectrum One) and a Nd:YAG solid-state laser which emits an excitation wavelength of nm. The confocal setup with 50x magnification produced a laserspot on the sample with a diameter of m and a laser power of W. We use the Porto notation to describe the light polarization and orientation of the sample. The low temperature measurements were taken in backscattering geometry because two-magnon scattering is strongest in symmetry Chelwani .
Each sample is an agglomerate of single crystals of sizes up to m. The doping of the crystals has been adjusted by annealing in argon, typically at C, followed by quenching into liquid nitrogen. In each case, the doping state was determined using measurements of thermoelectric power Obertelli (i.e., Seebeck coefficient) at room temperature, exp() Sconvertedtop , and confirmed to be close to zero hole doping. Since the two-magnon Raman shift can be analyzed in terms of the Heisenberg model only in the undoped case, the lightly doped samples allow us to either verify that our results are doping independent or extrapolate them to zero doping if needed.
| -123 | (holes per Cu atom) |
|---|---|
| Y-123 | 0.027, 0.017, 0.000 |
| Dy-123 | 0.026, 0.023, 0.020, 0.001, 0.000 |
| Gd-123 | 0.024, 0.017, 0.003, 0.001, 0.000 |
| Sm-123 | 0.024, 0.020, 0.006, 0.000 |
| Nd-123 | 0.036, 0.025, 0.000 |
III Results and discussion
The orientation of the crystal has been determined by polarization dependent measurements at room temperature, in which each sample was rotated in steps of approximately and measured sequentially; see Fig. 1(a). The highest scattering intensity of the mode at cm-1 determines the geometry, whilst the low intensity of this mode at (and symmetry related angles) indicates good crystallinity within the measurement area. Figure 1(b) shows the phonon spectra of different -123. Each hosts a mode at cm-1 involving antiphase vibrations of the oxygen ions in the CuO2 layers. A broad mode with weak intensity emerges at cm-1 in Sm-123 and also in Gd-123, Dy-123, and Y-123. This mode has been observed in previous studies on AFM Y-123 broadmode . Our polarization dependent measurement, see Fig. 1(a), shows that this mode has character.
Some additional modes appear around cm-1, cm-1, and cm-1 and are associated with, respectively, in-phase O vibration on the CuO2 sites, O vibration on the apical site, and O vibration on the Cu-O chain sites modes ; Limonov . The mode at cm-1 involves vibrations of the in-plane Cu ions Inder . In Nd-123, this mode is only observed at [see Fig. 1(c)]. The absence of the mode with even slightly higher correlates with the phonon splitting of the mode in Nd-123. This phonon splitting has been observed in optimally doped Nd-123 ionsize ; crystal-field ; crystal-field2 . It is ascribed to the coupling and mixing of the mode to a crystal-field excitation that involves a Nd3+ 4 electron. Our data confirms this splitting between in which the modes have a Raman shift of cm-1 and cm-1. No such splitting is observed at and all temperatures. With increasing , the structure of Nd-123 might become more susceptible to changes and phonon-crystal-field splitting. An anomalous shift of the phonon crystal-field excitation at room temperature is observed throughout the investigated doping region, i.e., the phonon has a Raman shift of cm-1 instead of cm-1 as illustrated in Fig. 1(c).
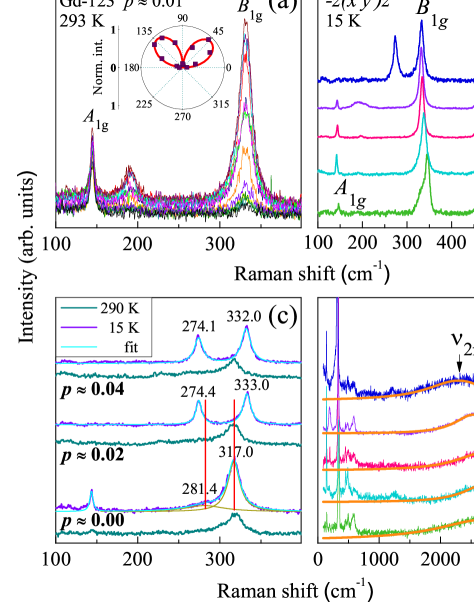
Figure 1(d) depicts the two-magnon spectra with the peak position at . For spin systems, as present in the examined samples, relates to with Parkinson ; conversiontoJ , Chubukov , or Weidinger depending on the theoretical approach; we chose the first one to be consistent with Ref. dielectricRaman . The peaks are predominantly fitted with a Lorentzian function and an additional Gaussian function towards the higher Raman shift region of . We ascribe this to contributions from magnons and electrons, respectively correlated .
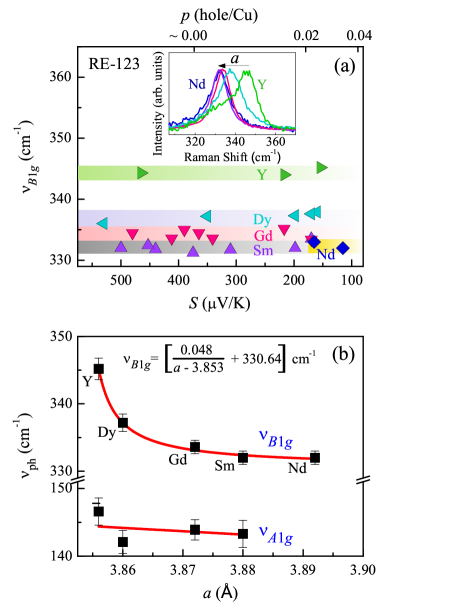
Figure 2(a) shows the Raman shift of the mode, . The data points are assigned to a certain symbol and color, corresponding to the ion. The Raman shift of the mode remains unaffected within our investigated doping region, illustrated with the shaded areas. The inset of Fig. 2(a) depicts spectra of the mode from Nd-123, Sm-123, Gd-123, Dy-123, and Y-123 (left to right). The Raman shift of the two modes, and , are listed in Table 2 and are plotted versus the lattice parameter in Fig. 2(b). The Raman shift of the mode monotonically decreases with increasing lattice parameter in agreement with previous studies FriedlPRL90 . We find that it relates to according to
The mode has a similar trend with a larger margin of error due to the weak scattering intensity of this mode.
The analysis seen in Fig. 2(b) demonstrates that the Raman shift of the mode undergoes a greater change with than the mode. A possible explanation for this might be the proximity of the modes to the ion, because the radius of the ion is varied to tune the lattice parameters. The mode is about half the distance to the ion than the mode. Also noteworthy is the lower limit of the mode at cm-1 towards larger .
| -123 | , | c | buckling angle | reference | ||||||
|---|---|---|---|---|---|---|---|---|---|---|
| (Å) | (Å) | (Å) | (K) | a/b-axis (∘) | (cm-1) | (cm-1) | (cm-1) | (cm-1) | (meV) | |
| Y-123 | 1.019 | 3.856 | 11.793 | 93.5 | 6.2 | 146.6 | 345.2 | 2634 | 2615 | 101.5∗ |
| Dy-123 | 1.027 | 3.860 | 11.796 | 92.2 | 6.04 | 142.1 | 337.2 | 2749 | 2678 | 105.8∗ |
| Gd-123 | 1.053 | 3.872 | 11.807 | 93.6 | 6.06 | 143.9 | 333.6 | 2735 | 2620 | 105.3∗ |
| Eu-123 | 1.066 | 3.879 | 11.811 | 94.0 | 5.43 | n.a | n.a | n.a. | 2610 | 100.5 |
| Sm-123 | 1.079 | 3.880 | 11.815 | 94.7 | 5.63 | 143.3 | 332.0 | 2574 | 2605 | 99.1∗ |
| Nd-123 | 1.109 | 3.893 | 11.830 | 96.1 | 6.90 | n.a. | 332.1 | 2294 | 2525 | 88.3∗ |
| Pr-123 | 1.126 | 3.900 | 11.832 | n.a | 6.06 | n.a | n.a. | n.a. | 2190 | 84.3 |
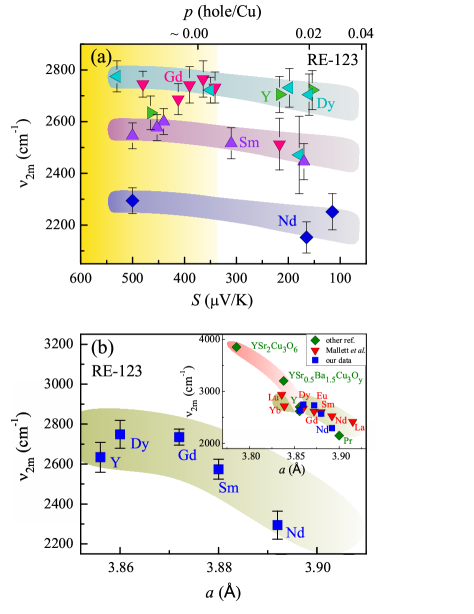
As seen in Fig. 1(d), the Raman shift of is only marginally affected within the investigated doping range. Generally, the two-magnon peak hardens with decreasing doping and is consistent with previous studies on other high- SC cuprates Dirk ; Sugai ; Brenig ). This trend is illustrated with the shaded areas in Fig. 3(a) for Dy-123, Sm-213 and Nd-123. The yellow shaded area indicates the region for (V/K). From this region, the average value of for each -123 is plotted versus in Fig. 3(b) and is listed in Table 2 as well. The olive green shaded area shows the systematic relation between and . The surprising result is that from Y-123 to Sm-123 there is no change in within experimental errors and only for Nd-123 a downward trend is observed. This stands in contrast to the systematic behavior of the mode. is independent of for four out of five samples we reexamined.
Reference values of for YSr2Cu3O6 YSr2 , YSr0.5Ba1.5Cu3O6 ionsize ; dielectricRaman , and other lanthanide (Ln) Ln-123 are considered in the inset of Fig. 3(b) shown with green diamonds and red triangles dielectricRaman in order to cover the widest possible range for versus . These compounds have the same structure as -123. However, YSr2Cu3O6 is synthesized under high oxygen pressure YSr2 ; YSr2-2 and, along with YSr0.5Ba1.5Cu3O6, is more compressed because Sr is substantially smaller than Ba while the compounds are otherwise isostructural with Y-123. Nevertheless, the different out-of-plane structure possibly renders these last two compounds in a class on their own. The green and pink shaded areas in the inset of Fig. 3(b) emphasize these two classes yet together they show a systematic decrease of with increasing for -123, but perhaps with different rates. As Y-123 is not part of the lanthanide series plus the fact that its orbital structure differs slightly from the Ln-123, it is not clear to which class it belongs (green or pink). Hence it is represented in both areas. The uniqueness of Y might be the reason for the different dependence of in the pink area compared with the remaining Ln-123. The apical oxygen bond length could be a crucial factor that influences apical and might account for the low value of in the Y-123 compared with the other Y based compounds. Beyond that we need to recognize that any small variations may be attributable to compositional or doping variations, particularly noting that Raman and thermopower effectively probe different depths in samples where we have attempted, with difficulty, to remove the last dopant oxygen.
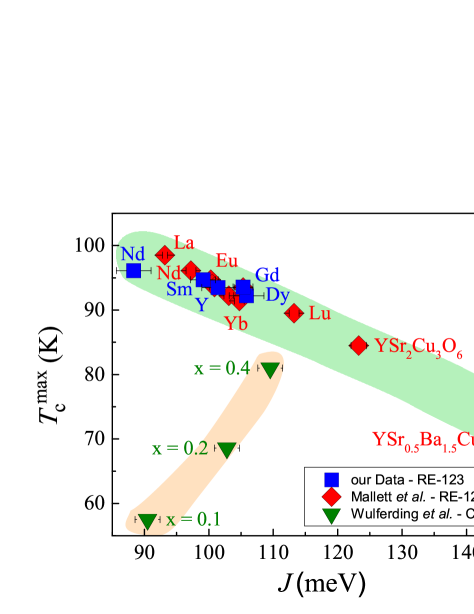
Studies on whether relates to have led to conflicting findings. Wulferding et al. observed, using Raman, a linear increase of T with increasing in (CaxLa1-x)(Ba1.75-xLa0.25+x)Cu3Oy (CLBLCO), an isostructural compound to -123, and proposed a correlation between these parameters Dirk . Their measurements are in agreement with determination by muon spin rotation OferPRB06 , resonance inelastic x-ray scattering EllisPRB15 , and with measurement by angle resolved photoemission spectroscopy DrachuckPRB14 . On the other hand, Mallett et al. observed a decreasing with but also found the opposite behavior when applying external pressure on -123 dielectricRaman ; Tallon . Both, the data of Wulferding et al. and Mallett et al. regarding versus are compared to our data in Fig. 4. The data of Mallett et al. is in good agreement with our data (apart from the Nd-123 sample). The contradicting result of Wulferding et al. to the other two results suggests that no general conclusion between and can be drawn based on Fig. 4. Reasons for this contradiction have been proposed Tallon .
IV Summary
A systematic relation between the energy of the optical phonons and the lattice parameter could be determined. In previous studies a -dependent phonon splitting of the mode was observed in optimally-doped Nd-123 crystal-field ; crystal-field2 . Our results confirm this splitting for low hole doping, but not for undoped Nd-123. For the samples we reexamined, the AFM coupling strength, , did not decrease monotonically with increasing lattice parameter . When considering other studies, including samples prepared under high pressure, a general trend of decreasing with increasing becomes apparent, although with a plateau around Å. A universal relation between and as suggested previously Dirk could not be established.
V Acknowledgements
This work has been made possible by the support of the Deutsche Forschungsgemeinschaft DFG Grant No. LE967/16-1 and QUANOMET initiative within Project LENA-NL4-1, and by the German-Israeli Foundation for Scientic Research and Development (GIF). BPPM acknowledges support from the Rutherford Foundation of New Zealand. We thank Kim Paul Schmidt, Dr. Roser Valentí and Bo Liu for constructive discussions.
References
- (1) B. Keimer, S. A. Kivelson, M. R. Norman, S. Uchida, and J. Zaanen Nature, vol. 518, pp. 179–186, (2015).
- (2) J. G. Bednorz and K. A. Müller Z. Phys. B, vol. 64, (1986). pp. 189-193.
- (3) R. Cava Science, vol. 247, pp. 656–662, (1990). Provided by the SAO/NASA Astrophysics Data System.
- (4) J. D. Jorgensen, P. Lightfoot, and S. Pei Superconductor Science and Technology, vol. 4, no. 1S, pp. 11–18, (1991).
- (5) Physica C: Superconductivity, vol. 204, no. 3, pp. 237–246.
- (6) B. W. Veal, A. P. Paulikas, J. W. Downey, H. Claus, K. Vandervoort, G. Tomlins, H. Shi, M. Jensen, and L. Morss Physica C, vol. 97, pp. 162–164, (1989).
- (7) R. Wesche, Physical Properties of High Temperature Superconductors. The Atrium, Southern Gate, Chickester, West Sussex, PO19 8SQ, UK: John Wiley & Sons, Ltd, (2015). p. 482.
- (8) P. A. Lee, N. Nagaosa, and X.-G. Wen Rev. Mod. Phys., vol. 78, pp. 17–85, (2006).
- (9) R. Birgenau and G. Shirane, Physical Properties of High Temperature Superconductors I. P O Box 128, Farrer Road, Singapore 9128: World Scientific Publishing Co. Pte. Ltd, (1989). pp. 151-153.
- (10) S. Sugai, M. Sato, T. Kobayashi, J. Akimitsu, T. Ito, H. Takagi, S. Uchida, S. Hosoya, T. Kajitani, and T. Fukuda Phys. Rev. B, vol. 42, pp. 1045–1047, (1990).
- (11) R. Shannon Journal of Applied Physics, vol. 73, pp. 348 –366, (1993).
- (12) J. B. Parkinson Journal of Physics C: Solid State Physics, vol. 2, no. 11, pp. 2003–2011, (1969).
- (13) A. V. Chubukov and D. M. Frenkel Phys. Rev. B, vol. 52, pp. 9760–9783, (1995).
- (14) A. V. Chubukov and D. M. Frenkel Phys. Rev. Lett., vol. 74, pp. 3057–3060, (1995).
- (15) S. A. Weidinger and W. Zwerger Eur. Phys. J. B, vol. 88, (2015).
- (16) M. Glazer and A. N. G. G. Burns, Space Groups for Solid State Scientists. 1250 Sixth Avenue, San Diego, CA 92101: Academic Press, Inc., (1990). p. 263.
- (17) Z.-X. Chai and Y. Zhu, Microstructures and Structural Defects in High-temperature Superconductors. Brookhaven National Laboratory Upton, New York, USA: World Scientific Bublishing Co. Pte. Ltd., (1998). p. 46.
- (18) M. Guillaume, P. Allenspach, W. Henggeler, J. Mesot, B. Roessli, U. Staub, P. Fischer, A. Furrer, and V. Trounov Journal of Physics: Condensed Matter, vol. 6, no. 39, p. 7963, (1994).
- (19) N. Chelwani and et al. Phys. Rev. B, vol. 97, p. 024407, (2018).
- (20) S. D. Obertelli, J. R. Copper, and J. L. Tallon Phys. Rev. B, vol. 46, no. 22, pp. 14928–14931, (1992).
- (21) J. L. Tallon, C. Bernhard, H. Shaked, R. L. Hitterman, and J. D. Jorgensen Phys. Rev. B, vol. 51, pp. 12911–12914, (1995).
- (22) H. Kuzmany, M. Mehring, and J. Jink, Electronic Properties of High-T Superconductors. Tiergartenstrasse 17, D-69121 Heidelberg, Germany: Springer-Verlag, (1992). p. 218.
- (23) W. H. Weber and R. Merlin, Raman Scattering in Material Science. Tiergartenstrasse 17, D-69121 Heidelberg, Germany: Springer-Verlag, (2000). p. 162-165.
- (24) M. F. Limonov, S. Tajima, and A. Yamanaka Phys. Rev. B, vol. 62, pp. 11859–11863, (2000).
- (25) R. Bhattacharya and M. P. Paranthaman, High Temperature Superconductors. Reading, Massachusetts: WILEY-VCH Verlag GmBH and Co. KGaA, (2006). p. 100.
- (26) B. P. P. Mallet, Ion-size effects on cuprate High Temperature Superconductors. PhD thesis, Victoria University of Wellington, (2013).
- (27) E. T. Heyen, R. Wegerer, and M. Cardona Phys. Rev. Lett., vol. 67, pp. 144–147, (1991).
- (28) E. T. Heyen, R. Wegerer, E. Schönherr, and M. Cardona Phys. Rev. B, vol. 44, pp. 10195–10205, (1991).
- (29) B. P. P. Mallett, T. Wolf, E. Gilioli, F. Licci, G. V. M. Williams, A. B. Kaiser, N. W. Ashcroft, N. Suresh, and J. L. Tallon Phys. Rev. Lett., vol. 111, (2013). p. 237001.
- (30) T. P. Devereaux and R. Hackl Rev. Mod. Phys., vol. 79, p. 176, (2007).
- (31) B. Friedl, C. Thomsen, and M. Cardona Phys. Rev. Lett., vol. 65, pp. 915–918, (1990).
- (32) D. Budelmann, J. Holmlund, J. Andreasson, H. Rodríguez, J. Bäckström, L. Börjesson, H. Adrian, U. Merkt, and M. Rübhausen Phys. Rev. B, vol. 67, p. 140507, (2003).
- (33) E. Gilioli, A. Gauzzi, T. Besagni, F. Licci, M. Marezio, and P. G. Radaelli International Journal of Modern Physics B, vol. 14, pp. 2658–2663, (2000).
- (34) D. Wulferding, M. Shay, G. Drachuck, R. Ofer, G. Bazalitsky, Z. Salman, P. Lemmens, and A. Keren Phys. Rev. B, vol. 90, p. 104511, (2014).
- (35) S. Sugai, H. Suzuki, Y. Takayanagi, T. Hosokawa, and N. Hayamizu Phys. Rev. B, vol. 68, p. 184504, 2003.
- (36) W. Brenig Physics Reports, vol. 251, no. 3, (1995).
- (37) E. Gilioli, P. G. Radaelli, A. Gauzzi, F. Licci, and M. Marezio Pnysica C, vol. 341-348, p. 605, (2000).
- (38) N. A. Bogdanov, S. S. Manni, G. L. and, O. Gunnarsson, and A. Alavi, “New superexchange paths due to breathing-enhanced hopping in corner-sharing cuprates.” (2018).
- (39) R. Ofer, G. Bazalitsky, A. Kanigel, A. Keren, A. Auerbach, J. S. Lord, and A. Amato Phys. Rev. B, vol. 74, p. 220508, (2006).
- (40) D. S. Ellis, Y.-B. Huang, P. Olalde-Velasco, M. Dantz, J. Pelliciari, G. Drachuck, R. Ofer, G. Bazalitsky, J. Berger, T. Schmitt, and A. Keren Phys. Rev. B, vol. 92, p. 104507, (2015).
- (41) G. Drachuck, E. Razzoli, R. Ofer, G. Bazalitsky, R. S. Dhaka, A. Kanigel, M. Shi, and A. Keren Phys. Rev. B, vol. 89, p. 121119, (2014).
- (42) J. L. Tallon Phys. Rev. B, vol. 90, p. 214523, (2014).