Back to the Lithium Plateau with the [Fe/H] -6 star J0023+0307111 Based on observations made with Very Large Telescope (VLT) at Paranal Observatory, Chile
Abstract
We present an analysis of the UVES high-resolution spectroscopic observations at the 8.2m VLT of J0023+0307, a main-sequence extremely iron-poor dwarf star. We are unable to detect iron lines in the spectrum but derive [Fe/H] from the Ca II resonance lines assuming [Ca/Fe]. The chemical abundance pattern of J0023+0307, with very low [Fe/Mg] and [Ca/Mg] abundance ratios, but relatively high absolute Mg and Si abundances, suggests J0023+0307 is a second generation star formed from a molecular cloud polluted by only one supernova in which the fall-back mechanism played a role. We measure a carbon abundance of A(C) that places J0023+0307 on the “low” band in the A(C)[Fe/H] diagram, suggesting no contamination from a binary companion. This star is also unique having a lithium abundance (A(Li)) close to the level of the Lithium Plateau, in contrast with lower Li determinations or upper limits in all other extremely iron-poor stars. The upper envelope of the lithium abundances in unevolved stars spanning more than three orders of magnitude in metallicity ([Fe/H]) defines a nearly constant value. We argue that it is unlikely that such uniformity is the result of depletion processes in stars from a significantly higher initial Li abundance, but suggests instead a lower primordial production, pointing to new physics such as decaying massive particles, varying fundamental constants, or nuclear resonances, that could have affected the primordial 7Li production.
1 Introduction
The study of most ancient stars in the Milky Way allows us to infer early properties of the Galaxy, its chemical composition, and assembly history. The number of ultra metal-poor stars (i.e., [Fe/H]) has increased strikingly in the past few years. A large observational effort has enlarged the sample of such rare objects, thanks to new search techniques (see e.g., Christlieb et al., 2001; Frebel et al., 2005; Caffau et al., 2011; Keller et al., 2014; Bonifacio et al., 2015; Hansen et al., 2016; Starkenburg et al., 2018). The main sources of metal-poor candidates are large spectroscopic surveys such as Hamburg/ESO (Christlieb et al., 2001), SDSS (York et al., 2000) or LAMOST (Deng et al., 2012), and photometric ones like Skymapper (Keller et al., 2007) or Pristine (Starkenburg et al., 2017).
Metal-poor stars are invaluable messengers that carry information from early epochs and an important key to understand the primordial production of lithium and the processes responsible for the possible “meltdown” (see e.g., Aoki et al., 2009; Sbordone et al., 2010) of the Lithium plateau (Spite & Spite, 1982; Rebolo et al., 1988). All the stars with metallicities below [Fe/H] and lithium abundances lower than A(Li) are considered as likely affected by destruction in the stars. Several explanations have been discussed (see e.g., Richard et al., 2005; Piau et al., 2006; González Hernández et al., 2009; Meléndez et al., 2010; Sbordone et al., 2010; Molaro et al., 2012; Bonifacio et al., 2015; Matsuno et al., 2017), including lithium depletion in stellar atmospheres due atomic diffusion, high rotational velocities during the earlier star formation, astration by population III stars, destruction in the pre-main sequence phase, the presence of enhanced fragmentation in the formation of ultra metal-poor stars.
New or poorly measured nuclear reaction resonances could affect the lithium production predicted in Big Bang Nucleosynthesis (BBN) (e.g., Cyburt & Pospelov, 2012), although recent experiments make this nuclear “fix” to the BBN unlikely (O’Malley et al., 2011). Processes injecting neutrons at the relevant temperatures of the primordial plasma can also alter the primordial 7Li abundance, for instance, decaying massive particles (well-motivated candidates such as weakly interacting massive particles (WIMPs) are provided by supersymmetry) are a natural source for a neutron excess (Peskin, 2008) which injected at the appropriate level may reduce the primordial production of 7Li. In addition, time-varying fundamental constants may lead to a significant lower value for primordial 7Li, which is particularly sensitive to changes in the deuteron binding energy (see e.g., Fields, 2011). Lithium observations in stars at the lowest observed metallicities are specially important to bring insight on the processes of potential lithium depletion in stars and, ultimately, to establish if any non-standard physics may have played a role during or after BBN.
J00230307 was discovered and firstly observed by Aguado et al. (2018a). François et al. (2018) observed it with X-shooter on the 8.2 m VLT, providing for first time individual abundances of carbon, magnesium and silicon. Most recently, using MIKE on the Magellan telescope, Frebel et al. (2019) added additional elemental abundances and claimed a lithium detection. Here, we measure with high precision many elemental abundances that confirm most of the results from the literature and provide a reliable lithium abundance determination of J00230307. These observations allow us to explore the lower-metallicity end of the A(Li)[Fe/H] diagram.
2 Observations
J00230307 (g=17.90, R.A., DEC.= (J2000)) was observed under the ESO program 0101.D-0149(A) with the UVES spectrograph on the 8.2 m Kueyen Very Large Telescope at Cerro Paranal Observatory, in the Atacama desert, Chile. The observations were taken in twelve observing blocks (OB’s), one hour each on 2018 July 22-23, Aug 8-12, and Oct 7-8. The total on-target integration time was 10 hours. A slit was used with 2x2 binning in dark sky conditions. Our settings used dichroic and provided a spectral coverage between 390 and 580 nm. The data were reduced by the ESO staff, and retrieved through the Phase 3 query form. We corrected each spectrum for the barycentric velocity, coadded and combined them. The signal-to-noise per 0.018Å/pixel in the combined spectrum was 30, 55 and 80 at 380, 510 and 670 nm respectively. The nominal resolving power for this set up is R for the blue part of the spectrum ( nm) and R for the red ( nm). The seeing was during the first OB and between and during the rest of the run, thus the actual value is somewhat higher. We performed a fit using an automated fitting tool based on IDL MPFIT routine (with continuum location, global shift, abundance, and global FHWM as free parameters) of all individual, isolated, detected spectral lines (see Table 2) with a high-resolution model and obtained an average global (including instrumental and macroturbulent broadening and assuming no rotation) Gaussian broadening of km s-1 (equivalent to 40,500). From a cross-correlation of the J00230307 spectrum with a extremely metal-poor (EMP) F-type star template we derive a radial velocity of km s-1, in perfect agreement with the value reported by Frebel et al. (2019), km s-1. No signal of variation has been observed in the observations spanning four months, suggesting the star may be single. The Gaia DR2 (Gaia Collaboration et al., 2018) provides a parallax of mas. A detailed calculation of the Galactocentric orbit has been recently carried out by Sestito et al. (2019), who find that the orbit of J00230307 is confined to the Galactic plane within kpc.
3 Stellar parameters
Aguado et al. (2018a) reported effective temperatures from the analysis of BOSS ( K), OSIRIS ( K), and ISIS ( K) low/mid-resolution spectra. After that, François et al. (2018) derived a value of K from color calibrations. By fitting the wings of the Balmer line we find a higher temperature ( K) (See Fig. 1). In addition, we used the color calibrations based on the infrared flux method presented in González Hernández & Bonifacio (2009) with and Johnson magnitudes transformed from UKIDSS and SDSS filters. This approach also led to a higher temperature ( K). On the other hand, using color-temperature-metallicity calibrations by Casagrande et al. (2010) we arrive at three very different temperatures from different colors , and , giving an average K.
| Source | Ref. | Teff | ||
|---|---|---|---|---|
| BOSS spectrum | (1) | 6295 | 36 | |
| OSIRIS spectrum | (1) | 6140 | 132 | |
| ISIS spectrum | (1) | 6188 | 84 | |
| (g-z) | (2) | 6160 | 100 | |
| Hα | (3) | 6400 | 150 | |
| Hβ | (3) | 6165 | 62 | |
| IRFM | (4) | 6482 | 224 | |
| (V-J) | (5) | 6481 | 156 | |
| (V-H) | (5) | 6335 | 186 | |
| (V-Ks) | (5) | 6615 | 212 | |
| Mean V-X | (5) | 6474 | 145 | |
| (V-I) | (5) | 5992 | 157 | |
| (V-I) | (6) | 5997 | 130 |


Finally, Frebel et al. (2019) use a lower value ( K) from the color. The dispersion found along the several methods performed by different authors reflects how difficult is to derive a robust effective temperature in EMP stars (see e.g., Sbordone et al., 2010). We decided to adopt the value from François et al. (2018), K, which is essentially the same as derived by Aguado et al. (2018a) from a high S/N ISIS spectrum and also very close to the weighted mean temperature of the values given in Table 1.
The surface gravity derived by Aguado et al. (2018a), , confirms that J0023+0307 is a dwarf star. François et al. (2018) assumed arguing that the star is not bright enough to be considered a subgiant based on the distance derived from the Gaia DR2 parallax. In addition, Sestito et al. (2019) carried out a kinematical study and concluded that the subgiant solution implies an unbound orbit, favoring the dwarf against the subgiant solution at 88% confidence level. Since there are no detectable iron lines in the UVES spectrum of J0023+0307, we adopt the value from Sestito et al. (2019), , which is consistent with all other estimates. Following the method explained in Allende Prieto et al. (2006), based on the comparison of the main stellar parameters with different sets of isochrones from Bertelli et al. (1994) we find a galactocentric distance of kpc. The obtained value is in agreement with those derived by Sestito et al. (2019), d= kpc, using Gaia DR2 data.
Finally, the microturbulence has been fixed at 2 km s-1. The errors introduced by using this value instead of a value more appropiate for a dwarf of 1.5 km s-1 are small ( dex), as discussed in Aguado et al. (2018b) and Starkenburg et al. (2018) and included in the our quoted derived abundances uncertainties in this work. In the metallicity regime [Fe/H], the analysis is performed with model atmospheres computed with [Fe/H].
4 Analysis
A grid of synthetic spectral models has been computed with the code ASSET (Koesterke et al., 2008) using stellar models from Kurucz ATLAS 9 (Mészáros et al., 2012) and following the recipe explained in Allende Prieto et al. (2014) and Aguado et al. (2017). The grid contains models spanning ; , and . This grid extends the one used by Starkenburg et al. (2018) to reach lower metallicities. Both grids have been smoothed to R and normalized. We have performed an MCMC analysis based in self-adaptative randomized subspace sampling (Vrug et al., 2009) implemented in the FERRE code222FERRE is available from http://github.com/callendeprieto/ferre (Allende Prieto et al., 2006). The MCMC algorithm samples the probability distribution to estimate central values and uncertainties. Further details about the use of FERRE with high-resolution spectroscopy are presented in Starkenburg et al. (2018).
4.1 Iron and titanium
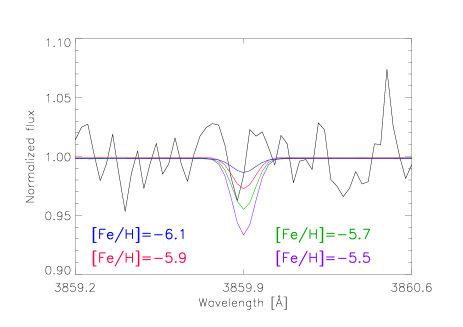
Similarly to SMSS J03136708 (Keller et al., 2014) or J10350641 (Bonifacio et al., 2015) no iron lines have been detected in the UVES spectrum. We are able to provide an upper limit of [Fe/H] (see Fig. 1, upper-right panel) only from the strongest iron line in the spectrum at 385.9 nm. The S/N ratio in the blue region of the spectrum is , where no clear iron features are present. However we have analyzed simultaneously 20 regions of 0.08 nm (between 372- and 405 nm) corresponding to wavelengths of 20 isolated iron lines, and we have sampled the probability distribution by launching 10 Markov chains of 10,000 experiments each. We arrive at [Fe/H]= but we cannot consider this result final due to the proximity of the grid limit and the extremely low signal we are trying to measure. Frebel et al. (2019) performed an analysis using only the Fe line at 385.9 nm and provided an upper limit of [Fe/H]. On the other hand, we have found a more robust and reliable result with the same FERRE-MCMC analysis on 15 Ti lines. In Fig. 1 (lower-left panel), we plot the probability distribution from the MCMC experiments (right). With this methodology we are able to recover information hidden in the noise, by performing this analysis simultaneously over 15 Ti lines, arriving to a [Ti/H]=. Frebel et al. (2019) arrived at [Ti/H] (1 line) and [Ti/H] (13 lines).
4.2 Carbon
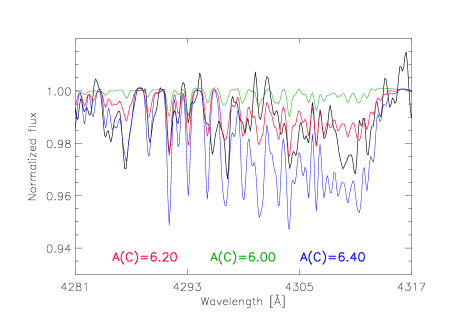
The moderate S/N in the G-band region forces us to perform a careful continuum determination. Even in Carbon-Enhanced Metal-Poor (CEMP) stars, especially with K, it is hard to distinguish CH features from the noise. We have pre-normalized the J0023+0307 UVES spectrum using a low-order polynomial and then normalized both the observed and synthetic spectra using a running mean filter with a 200 pixel window. Since we are only comparing neighbouring pixels, i.e., relative fluxes, our methodology partially solves the problem of the continuum determination. The best FERRE fit leads to A(C). An additional test was done after smoothing the spectrum to resolution (See Fig. 1, lower-right panel). The abundances inferred at full and reduced are within dex, and some CH features are now detectable by eye. François et al. (2018) found A(C) consistent with our value, and Frebel et al. (2019) derived A(C) but with an effective temperature K lower. The three values are in a reasonable agreement and match with the first upper limit derived by Aguado et al. (2018a), A(C), using the medium-resolution () ISIS spectrum.
| Element | (Å) | EW(mÅ) | A(X) | |
|---|---|---|---|---|
| Li I | 6707.8 | – | 19.31.1 | 2.02 |
| C (CH) | G-band | – | – | 6.20 |
| Na I | 5889.95 | 0.11 | 9.21.0 | 1.94 |
| Na I | 5895.92 | -0.18 | 12.90.9 | 2.22 |
| Mg I | 3829.35 | -0.23 | 79.72.0 | 4.66 |
| Mg I | 3832.30 | 0.12 | 83.32.0 | 4.50 |
| Mg I | 3838.29 | 0.39 | 92.22.0 | 4.63 |
| Mg I | 5167.32 | -1.03 | 63.71.2 | 4.78 |
| Mg I | 5172.68 | -0.40 | 89.21.4 | 4.54 |
| Mg I | 5183.60 | -0.18 | 94.71.2 | 4.48 |
| Al I | 3944.00 | -0.62 | 24.21.4 | 2.36 |
| Al I | 3961.52 | -0.32 | 24.31.4 | 2.34 |
| Si I | 3905.52 | -1.09 | 36.71.8 | 4.05 |
| Ca II | 3933.66 | 0.13 | 92.821.9 | 0.68 |
| Ca II | 3968.47 | -0.16 | 55.92.3 | 0.65 |
| Fe I | 3859.92 | -0.68 | – | 2.02 |
4.3 Other elements
J0023+0307 exhibits relatively high abundances of some elements compared to iron or calcium. The spectrum presents strong Mg I absorptions in the blue ( nm) and also in the magnesium triplet Mg Ib at 516–518 nm. Six very clear features (See Table 2) have been identified and fitted giving an abundance of corresponding to [Mg/H]. Si also shows an absorption at ( nm) leading us to derive ([Si/H]). The shape of the aluminum features at nm and nm is not so well defined, however the derived abundances are the same, ([Al/H]). The Calcium analysis is significantly improved compared to that presented in Aguado et al. (2018a). Both resonance lines are resolved and a complex ISM structure is present (See Fig. 1, upper-left panel). We find ([Ca/H]), which is dex higher than Aguado et al. (2018a), from significantly lower resolution () spectrum; and fully compatible with François et al. (2018); Frebel et al. (2019). Assuming a [Ca/Fe], we use the calcium abundance to set a metallicity upper-limit of [Fe/H]. Finally the two sodium lines around nm present broader line profiles than expected and moderate quality. The best FERRE fits allow us to derive ([Na/H]). Some derived upper limits are shown in table.
| This work | François et al. (2018) | Frebel et al. (2018) | |||||||||||
|---|---|---|---|---|---|---|---|---|---|---|---|---|---|
| Species | (X)1 | (X) | (X) | (X) | |||||||||
| Li I | 1.05 | 2.02 | 0.05 | 1 | 1.70 | 0.20 | 1 | ||||||
| CH | 8.39 | 6.20 | 2.19 | 0.20 | 6.40 | 1.99 | 0.30 | 5.89 | 2.50 | 0.20 | |||
| Na I | 6.17 | 2.08 | 4.09 | 0.21 | 2 | 2.24 | 3.93 | 0.30 | 2 | ||||
| Mg I | 7.53 | 4.60 | 2.93 | 0.11 | 7 | 5.10 | 2.43 | 0.23 | 3 | 4.63 | 2.90 | 0.10 | 8 |
| Al I | 6.37 | 2.35 | 4.02 | 0.12 | 2 | 2.30 | 4.07 | 0.20 | 2 | ||||
| Si I | 7.51 | 4.05 | 3.46 | 0.10 | 1 | 4.20 | 3.31 | 0.23 | 1 | 3.94 | 3.57 | 0.20 | 1 |
| Ca II | 6.31 | 0.66 | 5.65 | 0.09 | 2 | 0.60 | 5.71 | 0.20 | 1 | 0.57 | 5.74 | 0.20 | 1 |
| Ti II | 4.95 | 5.37 | 0.23 | 15 | 0.6 | 4.35 | |||||||
| Cr I | 5.64 | 1.54 | 4.1 | 1.4 | 4.24 | ||||||||
| Fe I | 7.45 | 3.5 | 3.95 | 1.9 | 5.55 | ||||||||
| Ni I | 6.23 | 2.93 | 3.3 | 2.2 | 4.03 | ||||||||
| Sr II | 2.92 | 1.68 | 4.6 | 0.0 | 2.92 | 1.5 | 4.42 | ||||||
| Ba II | 2.17 | 1.33 | 3.5 | 1.3 | 3.47 | ||||||||
4.4 Lithium
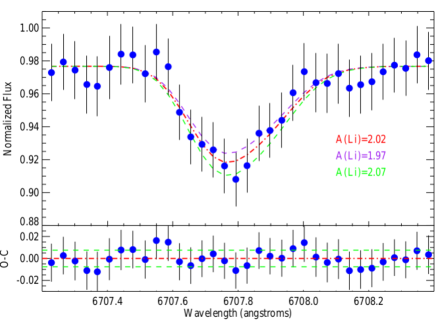
We have been able to clearly detect the Li doublet (see Fig. 2) in the rebinned spectrum of the extremely iron-poor star J00230307. We measure a S/N 130 with a bin of 0.035Å/pixel near the Li doublet. We fit the lithium profile with our automated fitting tool (see Section 2), using a grid of model spectra for three different Li abundances (A(Li)2.4, 2.0, 1.6 dex), and with A(Li), continuum location and global shift of the line as free parameters, and we fix the global FWHM to 7.4 km/s (see Section 2). We derive an EW(Li) mÅ (see Table 2). To evaluate the statistical uncertainty, we perform a MonteCarlo simulation with 10,000 realizations by injecting noise, corresponding to the actual S/N ratio near the Li line, in the best-fit synthetic spectrum. We measure a Li abundance in the star J00230307 of A(Li), including the error due to the uncertainty of the adopted (see e.g. González Hernández et al., 2008). The difference of dex in Li abundance with respect to the value reported in Frebel et al. (2019) is not only related to our hotter adopted . A 160K lower translates into about 0.1 dex lower Li abundance, so there remains still 0.2 dex difference to be explain. We believe that our better quality data allow us to provide a robust Li abundance determination.
Our Li abundance measurement is almost at the level of the Lithium Plateau but at metallicity level of [Fe/H], which is significantly lower than any previous measurement. In Fig 2 we also display the lithium abundances of extremely metal-poor unevolved stars including main-sequence and turn-off field stars with available Li measurements or upper limits. Matsuno et al. (2017) suggested that no stars with [Fe/H] show Li abundances at the level of the Lithium plateau (A(Li)), apart from three stars (González Hernández et al., 2008; Bonifacio et al., 2018). Recently, Bonifacio et al. (2018) have been able to measure the Li abundance of the iron-poor star J10350641 (A(Li), [Fe/H]). Both stars are suggested to be CEMP-no stars, but J00230307 has roughly 1 dex lower C abundance. Other unevolved CEMP stars at [Fe/H] have either no Li detected or A(Li), which may suggest that Li is not connected with the C content Matsuno et al. (2017).
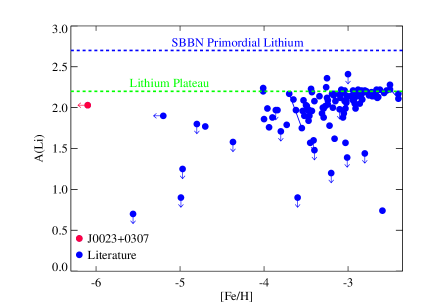
Lower panel: Li abundance, A(Li), versus metallicity, , of J00230307 compared with other dwarf - turn-off stars () with Li abundance values from Bonifacio et al. (2018) and references therein. Blue filled circles connected with a solid line indicates the spectroscopic binaries in González Hernández et al. (2008); Aoki et al. (2012). The Lithium plateau (also called “Spite Plateau”) reference is shown as solid line at a level of A(Li) dex. Blue dashed line represents the primordial lithium value (A(Li)2.7) from WMAP (Spergel et al., 2003).
5 Discussion and conclusions
J00230307 is a dwarf star with [Fe/H], A(Li) and very large overabundances of carbon ([C/Fe]), magnesium ([Mg/Fe]) and silicon ([Si/Fe]). These chemical abundance ratios provide a strong argument against ISM pollution by a Pair-Instability Supernova (PISN), since similar shortages of Ca-Fe and Mg-Si should be expected. In particular Takahashi et al. (2018) found the ratios [Na/Mg] and [Ca/Mg] as the most robust discriminant of PISN. For J00230307, both [Na/Mg] and [Ca/Mg], are quite far from those values. The low Fe abundance of J00230307 is fully compatible with a Pop III supernova scenario. The high [C/Fe] together with Mg and Si derived abundances may point out to fall-back (Umeda & Nomoto, 2003), returning Fe and Ca to the black hole. J00230307 is in the low band of absolute carbon abundance (Bonifacio et al., 2015; Yoon et al., 2016) and does not show radial velocity variations, discarding the scenario of mass transfer from a binary companion. Hartwig et al. (2018) present complementary criteria to disentangle different second generation star formation scenarios, mono-enriched or multi-enriched. The proposed methodology uses two different criteria, a semi-analytical model to determine the formation sites and other based on the divergence of the chemical displacement (DCD), for further details see Hartwig et al. (2018, 2019). In particular, the chemical signatures of J00230307 may fit well in the most likely mono-enriched area of the [Mg/C] vs [Fe/H] diagram presented in Hartwig et al. (2018). SDSS J10350641 (with a metallicity of [Fe/H]) discovered by Bonifacio et al. (2015) also presents a high probability of being a second generation mono-enriched star (Hartwig et al., 2019).
Bonifacio et al. (2018) has recently detected lithium (A(Li)) in J10350641 close to the Lithium Plateau. J00230307 with Li abundance of A(Li) surprisingly nearly recovers the same level of the Lithium Plateau at about 1 dex less iron content. The presence of lithium in this extremely iron-poor star at [Fe/H] reinforces the production of lithium at the Big Bang, and places a stringent constraint to any theory aiming at explaining the cosmological Li problem. The fact that no star in this large metallicity regime ([Fe/H]) has been detected to show a Li abundance between that inferred from SBBN and the Li plateau, makes this upper boundary of Li abundance (or extended Li plateau) at low metallicities difficult to explain by destruction in the stars, and may support a lower primordial Li production, driven by non-standard nucleosynthesis processes.
References
- Aguado et al. (2018a) Aguado, D. S., Allende Prieto, C., González Hernández, J. I., & Rebolo, R. 2018a, ApJ, 854, L34
- Aguado et al. (2017) Aguado, D. S., González Hernández, J. I., Allende Prieto, C., & Rebolo, R. 2017, A&A, 605, A40
- Aguado et al. (2018b) —. 2018b, ApJL, 852 L20, doi:10.1086/498131
- Allende Prieto et al. (2006) Allende Prieto, C., Beers, T. C., Wilhelm, R., et al. 2006, ApJ, 636, 804
- Allende Prieto et al. (2014) Allende Prieto, C., Fernández-Alvar, E., Schlesinger, K. J., et al. 2014, A&A, 568, A7
- Aoki et al. (2009) Aoki, W., Barklem, P. S., Beers, T. C., et al. 2009, ApJ, 698, 1803
- Aoki et al. (2012) Aoki, W., Ito, H., & Tajitsu, A. 2012, ApJ, 751, L6
- Asplund et al. (2005) Asplund, M., Grevesse, N., & Sauval, A. J. 2005, in Astronomical Society of the Pacific Conference Series, Vol. 336, Cosmic Abundances as Records of Stellar Evolution and Nucleosynthesis, ed. T. G. Barnes, III & F. N. Bash, 25
- Bertelli et al. (1994) Bertelli, G., Bressan, A., Chiosi, C., Fagotto, F., & Nasi, E. 1994, A&AS, 106
- Bonifacio et al. (2015) Bonifacio, P., Caffau, E., Spite, M., et al. 2015, A&A, 579, A28
- Bonifacio et al. (2018) —. 2018, A&A, 612, A65
- Caffau et al. (2011) Caffau, E., Bonifacio, P., François, P., et al. 2011, Nature, 477, 67
- Casagrande et al. (2010) Casagrande, L., Ramírez, I., Meléndez, J., Bessell, M., & Asplund, M. 2010, A&A, 512, A54
- Christlieb et al. (2001) Christlieb, N., Wisotzki, L., Reimers, D., et al. 2001, A&A, 366, 898
- Cyburt & Pospelov (2012) Cyburt, R. H., & Pospelov, M. 2012, International Journal of Modern Physics E, 21, 1250004
- Deng et al. (2012) Deng, L.-C., Newberg, H. J., Liu, C., et al. 2012, Research in Astronomy and Astrophysics, 12, 735
- Fields (2011) Fields, B. D. 2011, Annual Review of Nuclear and Particle Science, 61, 47
- François et al. (2018) François, P., Caffau, E., Wanajo, S., et al. 2018, A&A, 619, A10
- Frebel et al. (2019) Frebel, A., Ji, A. P., Ezzeddine, R., et al. 2019, ApJ, 871, 146
- Frebel et al. (2005) Frebel, A., Aoki, W., Christlieb, N., et al. 2005, Nature, 434, 871
- Gaia Collaboration et al. (2018) Gaia Collaboration, Brown, A. G. A., Vallenari, A., et al. 2018, A&A, 616, A1
- González Hernández & Bonifacio (2009) González Hernández, J. I., & Bonifacio, P. 2009, A&A, 497, 497
- González Hernández et al. (2008) González Hernández, J. I., Bonifacio, P., Ludwig, H. G., et al. 2008, A&A, 480, 233
- González Hernández et al. (2009) González Hernández, J. I., Bonifacio, P., Caffau, E., et al. 2009, A&A, 505, L13
- Hansen et al. (2016) Hansen, T. T., Andersen, J., Nordström, B., et al. 2016, A&A, 586, A160
- Hartwig et al. (2019) Hartwig, T., Ishigaki, M. N., Klessen, R. S., & Yoshida, N. 2019, MNRAS, 482, 1204
- Hartwig et al. (2018) Hartwig, T., Yoshida, N., Magg, M., et al. 2018, MNRAS, 478, 1795
- Keller et al. (2007) Keller, S. C., Schmidt, B. P., Bessell, M. S., et al. 2007, PASA, 24, 1
- Keller et al. (2014) Keller, S. C., Bessell, M. S., Frebel, A., et al. 2014, Nature, 506, 463
- Koesterke et al. (2008) Koesterke, L., Allende Prieto, C., & Lambert, D. L. 2008, ApJ, 680, 764
- Matsuno et al. (2017) Matsuno, T., Aoki, W., Suda, T., & Li, H. 2017, PASJ, 69, 24
- Meléndez et al. (2010) Meléndez, J., Ramírez, I., Casagrande, L., et al. 2010, Ap&SS, 328, 193
- Mészáros et al. (2012) Mészáros, S., Allende Prieto, C., Edvardsson, B., et al. 2012, AJ, 144, 120
- Molaro et al. (2012) Molaro, P., Bressan, A., Barbieri, M., Marigo, P., & Zaggia, S. 2012, Memorie della Societa Astronomica Italiana Supplementi, 22, 233
- O’Malley et al. (2011) O’Malley, P. D., Bardayan, D. W., Adekola, A. S., et al. 2011, Phys. Rev. C, 84, 042801
- Peskin (2008) Peskin, M. E. 2008, Supersymmetry in Elementary Particle Physics, ed. S. Dawson & R. N. Mohapatra, 609
- Piau et al. (2006) Piau, L., Beers, T. C., Balsara, D. S., et al. 2006, ApJ, 653, 300
- Rebolo et al. (1988) Rebolo, R., Beckman, J. E., & Molaro, P. 1988, A&A, 192, 192
- Richard et al. (2005) Richard, O., Michaud, G., & Richer, J. 2005, The Astrophysical Journal, 619, 538. https://doi.org/10.1086%2F426470
- Sbordone et al. (2010) Sbordone, L., Bonifacio, P., Caffau, E., et al. 2010, A&A, 522, A26
- Sestito et al. (2019) Sestito, F., Longeard, N., Martin, N. F., et al. 2019, MNRAS, 46
- Spergel et al. (2003) Spergel, D. N., Verde, L., Peiris, H. V., et al. 2003, ApJS, 148, 175
- Spite & Spite (1982) Spite, M., & Spite, F. 1982, Nature, 297, 483
- Starkenburg et al. (2017) Starkenburg, E., Martin, N., Youakim, K., et al. 2017, MNRAS, 471, 2587
- Starkenburg et al. (2018) Starkenburg, E., Aguado, D. S., Bonifacio, P., et al. 2018, MNRAS, 481, 3838
- Takahashi et al. (2018) Takahashi, K., Yoshida, T., & Umeda, H. 2018, ApJ, 857, 111
- Umeda & Nomoto (2003) Umeda, H., & Nomoto, K. 2003, Nature, 422, 871
- Vrug et al. (2009) Vrug, A., ter Braak, C., Dicks, C., & Robinson, B.A.and Hyman, J. H. D. 2009, International Journal of Nonlinear Sciences & Numerical Simulation, 10, 273:290
- Yoon et al. (2016) Yoon, J., Beers, T. C., Placco, V. M., et al. 2016, ApJ, 833, 20
- York et al. (2000) York, D. G., Adelman, J., Anderson, Jr., J. E., et al. 2000, AJ, 120, 1579