A search for non-thermal radio emission from jets of massive young stellar objects
Abstract
Massive young stellar objects (MYSOs) have recently been shown to drive jets whose particles can interact with either the magnetic fields of the jet or ambient medium to emit non-thermal radiation. We report a search for non-thermal radio emission from a sample of 15 MYSOs to establish the prevalence of the emission in the objects. We used their spectra across the L-, C- and Q-bands along with spectral index maps to characterise their emission. We find that about 50% of the sources show evidence for non-thermal emission with 40% showing clear non-thermal lobes, especially sources of higher bolometric luminosity. The common or IRAS names of the sources that manifest non-thermal lobes are; V645Cyg, IRAS 22134+5834, NGC 7538 IRS 9, IRAS 23262+640, AFGL 402d and AFGL 490. All the central cores of the sources are thermal with corresponding mass-loss rates that lie in the range to . Given the presence of non-thermal lobes in some of the sources and the evidence of non-thermal emission from some spectral index maps, it seems that magnetic fields play a significant role in the jets of massive protostars. Also noted is that some of the sources show evidence of binarity and variability.
1 Introduction
Stellar jets and outflows are ever-present in both low and high mass young stellar objects (Anglada et al., 2018). They are detectable at radio wavelengths where the effect of dust extinction is minimal. Earlier observational studies of the jets from massive stars were limited to a few nearby objects e.g. HH 80-81 (Martí et al., 1998), Cepheus A HW2 (Curiel et al., 2006), IRAS 16547-4247 (Brooks et al., 2003) and G345.5+01.46 (Guzmán et al., 2010). However, with the upgrade of both the Australia Telescope Compact Array (ATCA) and the Very Large Array(VLA), it is now possible to study more distant objects in larger numbers. Such studies were conducted by Guzmán et al. (2012), Purser et al. (2016), Rosero et al. (2016) and Moscadelli et al. (2016) who confirmed that jets are ubiquitous in massive protostars. The jets are indicators of disk-fed accretion (Reipurth & Bally, 2001), tracers of accretion history (Kuiper et al., 2015) and the vents through which part of the high radiation pressure from massive protostars are released (Kuiper et al. 2014, Banerjee & Pudritz 2007). They also remove excess angular momentum from the protostar to the ambient medium, allowing for further accretion (Anglada et al., 2018).
Models reveal a close connection between protostellar jets and accretion disks (Pudritz et al., 2007). This implies that the presence of a jet is an indicator of the existence of an accretion disk and vice versa. Indeed, a few massive young stellar objects that drive jets are also known to harbour accretion disks e.g. IRAS 13481-6124 (Kraus et al. 2010, Caratti o Garatti et al. 2016), AFGL 2591 (Wang et al., 2012) and G023.0100.41 (Sanna et al., 2018). These disks, if optically thick, might explain how the objects accrete mass in the presence of high radiation pressure and strong UV fields (Vaidya et al., 2009).
Typically, a massive young stellar object (MYSO) is understood to consist of a central object, a disk and a jet. However, it is only the jet that is expected to emit non-thermal radiation (Carrasco-González et al. 2013, López-Cámara & Raga 2010, Velusamy et al. 2007). Charged jet particles can be accelerated (Bell 1978, Blandford & Eichler 1987) to relativistic levels at shocks where they may interact with magnetic fields giving rise to non-thermal (synchrotron) emission. The shocks are therefore traced by the non-thermal radio knots and Herbig-Haro (HH) objects. Some of the theories put forward to explain how shocks are formed in YSOs include episodic accretion (DeSouza & Basu, 2015) and interaction between jet material with the ambient medium and/or internal working surfaces within the jet (Rubini et al., 2007). Star formation models that incorporate disks can explain how the shocks are formed in MYSOs. For instance, an unstable self-gravitating disk can fragment into clumps that are accreted episodically towards a protostar, causing accretion bursts (Meyer et al., 2017). Similarly, a wobbling magnetised disk has a potential of producing knots at working surfaces (Raga et al., 1993) if jet material spirals through its hourglass-like field lines (Blandford & Payne 1982, Pudritz & Norman 1986, Pudritz & Banerjee 2005). Recent observations of HH 80-81 (Rodríguez-Kamenetzky et al. 2017, Vig et al. 2018) and the triple radio source in the Serpens star-forming region (Rodríguez-Kamenetzky et al., 2016) have confirmed that massive protostars emit both thermal and non-thermal radiation. They used spectral indexing to classify the emissions. The study by Vig et al. (2018) demonstrated the value of studying the spectral index for non-thermal emission at lower radio frequencies.
Unlike thermal jets and outflows which have been well modelled (Reynolds 1986), models of non-thermal jets can be improved with an increase in observational data. Numerical simulations can also be used to provide clues on how both magneto-hydrodynamic (MHD) and radiative-hydrodynamic (RHD) jets (de Gouveia Dal Pino, 2005) are launched, accelerated and collimated. In-depth study of the objects can reveal whether they represent different evolutionary phases. Claims have been made that a MYSO can drive either a MHD jet e.g. HH 80-81 (Carrasco-González et al., 2010), a RHD jet e.g. W75N(B) (Carrasco-González et al., 2015) or a RHD equatorial wind e.g. S140 IRS 1 (Hoare, 2006).
Motivated by the need to establish the prevalence of non-thermal emission in protostellar jets, we observed a sample of MYSOs at L-band (frequency range 1-2 GHz and central frequency 1.5 GHz) where synchrotron emission is dominant and easily detectable. We also used previous C- and Q-band observations from the JVLA’s A configuration by Purser et al. 2019 (in prep). The C- and Q-band observations were of bandwidths 2 GHz and 8 GHz, centred at 6 GHz and 44 GHz, respectively.
2 Sample Selection
A total of 15 objects (listed in Table 1) were selected from a sample of 63 MYSOs that were previously observed in C-band at 6 GHz using the NRAO’s 111National Radio Astronomy Observatory Jansky Very Large Array (JVLA) telescope (details in Purser et al. 2019 in prep). We selected the 15 brightest objects from that sample to provide the best possibility for detection in L-band at 1.5 GHz.
| RMS Name | Common | RA | Dec | d | Field rms | Beam size | PA | |
|---|---|---|---|---|---|---|---|---|
| Name | (J2000) | (J2000) | (kpc) | () | maj (′′) min (′′) | |||
| G083.7071+03.2817 | - | 20h33m36.51s | +45∘35′44.0′′ | 1.4 | 3900 | 83.0 | ||
| G094.2615-00.4116 | IRAS 21307+5049 | 21h32m30.59s | +51∘02′16.0′′ | 5.2 | 9000 | 82.3 | ||
| G094.4637-00.8043 | IRAS 21334+5039 | 21h35m09.14s | +50∘53′08.9′′ | 4.9 | 21000 | 82.6 | ||
| G094.6028-01.7966 | V645Cyg | 21h39m58.25s | +50∘14′20.9′′ | 4.9 | 43000 | 83.1 | ||
| G103.8744+01.8558 | IRAS 22134+5834 | 22h15m08.97s | +58∘49′07.3′′ | 1.6 | 6800 | 78.2 | ||
| G108.5955+00.4935C | IRAS 22506+5944 | 22h52m38.09s | +60∘01′01.1′′ | 4.3 | 3000 | -26.7 | ||
| G110.0931-00.0641 | IRAS 23033+5951 | 23h05m25.16s | +60∘08′15.4′′ | 4.3 | 11850 | -19.8 | ||
| G111.2552-00.7702 | IRAS 23139+5939 | 23h16m10.40s | +59∘55′28.2′′ | 3.5 | 9870 | -22.9 | ||
| G111.5671+00.7517 | NGC 7538 IRS 9 | 23h14m01.76s | +61∘27′19.9′′ | 2.7 | 44620 | -17.9 | ||
| G114.0835+02.8568 | IRAS 23262+6401 | 23h28m27.76s | +64∘17′38.5′′ | 4.2 | 7130 | -13.5 | ||
| G126.7144-00.8220 | S187 IR | 01h23m33.17s | +61∘48′48.2′′ | 0.7 | 2600 | -25.1 | ||
| G136.3833+02.2666 | IRAS 02461+6147 | 02h50m08.57s | +61∘59′52.1′′ | 3.2 | 7800 | -05.1 | ||
| G138.2957+01.5552 | AFGL 402d | 03h01m31.32s | +60∘29′13.2′′ | 2.9 | 17000 | 25.8 | ||
| G139.9091+00.1969A | AFGL 437s | 03h07m24.52s | +58∘30′43.3′′ | 3.2 | 11000 | 21.2 | ||
| G141.9996+01.8202 | AFGL 490 | 03h27m38.76s | +58∘47′00.1′′ | 0.8 | 5500 | 27.4 |
The 15 objects chosen are all from the RMS catalogue 222http://rms.leeds.ac.uk/cgi-bin/public/RMS_DATABASE.cgi (Lumsden et al., 2013). Other selection criteria include; a distance kpc from the Sun and bolometric luminosities . Given that the typical sizes of MYSO jets lie in the range pc to pc (Mundt & Ray, 1994), we should resolve some of the the lobes within the jets at the frequency of observation and telescope configuration (i.e resolution of ).
3 Observations and data reduction
The 15 objects were observed on the , and of August 2015 using the JVLA under project code 15A-218. The observation made use of twenty seven antennae of the A configuration giving a resolution of at the central frequency of L-band. The continuum data were subdivided into 16 spectral windows (SPW), each of bandwidth 64 MHz. The spectral windows were further subdivided into 64 channels, each of width 1 MHz to ease flagging procedure and control the spread of RFI across the observed frequencies. The sources observed at L- were also observed at C- band in 2012 and some of them at Q- band in 2014/15 (Purser et al. 2019 in prep) using the JVLA’s A configuration. Synthesised beams of C- and Q-bands are typically 0.33′′ and 0.04′′ respectively. Noise levels in C- and Q-band maps lie in the range Jy/beam and Jy/beam at full range i.e 13-800 and 100-5300 respectively.
The L-band sources were observed with a phase calibrator cycle time of minutes to correct for instrumental and atmospheric effects on their phases and flux densities. Each of the science objects had a total integration time of minutes. Flux calibrators, and were also observed for flux scaling.
Calibration and imaging were done using NRAO’s CASA (Common Astronomy Software Applications; McMullin et al. 2007). If an image had a bright object in its field, a phase-only self-calibration of between 1-3 iterations was carried out to improve it. While CLEANing the data, their visibilities were weighted using Briggs weighting with a robustness parameter of 0.5 (Briggs, 1995) resulting in synthesised beams whose average sizes are . The rms noise levels of the cleaned maps of full coverage, , lie in the range with objects close to bright and extended sources having higher rms noise. A list showing the objects, their local rms noise and sizes of synthesised beams used in deconvolution is shown in Table 1.
4 Near Infrared (NIR) Emission
Massive protostars are embedded in natal clouds containing dust particles that can be distributed into various geometries by jets and outflows from the protostars, creating cavities and shells within the clouds. Light from the embedded sources can then scatter off the dust in the cavities at NIR wavelengths, tracing their structure. Molecular hydrogen emission at 2.12 m from shocks produced by jets are also seen. As a result, infrared images were relied upon to provide helpful hints for the presence of protostellar outflows and jets.
Most of the infrared images used in the study were generated by the Wide Field Camera (WFCAM; Casali et al. 2007) of the United Kingdom Infra-red Telescope (UKIRT; Lawrence et al. 2007) as part of the UKIDSS Galactic Plane Survey (Lucas et al., 2008). UKIRT is a 3.8-m telescope whose typical angular resolution is 0.8′′ (Lucas et al., 2008). WFCAM, whose pixel scale is 0.4′′, observes at five IR wave bands; Z, Y, J, H and K of wavelength range 0.832.37 m. Only three of the bands; J, H and K of central wavelengths 1.2483 m, 1.6313 m and 2.2010 m respectively (Hewett et al., 2006) were used in the study. In addition, 2MASS (Two Micron All Sky Survey) images of some of the objects were inspected, especially if their declinations are above the region of the sky covered by UKIDSS i.e 60o, even-though the images are of a lower resolution () and sensitivity i.e a pixel size of (Skrutskie et al., 2006). Also used were findings from H2 emission observations of the MYSOs e.g. Navarete et al. (2015), Wolf-Chase et al. (2017), Varricatt et al. (2010) and Davis et al. (1998).
5 Results and discussion
5.1 L-band results
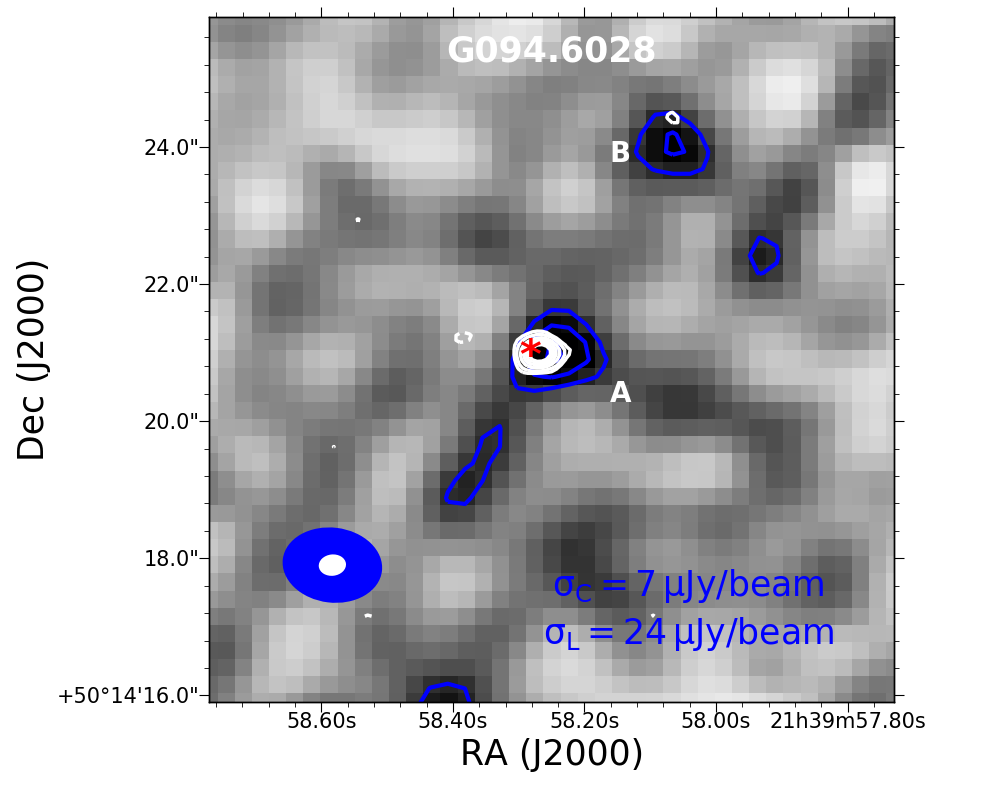
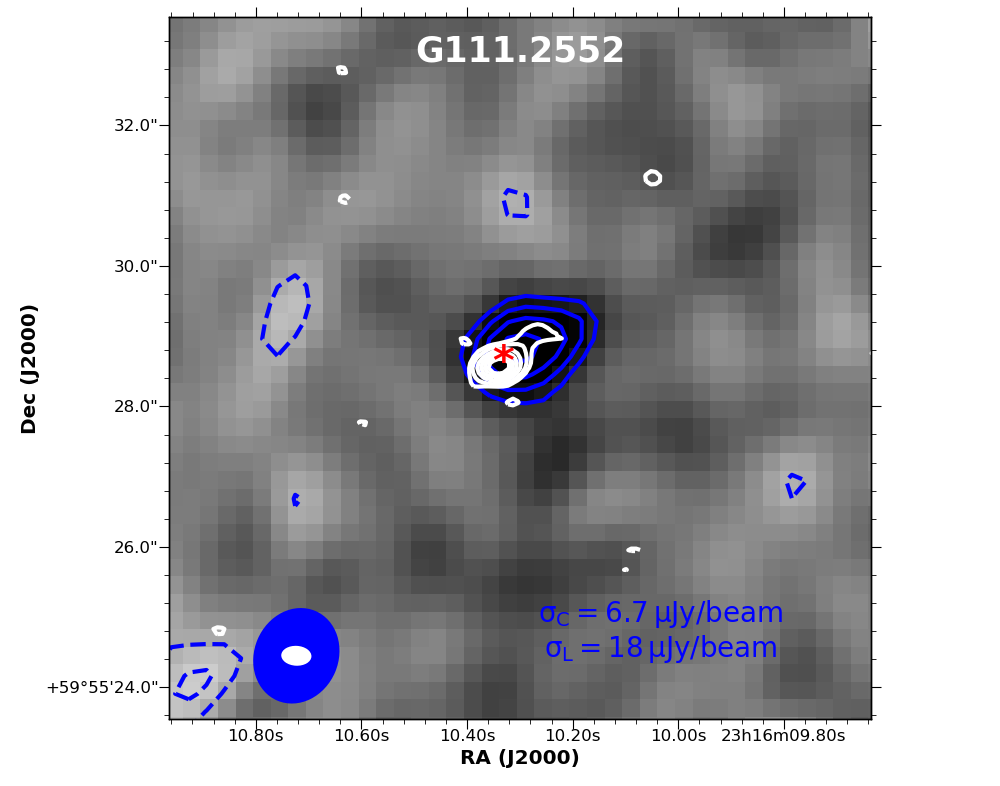
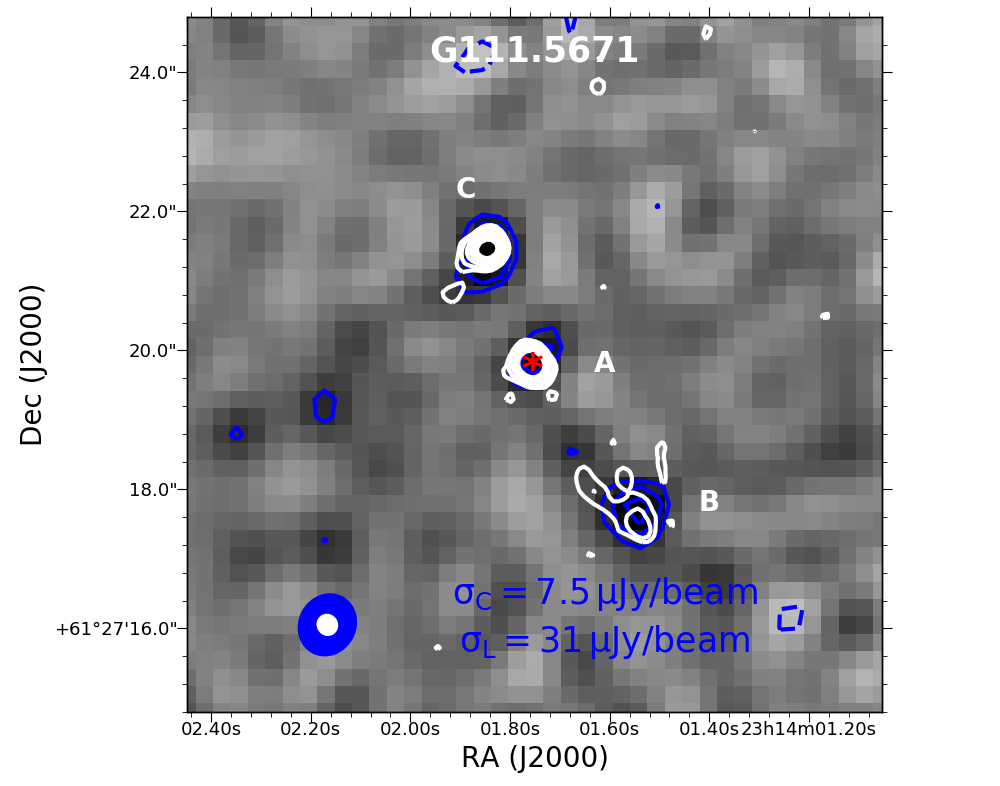
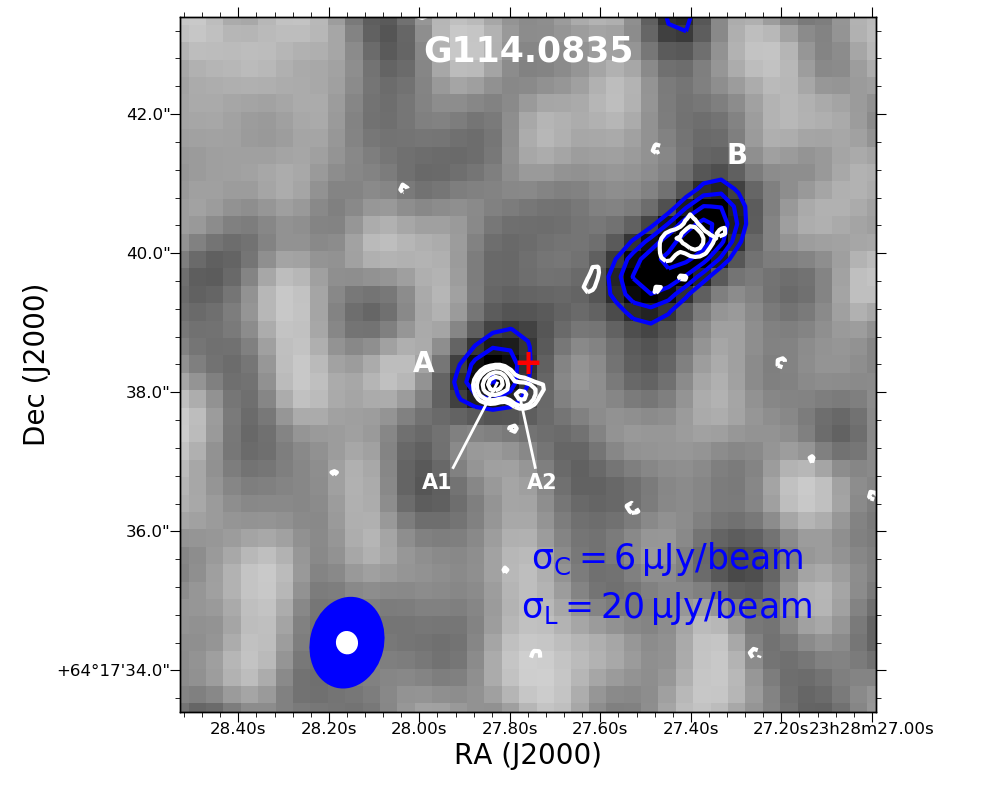
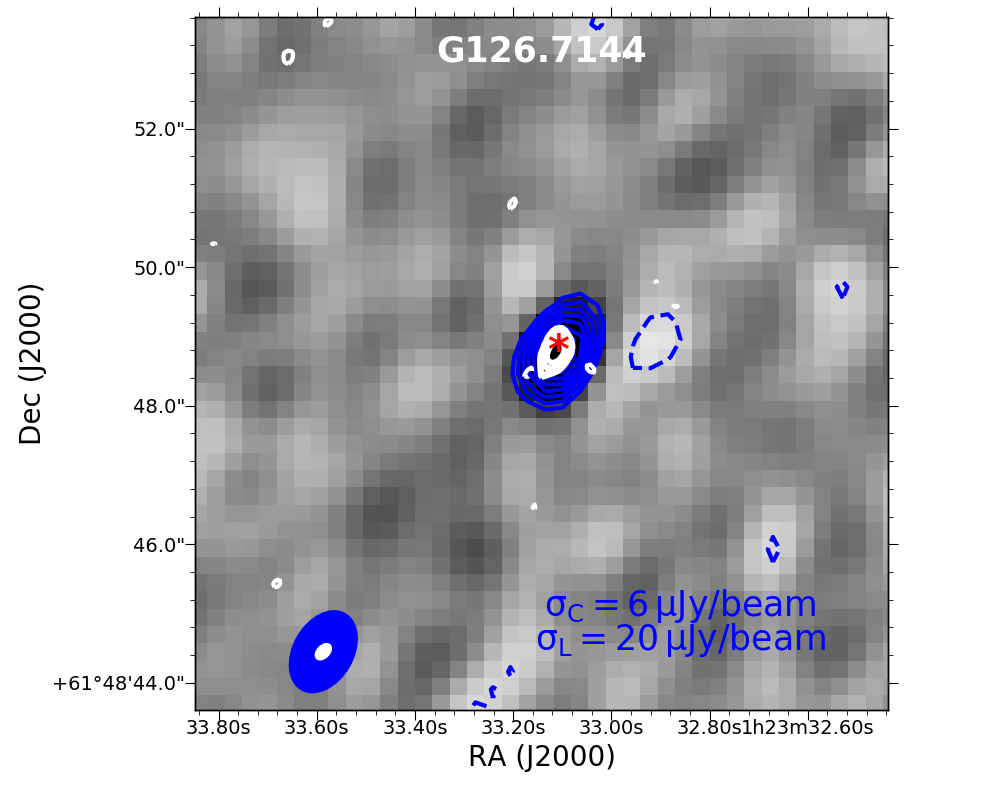
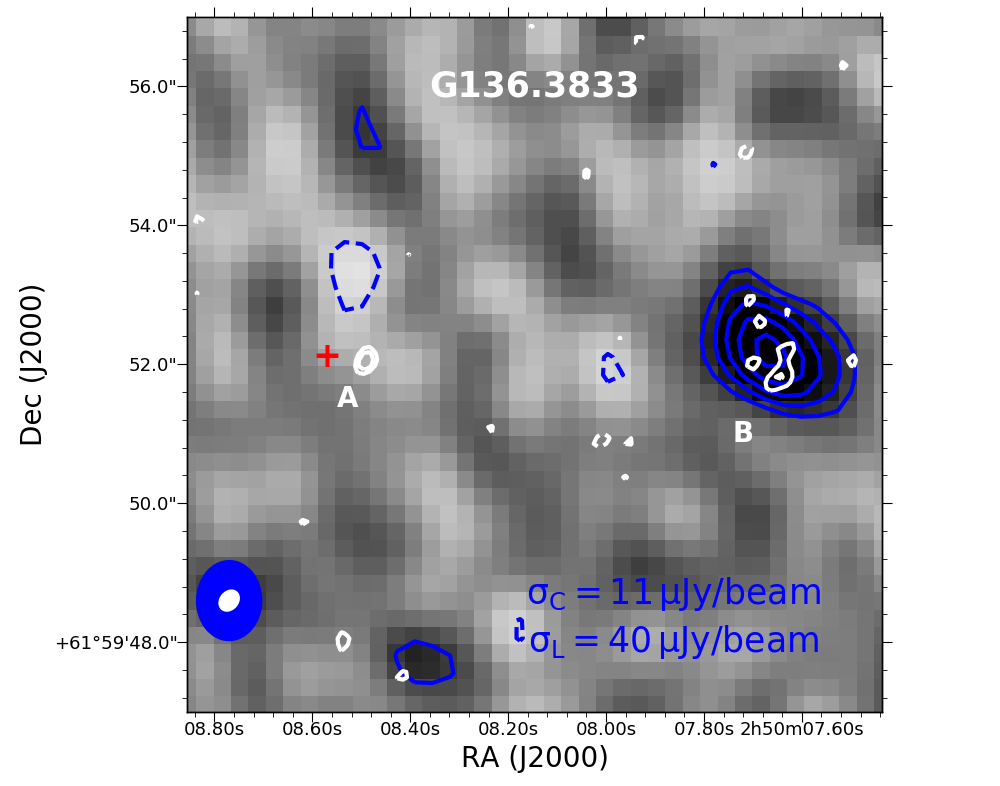
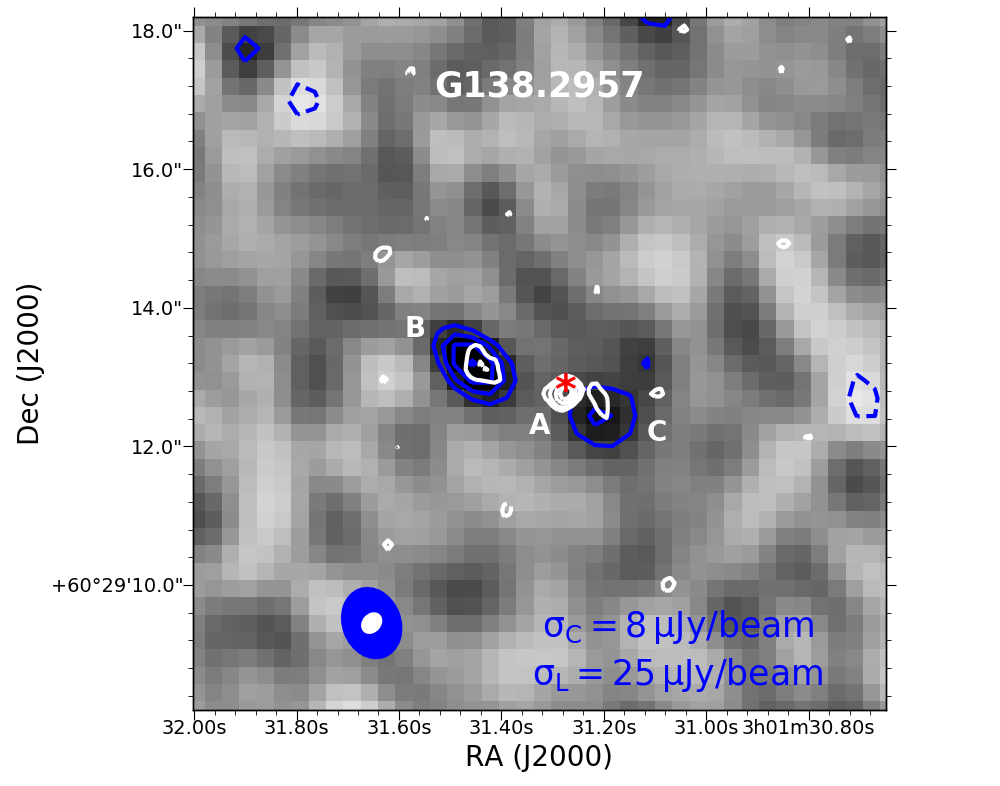
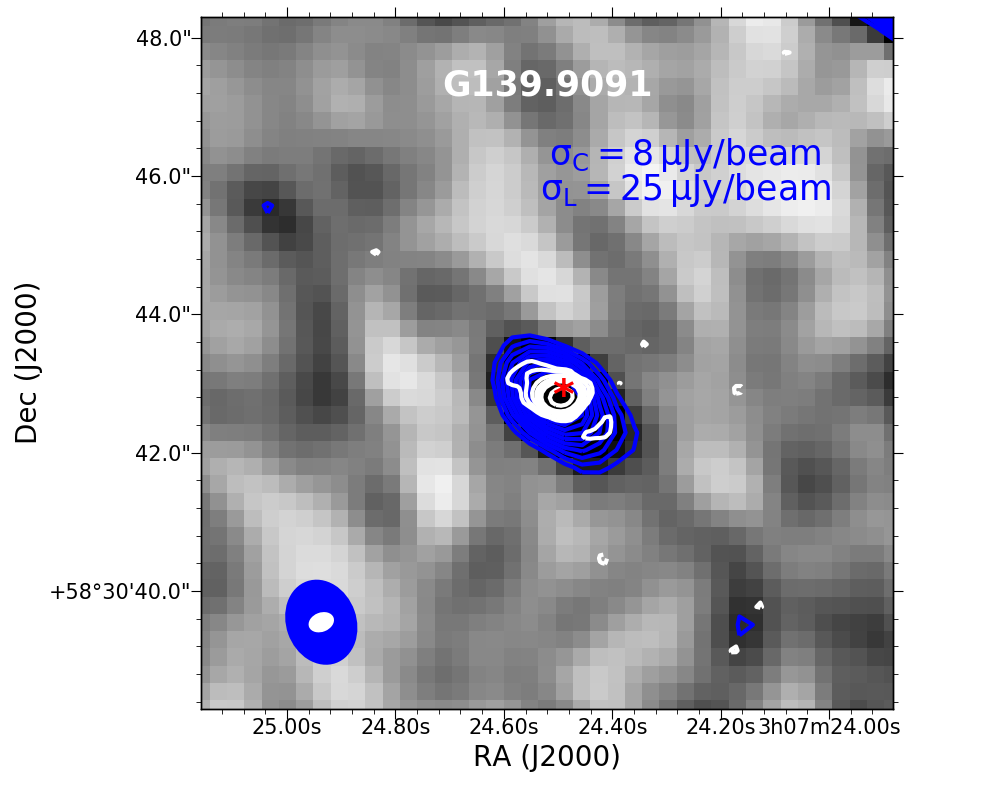
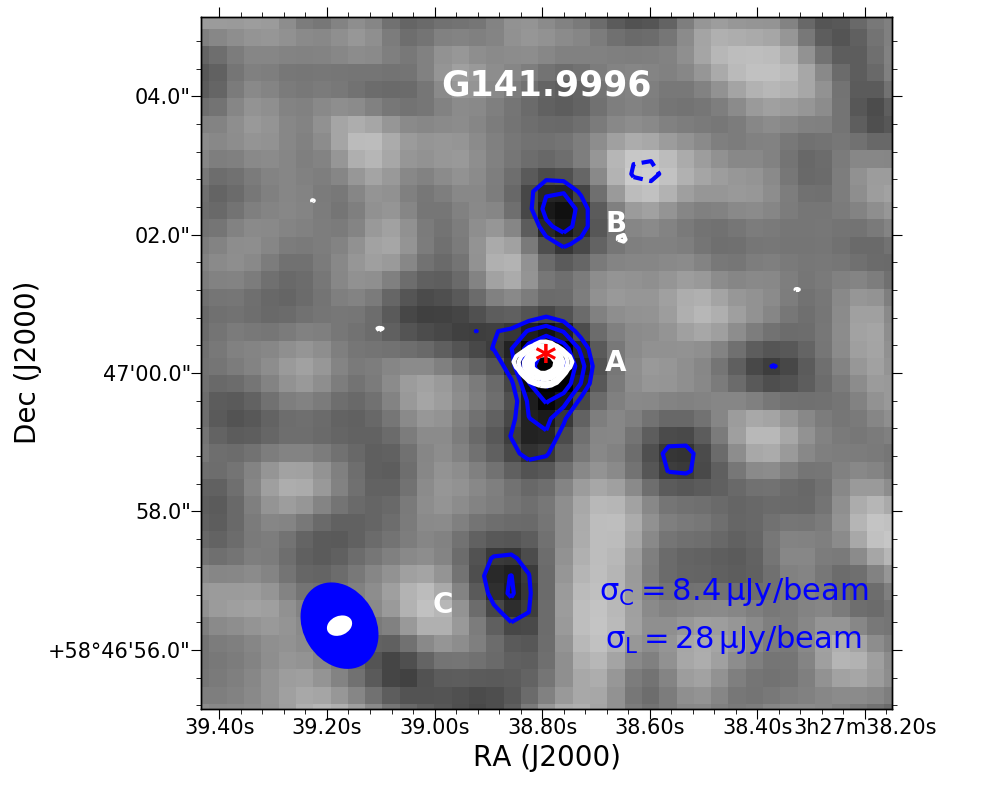
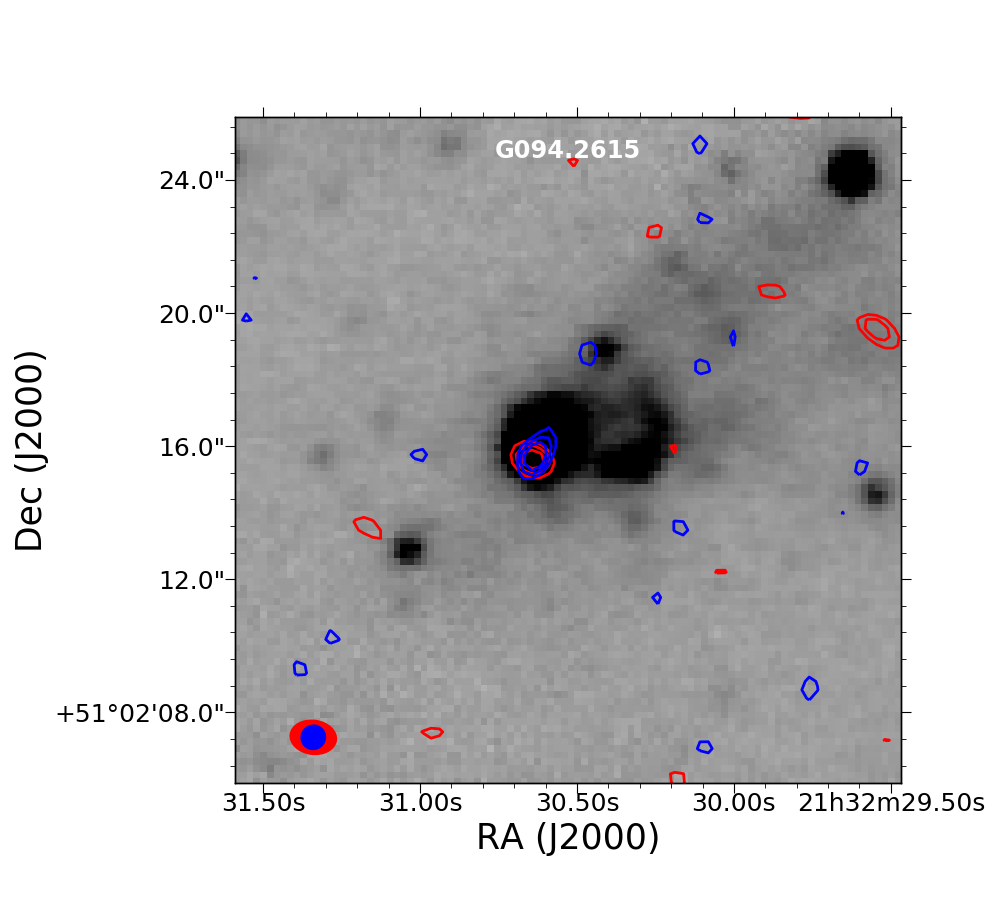
L-band images of all the sources are shown in Figure 1. Positions, fluxes, sizes and position angles of all their components are presented in Table 2. The components can be classified as cores or lobes. A core is detectable in the near/mid infrared, brighter at higher radio frequencies, e.g. Q-band, and is likely to be located between lobes, if the components show a linear orientation. Lobes, on the other hand, are seen a few arc-seconds away from the cores, aligned in the direction of the outflow cavities. Thermal lobes are detectable at higher frequencies while non-thermal lobes are more prominent at lower radio frequencies.
The L-band images display a variety of morphologies ranging from emission that comes from cores with radio lobes and partially resolved cores to point-like counterparts. G094.4637, G094.6028, G111.5671, G114.0835, G138.2957 and G141.9996 have radio lobes, suggesting that they harbour cores that drive the jets. G110.0931, on the other hand, is resolved, displaying an extended and jet-like structure but does not have radio lobes at L-band. However, it encloses multiple components at higher resolution, in C-band. Some of the components may be lobes. Other sources whose L-band emission encloses multiple components at the higher resolution, in C-band, are G094.2615, G094.4637 and G139.9091. Four sources; G083.7071-A, G108.5955C, G111.2552 and G139.9091 are partially resolved while three; G103.8744-A, G114.0835-A and G126.7144 are point-like.
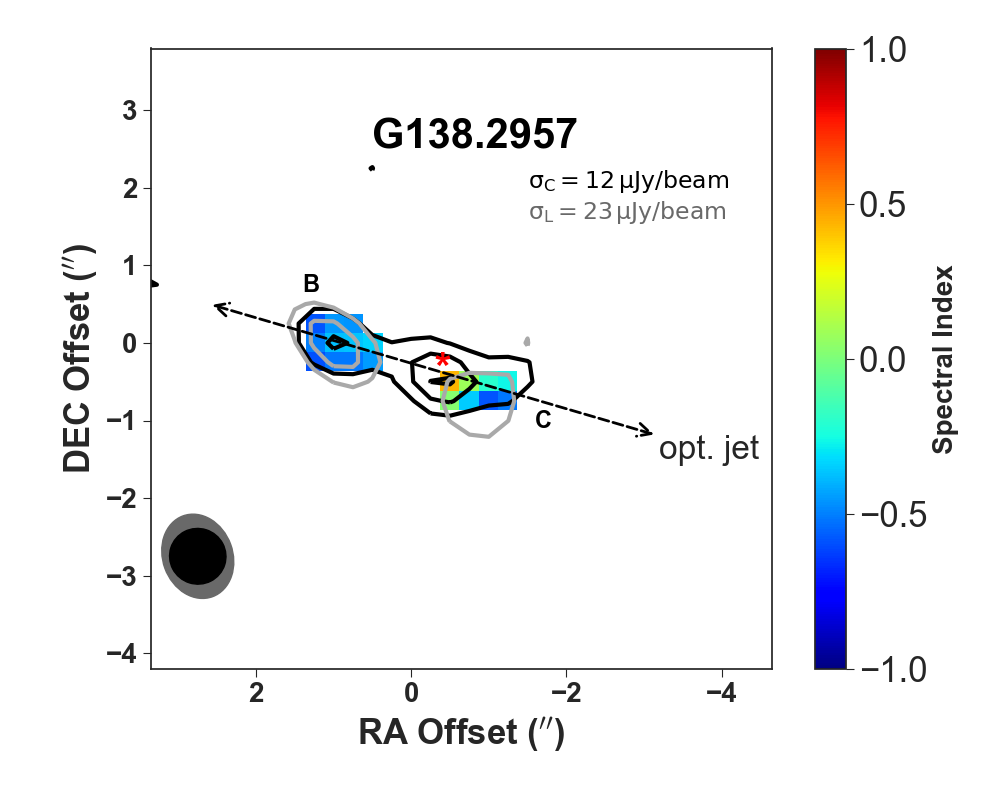
The cores of all the protostars were detected at L-band except for G103.8744, G136.3833 and G138.2957. None of the detections in the field of G103.8744 appear to be its core; they are all located a few arcseconds away from the position of the MYSO. G136.3833’s field has a bright source that is approximately to the west. This source does not manifest an explicit association with the MYSO. G138.2957, on the other hand, has two non-thermal lobes that are approximately 2′′ apart. Each of the lobes are located away from the position of the core (see Figure 1). All the L- and C-band emission have a positional match that agree within . However, NIR positions, taken from 2MASS, show slight offsets from the radio emission, perhaps because the emission is from a section of an outflow cavity that is further away from the source and is less obscured. In some cases, no radio emission coincides with the NIR position e.g. G103.8744 where the peak of the radio sources are positioned a few arcseconds away from the peak of the IR emission.
The flux densities and peak fluxes of the sources that lie within a radius of 5-10′′ from the MYSOs’ position were estimated by enclosing a box around a source. Uncertainties on the fluxes were calculated by averaging fluxes from five different locations of a source’s field which were devoid of emission, estimated using a box of the same size. An additional error, approximated at 10% of a source’s flux density was incorporated, in quadrature, to include the uncertainty associated with calibration of absolute flux. Sizes of the sources were calculated as , where is the deconvolved size of the source, is the full width at half maximum of a source’s flux distribution and is the full width at half maximum of the beam. These quantities, together with their position angles, calculated by inspection, are presented in Table 2. A source’s radio emission was considered real if its peak flux is at least three times higher than the root mean square noise in the field (i.e at least detection). Sources were considered resolved if their structures are extended with respect to the beam (i.e larger than the beam) otherwise they are compact.
| Object | RA | DEC | Integrated | Peak flux | Deconvolved Source Size | Position Angle |
|---|---|---|---|---|---|---|
| Name | (J2000) | (J2000) | Flux (mJy) | (mJy) | (o) | |
| G083.7071-A | 20h33m36.56s | +45∘35′43.9′′ | ||||
| G083.7071-B | 20h33m36.34s | +45∘35′41.1′′ | ||||
| G094.2615(A1+A2) | 21h32m30.61s | +51∘02′15.8′′ | ||||
| G094.4637() | 21h35m09.13s | +50∘53′09.1′′ | ||||
| G094.4637-E | 21h35m08.91s | +50∘53′07.0′′ | ||||
| G094.6028-A | 21h39m58.27s | +50∘14′20.9′′ | ||||
| G094.6028-B | 21h39m58.07s | +50∘14′24.0′′ | ||||
| G103.8744-A | 22h15m09.25s | +58∘49′08.8′′ | ||||
| G103.8744-B | 22h15m08.79s | +58∘49′07.8′′ | ||||
| G103.8744-G | 22h15m09.16s | +58∘49′06.6′′ | ||||
| G108.5955C | 22h52m38.06s | +60∘01′01.1′′ | ||||
| G110.0931 | 23h05m25.04s | +60∘08′15.8′′ | ||||
| G110.0931-D | 23h05m25.43s | +60∘08′16.9′′ | ||||
| G111.2552 | 23h16m10.34s | +59∘55′28.6′′ | ||||
| G111.5671-A | 23h14m01.76s | +61∘27′19.8′′ | ||||
| G111.5671-B | 23h14m01.54s | +61∘27′17.5′′ | ||||
| G111.5671-C | 23h14m01.85s | +61∘27′21.4′′ | ||||
| G114.0835-A | 23h28m27.82s | +64∘17′38.1′′ | ||||
| G114.0835-B | 23h28m27.40s | +64∘17′40.2′′ | ||||
| G126.7144 | 01h23m33.11s | +61∘48′48.8′′ | ||||
| G136.3833-A | 02h50m08.49s | +61∘59′52.1′′ | ||||
| G136.3833-B | 02h50m07.68s | +61∘59′52.2′′ | ||||
| G138.2957-A | 03h01m31.28s | +060∘29′12.8′′ | ||||
| G138.2957-B | 03h01m31.45s | +060∘29′13.2′′ | ||||
| G138.2957-C | 03h01m31.20s | +060∘29′12.4′′ | ||||
| G139.9091 | 03h07m24.49s | +58∘30′42.8′′ | ||||
| G141.9996-A | 03h27m38.76s | +58∘47′00.2′′ | ||||
| G141.9996-B | 03h27m38.77s | +58∘47′02.3′′ | ||||
| G141.9996-C | 03h27m38.86s | +58∘46′57.0′′ |
| Object | Integrated Flux (mJy) | Spectral Index | Class | |||||
|---|---|---|---|---|---|---|---|---|
| 1.5 GHz | 5.8 GHz | 44.0 GHz | Other (Ref) | |||||
| G083.7071-A | Core | |||||||
| G083.7071-B | Core | |||||||
| G094.2615(A1+A2) | Core/Lobe | |||||||
| G094.4637(A+B+C+D) | Core(s) + lobe(s) | |||||||
| G094.4637-E | Lobe | |||||||
| G094.6028-A | (a) | Core | ||||||
| G094.6028-B | Lobe | |||||||
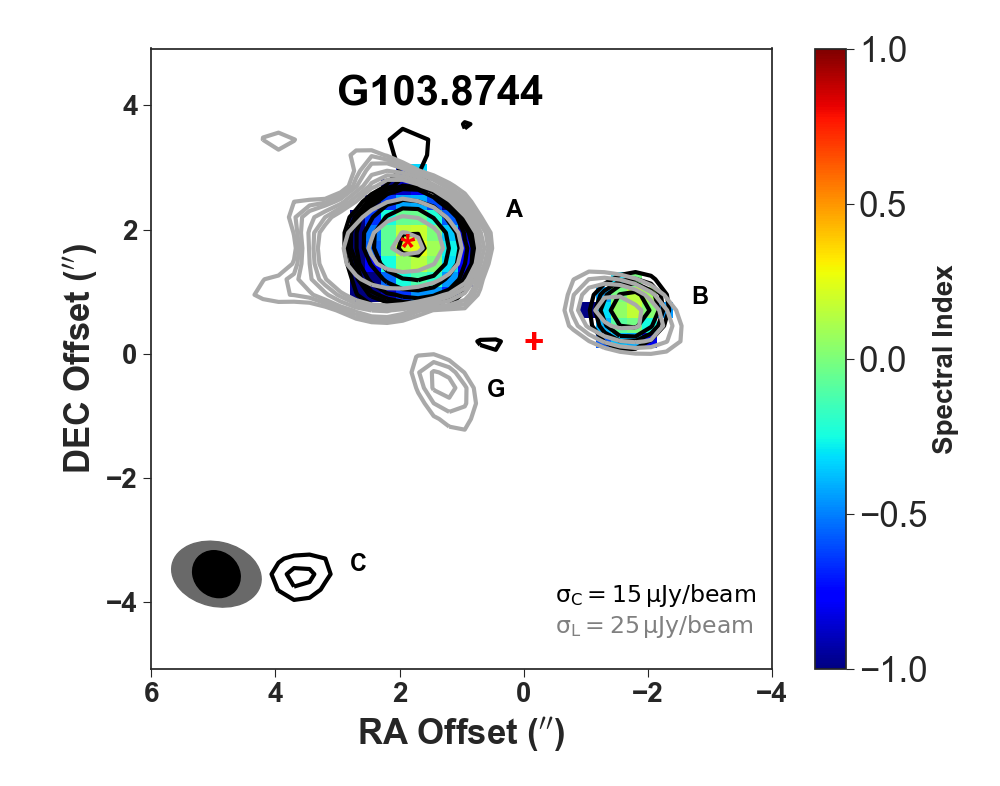
| G103.8744-A | (f) | HII-region | ||||||
| G103.8744-B | Unknown | |||||||
| G103.8744-C | Unknown | |||||||
| G103.8744-G | Lobe | |||||||
| G108.5955C | Unknown | |||||||
| G110.0931(A+B+C) | (b) | Core + lobe(s) | ||||||
| G110.0931-A | (b) | Lobe | ||||||
| G110.0931-B | (b) | Core | ||||||
| G110.0931-C | (b) | Unknown | ||||||
| G110.0931-D | HII-region | |||||||
| G111.2552 | (c) | Core | ||||||
| G111.5671-A | (d) | Core | ||||||
| G111.5671-B | Lobe | |||||||
| G111.5671-C | Lobe | |||||||
| G114.0835-A | Core | |||||||
| G114.0835-B | Lobe | |||||||
| G126.7144 | Core | |||||||
| G136.3833-A | Core | |||||||
| G136.3833-B | Unknown | |||||||
| G138.2957(A+B+C) | (e) | Core + lobes | ||||||
| G138.2957-B | Lobe | |||||||
| G138.2957-C | Lobe | |||||||
| G139.9091 | Core | |||||||
| G141.9996-A | Core | |||||||
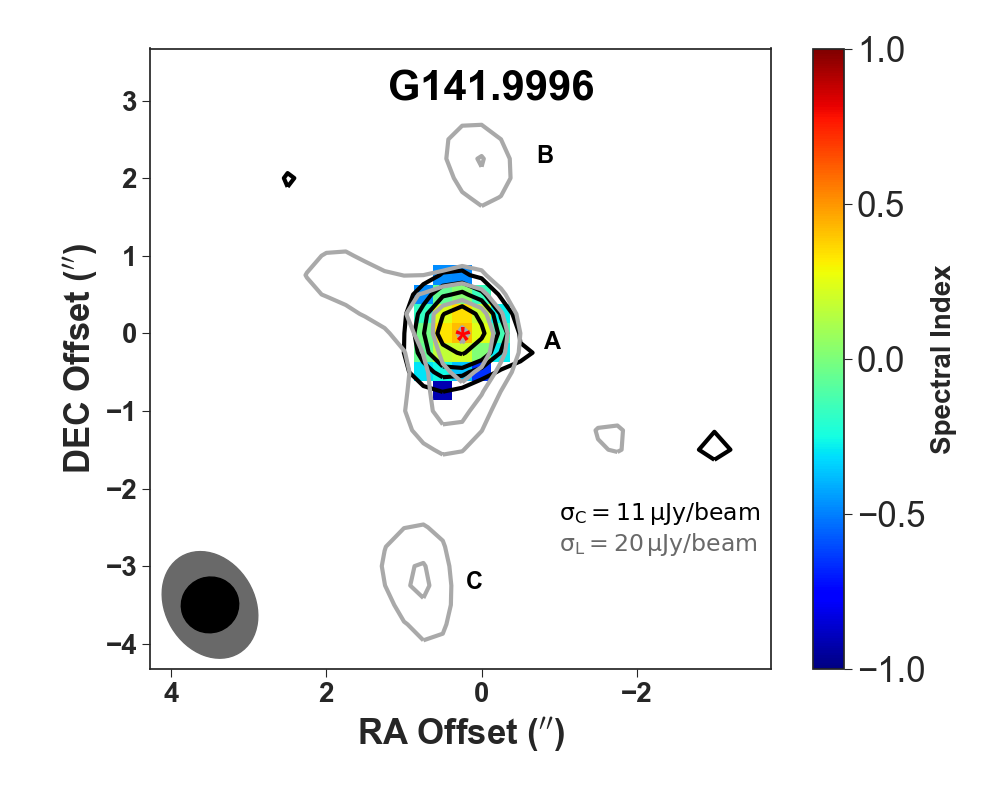
| G141.9996-B | <0.03 | Lobe | ||||||
| G141.9996-C | <0.03 | Lobe | ||||||
5.2 Spectral indices and maps of the sources
Spectral indexing provides a means of classifying radio emitters as either thermal () or non-thermal () e.g Rodríguez-Kamenetzky et al. (2017), Vig et al. (2018). However, it is difficult to distinguish between optically thin thermal emission and non-thermal emission if the value of the spectral index is closer to -0.1 and the uncertainties are large. Non-thermal emission is thus claimed with certainty only when -0.1 and the uncertainty on the index does not allow for overlap with -0.1.
The integrated fluxes of the sources at L-, C- and Q-bands, together with any others available in literature, were used to estimate their indices despite the fact that data collection was not contemporaneous and MYSOs may be variable e.g. S255 NIRS 3 (Cesaroni et al., 2018). Moreover, the observations are of different resolutions and are clearly sensitive to different spatial scales. To ensure the accuracy of the method, both L- and C- band data were re-imaged using a common range of wavelength i.e 15-200 k, so as to use emissions from comparable spatial scales in estimating the spectral indices of the sources. Nonetheless, full range of wavelength was used in Q-band despite the fact that it traces a different spatial scale since the overlap between its uv-coverage and 15-200 k is insufficient. Further caution was exercised by estimating L- and C-band fluxes from a similar enclosing box regardless of the morphology of a source to provide for uniformity.
A high resolution observation at Q-band can result in missing flux (van der Tak & Menten, 2005), but at the same time dust emission contribute about 4311 % (Purser, 2017) of the flux at Q-band. For example, the flux of G111.5671 at 44 GHz (Purser et al. 2019 in prep), observed using the VLA’s A configuration is lower than C-configuration flux (van der Tak & Menten, 2005) by 18%. Thus, the quantities of free-free emission at Q-band, essential for estimating the spectral indices, are unknown and some of the indices may have large uncertainties. However, the indices are used since the SEDs of most of the cores, shown in Figure 2, do not show a strong evidence of unexpected behaviour.
The indices were estimated to be equivalent to the slopes of the lines of best fit of a plot of logarithm of flux density and frequency of an object, generated by minimising chi-squares (shown in Figure 2). In cases where a source’s flux density could not be estimated (i.e too faint to detect), an upper limit, evaluated as three times its field rms (i.e rms) was set as its peak flux. An upper limit on the integrated flux of such a source was estimated from a polygon whose size is similar to that of the source at a frequency where it is detected. Some sources are extended at L-band but are resolved into multiple cores and lobes e.g G094.4637 or a core and a lobe e.g G094.2615, in the higher resolution C- and Q-bands. For the extended sources, the flux at L-band and the sum of the fluxes of the components in the higher resolution observations were used to estimate the index. Indices of the resolved components, on the other hand, were estimated from the fluxes at the frequencies where they are resolved. If a source was only detected at one frequency, a limit on the index was calculated. Table 3 shows a list of the objects, their spectral indices and the fluxes used in estimating the indices. Details of the components incorporated in the calculation of the spectral indices of L-band sources that harbour multiple components are indicated in Table 3.
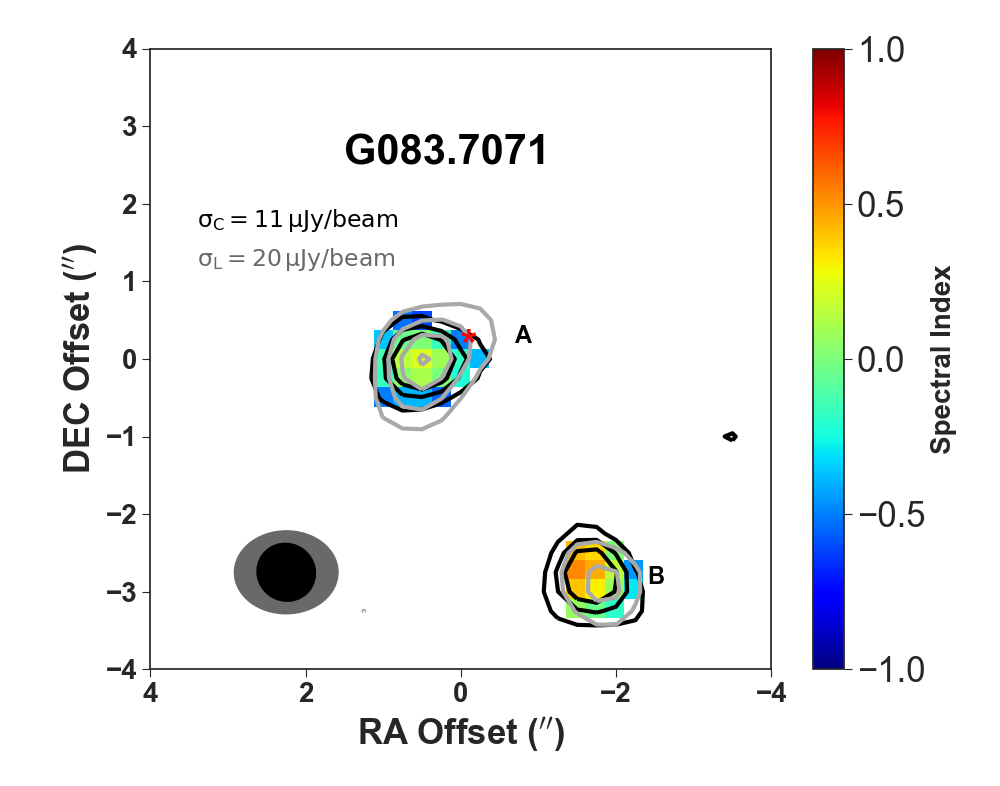
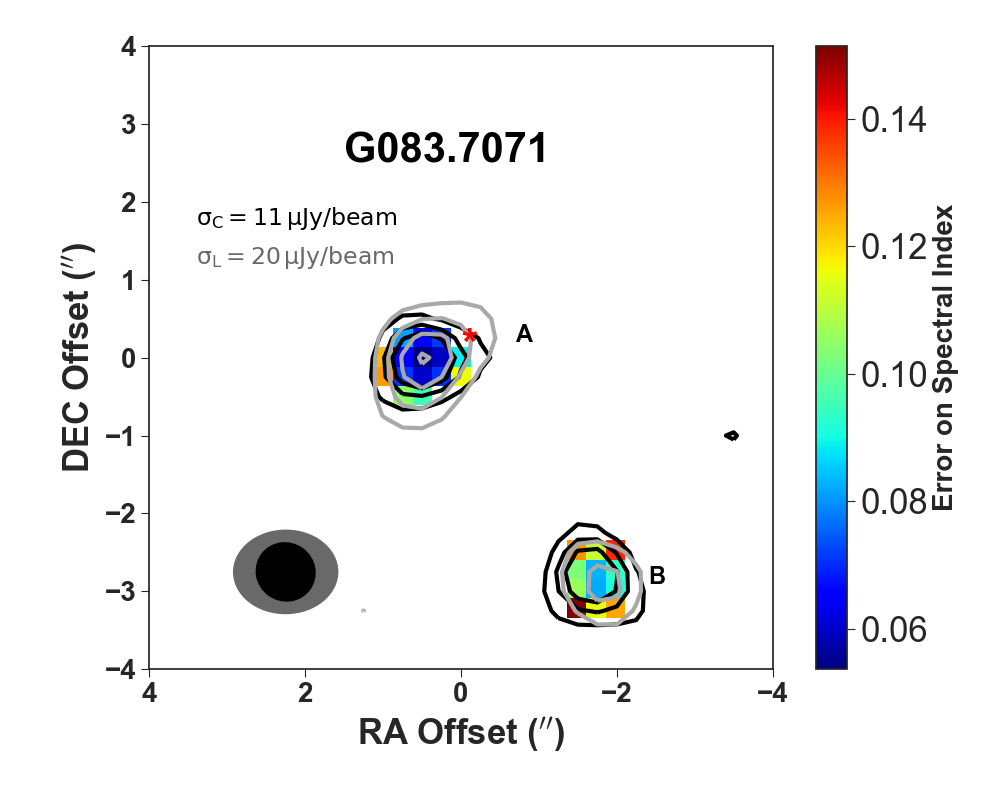
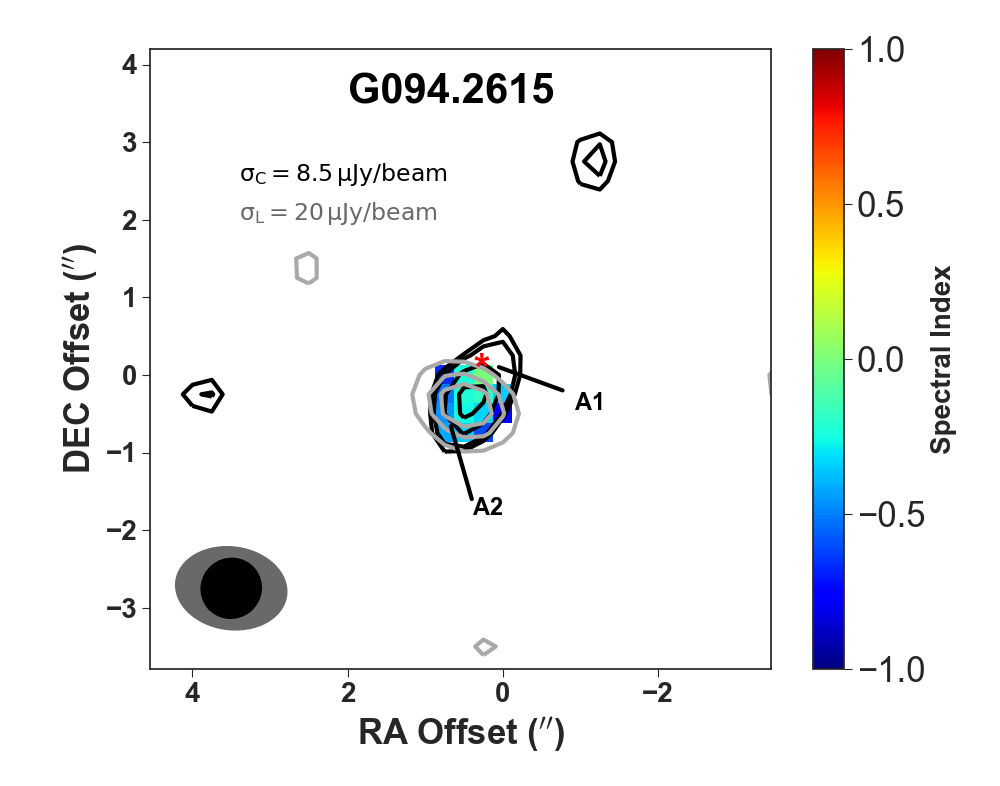
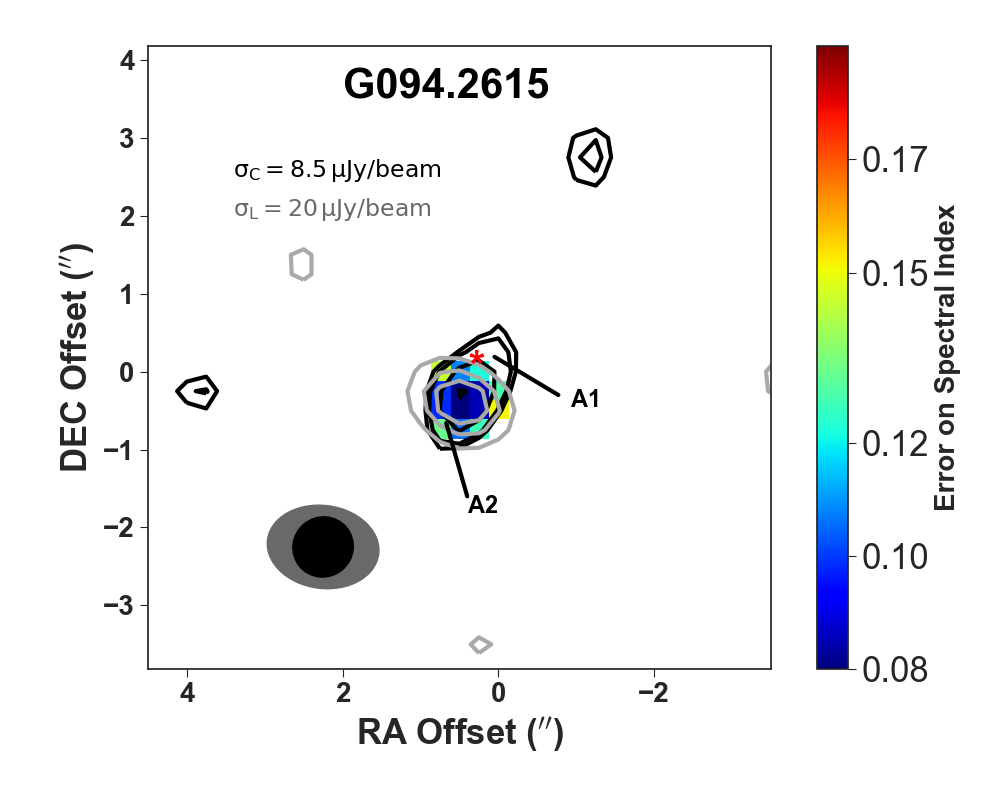
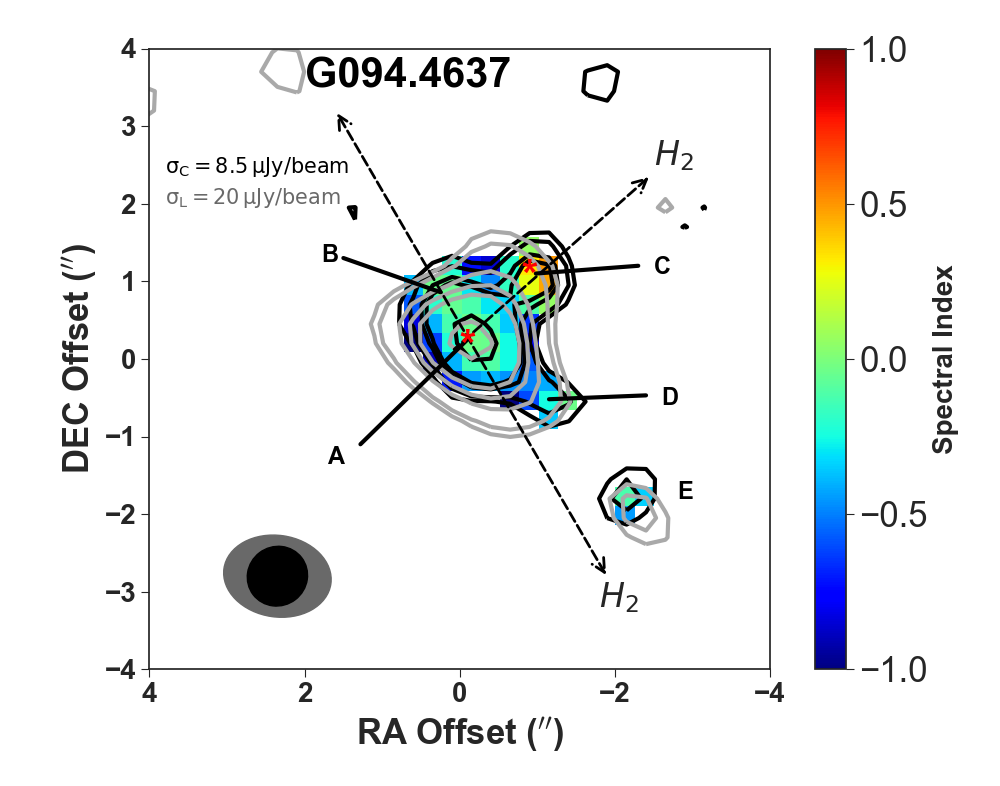
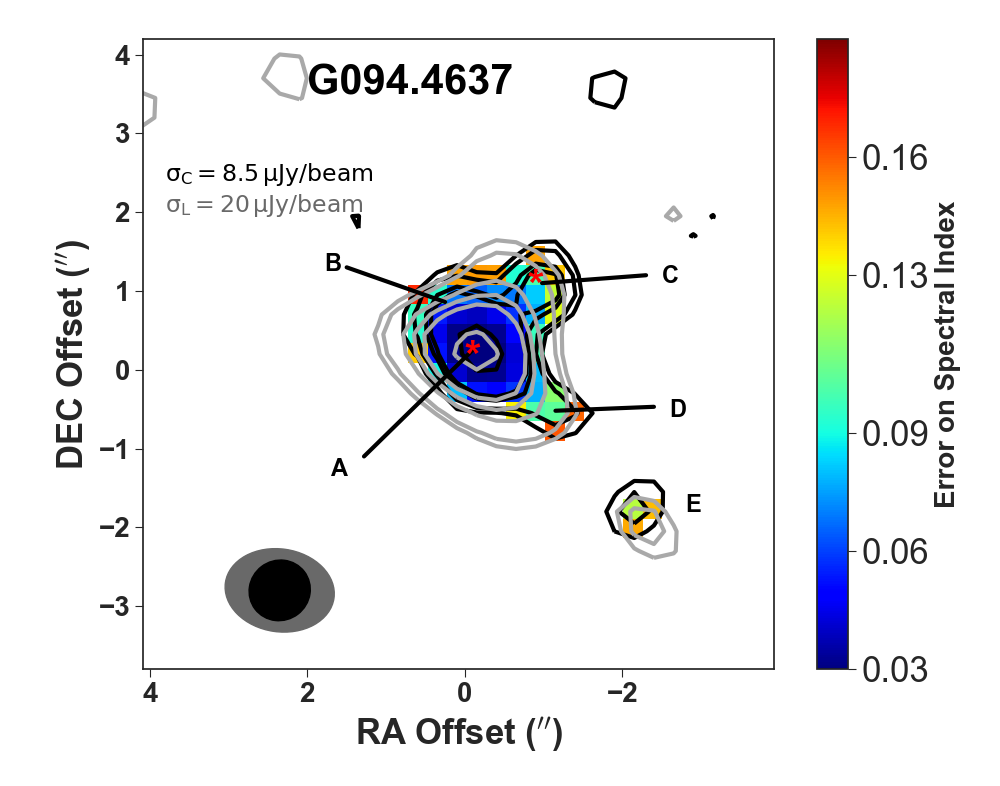
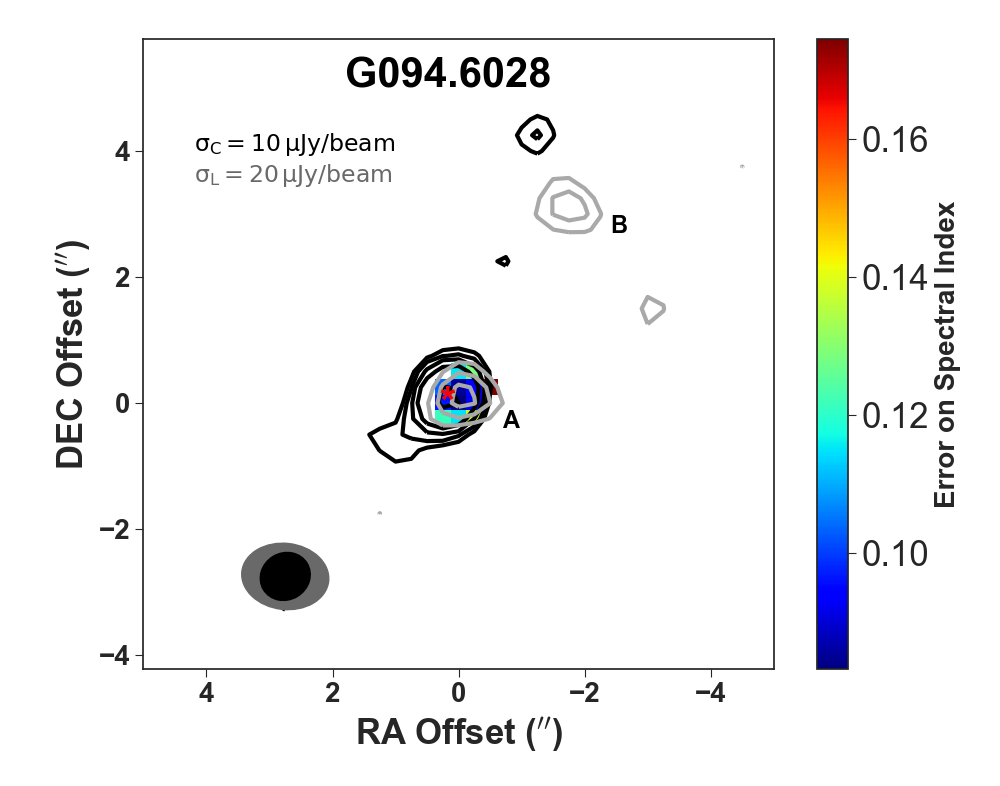
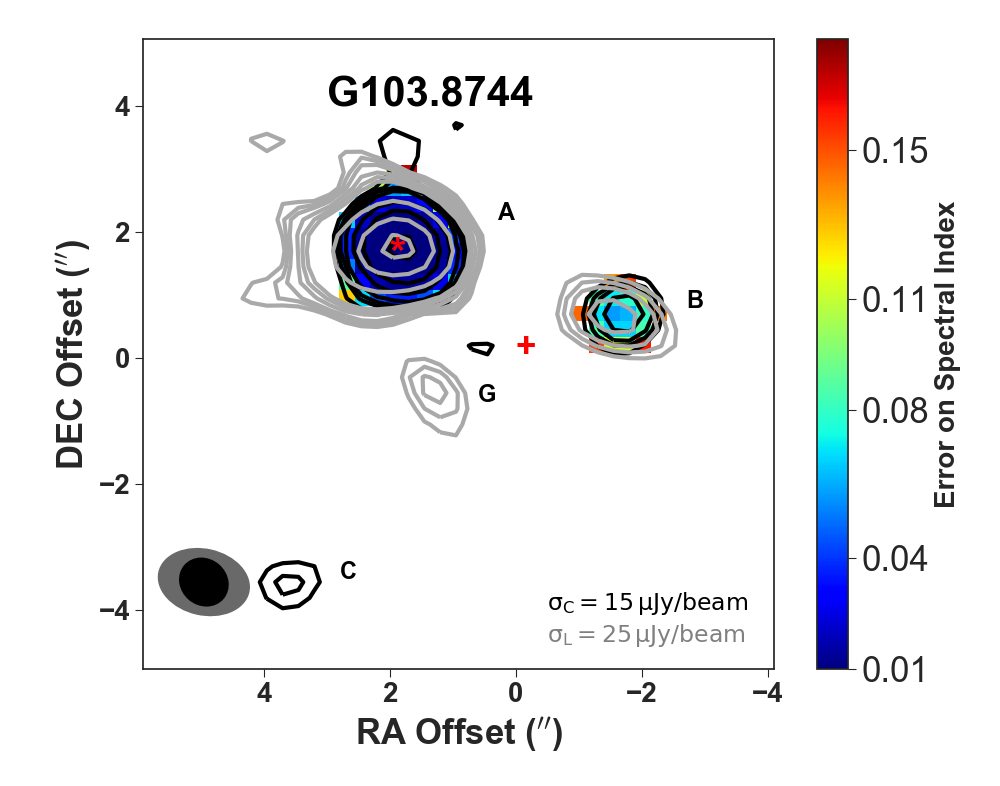
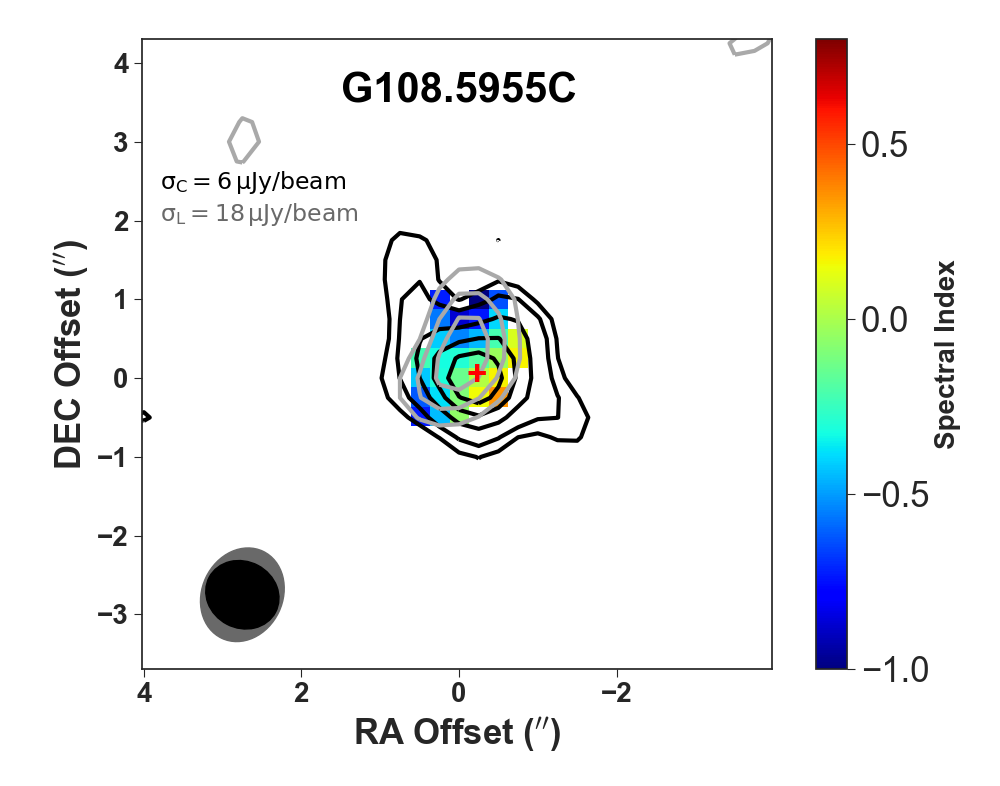
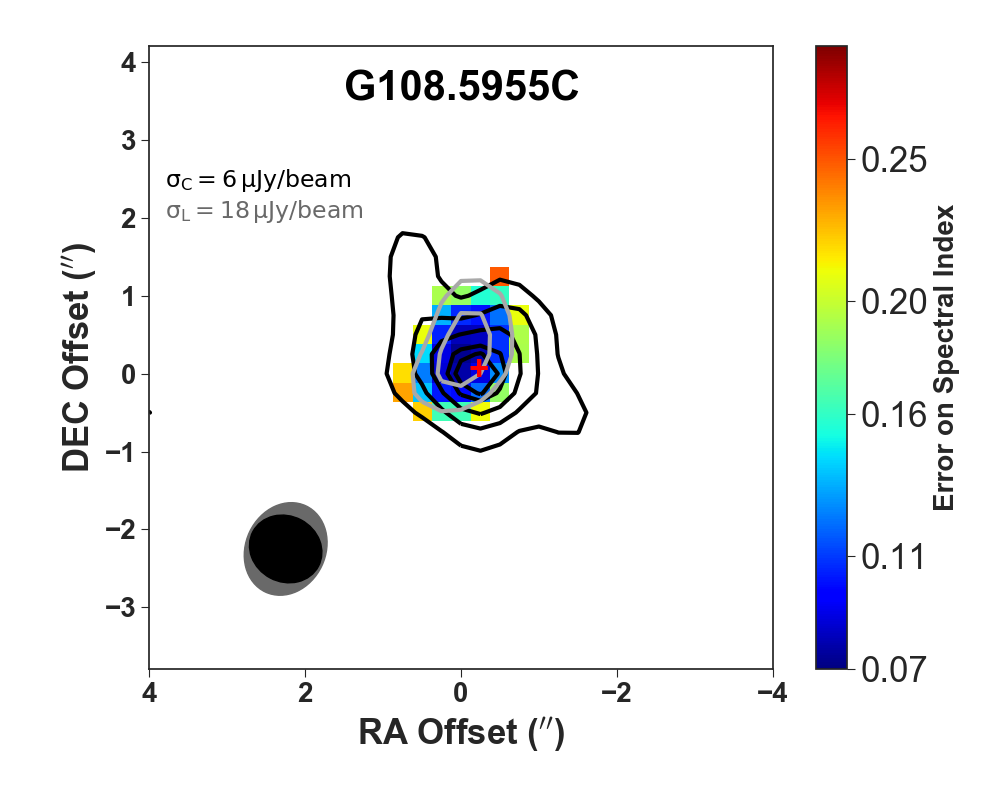
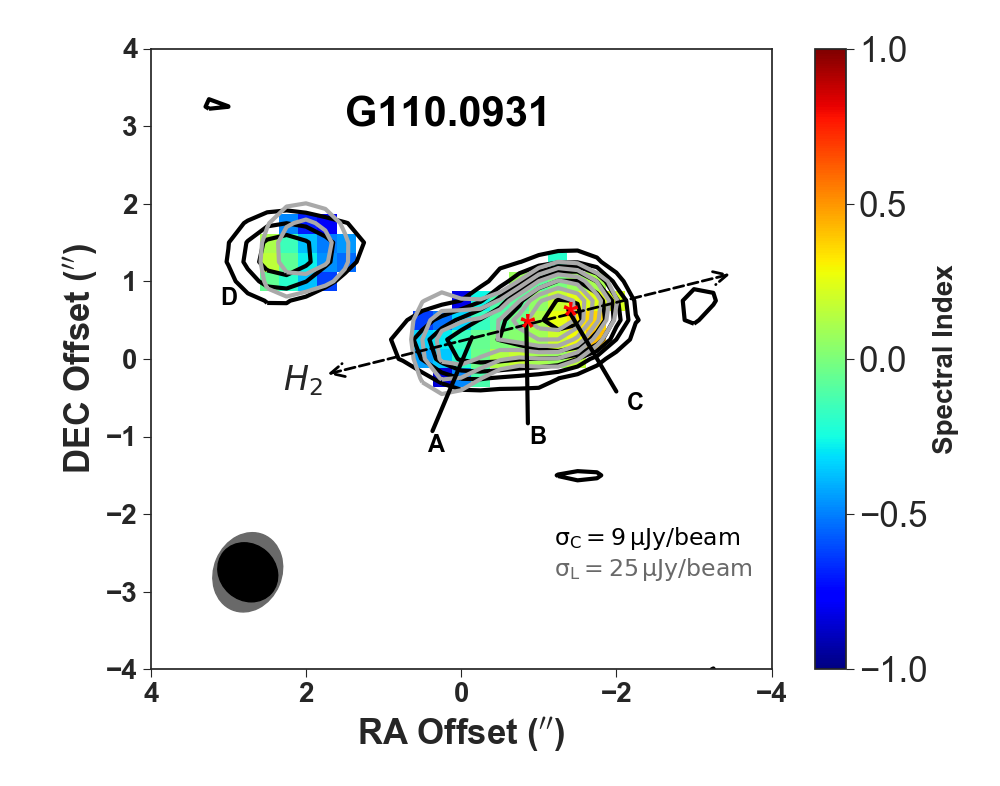
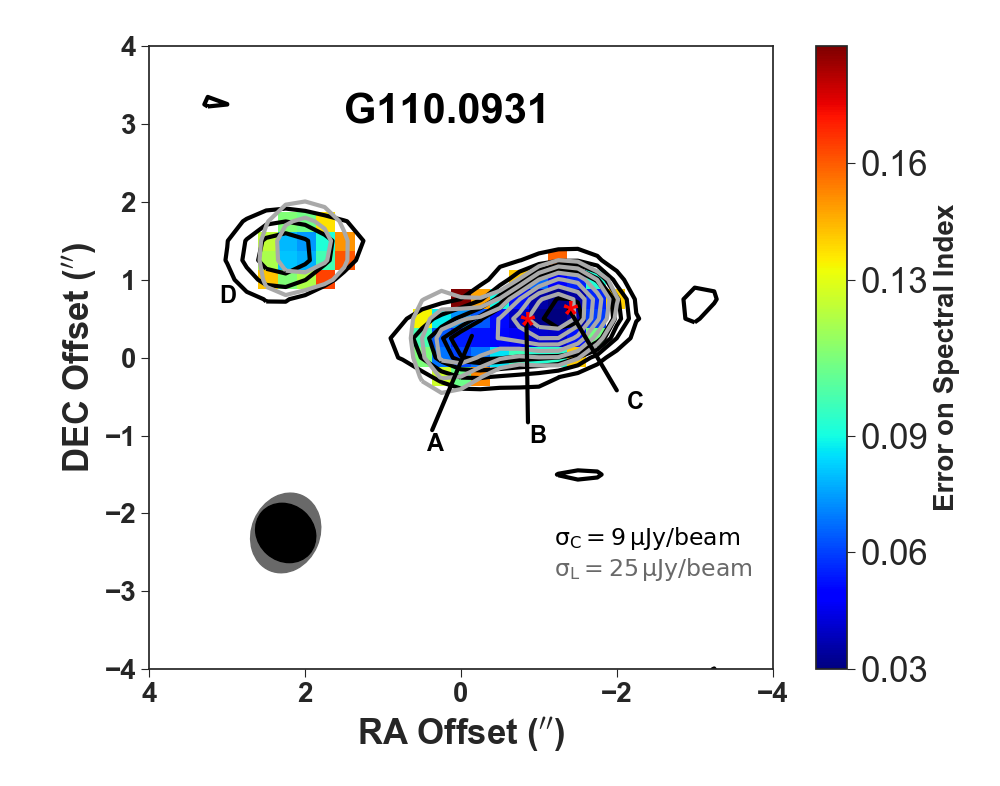
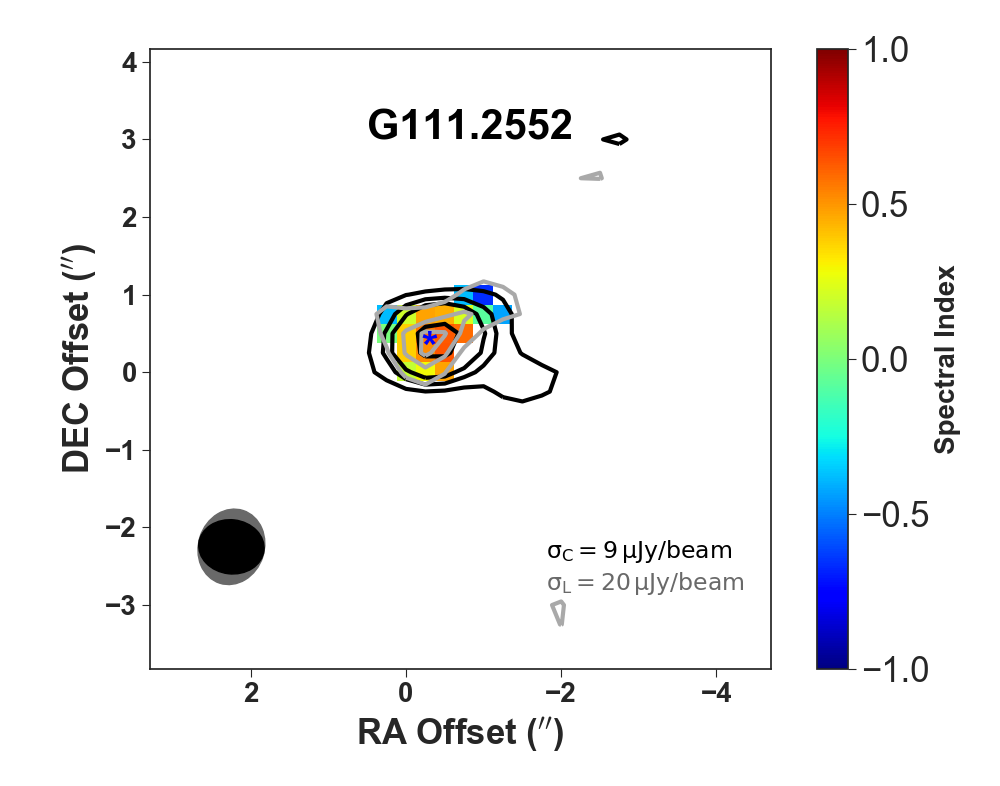
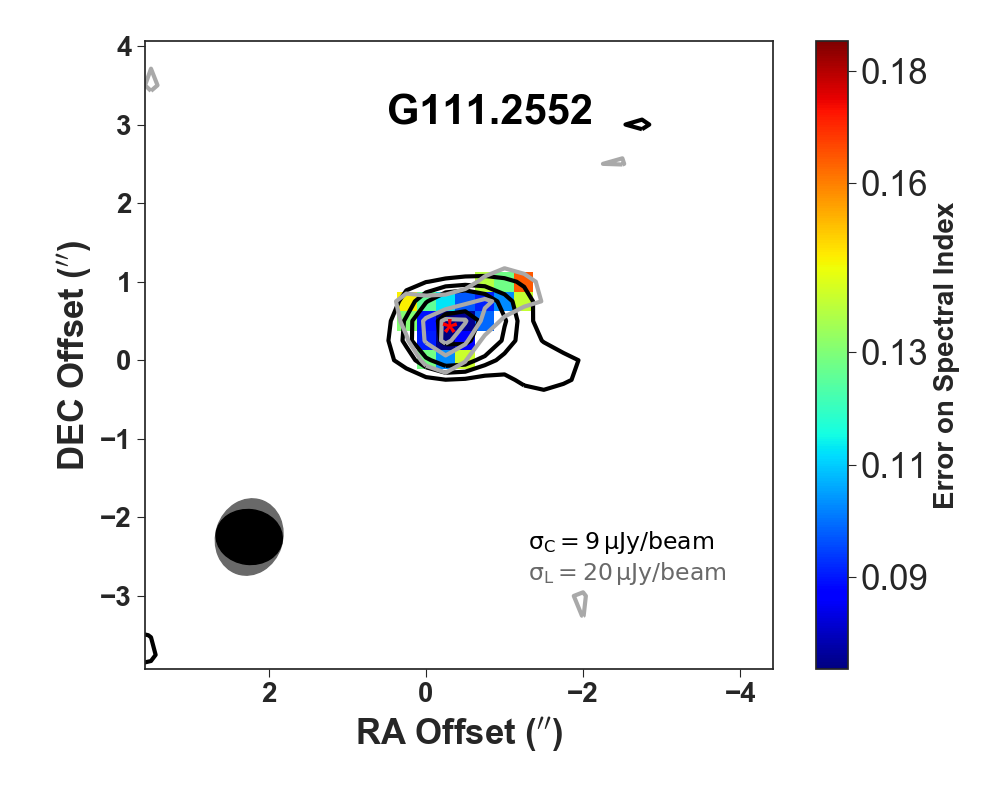
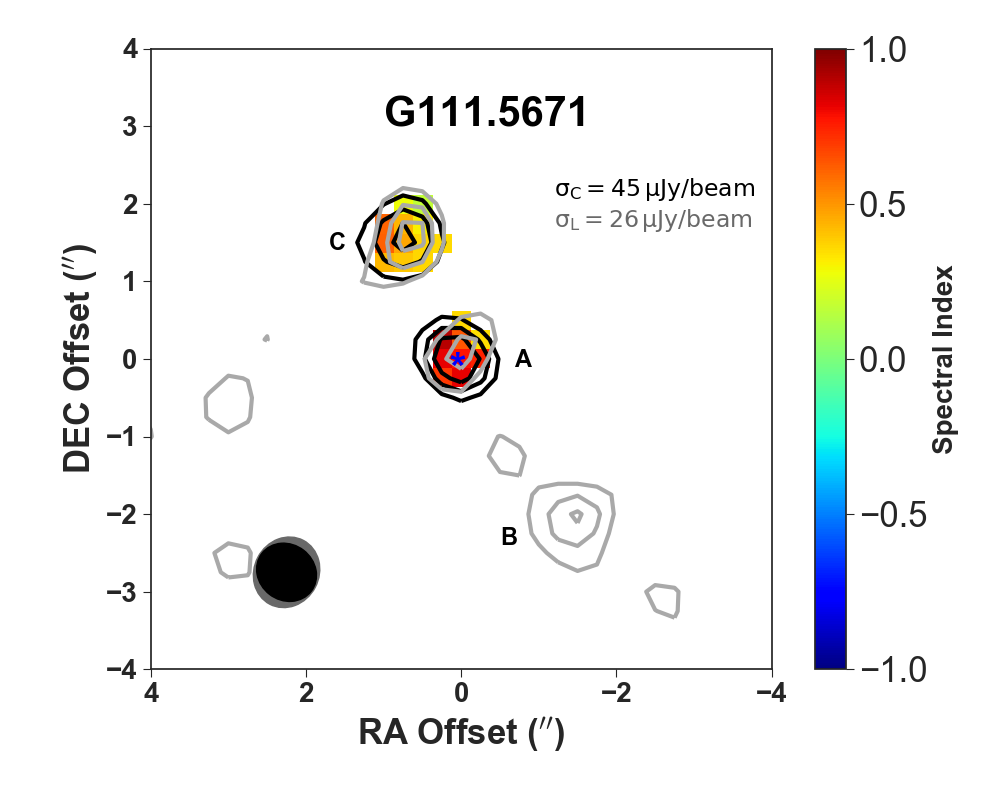
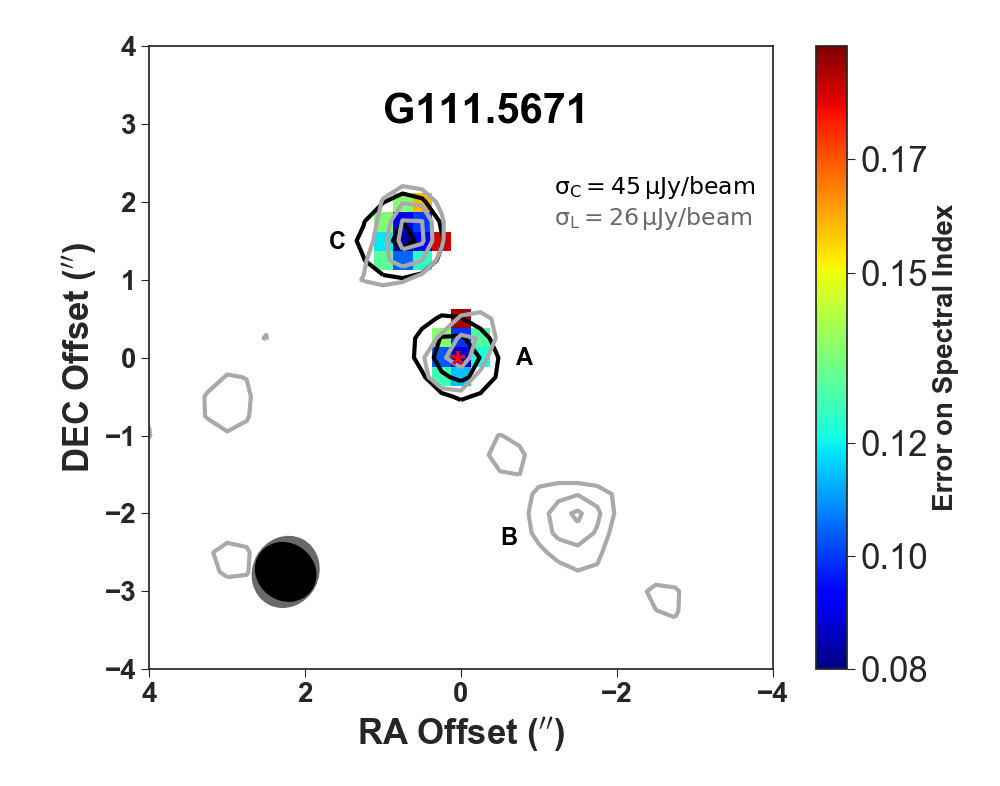
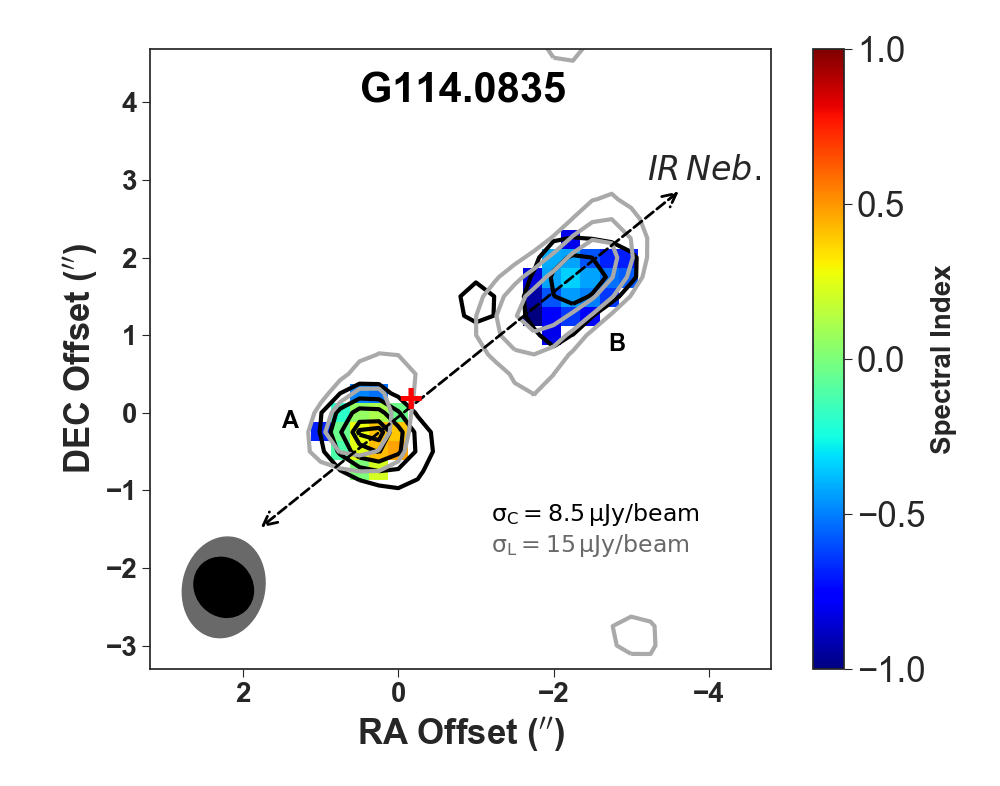
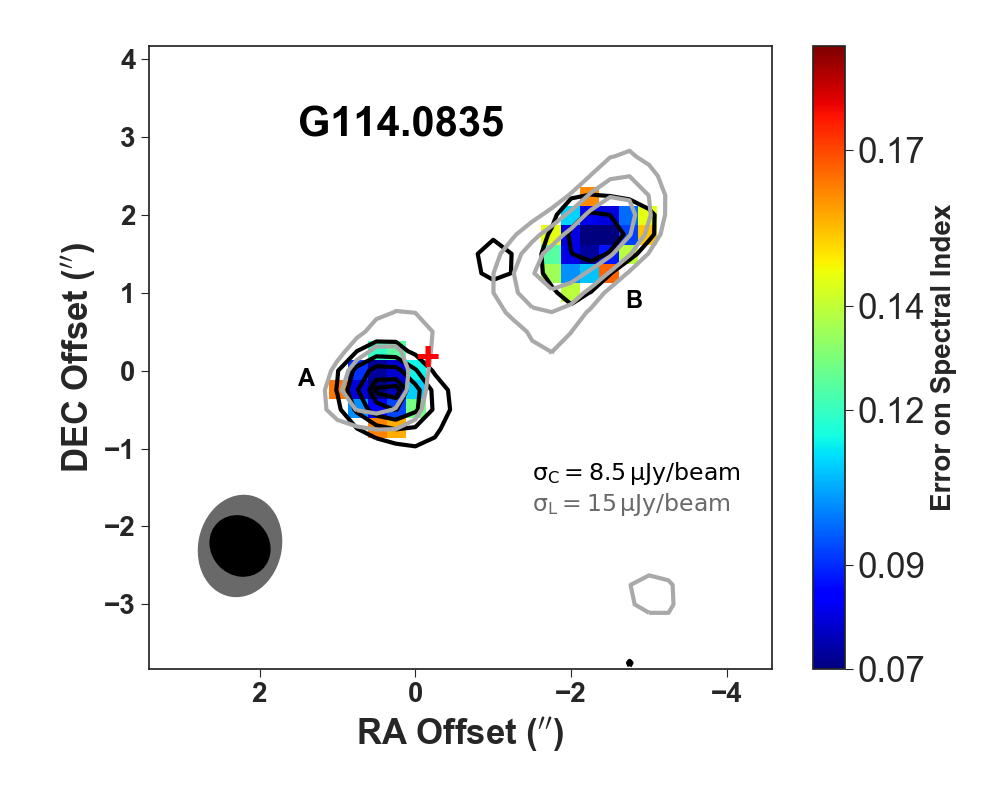
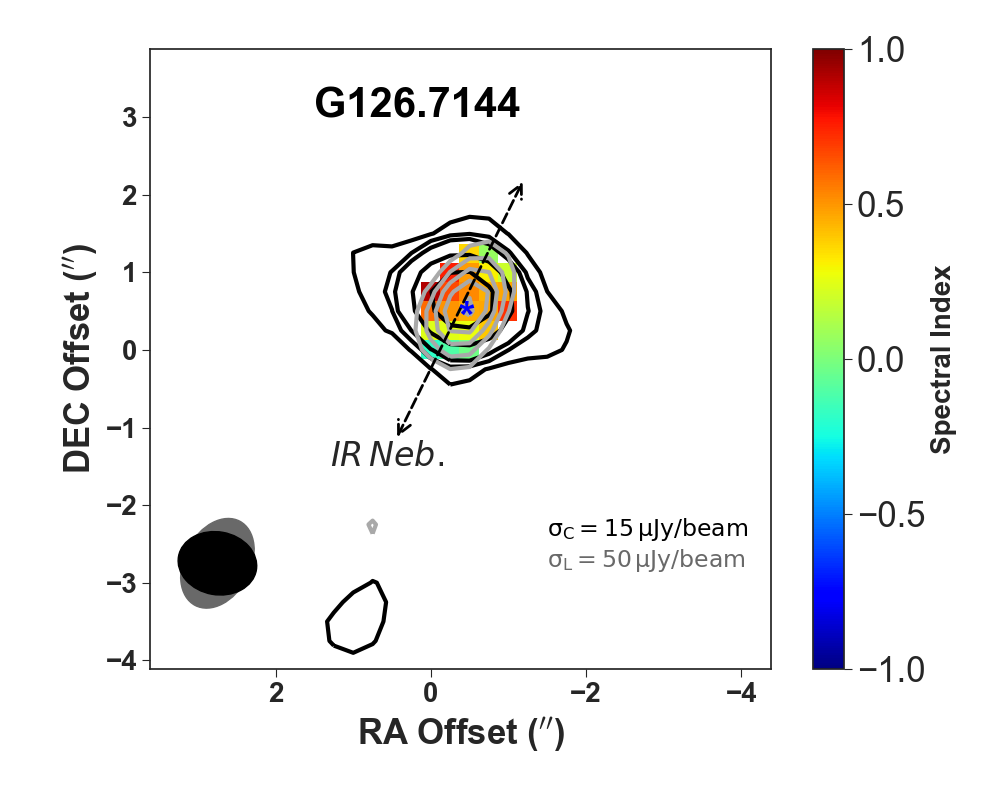
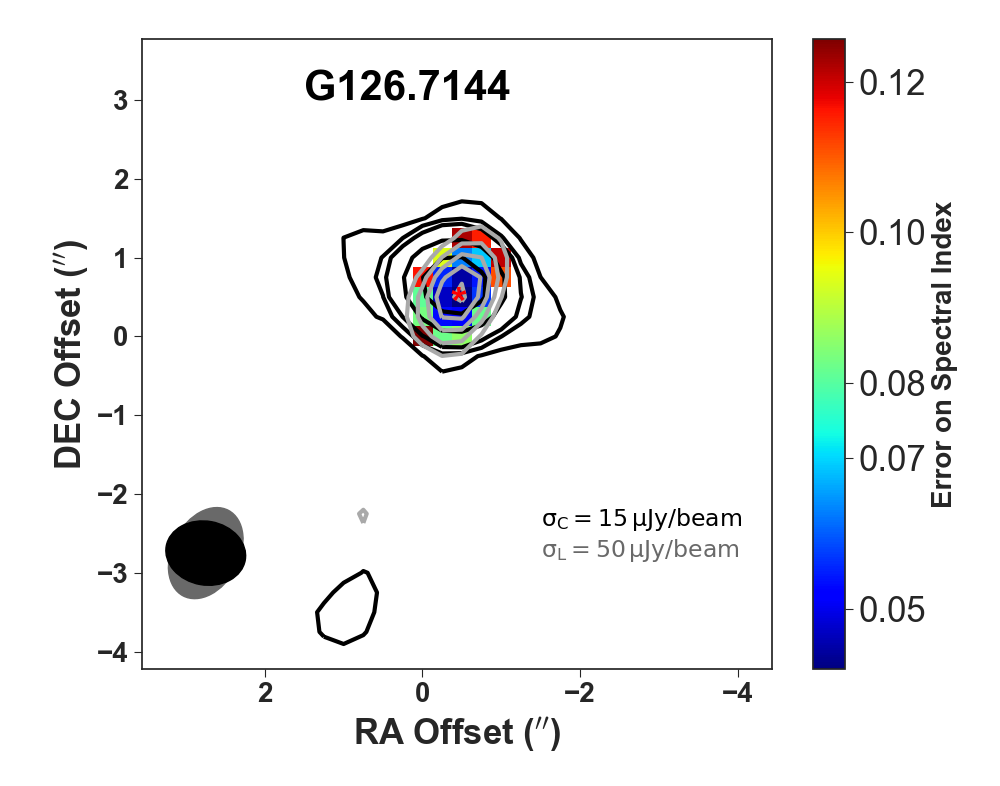
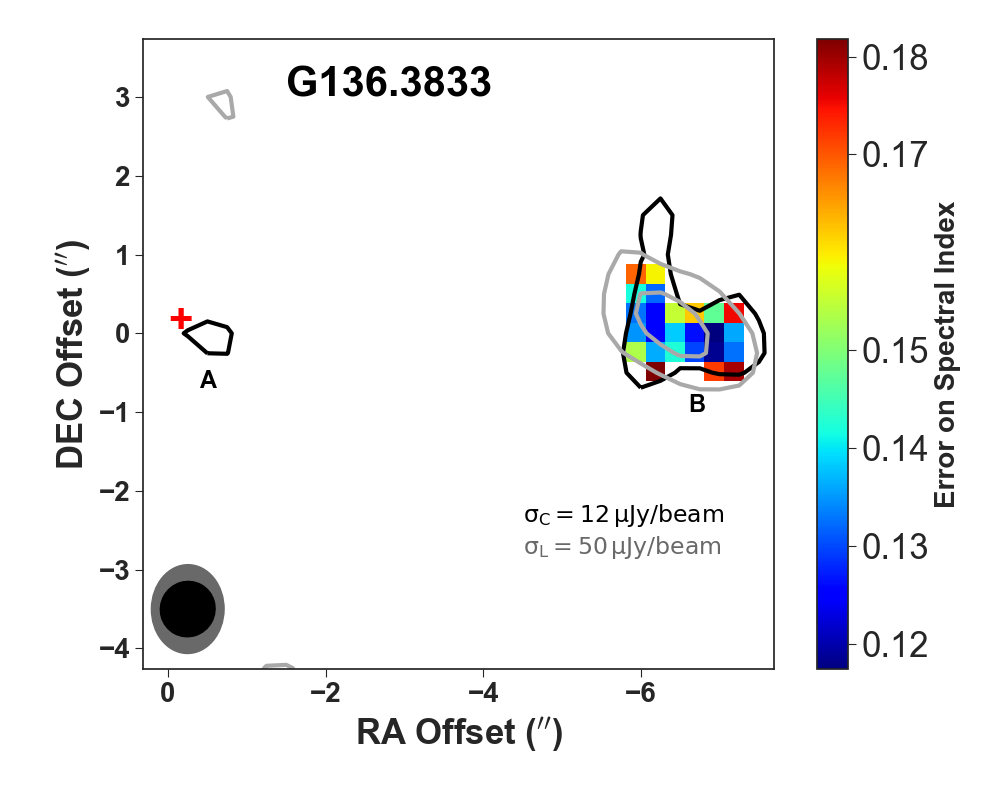
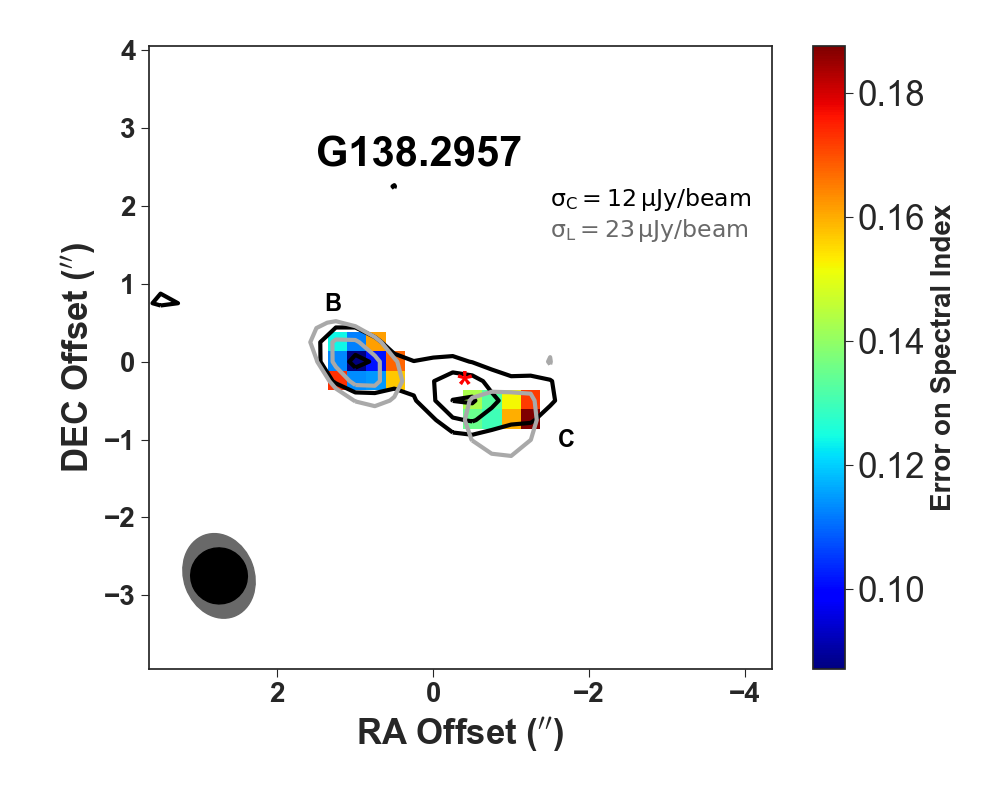
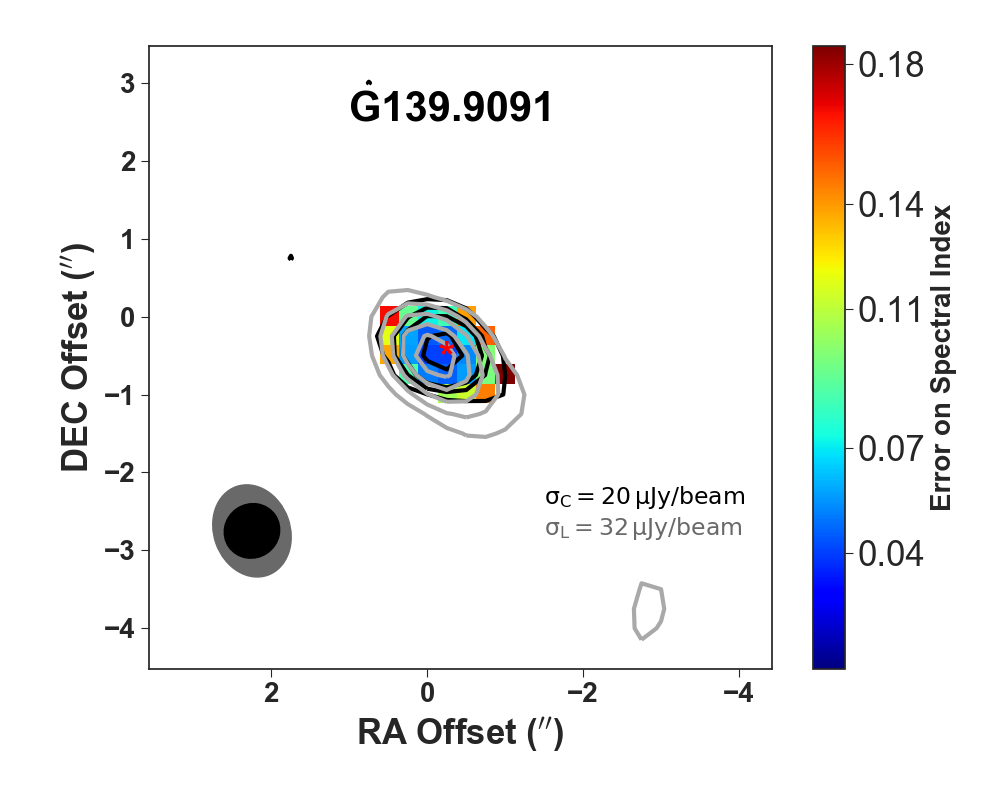
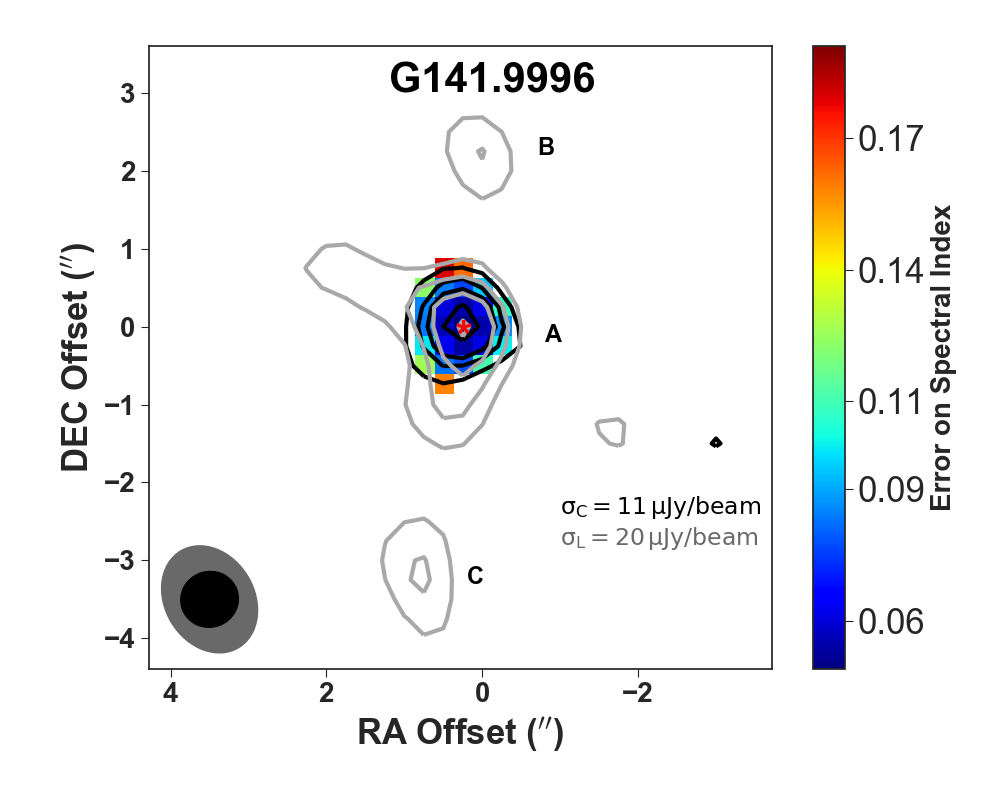
Spectral index maps of the MYSOs were generated from L- and C- band images using CASA task immath in spix mode to display the distribution of the indices across a source. The maps used are of wavelength range 15-200 k. Only pixels whose values are more than 3 in both L- and C-bands were used in creating the maps. The re-imaged C-band maps show varied morphologies, some of which are comparable to L-band emission e.g. G110.0931 while others are not e.g. G111.2552 and G108.5955 (see Figure 3). Uncertainty in the spectral index of a given pixel on the map was approximated by assuming that the error on the flux of each cell is equivalent to the rms of the field. This error was propagated while calculating the spectral index of corresponding L- and C-band pixels. The maps and the corresponding errors are shown in Figure 3. Whereas the beams of L- and C-band maps that were used in generating the spectral index maps are largely similar, a few maps were generated from C-band images of smaller beams. The smaller C-band beams can result in slightly lower fluxes at C-band and more negative spectral indices on the pixels of non-thermal sources.
5.2.1 Spectral indices of the cores
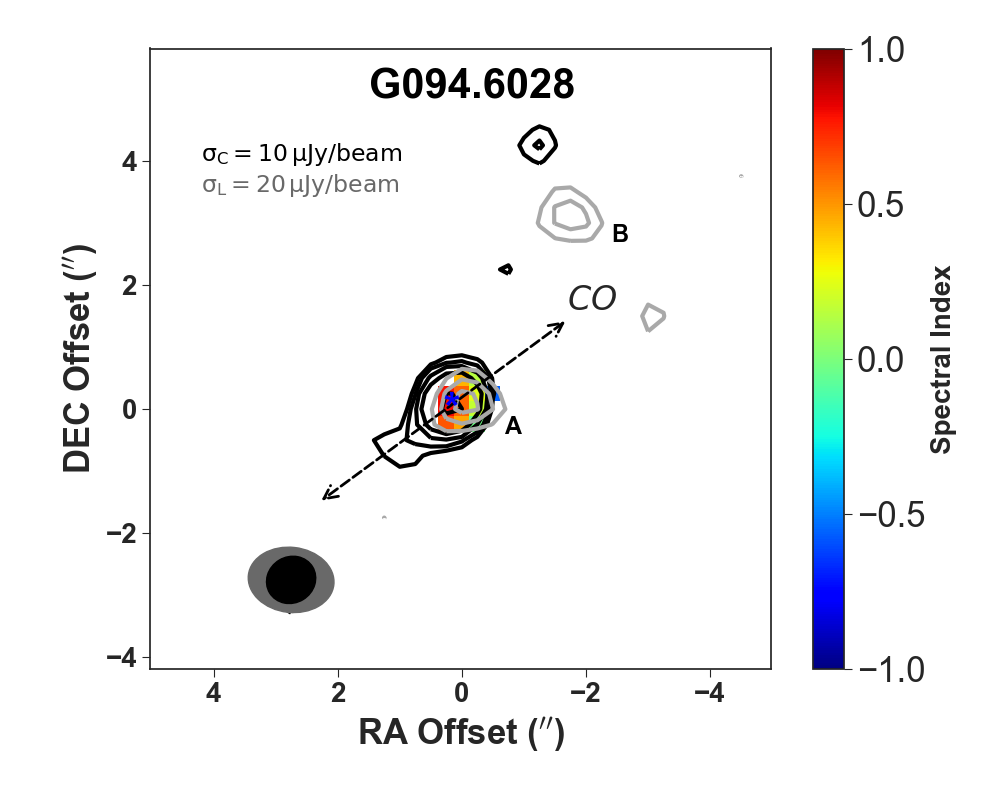
The L-Q band spectral indices show that all the detected cores are thermal radio emitters (). To decipher the nature of the objects further, their L-, C- and Q-band fluxes, among others from the literature, were used to compare their spectral indices as derived from L- to C- bands with those from C- to Q- bands . Table 3 shows three possibilities: that is lower than e.g. G094.2615, G094.4637 and G141.9996; that is higher than e.g. G110.0931 and G094.6028-A and which is comparable to e.g. G139.9091 and G126.7144.
Sources whose have overall spectral indices that are flattened by L-band fluxes. This may be due to steepening of by dust emission at Q- or contribution of non-thermal emission at L-band. Purser (2017) estimated that dust emission is, on average, 4311 % of the total emission at 44 GHz, capable of steepening C-Q band slope, however the values of are 0.6, consistent with thermal jets.
Spectra of sources whose are higher than exhibit an HII region-like feature due to the apparent turnovers of their SEDs. In G110.0931, this can clearly be attributed to loss of flux at Q band where one of its components (A) was not detected. Finally, sources whose are comparable with seem to have thermal cores that are separated from the lobes (e.g. in G111.5671-A) or cores with no clear lobes (e.g. in G111.2552 and G126.7144). In conclusion, L-Q band spectral indices () of the MYSOs are largely positive () and the radiation from what one can consider a central component of a MYSO is also primarily thermal, making it a substantial radio emitter at higher frequencies. The average , and of the sources are 0.420.34, 0.430.33 and 0.420.27 confirming that the cores are thermal.
5.2.2 Spectral indices of lobes
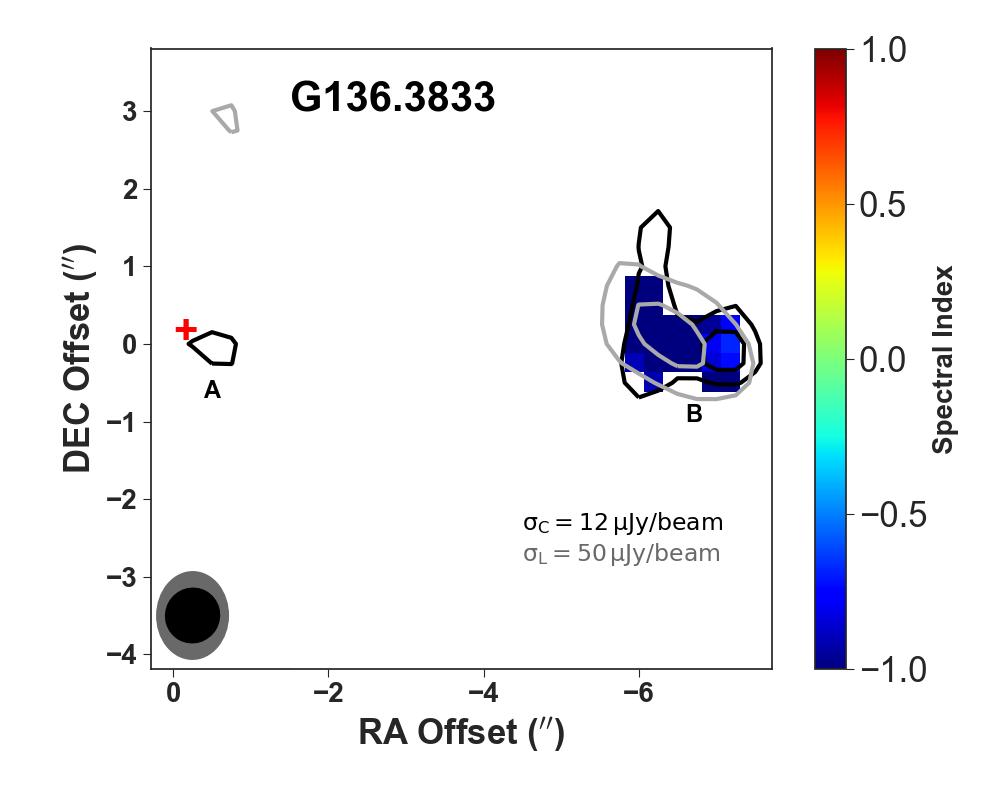
Four sources, G094.6028, G103.8744, G111.5671 and G141.9996, have non-thermal lobes of spectral indices 0.42. The lobes were detected at L- but not C-band. G138.2957 has non-thermal lobes of spectral indices -0.460.31 and -0.380.33 to the east and west of its thermal core respectively (see Figure 3). Two sources; G114.0835 and G136.3833 have nearby non-thermal sources that are aligned with the orientation of NIR emission in their fields. G094.4637 has a thermal lobe whose L- and C band emissions are displaced in the direction of the outflow. It also has a component, D that is non-thermal. Besides the lobes, two sources; G094.2615 and G108.5955 show tentative indications of non-thermal emission to the south-east and east of their cores, respectively.
These findings suggest that six of the sources, equivalent to 40 %, have non-thermal lobes which indicate the presence of magnetic fields. It is, however, not clear if the magnetic fields are generated in the surrounding interstellar medium or by the protostars themselves. The non-thermal emission, present on an object’s spectral index map, is mainly seen further away from the central source, confirming that the central sources are thermal while the jet lobes are not. Detailed comments on each object are given in the appendix.


5.3 Nature of the cores and their radio luminosity at L-band
The nature of the cores and their L-band emission were examined further by exploring the distribution of the cores on a bolometric-colour plot and the relationship between bolometric- and radio- luminosities at L-band.
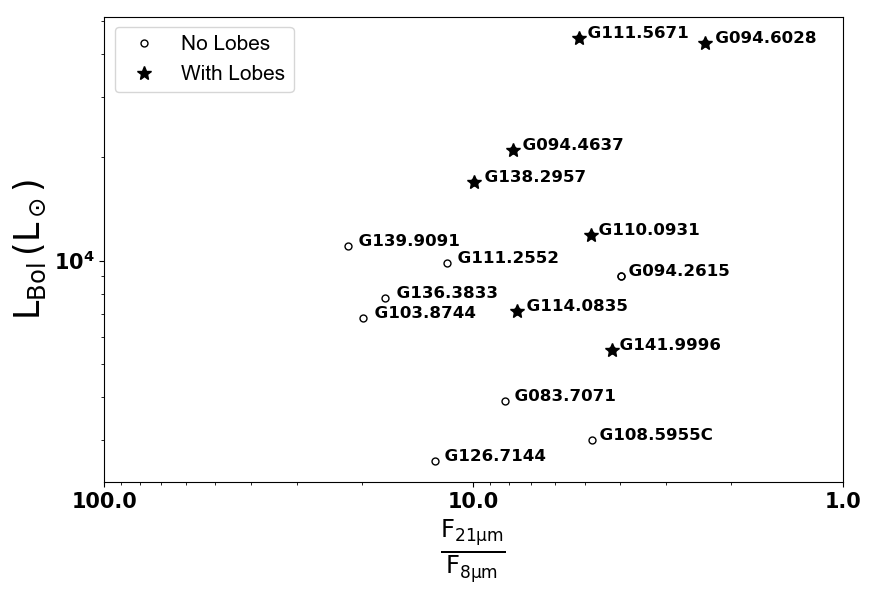
5.3.1 Relationship between Infrared colour and Bolometric luminosity
The infrared colour of young stellar objects is likely to be related to their evolution as they become bluer with age. A plot of mid-infrared colour versus bolometric luminosity of the sample, shown in Figure 4, suggests that MYSOs of higher bolometric luminosities are more likely to have lobes compared to their lower luminosity counterparts, especially at lower values of . Whether this property of the jets is related to their evolution or driving power is not clear. However, the radio luminosity of a jet is correlated with its bolometric luminosity and force (Anglada et al., 2015), implying that sources with higher bolometric luminosity are likely to have more powerful lobes that are easily detectable in the radio compared to sources of lower luminosity.
5.3.2 Relationship between L-band radio luminosity and Bolometric Luminosity
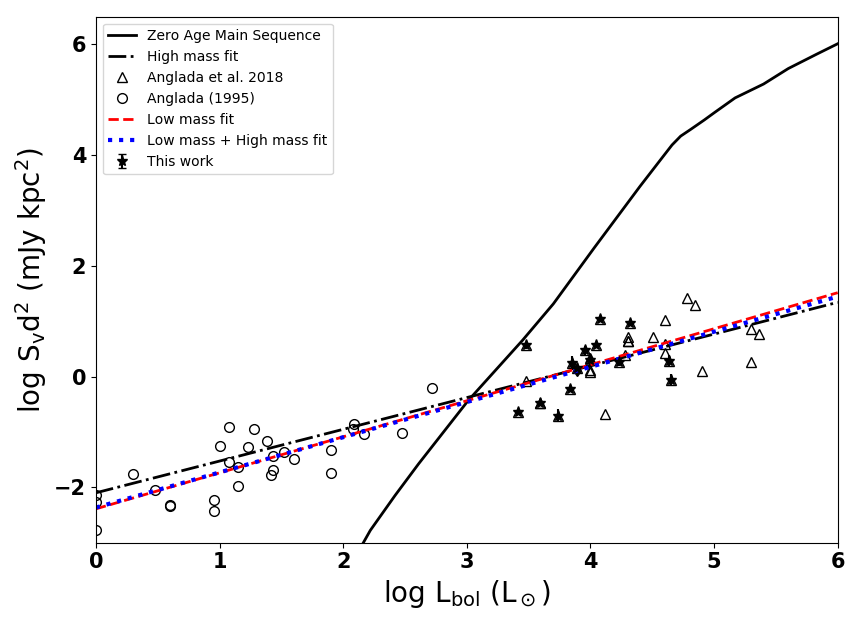
The radio luminosities of thermal radio jets show a correlation with bolometric luminosities. Different studies find the slope of the correlation to lie in the range , in a log-log plot. Cabrit & Bertout (1992) and Anglada (1995) estimated it as 0.8 and 0.6 respectively. Recently, Shirley et al. (2007) found the slope to be 0.9 and 0.7 at 5 GHz and 8.3 GHz respectively, in low mass stars. At L-band, we find a slope of . This slope is for all the objects on the plot shown in Figure 5, consisting of cores of L-band sources and thermal radio jets taken from the literature. Fluxes of the sources from the literature were scaled to L-band frequency using a spectral index of 0.6. High mass sources in the plot show a slope of , consistent with the lower end of the previous estimates i.e 0.6-0.9. In spite of the evidence of non-thermal emission at L-band, the cores are largely thermal, manifesting the properties of free-free emitters and showing no significant effect on the slope. The lower slope of high mass sources may be due to a smaller range of luminosity and uncertainties in their distances and fluxes. Clearly, the slopes are comparable to Anglada et al. (2018) who derived an empirical equation relating the two quantities at 8.3 GHz, for objects of bolometric luminosities (see equation 1):
| (1) |
The slopes, as seen in Figure 5, demonstrates the similarity between low and high mass protstellar jets, owing to the comparable radio-bolometric luminosity correlations, implying that they have a common ionization, and perhaps driving mechanism.
5.4 Derived properties of the radio jets
Quantities such as the jets’ mass loss rates, injection radius and opening angles can be estimated from the fluxes and angular sizes of their cores. Fluxes and angular sizes of the cores at L-band, together with their spectral indices, were used to calculate some of these properties in accordance with the Reynolds (1986) model.
5.4.1 Mass loss rate
Reynolds (1986) modelled free-free emission from an ionised jet. The model can be used to calculate the mass loss rate through the jet if its ionization fraction, electron temperature, terminal velocity and an inclination angle to the line of sight are known. The model estimates the mass loss rate through a conical jet of pure hydrogen, electron temperature K and inclination angle , in units of , to be:
| (2) |
where , , , , , , , , and are the derived spectral index, mean particle mass per hydrogen atom, proton mass, terminal velocity of the jet in , ionization fraction, observed flux density in mJy, frequency of observation (here L-band) in units of 10 GHz, turn-over frequency in units of 10 GHz, object’s distance in kpc and the opening angle (in radians given as , Eisloffel et al. 2000) respectively. is a quantity that depends on the opacity and spectral index of a jet given as (Reynolds, 1986):
| (3) |
where is a quantity that describes how opacity varies along the jet. was calculated using the parameters of a standard spherical jet model if the spectral index of a source lies in the range and standard collimated model if . was taken to be -3 if and -2 for . The ionization fraction of MYSO jets is determined by collisions within the jets (Bacciotti 2002, Hartigan et al. 1994, Bacciotti & Eislöffel 1999) and perhaps ionising radiation from the central source. Typical values of jet ionization fraction are to (Bacciotti 2002, Bacciotti & Eislöffel 1999), a quantity that varies along a jet in accordance with recombination models. The maximum value of ionization fraction in the literature () was used in the calculation of mass loss rate in this work as all the YSOs considered here are massive and are expected to have more powerful jets that are better collisional ionisers. Terminal velocity of jet materials (or simply jet velocity) was estimated from its range i.e. km/s in low-mass stars to km/s in high-mass stars (Anglada et al., 2015). The average velocity of optical jets is km/s (Mundt & Ray, 1994), a value comparable to Jiménez-Serra et al. (2011) and Martí et al. (1998) estimates of km/s in Cepheus A HW2 and HH 80-81 respectively. Whereas the average velocity in optical jets is km/s, a value of km/s, estimated via proper motion of a radio jet (Martí et al., 1998) was adopted as a reasonable approximation of the sample’s jets’ terminal velocity, in calculating the mass loss rate. A turn-over frequency of 50 GHz was assumed as the value is generally expected to be higher than 40 GHz (Anglada et al., 2018). Finally, a semi-opening angle of 313, the average semi-opening angle for nine sources whose angles were calculated directly, was adopted for sources whose angles could not be estimated from . The range of the calculated semi-opening angles, , is comparable to the estimate by Moscadelli et al. (2016) i.e 20.
The sample’s mass loss rates lie in the range to (see Figure 6), typical of rates from MYSO (Poetzel et al. 1993, Mundt & Ray 1994, Purser et al. 2016) and higher than low mass counterparts. Mass loss rates of the MYSOs were found to be related to their bolometric luminosity by the equation . Although low mass YSOs are expected to have lower mass loss rates (; Hartigan et al. 1995a, Konigl & Pudritz 2000, Mundt & Ray 1994), some of them have rates that are comparable with high mass ones, in effect implying that distinguishing such jets from high mass ones (Ceccarelli et al., 1997) is not straightforward.

5.4.2 Accretion rate
Stellar jet outflows are considered to be closely related to accretion inflows (Pudritz et al., 2007), therefore it is reasonable to estimate accretion rates of YSOs from their mass loss rates. Hartigan et al. (1995b) empirically established a correlation between accretion and mass loss rates of low mass stars where they demonstrated that with an average value of . Matt & Pudritz (2005) also modelled MHD jets and found that the stellar angular momentum problem in YSOs can only be solved if jet outflow rates are of accretion rates although magnetic field strength can influence the ratio. This value lies within Hartigan et al. (1995b)’s range, albeit a factor of 10 above the average.
The average value of in Hartigan et al. (1995b)’s work was therefore used in estimating accretion rates resulting in which is consistent with high rates theoretically expected from the sources i.e (McKee & Tan 2002). The accretion rate of one of the sources, G094.6028, was found to be comparable to (Pomohaci et al., 2017), derived using hydrogen Bracket gamma spectral lines.
6 Conclusions
We studied a sample of fifteen MSYOs, at least forty percent of which show evidence of non-thermal emission. Six of the sources; G094.6028, G103.8744, G111.5671, G114.0835, G138.2957 and G141.9996, manifest non-thermal radio lobes, similar to those seen in HH objects. The study, therefore, suggests that massive stars form via accretion disks in a manner similar to low mass stars but with high accretion rates.
All the MYSOs have thermal central sources which are considered the drivers of the jets. The average spectral index of the thermal sources is , clearly similar to the theoretical 0.6, expected from ionized winds. They drive the jets at a rate higher than low mass counterparts with mass loss rates to .
Clearly, lobes of some MYSO jets confirm the presence of synchrotron emission, implying the presence of magnetic fields and charged particles at relativistic velocities. This finding suggests that magnetic fields play a significant role in the jets, perhaps in driving them from the core (Blandford & Payne 1982, Shu et al. 1994). However, a thermal jet can also interact with ambient magnetic field producing non-thermal emission. A study of 46 young MYSOs by Purser et al. (2016) also found that about of the sample may be associated with non-thermal lobes, again emphasising the significance of magnetic fields in jets of massive protostars.
It was also found that sources of higher bolometric luminosity are more likely to have lobes compared to lower luminosity counterparts and that some of them may be variable.
Acknowledgements
WOO gratefully acknowledges the studentship funded by the UK’s Science and Technology Facilities Council (STFC) through the DARA project, grant number ST/M007693/1. We also thank the referees for their very helpful suggestions.
References
- Anglada (1995) Anglada, G. 1995, in Revista Mexicana de Astronomia y Astrofisica Conference Series, Vol. 1, Revista Mexicana de Astronomia y Astrofisica Conference Series, ed. S. Lizano & J. M. Torrelles, 67
- Anglada et al. (2015) Anglada, G., Rodríguez, L. F., & Carrasco-Gonzalez, C. 2015, Proceedings of science, 121
- Anglada et al. (2018) Anglada, G., Rodríguez, L. F., & Carrasco-González, C. 2018, A&A Rev., 26, 3
- Bacciotti (2002) Bacciotti, F. 2002, in Revista Mexicana de Astronomia y Astrofisica Conference Series, Vol. 13, Revista Mexicana de Astronomia y Astrofisica Conference Series, ed. W. J. Henney, W. Steffen, L. Binette, & A. Raga, 8–15
- Bacciotti & Eislöffel (1999) Bacciotti, F. & Eislöffel, J. 1999, A&A, 342, 717
- Banerjee & Pudritz (2007) Banerjee, R. & Pudritz, R. E. 2007, ApJ, 660, 479
- Bell (1978) Bell, A. R. 1978, MNRAS, 182, 147
- Blandford & Eichler (1987) Blandford, R. & Eichler, D. 1987, Phys. Rep., 154, 1
- Blandford & Payne (1982) Blandford, R. D. & Payne, D. G. 1982, MNRAS, 199, 883
- Briggs (1995) Briggs, D. S. 1995, in Bulletin of the American Astronomical Society, Vol. 27, American Astronomical Society Meeting Abstracts, 1444
- Brooks et al. (2003) Brooks, K. J., Garay, G., Mardones, D., & Bronfman, L. 2003, ApJ, 594, L131
- Cabrit & Bertout (1992) Cabrit, S. & Bertout, C. 1992, A&A, 261, 274
- Caratti o Garatti et al. (2016) Caratti o Garatti, A., Stecklum, B., Weigelt, G., Schertl, D., Hofmann, K.-H., Kraus, S., Oudmaijer, R. D., de Wit, W. J., Sanna, A., Garcia Lopez, R., Kreplin, A., & Ray, T. P. 2016, A&A, 589, L4
- Carral et al. (1999) Carral, P., Kurtz, S., Rodríguez, L. F., Martí, J., Lizano, S., & Osorio, M. 1999, RMxAA, 35, 97
- Carrasco-González et al. (2010) Carrasco-González, C., Rodríguez, L. F., Anglada, G., Martí, J., Torrelles, J. M., & Osorio, M. 2010, Science, 330, 1209
- Carrasco-González et al. (2013) Carrasco-González, C., Rodríguez, L. F., Anglada, G., Martí, J., Torrelles, J. M., & Osorio, M. 2013, in European Physical Journal Web of Conferences, Vol. 61, European Physical Journal Web of Conferences, 03003
- Carrasco-González et al. (2015) Carrasco-González, C., Torrelles, J. M., Cantó, J., Curiel, S., Surcis, G., Vlemmings, W. H. T., van Langevelde, H. J., Goddi, C., Anglada, G., Kim, S.-W., Kim, J.-S., & Gómez, J. F. 2015, Science, 348, 114
- Casali et al. (2007) Casali, M., Adamson, A., Alves de Oliveira, C., Almaini, O., Burch, K., Chuter, T., Elliot, J., Folger, M., Foucaud, S., Hambly, N., Hastie, M., Henry, D., Hirst, P., Irwin, M., Ives, D., Lawrence, A., Laidlaw, K., Lee, D., Lewis, J., Lunney, D., McLay, S., Montgomery, D., Pickup, A., Read, M., Rees, N., Robson, I., Sekiguchi, K., Vick, A., Warren, S., & Woodward, B. 2007, A&A, 467, 777
- Ceccarelli et al. (1997) Ceccarelli, C., Haas, M. R., Hollenbach, D. J., & Rudolph, A. L. 1997, ApJ, 476, 771
- Cesaroni et al. (2018) Cesaroni, R., Moscadelli, L., Neri, R., Sanna, A., Caratti o Garatti, A., Eisloffel, J., Stecklum, B., Ray, T., & Walmsley, C. M. 2018, A&A, 612, A103
- Clarke et al. (2006) Clarke, A. J., Lumsden, S. L., Oudmaijer, R. D., Busfield, A. L., Hoare, M. G., Moore, T. J. T., Sheret, T. L., & Urquhart, J. S. 2006, A&A, 457, 183
- Cohen (1977) Cohen, M. 1977, ApJ, 215, 533
- Curiel et al. (2006) Curiel, S., Ho, P. T. P., Patel, N. A., Torrelles, J. M., Rodríguez, L. F., Trinidad, M. A., Cantó, J., Hernández, L., Gómez, J. F., Garay, G., & Anglada, G. 2006, ApJ, 638, 878
- Davis et al. (1998) Davis, C. J., Moriarty-Schieven, G., Eislöffel, J., Hoare, M. G., & Ray, T. P. 1998, AJ, 115, 1118
- De Buizer et al. (2005) De Buizer, J. M., Radomski, J. T., Telesco, C. M., & Piña, R. K. 2005, ApJS, 156, 179
- de Gouveia Dal Pino (2005) de Gouveia Dal Pino, E. M. 2005, Advances in Space Research, 35, 908
- de Wit et al. (2009) de Wit, W. J., Hoare, M. G., Fujiyoshi, T., Oudmaijer, R. D., Honda, M., Kataza, H., Miyata, T., Okamoto, Y. K., Onaka, T., Sako, S., & Yamashita, T. 2009, A&A, 494, 157
- DeSouza & Basu (2015) DeSouza, A. L. & Basu, S. 2015, MNRAS, 450, 295
- Di Francesco et al. (1997) Di Francesco, J., Evans, II, N. J., Harvey, P. M., Mundy, L. G., Guilloteau, S., & Chandler, C. J. 1997, ApJ, 482, 433
- Dobashi & Uehara (2001) Dobashi, K. & Uehara, H. 2001, PASJ, 53, 799
- Eisloffel et al. (2000) Eisloffel, J., Mundt, R., Ray, T. P., & Rodriguez, L. F. 2000, Protostars and Planets IV, 815
- Eisner et al. (2015) Eisner, J. A., Rieke, G. H., Rieke, M. J., Flaherty, K. M., Stone, J. M., Arnold, T. J., Cortes, S. R., Cox, E., Hawkins, C., Cole, A., Zajac, S., & Rudolph, A. L. 2015, MNRAS, 447, 202
- Fontani et al. (2004) Fontani, F., Cesaroni, R., Testi, L., Molinari, S., Zhang, Q., Brand, J., & Walmsley, C. M. 2004, A&A, 424, 179
- Gomez et al. (1992) Gomez, J. F., Torrelles, J. M., Estalella, R., Anglada, G., Verdes-Montenegro, L., & Ho, P. T. P. 1992, ApJ, 397, 492
- Guzmán et al. (2010) Guzmán, A. E., Garay, G., & Brooks, K. J. 2010, ApJ, 725, 734
- Guzmán et al. (2012) Guzmán, A. E., Garay, G., Brooks, K. J., & Voronkov, M. A. 2012, ApJ, 753, 51
- Hamann & Persson (1989) Hamann, F. & Persson, S. E. 1989, ApJ, 339, 1078
- Hartigan et al. (1995a) Hartigan, P., Edwards, S., & Ghandour, L. 1995a, in Revista Mexicana de Astronomia y Astrofisica, vol. 27, Vol. 3, Revista Mexicana de Astronomia y Astrofisica Conference Series, ed. M. Pena & S. Kurtz, 93
- Hartigan et al. (1995b) Hartigan, P., Edwards, S., & Ghandour, L. 1995b, ApJ, 452, 736
- Hartigan et al. (1994) Hartigan, P., Morse, J. A., & Raymond, J. 1994, ApJ, 436, 125
- Hewett et al. (2006) Hewett, P. C., Warren, S. J., Leggett, S. K., & Hodgkin, S. T. 2006, MNRAS, 367, 454
- Hoare (2006) Hoare, M. G. 2006, ApJ, 649, 856
- Jiang et al. (2001) Jiang, Z., Yao, Y., Yang, J., Ishii, M., Nagata, T., Nakaya, H., & Sato, S. 2001, AJ, 122, 313
- Jiménez-Serra et al. (2011) Jiménez-Serra, I., Martín-Pintado, J., Báez-Rubio, A., Patel, N., & Thum, C. 2011, ApJ, 732, L27
- Konigl & Pudritz (2000) Konigl, A. & Pudritz, R. E. 2000, Protostars and Planets IV, 759
- Kraus et al. (2010) Kraus, S., Hofmann, K.-H., Menten, K. M., Schertl, D., Weigelt, G., Wyrowski, F., Meilland, A., Perraut, K., Petrov, R., Robbe-Dubois, S., Schilke, P., & Testi, L. 2010, Nature, 466, 339
- Kuiper et al. (2014) Kuiper, R., Klahr, H., Beuther, H., & Henning, T. 2014, in Astrophysics and Space Science Proceedings, Vol. 36, The Labyrinth of Star Formation, ed. D. Stamatellos, S. Goodwin, & D. Ward-Thompson, 379
- Kuiper et al. (2015) Kuiper, R., Yorke, H. W., & Turner, N. J. 2015, ApJ, 800, 86
- Kumar et al. (2002) Kumar, M. S. N., Bachiller, R., & Davis, C. J. 2002, ApJ, 576, 313
- Kumar Dewangan & Anandarao (2010) Kumar Dewangan, L. & Anandarao, B. G. 2010, MNRAS, 402, 2583
- Kurtz et al. (1994) Kurtz, S., Churchwell, E., & Wood, D. O. S. 1994, ApJS, 91, 659
- Lawrence et al. (2007) Lawrence, A., Warren, S. J., Almaini, O., Edge, A. C., Hambly, N. C., Jameson, R. F., Lucas, P., Casali, M., Adamson, A., Dye, S., Emerson, J. P., Foucaud, S., Hewett, P., Hirst, P., Hodgkin, S. T., Irwin, M. J., Lodieu, N., McMahon, R. G., Simpson, C., Smail, I., Mortlock, D., & Folger, M. 2007, MNRAS, 379, 1599
- Levshakov et al. (2013) Levshakov, S. A., Henkel, C., Reimers, D., Wang, M., Mao, R., Wang, H., & Xu, Y. 2013, A&A, 553, A58
- López-Cámara & Raga (2010) López-Cámara, D. & Raga, A. C. 2010, ApJ, 723, 449
- Lu et al. (2014) Lu, X., Zhang, Q., Liu, H. B., Wang, J., & Gu, Q. 2014, ApJ, 790, 84
- Lucas et al. (2008) Lucas, P. W., Hoare, M. G., Longmore, A., Schröder, A. C., Davis, C. J., Adamson, A., Bandyopadhyay, R. M., de Grijs, R., Smith, M., Gosling, A., Mitchison, S., Gáspár, A., Coe, M., Tamura, M., Parker, Q., Irwin, M., Hambly, N., Bryant, J., Collins, R. S., Cross, N., Evans, D. W., Gonzalez-Solares, E., Hodgkin, S., Lewis, J., Read, M., Riello, M., Sutorius, E. T. W., Lawrence, A., Drew, J. E., Dye, S., & Thompson, M. A. 2008, MNRAS, 391, 136
- Lumsden et al. (2013) Lumsden, S. L., Hoare, M. G., Urquhart, J. S., Oudmaijer, R. D., Davies, B., Mottram, J. C., Cooper, H. D. B., & Moore, T. J. T. 2013, ApJS, 208, 11
- Manjarrez et al. (2012) Manjarrez, G., Gómez, J. F., & de Gregorio-Monsalvo, I. 2012, MNRAS, 419, 3338
- Martí et al. (1998) Martí, J., Rodríguez, L. F., & Reipurth, B. 1998, ApJ, 502, 337
- Matt & Pudritz (2005) Matt, S. & Pudritz, R. E. 2005, MNRAS, 356, 167
- McKee & Tan (2002) McKee, C. F. & Tan, J. C. 2002, Nature, 416, 59
- McMullin et al. (2007) McMullin, J. P., Waters, B., Schiebel, D., Young, W., & Golap, K. 2007, in Astronomical Society of the Pacific Conference Series, Vol. 376, Astronomical Data Analysis Software and Systems XVI, ed. R. A. Shaw, F. Hill, & D. J. Bell, 127
- Meyer et al. (2017) Meyer, D. M.-A., Vorobyov, E. I., Kuiper, R., & Kley, W. 2017, MNRAS, 464, L90
- Mitchell & Hasegawa (1991) Mitchell, G. F. & Hasegawa, T. I. 1991, ApJ, 371, L33
- Mitchell et al. (1995) Mitchell, G. F., Lee, S. W., Maillard, J.-P., Matthews, H., Hasegawa, T. I., & Harris, A. I. 1995, ApJ, 438, 794
- Moscadelli et al. (2016) Moscadelli, L., Sánchez-Monge, Á., Goddi, C., Li, J. J., Sanna, A., Cesaroni, R., Pestalozzi, M., Molinari, S., & Reid, M. J. 2016, A&A, 585, A71
- Mundt & Ray (1994) Mundt, R. & Ray, T. P. 1994, in Astronomical Society of the Pacific Conference Series, Vol. 62, The Nature and Evolutionary Status of Herbig Ae/Be Stars, ed. P. S. The, M. R. Perez, & E. P. J. van den Heuvel, 237
- Navarete et al. (2015) Navarete, F., Damineli, A., Barbosa, C. L., & Blum, R. D. 2015, MNRAS, 450, 4364
- Poetzel et al. (1993) Poetzel, R., Mundt, R., & Ray, T. P. 1993, in Astrophysics and Space Science Library, Vol. 186, Stellar Jets and Bipolar Outflows, ed. L. Errico & A. A. Vittone, 231
- Pomohaci et al. (2017) Pomohaci, R., Oudmaijer, R. D., Lumsden, S. L., Hoare, M. G., & Mendigutía, I. 2017, MNRAS, 472, 3624
- Pudritz & Banerjee (2005) Pudritz, R. E. & Banerjee, R. 2005, in IAU Symposium, Vol. 227, Massive Star Birth: A Crossroads of Astrophysics, ed. R. Cesaroni, M. Felli, E. Churchwell, & M. Walmsley, 163–173
- Pudritz & Norman (1986) Pudritz, R. E. & Norman, C. A. 1986, ApJ, 301, 571
- Pudritz et al. (2007) Pudritz, R. E., Ouyed, R., Fendt, C., & Brandenburg, A. 2007, Protostars and Planets V, 277
- Purser (2017) Purser, S. J. D. 2017, PhD thesis, University of Leeds
- Purser et al. (2016) Purser, S. J. D., Lumsden, S. L., Hoare, M. G., Urquhart, J. S., Cunningham, N., Purcell, C. R., Brooks, K. J., Garay, G., Gúzman, A. E., & Voronkov, M. A. 2016, MNRAS, 460, 1039
- Raga et al. (1993) Raga, A. C., Kofman, L., & Falle, S. A. E. G. 1993, in Astrophysics and Space Science Library, Vol. 186, Stellar Jets and Bipolar Outflows, ed. L. Errico & A. A. Vittone, 301
- Ray et al. (1990) Ray, T. P., Poetzel, R., Solf, J., & Mundt, R. 1990, ApJ, 357, L45
- Reipurth & Bally (2001) Reipurth, B. & Bally, J. 2001, ARA&A, 39, 403
- Rengarajan & Ho (1996) Rengarajan, T. N. & Ho, P. T. P. 1996, ApJ, 465, 363
- Reynolds (1986) Reynolds, S. P. 1986, ApJ, 304, 713
- Rodríguez et al. (2012) Rodríguez, T., Trinidad, M. A., & Migenes, V. 2012, ApJ, 755, 100
- Rodríguez-Kamenetzky et al. (2017) Rodríguez-Kamenetzky, A., Carrasco-González, C., Araudo, A., Romero, G. E., Torrelles, J. M., Rodríguez, L. F., Anglada, G., Martí, J., Perucho, M., & Valotto, C. 2017, ApJ, 851, 16
- Rodríguez-Kamenetzky et al. (2016) Rodríguez-Kamenetzky, A., Carrasco-González, C., Araudo, A., Torrelles, J. M., Anglada, G., Martí, J., Rodríguez, L. F., & Valotto, C. 2016, ApJ, 818, 27
- Rosero et al. (2016) Rosero, V., Hofner, P., Claussen, M., Kurtz, S., Cesaroni, R., Araya, E. D., Carrasco-González, C., Rodríguez, L. F., Menten, K. M., Wyrowski, F., Loinard, L., & Ellingsen, S. P. 2016, ApJS, 227, 25
- Rubini et al. (2007) Rubini, F., Lorusso, S., Del Zanna, L., & Bacciotti, F. 2007, A&A, 472, 855
- Sánchez-Monge et al. (2008) Sánchez-Monge, Á., Palau, A., Estalella, R., Beltrán, M. T., & Girart, J. M. 2008, A&A, 485, 497
- Sandell et al. (2005) Sandell, G., Goss, W. M., & Wright, M. 2005, ApJ, 621, 839
- Sanna et al. (2018) Sanna, A., Koelligan, A., Moscadelli, L., Kuiper, R., Cesaroni, R., Pillai, T., Menten, K. M., Zhang, Q., Garatti, A. C. o., Goddi, C., Leurini, S., & Carrasco-Gonzalez, C. 2018, ArXiv e-prints
- Schreyer et al. (2002) Schreyer, K., Henning, T., van der Tak, F. F. S., Boonman, A. M. S., & van Dishoeck, E. F. 2002, A&A, 394, 561
- Schulz et al. (1989) Schulz, A., Black, J. H., Lada, C. J., Ulich, B. L., Martin, R. N., Snell, R. L., & Erickson, N. J. 1989, ApJ, 341, 288
- Shirley et al. (2007) Shirley, Y. L., Claussen, M. J., Bourke, T. L., Young, C. H., & Blake, G. A. 2007, ApJ, 667, 329
- Shu et al. (1994) Shu, F. H., Najita, J., Ruden, S. P., & Lizano, S. 1994, ApJ, 429, 797
- Skrutskie et al. (2006) Skrutskie, M. F., Cutri, R. M., Stiening, R., Weinberg, M. D., Schneider, S., Carpenter, J. M., Beichman, C., Capps, R., Chester, T., Elias, J., Huchra, J., Liebert, J., Lonsdale, C., Monet, D. G., Price, S., Seitzer, P., Jarrett, T., Kirkpatrick, J. D., Gizis, J. E., Howard, E., Evans, T., Fowler, J., Fullmer, L., Hurt, R., Light, R., Kopan, E. L., Marsh, K. A., McCallon, H. L., Tam, R., Van Dyk, S., & Wheelock, S. 2006, AJ, 131, 1163
- Smith & Fischer (1992) Smith, H. A. & Fischer, J. 1992, ApJ, 398, L99
- Tofani et al. (1995) Tofani, G., Felli, M., Taylor, G. B., & Hunter, T. R. 1995, A&AS, 112, 299
- Trinidad et al. (2006) Trinidad, M. A., Curiel, S., Torrelles, J. M., Rodríguez, L. F., Migenes, V., & Patel, N. 2006, AJ, 132, 1918
- Urquhart et al. (2011) Urquhart, J. S., Morgan, L. K., Figura, C. C., Moore, T. J. T., Lumsden, S. L., Hoare, M. G., Oudmaijer, R. D., Mottram, J. C., Davies, B., & Dunham, M. K. 2011, MNRAS, 418, 1689
- Vaidya et al. (2009) Vaidya, B., Fendt, C., & Beuther, H. 2009, ApJ, 702, 567
- van der Tak & Menten (2005) van der Tak, F. F. S. & Menten, K. M. 2005, A&A, 437, 947
- Varricatt et al. (2010) Varricatt, W. P., Davis, C. J., Ramsay, S., & Todd, S. P. 2010, MNRAS, 404, 661
- Velusamy et al. (2007) Velusamy, T., Langer, W. D., & Marsh, K. A. 2007, ApJ, 668, L159
- Vig et al. (2018) Vig, S., Veena, V. S., Mandal, S., Tej, A., & Ghosh, S. K. 2018, MNRAS, 474, 3808
- Wang et al. (2012) Wang, K.-S., van der Tak, F. F. S., & Hogerheijde, M. R. 2012, A&A, 543, A22
- Wang et al. (2016) Wang, Y., Audard, M., Fontani, F., Sánchez-Monge, Á., Busquet, G., Palau, A., Beuther, H., Tan, J. C., Estalella, R., Isella, A., Gueth, F., & Jiménez-Serra, I. 2016, A&A, 587, A69
- Wolf-Chase et al. (2017) Wolf-Chase, G., Arvidsson, K., & Smutko, M. 2017, ApJ, 844, 38
- Wouterloot et al. (1989) Wouterloot, J. G. A., Henkel, C., & Walmsley, C. M. 1989, A&A, 215, 131
- Wu et al. (2009) Wu, Y.-W., Xu, Y., Yang, J., & Li, J.-J. 2009, Research in Astronomy and Astrophysics, 9, 1343
- Xu & Wang (2010) Xu, J.-L. & Wang, J.-J. 2010, Research in Astronomy and Astrophysics, 10, 151
Appendix A Discussion of individual objects
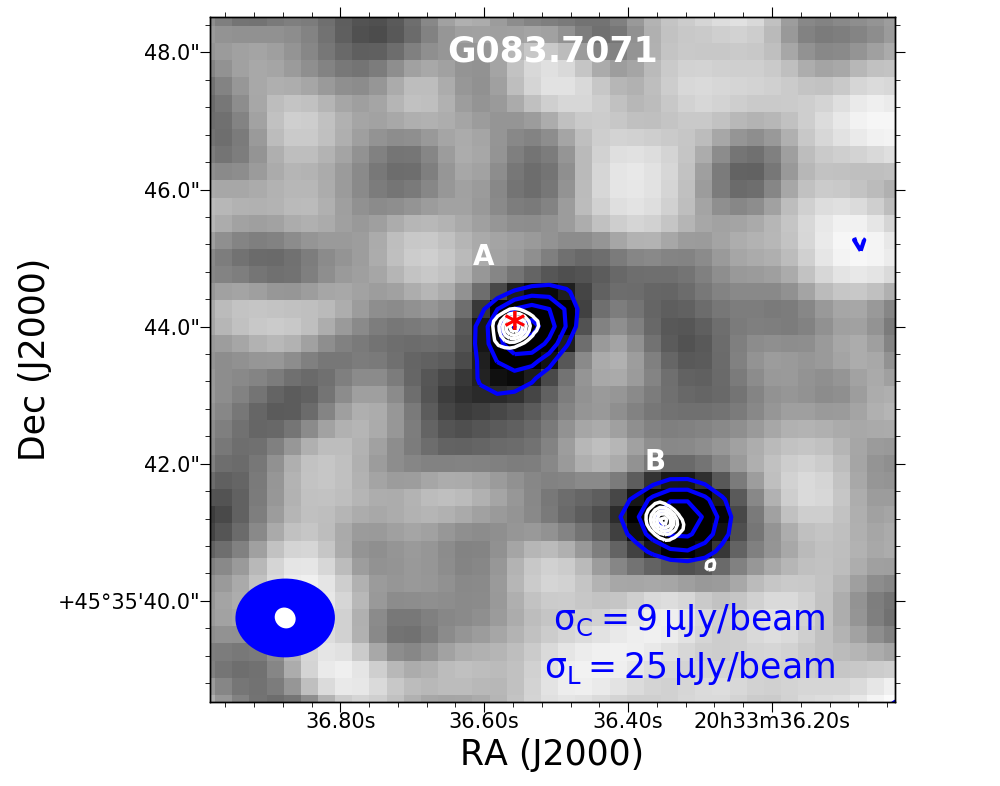
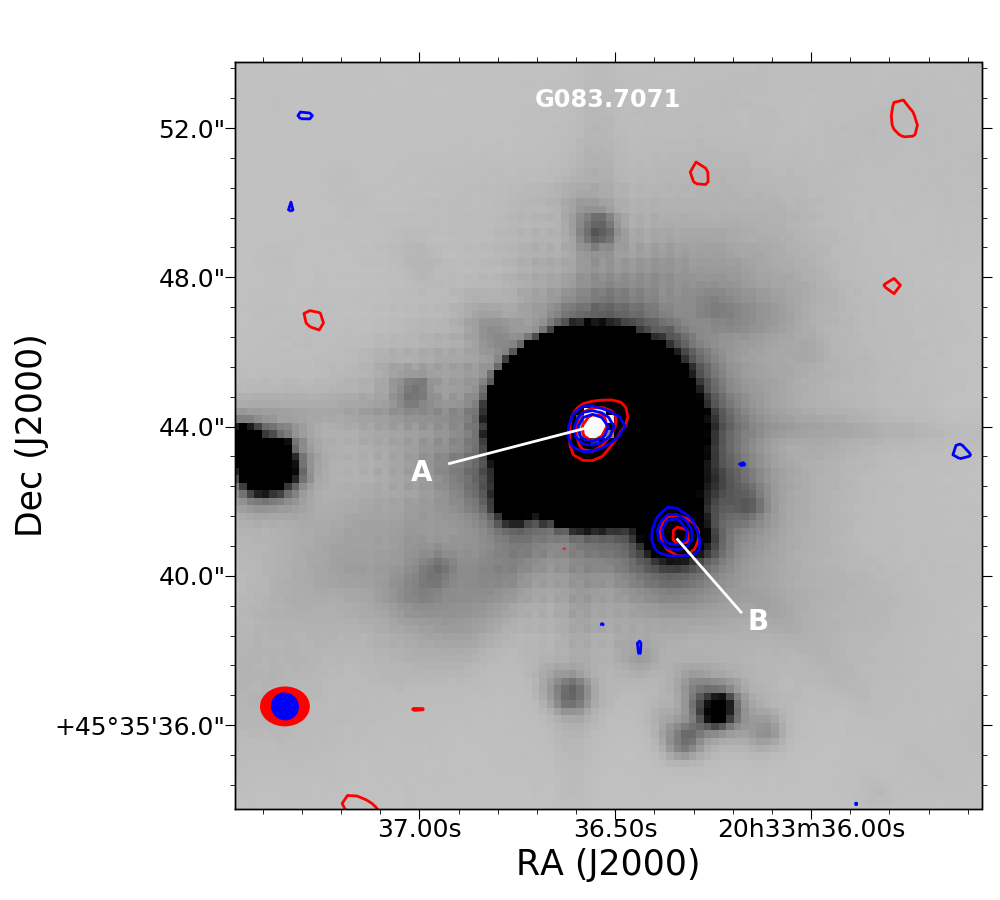
A.1 G083.7071
Two sources, A and B were detected in the field (see Figure 7). Source A whose spectral index 0.440.10 is the MYSO. The L-band emission of A is elongated, perhaps signifying presence of a jet. Apart from the MYSO, source B, located to the SW of A was also detected in the field. This source was detected in UKIDSS’s IR K band just like A but not at Q-band where the rms noise Jy/beam. It is a thermal radio source of L-C spectral index , perhaps another MYSO.
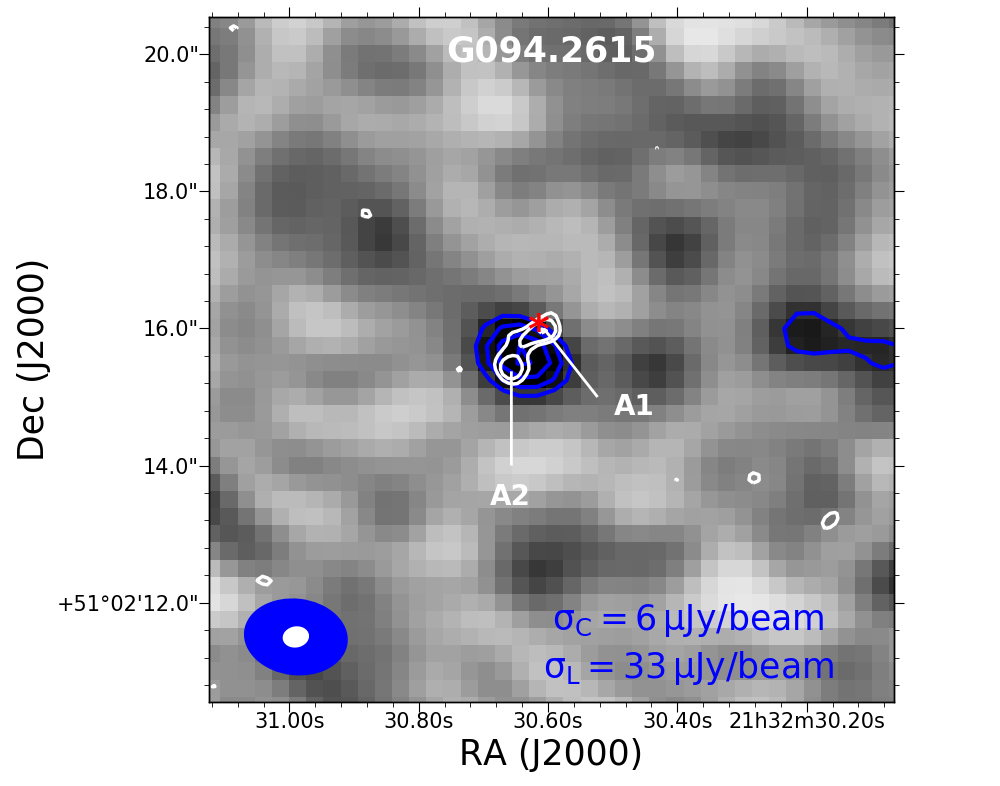
A.2 G094.2615
G094.2615 is made up of two sources, A1 and A2 (Purser et al 2019 in prep), clearly seen in the C-band map of high resolution (see Figure 1). Its L-C band spectral index is lower than that of C-Q band which could be due to non-thermal contribution at L even-though the overall spectral index shows that it is thermal i.e . A1 was detected at both C- and Q bands giving it a C-Q spectral index of 0.470.24, consistent with the MYSO core. UKIDSS map of the field (Figure 8) shows emission that is largely aligned in a SE-NW direction similar to that of C-band. The UKIDSS emission, 2.12 m H2 line emission (Wolf-Chase et al. 2017, Varricatt et al. 2010) and CO molecular outflow (Fontani et al., 2004) all points to a source that drives a jet in a SE-NW direction. There is also a NIR emission to the west of the MYSO but its source is unclear.
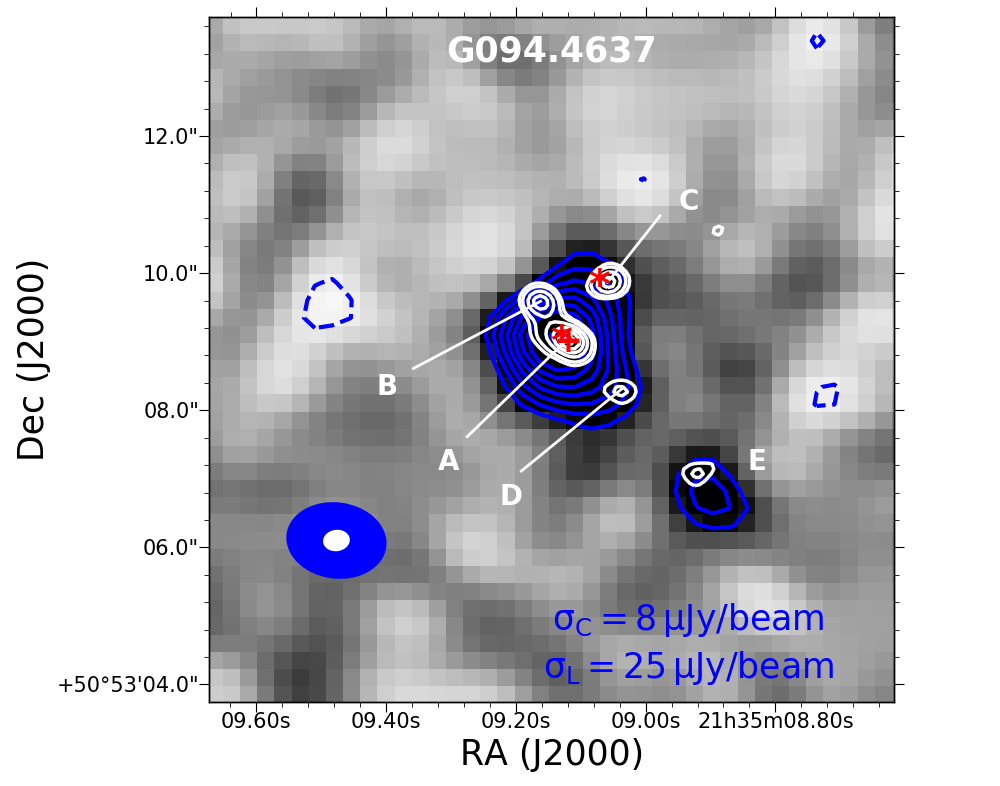
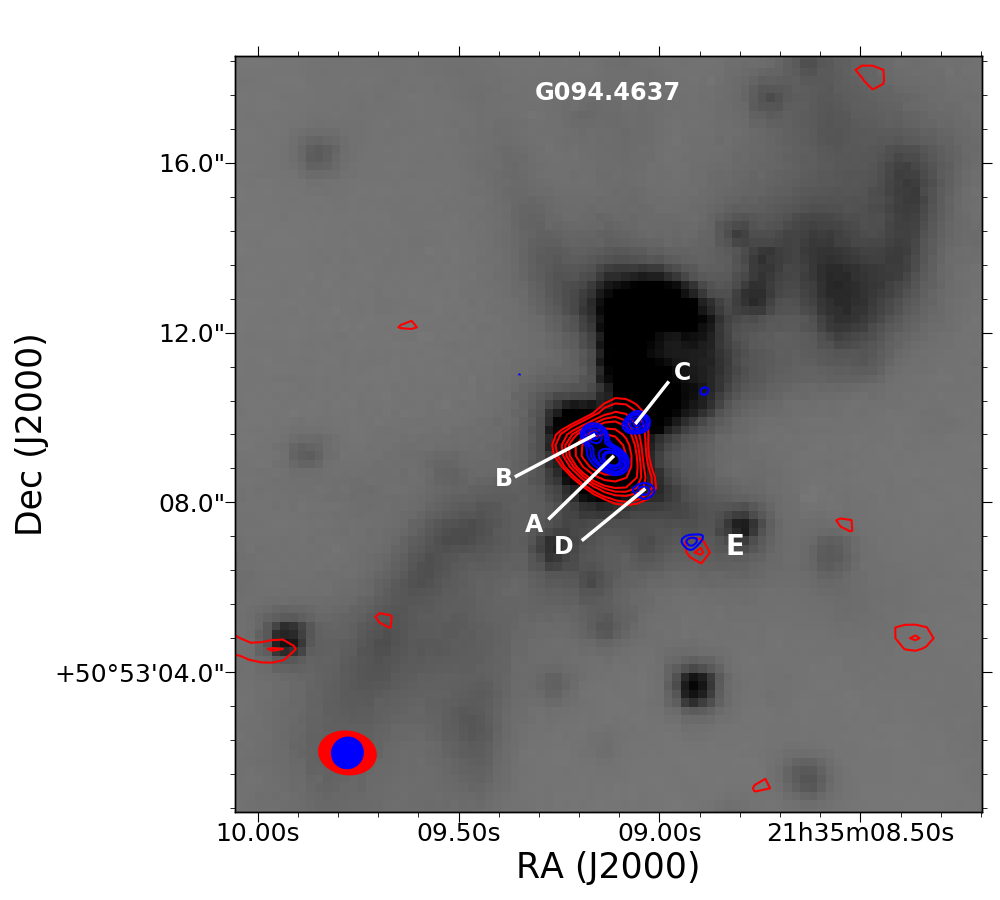
A.3 G094.4637
Two sources, G094.4637(A+B+C+D) and a lobe (source E), of spectral indices 0.530.09 and 0.210.45 respectively were detected at L-band. The spectral index of G094.4637(A+B+C+D) suggests that it is thermal but one of its component, D show non-thermal property (Figure 3). Lobe E is aligned with components A, B and D in such a way that they exhibit a central thermal core and associated jet lobes. Its C- and L-band emission are slightly offset in a NE-SW direction, similar to that of the outflow, consequently giving it a non-thermal property towards the SW where L-band emission is stronger and a thermal characteristic towards the NE. The displacement of its L-band emission is consistent with that of a jet originating from A and directed towards E.
Of the four sources, only A appears to be the core given its proximity to the IR source. Again, it is the only source in the group that was detected at Q-band (Purser, 2017) where it splits into two thermal sources, A and A2 of C-Q band spectral indices 0.390.12 and 1.470.17, suggesting that it is a binary and A or A2 drives the jet. The morphology of L-band emission as well as the alignment of the sources in C-band also suggests presence of a jet. The results of Smith & Fischer (1992) and Navarete et al. (2015) indicate the presence of multiple jets. Navarete et al. (2015), for example, detected a monopolar and two bipolar outflows in the field. Two of their outflows, 2a and 3a, have position angles that are comparable to the position angles of D and C from the location of the IR source i.e 210o and 330o respectively. Despite the evidence of multiple outflows in the field, the driving sources are not clear from both L- and C-band emission. Source C, detected at Q-band (Purser, 2017) may also be a thermal core. Its C-Q band spectral index is . The source is located at a position angle of from A and is aligned with the main K-band NIR emission (Figure 9) hence is a potential thermal core. A 12.5 m image of the field also display two sources 333, possibly A and C, aligned in a SE-NW direction, confirming that there are two cores.
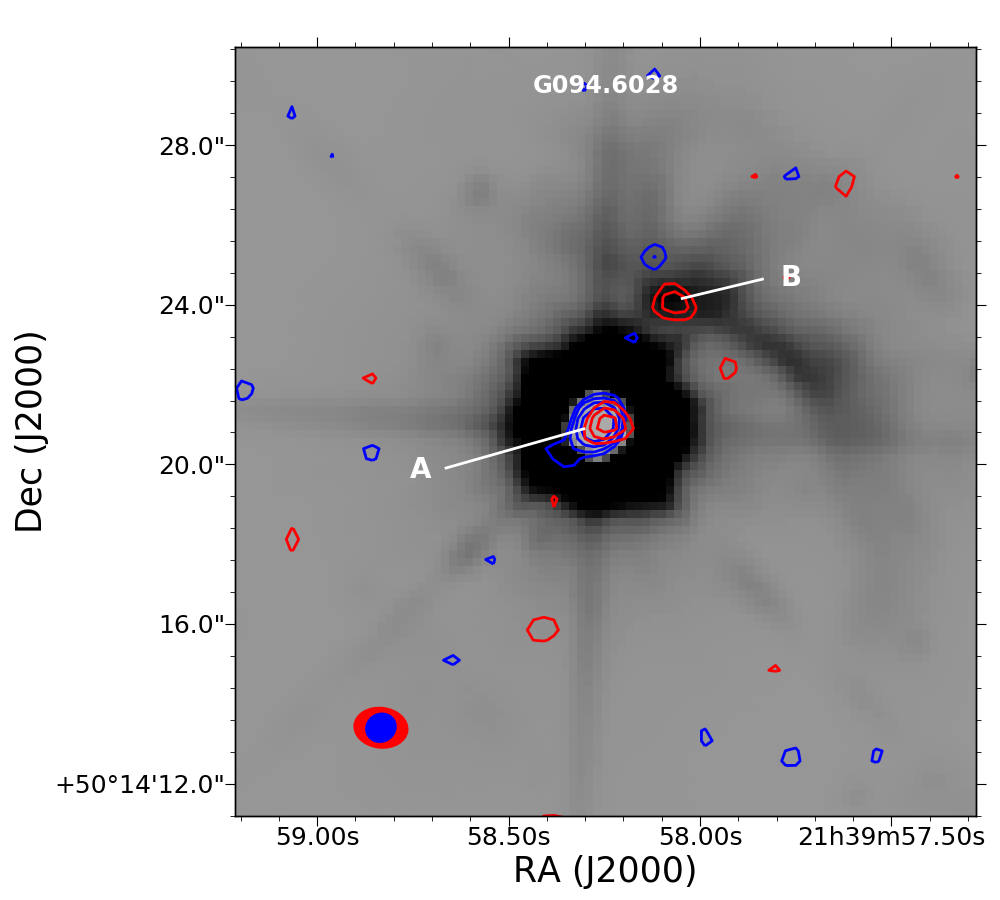
A.4 G094.6028
G094.6028, also known as V645 Cyg, has a thermal radio core of spectral index 0.440.15. The source, named A is a known variable protostar of spectral type O7 - O9 (Cohen, 1977). Earlier observation of the source by Di Francesco et al. (1997) at 8.3 GHz registered a higher flux, perhaps confirming its variability (Clarke et al., 2006). Apart from the MYSO, a nearby source, B, of flux density 0.070.02 mJy was also detected away to the NW at L- but not C-band. It appears to be a non-thermal lobe of spectral index . The MYSO is known to emit Br, accrete material, drive bipolar CO outflow and harbour a circumstellar disk (Eisner et al. 2015, Hamann & Persson 1989, Clarke et al. 2006, Schulz et al. 1989).
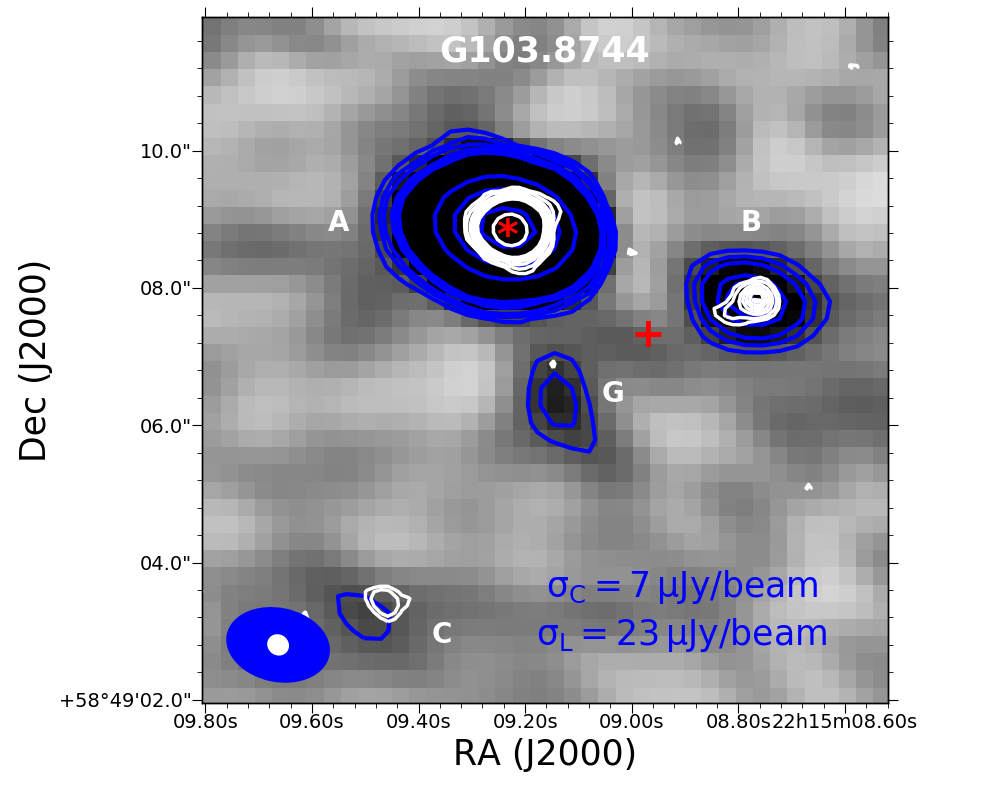
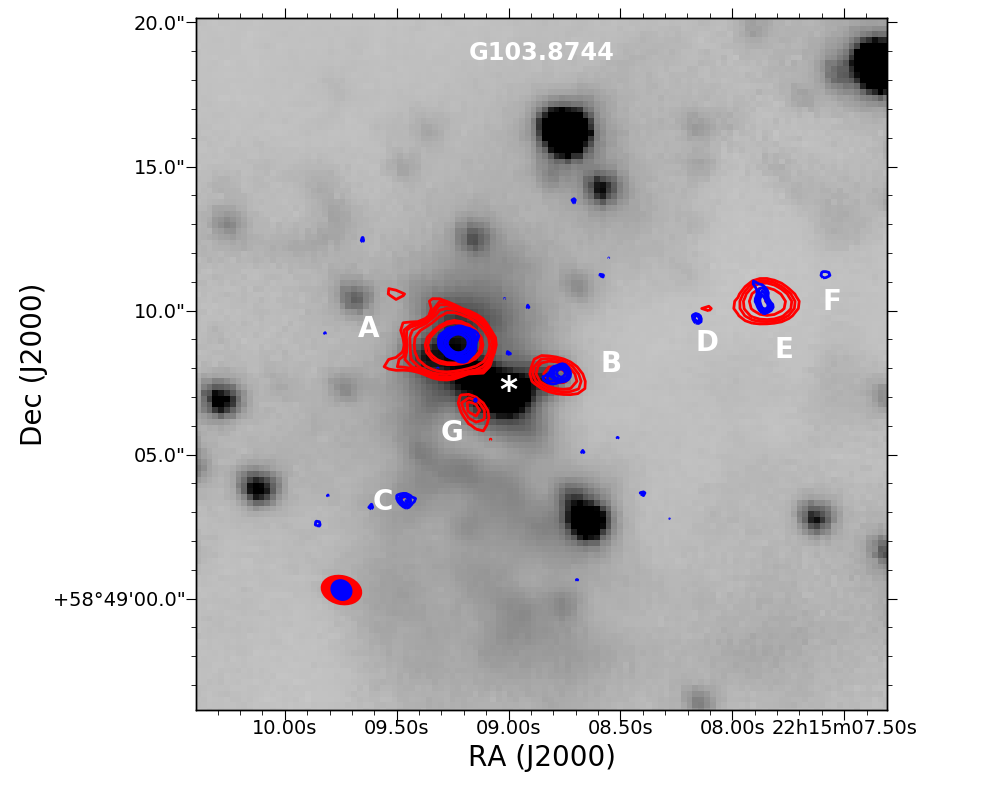
A.5 G103.8744
G103.8744 is associated with the IRAS source 22134+5834. It has five radio sources in its field, three of which are within a radius of from the location of the IR source (white asterisk in Figure 11). Both A and B are thermal and are close to the location of the MYSO but their spectra suggests that they are HII-regions (see Figure 12; spectrum of G103.8744-B). Indeed, A is a known ultra-compact HII-region (Wang et al., 2016) whose turn-over frequency seems to lie between 5 and 8.3 GHz (see Figure 2). B has a fainter but compact IR counterpart suggesting that it is a source, perhaps a low mass YSO or an obscured massive protostar. Source G, on the other hand was not detected at C-band where rms noise is 15 Jy/beam implying that it is a non-thermal radio source whose spectral index is 0.44.
Seeing that B has an IR counterpart and sources B, D, E, F and G are all aligned in a SE-NW direction, reminiscent of jet lobes, B could be the jet driver. Wang et al. (2016) imaged the source at radio frequencies but could not separate the MYSO from the HII region. They estimated a combined flux for the sources as 2.10.2 mJy, 3.50.11 mJy and 2.90.70 mJy at 1.3 cm, 6.0 cm and 20 cm respectively. These fluxes were also used in generating the spectrum of source A as it is the dominant emitter in the field. A map of emission line at 2.12m does not reveal any clear evidence of shocks or photo-dissociation locations (Kumar et al., 2002), however its map displays an outflow (Dobashi & Uehara, 2001) in a direction similar to that of the IR emission i.e a position angle PA45o.

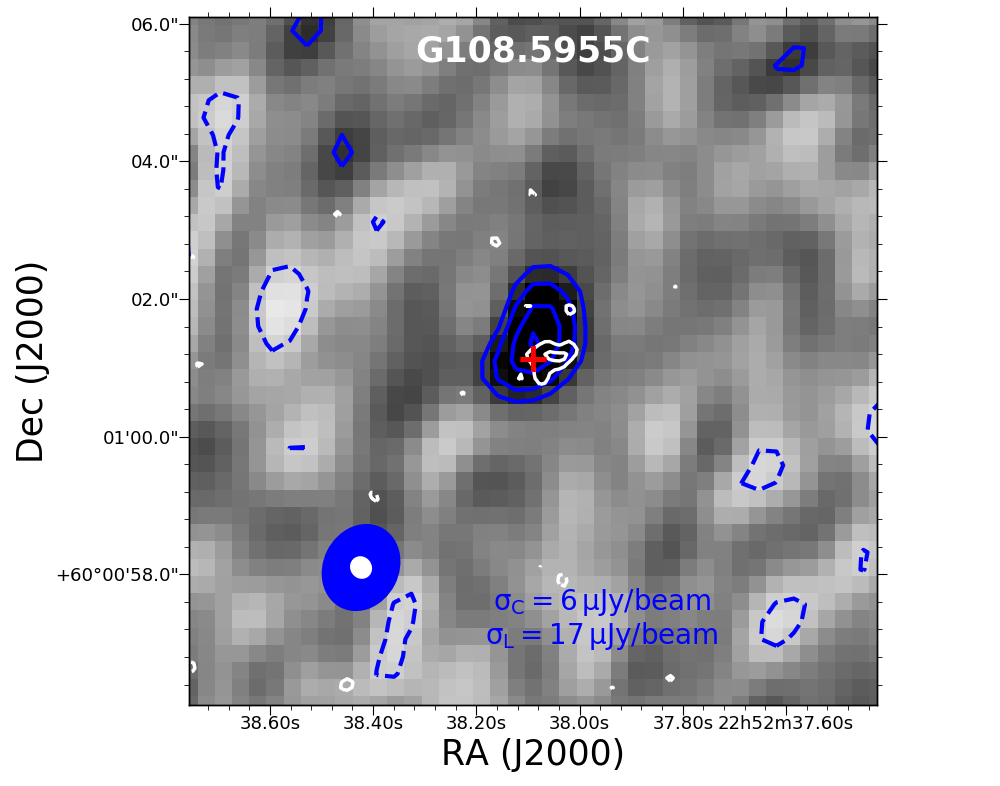
A.6 G108.5955C
L- and C- band emission of G108.5955C show different morphologies. Its L-C band spectral index shows that it is thermal but the spectral index map displays evidence of non-thermal emission on the eastern part. Both Wu et al. (2009) and Xu & Wang (2010) detected molecular outflows in the field, however, line map (Wolf-Chase et al., 2017) does not show any evidence of knots which may be associated with the source.
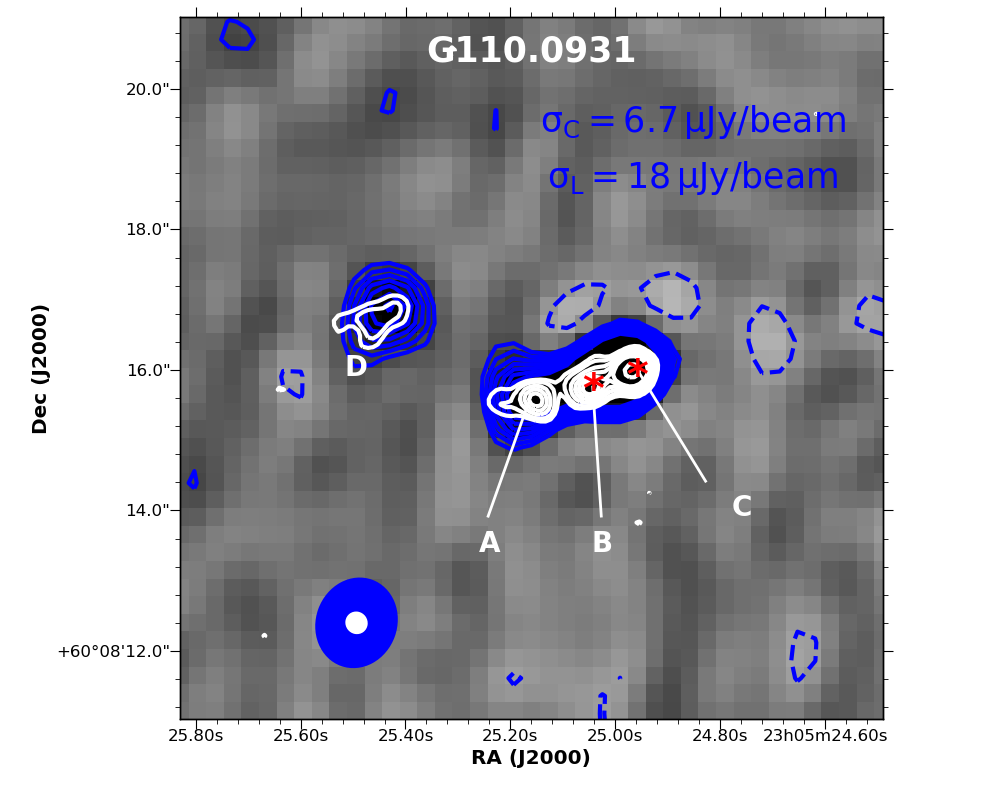
A.7 G110.0931
G110.0931’s field contains two L-band sources, the MYSO and source D (see Figure 1), whose L-C band spectral indices are and respectively. The MYSO encompasses three sources; A, B and C of spectral indices = -0.141.49, 0.330.14 and -0.110.07 respectively (Rodríguez et al. 2012, Purser 2017).
Unlike B and C, A was not detected at Q-band (Purser, 2017) consequently giving G110.0931 overall an HII region-like spectrum. The detection of sources B and C at Q-band suggests that they could be cores, though we note that only B is detected by NOEMA444NOrthern Extended Millimeter Array at 1.3mm (Bosco et al 2019 in prep), whereas we would expect any core at this evolutionary stage to be detectable in the mm. Overall it seems likely therefore that B is the core and A and C are jet lobes. Source D, detected on the eastern part of G110.0931 was not detected at Q-band where the field rms is mJy/beam, setting a limit on its spectral index as , suggesting that it may be an optically thin HII region. This source does not show any clear association with G110.0931 which is approximately away from it.
Navarete et al. (2015) detected a bipolar outflow that is aligned in a direction similar to that of both L- and C- band emission. 2MASS IR- emission as well as the K-band continuum emission shown in Navarete et al. (2015) are also oriented in the same direction. Lu et al. (2014) detected emission that is aligned in a direction perpendicular to the jet and passing through the location of the central source, B. The orientation of emission, which is a tracer of dense molecular gas (Levshakov et al., 2013) and that of the molecular line at 2.12m suggests that the source may be a disk-jet system. Finally, source C has higher radio flux compared to A, perhaps an indicator of a E-W density gradient.
A.8 G111.2552
G111.2552, also known as I23139 (Trinidad et al., 2006) is a thermal radio source of spectral index . Its L- and C-band emission are largely aligned in a SE-NW direction (see Figure 3). Its Q-band flux appears to be lower than expected (see Figure 2) when compared to estimates from Trinidad et al. (2006) i.e a flux density of 0.980.24 mJy and 0.530.13 mJy at 23 GHz and 8.5 GHz respectively. Furthermore, Trinidad et al. (2006) detected a nearby source of flux density 0.220.07 mJy, approximately 0.5′′ to the south, which they suppose is I23139’s companion. Finally, molecular outflows (Wouterloot et al., 1989) and water maser emission (Tofani et al. 1995; Trinidad et al. 2006) detected in the field suggests presence of outflow activity (De Buizer et al., 2005).
A.9 G111.5671
Three sources, A, B and C were detected in the field at L-band. Source A, also known as NGC 7538 IRS9 (Mitchell & Hasegawa, 1991) seems to be the core of G111.5671 while B and C, located and away to the SW and NE of the core respectively are its lobes. L-C spectral indices () of B and C are and suggesting that B is a non-thermal source while C is thermal. Also, B seems to be more diffuse, bow shaped and extended towards A as seen in the C-band image of higher resolution, suggesting that it is a bow shock.
A has a flux density of 1.000.44 mJy, 0.760.15 mJy (Sandell et al., 2005) and mJy (Rengarajan & Ho, 1996) at 4.86 GHz, 8.46 GHz and 15 GHz respectively. van der Tak & Menten (2005) used both C and A configurations of the VLA to estimate its flux density at 43 GHz, obtaining mJy and mJy respectively. The fluxes gives it a spectral index . The three sources were previously detected by Sánchez-Monge et al. (2008) as a single source at 1.3 cm. The source, aligned in a NE-SW direction has a spectral index of . They also detected another source to the SW of A, B and C whose spectral index is . The orientation of the sources suggests the presence of a jet in a NE-SW direction.
Both a highly collimated HCO+ outflow observed by Sandell et al. (2005) and 2.12m emission by Davis et al. (1998) are aligned in a NE-SW direction, similar to the alignment of the radio sources. An offshoot of the IR emission that is directed towards the south is also seen in both 2MASS and Sandell et al. (2005)’s map. This emission is in the same direction as a CO outflow (Sandell et al. 2005, Davis et al. 1998), perhaps implying presence of two outflow drivers. Furthermore, the observed by Mitchell & Hasegawa (1991) shows a blue outflow lobe that is aligned in a NE - SW direction and a red one in the SE-NW.
A.10 G114.0835
Two sources, A and B were detected at L-band (see Figure 1). B is a non-thermal source of spectral index while A is a thermal source whose spectral index is 0.400.20. A high resolution image of A at C-band reveals two partially resolved sources, A1 and A2, that are oriented in a NE-SW direction. The two sources (Figure 1) are likely to be thermal. It is not clear if A and B are associated but B is elongated in the direction of IR emission in the field (Navarete et al. 2015, Skrutskie et al. 2006) signifying the likelihood of the presence of a jet. Also, A and B are aligned in the direction of IR emission.
A.11 G126.7114
G126.7114 is a thermal source of spectral index mJy. Its L-band and C-band emission are largely aligned in a SE-NW direction. Apart from G126.7114, a weak source (4 detection) of flux density 0.080.02 was also detected at C-band, approximately away to the SE at (). NIR K-band emission (Jiang et al. 2001; Navarete et al. 2015) of the source is aligned in a direction similar to that of L- and C-bands suggesting the presence of a SE-NW outflow. Navarete et al. (2015) also detected knots that are typical of a bipolar jet with a similar orientation i.e at a position angle PA. Moreover, Jiang et al. (2001) detected a polarization disk that is oriented in a direction perpendicular to that of the outflow, suggesting a disk-jet case.
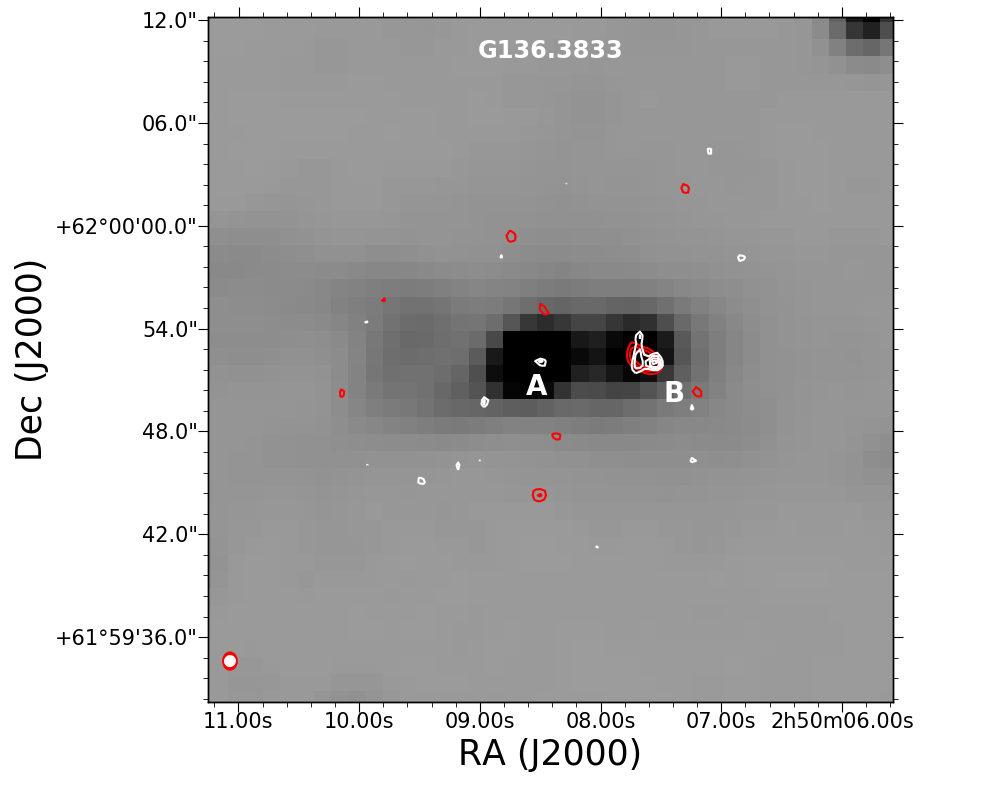
A.12 G136.3833
G136.3833-A was detected at both C- and Q- but not L-band where the field rms is Jy/beam. It is a thermal radio source whose C-Q band spectral index is . A non-thermal source, B of spectral index , was detected approximately to the west A at L-band. The source whose position angle is at L-band is elliptical at L- but irregular at C-band. The IR nebula in the field is oriented in an east-west direction (Skrutskie et al., 2006), just like the alignment of sources A and B (see Figure 13). Both A and B have 2MASS counterparts at K-band and B may therefore be a non-thermal lobe or a star.
A.13 G138.2957
G138.2957, also known as AFGL 4029 (Ray et al., 1990) displays an extended morphology at C-band but splits into B and C at L-band. Both B and C are non-thermal lobes of flux densities 0.130.04 mJy and 0.100.03 mJy respectively. Polygons whose sizes are equivalent to the size of the sources at L-band were used to estimate their fluxes at C- band. The flux of B and C at C-band were determined to be approximately 0.070.02 mJy and 0.060.02 mJy respectively, giving them spectral indices of -0.460.31 and -0.380.33 respectively. Its spectral index map also display evidence of non-thermal emission, with some pixels having a non-thermal index of -0.60.2. The central core of the source was not detected at L-band. It appears to be located at the position of the peak emission at C-band (Figure 3). A polygon that is equivalent to the C-band contour of level 7 (80Jy/beam), which encloses the peak emission, was used in estimating the flux density of the core at C-band as 0.090.01 mJy. A similar polygon was used at L-band, approximating its peak flux at the frequency as 0.06 mJy. The fluxes suggest that the source has a thermal core of spectral index 0.69.
The source drives an optical jet (Ray et al., 1990) whose position angle is comparable to that of C-band emission ( 75o). Navarete et al. (2015) also mapped a bipolar outflow of position angle PA 90 degrees which appears to be associated with it. Kurtz et al. (1994) and Carral et al. (1999) observed the source using B and D configurations of the VLA, estimating its flux density at 3.6 cm to be mJy and mJy, perhaps signifying variability.
A.14 G139.9091A
G139.9091A, also known as GL437S (Kumar Dewangan & Anandarao, 2010) is a thermal radio source of spectral index . It has a position angle of , similar to the orientation of de Wit et al. (2009)’s mid-infrared emission. Similarly, Manjarrez et al. (2012) imaged it using archival data from JVLA’s B,C and D configurations at 3.6 cm and 2 cm getting a comparable position angle i.e . Its flux density at 3.6 cm and 2 cm are 1.50.4 mJy and mJy respectively, perhaps a sign of variability. Both infrared (Figure 14) and CO (Gomez et al., 1992) emission of the field are aligned in a N-S direction, however, its 2.12 m map (Davis et al., 1998) does not show evidence of outflow.
Apart from G139.9091A, an optically thin HII region of spectral index -0.110.02, also identified as AFGL 437W (Manjarrez et al., 2012), was detected to the NW of A. It has flux densities of 19.00.5 mJy and 16.3 0.4 mJy at L- and C-bands respectively.

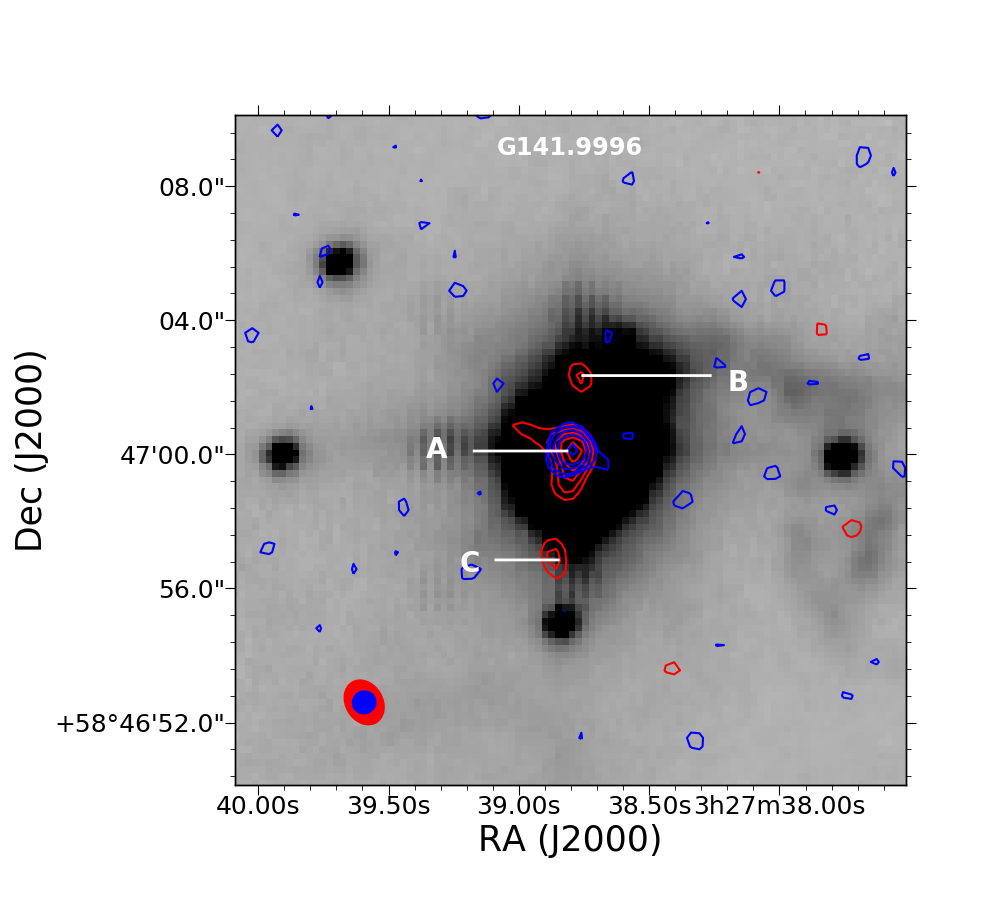
A.15 G141.9996
G141.9996, also known as AFGL 490 (Davis et al., 1998) is an extended source that is largely elongated in a N-S direction. Two lobes, B and C, of flux densities 0.060.03 mJy and 0.070.03 respectively were detected at L- but not at C-band. The L-C spectral indices of B and C are and respectively, suggesting that they are non-thermal lobes. The core, A, is thermal and is elongated in a direction that is similar to the alignment of A,B and C i.e . Both CO outflow (Mitchell et al. 1995) and 2.12 emission (Davis et al. 1998, Navarete et al. 2015) maps of the field are oriented in a NE-SW direction. However emission of the source has a positions angle of -45o (Schreyer et al., 2002).
Also, an optically thin source of spectral index -0.060.16 was detected approximately away, at both bands. The source, located at has flux densities of 0.120.03 mJy and 0.110.02 mJy at L- and C-bands respectively.