Structurally driven asymmetric miscibility in the phase diagram of W–Ti
Abstract
Phase diagrams for multi-component systems represent crucial information for understanding and designing materials but are very time consuming to assess experimentally. Computational modeling plays an increasingly important role in this regard but has been largely focused on systems with matching lattice structures and/or stable boundary phases. Here, using a combination of density functional theory calculations, alloy cluster expansions, free energy integration, and Monte Carlo simulations, we obtain the phase diagram of W–Ti, a system that features metastable boundary phases on both sides of the phase diagram. We find that the mixing energy on the body-centered cubic (BCC) lattice is asymmetric and negative with a minimum of about meV/atom, whereas for the hexagonal closed packed (HCP) lattice the mixing energy is positive. By combining these data with a model for the vibrational free energy, we propose a revision of the W-rich end of the phase diagram with a much larger solubility of Ti in BCC-W than previous assessments. Finally, by comparison with the W–V and W–Re system we demonstrate how strongly asymmetric phase diagrams can arise from a subtle energy balance of stable and metastable lattice structures.
I Introduction
Metallic alloys play a crucial role in technology and are of continuing interest in basic research. The most simple alloys comprise two components; these so-called binary systems can usually be categorized according to whether the interaction between the two constituents is repulsive (positive mixing energy) or attractive (negative mixing energy). In the former case, examples for which include Cu–Ag Massalski (1990); Najafabadi et al. (1993); Williams et al. (2006) and Fe–Cu Massalski (1990); Hultgren and Desai (1971); Jiang et al. (1998); Lopasso et al. (2003), one commonly observes a wide two-phase region (often referred to as the miscibility gap). Attractive interactions, on the other hand, give rise to the formation of solid solutions, e.g., in Au–Ag Massalski (1990); Ozoliņš et al. (1998) or W–V Massalski (1990); Muzyk et al. (2011), and the formation of intermetallic phases as in the case of Fe–Pt Massalski (1990); Madelung (1996); Fredriksson and Sundman (2001); Kim et al. (2006) or Ni–Al Massalski (1990); Ansara et al. (1988); Pun and Mishin (2009).
The interaction between the constituents is usually symmetric, in the sense that if dissolves in , so does in . Exceptions from this behavior are rather uncommon; a prominent example is the Fe–Cr system Caro et al. (2006); Bonny et al. (2009), for which the dissolution of Cr in Fe is energetically favorable whereas the opposite applies for Fe in Cr Olsson et al. (2006); Klaver et al. (2006). As a result of this inversion in the mixing energy, the phase diagram is very asymmetric with a large solubility on the Fe-rich and a very small solubility on the Cr-rich side. This behavior, which at first sight might be unexpected given a very small size mismatch and identical lattice structures, can be rationalized in terms of the magnetic structure Ackland (2006); Klaver et al. (2006) with Fe and Cr preferring ferro and antiferromagnetic ordering, respectively.
Here, we show that strongly asymmetric phase diagrams can also be obtained in non-magnetic systems as a result of an asymmetry in lattice structures and their energetics. In doing so, we also demonstrate the usage of the variance constrained semi-grand canonical Monte Carlo technique Sadigh and Erhart (2012); Sadigh et al. (2012) for extracting the complete free energy surfaces. Specifically, we consider the W–Ti system. Titanium exhibits a temperature driven transition from a low-temperature hexagonal closed-packed (HCP) phase (-Ti) to a high-temperature body centered cubic (BCC) phase (-Ti) that is stabilized by vibrations Petry et al. (1991). Tungsten is a refractory metal that maintains a BCC structure up to the melting point. Close-packed structures including HCP are much higher in energy and can only be stabilized at very high pressures Einarsdotter et al. (1997); Ozoliņš (2009).
The W–Ti system is also of interest because its experimental assessment is aggravated by the high melting point of tungsten and the accompanying slow kinetics, which render the systematic exploration of the phase diagram, in particular the W-rich side, very cumbersome. Since experimental data points for tungsten concentrations are only available down to 1473 K Rudy and Windisch (1968); Murray (1981), the W–Ti system has been assessed using rather severe assumptions Kaufman and Nesor (1975); Murray (1981); Lee and Lee (1986); Jönsson (1996). It must be emphasized, however, that in spite of slow kinetics the low-temperature phase diagram of refractory alloy systems have a bearing, e.g., for the behavior under intense irradiation conditions such as in fusion reactors in so far as they determine the thermodynamic driving forces. Tungsten alloys in particular are being considered for key components in fusion reactors that must sustain extreme mechanical and irradiation loads for prolonged periods of time Zinkle and Ghoniem (2000); Rieth et al. (2013); Becquart and Domain (2009).
In the following, using a combination of density functional theory (DFT) calculations, alloy cluster expansions (CEs), Monte Carlo (MC) simulations in the variance constrained semi-grand canonical (VCSGC) ensemble, and thermodynamic data for the pure elements Dinsdale (1991), we provide a reassessment of the W–Ti phase diagram below the solidus line. In doing so, we demonstrate (i) that the solubility of Ti in W exceeds 20% down to zero temperature in stark contrast to previous thermodynamic assessments Kaufman and Nesor (1975); Lee and Lee (1986); Jönsson (1996) while the inverse solubility is practically zero up to the HCP-BCC transition. Furthermore, it is shown (ii) that this asymmetry originates from a change of sign of the BCC-HCP free energy difference as a function of composition, which remains comparably small in magnitude. In addition to providing a new perspective on the W–Ti system, the present results illustrate how strongly asymmetric phase diagrams can originate in non-magnetic systems, and illustrate a methodology that can handle multiple miscibility gaps in systems with several different lattice types.
The remainder of this paper is organized as follows. The next section provides an overview of the computational techniques employed in this work. The thermodynamic framework used to analyze the free energy landscapes and construct the phase diagram is outlined in Sect. II.4. The results of our computations are presented in Sect. III, after we discuss the implications for the W–Ti system in particular and put the present results in context in Sect. IV.
II Computational methodology
II.1 Alloy cluster expansions
In the present work, we employ lattice Hamiltonians to represent the energy of the system as a function of composition and distribution of the elements. These alloy CEs can be written in the general form Sanchez et al. (1984)
| (1) |
where denotes the mixing energy. The summation runs over all symmetry inequivalent clusters with multiplicity and effective cluster interaction (ECI) . The cluster correlations are computed as symmetrized averages of products over the pseudospin vector . The latter represent the occupation of lattice sites by W () and Ti ().
In the present work, we employed the icet package Ångqvist et al. (2019) for the construction and sampling of CEs. We considered cluster spaces with up to 220 distinct clusters including clusters up to fifth order (quintuplets). Inclusion of clusters of high order was necessary due to the very asymmetric shape of the mixing energy as a function of composition (see below).
For training of CEs, we systematically enumerated all structures with up to 12 atoms in the unit cell Hart and Forcade (2008, 2009), which yields 10,846 and 5,777 structures for BCC and HCP lattices, respectively. Based on this pool of structures, we relaxed and evaluated the energy of more than 1,700 BCC and 900 HCP structures using DFT as described in Sect. II.3. Since both BCC-Ti Petry et al. (1991) and HCP-W are structurally unstable, several configurations did not maintain their initial lattice structure.111We note that in the case of the related W–Re system it has been shown that the BCC lattice remains dynamically stable up to approximately 70% Re Ekman et al. (2000). To exclude these structures, each configuration was mapped backed onto its respective ideal lattice structure. BCC structures were removed from the pool of structures if the displacement of any atom exceeded 0.25 Å or the tetragonal shear exceeded by 0.2222The tetragonal shear strain is defined as , where are the eigenvalues of the strain tensor in Voigt notation ordered by magnitude ., resulting in a total of 1,133 structures. HCP structures were removed if a structure had a negative mixing energy or a Ti concentration below 50%, resulting in 105 structures.
We have previously shown that the automatic relevance detection regression (ARDR) optimization algorithm yields sparse solutions with low cross-validation (CV) scores, often outperforming both least absolute shrinkage and selection operator (LASSO) and recursive feature elimination (RFE) approaches Ångqvist et al. (2019). The -threshold parameter in ARDR controls the sparsity of the model with smaller values producing sparser solutions at the cost of higher validation-root-mean-square error (RMSE) scores. Sparser solutions are commonly both more transferable and also computationally less expensive to sample. We therefore increased until the RMSE score converged. Here, CV scores were estimated by the shuffle-and-split method with 50 splits using 90/10% of the structures for training/validation.
II.2 Monte Carlo simulations
The final CEs were sampled using Monte Carlo (MC) simulations. In order to be able to construct the full free energy landscape of the crystalline phases (see Sect. II.4 below), we require the free energy for BCC and HCP phases separately, as a continuous function of composition. This prevents us from using the semi-grand canonical (SGC) ensemble. While the latter does provide access to the first derivative of the free energy with respect to composition, it does not allow sampling multiphase regions, which as will be seen below are present for both BCC and HCP lattices. To overcome this limitation we employ the VCSGC ensemble. It includes an additional term in the partition function that effectively imposes a constraint on the fluctuations of the concentration, which diverge in multi-phase regions. The VCSGC-MC approach has been successfully employed previously to describe multiphase equilibria in, e.g., Fe–Cr Sadigh and Erhart (2012) and Fe–Cu alloys Erhart and Sadigh (2013); Erhart et al. (2013). The VCSGC ensemble is sampled by randomly selecting a site in the system, swapping its chemical identity, and accepting this trial move with probability Sadigh and Erhart (2012)
| (2) | ||||
Here, is the energy change associated with the move, is the change in the number of particles of type , is the total number of sites (atoms) in the simulation cell, and and are the average and variance constraint parameters. We employed throughout; this choice provides a contiguous sampling of the concentration axis while maintaining a high acceptance rate and, in our experience, works almost universally for the systems that we have considered so far. The average constraint parameter was varied in steps of 0.02 from to . In the VCSGC ensemble the first derivative of the free energy is related to the (ensemble) average of the concentration ,
| (3) |
which allows one to obtain the free energy of mixing.
MC simulations were carried out at temperatures between 300 and 1800 K in 100 K intervals using and supercells of the primitive unit cell for BCC and HCP structures, respectively. At each value of the configuration was equilibrated for 10,000 trial steps, followed by 90,000 trial steps for gathering statistics.
II.3 Density functional theory calculations
Density functional theory (DFT) calculations were carried out using the projector augmented wave method (PAW) Blöchl (1994); Kresse and Joubert (1999) as implemented in the Vienna ab initio simulation package (VASP) Kresse and Hafner (1993); Kresse and Furthmüller (1996). Electronic semi-core states (W-, Ti-) were treated as part of the valence and calculations employed a plane wave energy cutoff of 450 eV. Brillouin zone integrations were carried out using -centered -point grids with an average spacing of 0.15/Å, corresponding to a mesh relative to the primitive BCC cell and a mesh relative to the primitive HCP cell. These computational settings are very tight and have been shown previously to yield well converged results Gharaee and Erhart (2015).
Using first-order Methfessel–Paxton smearing with a width of 0.2 eV, both ionic positions and cell shapes were relaxed until residual forces were below 5 meV/Å and stresses below 0.5 kbar. The total energy of the final structures was subsequently computed without further relaxation using the tetrahedron method with Blöchl corrections.
Exchange and correlation effects were described using the van der Waals density functional (vdW-DF) method that captures nonlocal correlations Rydberg et al. (2003); Dion et al. (2004) in combination with a consistent description of exchange (vdW-DF-cx) Berland and Hyldgaard (2014) as implemented in VASP Klimeš et al. (2011); Björkman (2014). We have recently established that this functional provides a description of the thermophysical properties of non-magnetic transition metals that is at least on par with but usually exceeds other constraint-based functionals Gharaee et al. (2017), notably PBE Perdew et al. (1996) and PBEsol Perdew et al. (2008). To assess the effect of the exchange-correlation functional, we conducted supplementary calculations using the latter functionals for selected structures close to the BCC convex hull.
II.4 Thermodynamic methodology
In order to construct the phase diagram, we consider the free energy landscape of the W–Ti system as a function of temperature , W concentration , and structure . From the MC simulations described above, we can extract the mixing free energy for or HCP, which includes the contributions due to mixing energy and configurational entropy . Here, since ionic and cell relaxations are implicitly included in the ECIs, we have and from here on we will therefore refer only to and .
To obtain the full Gibbs free energy, we must also take into account the vibrational contributions, which are not accounted for in the CE. Since a full evaluation of the vibrational contribution as a function of composition is very demanding due to the importance of anharmonic contributions for Ti-rich BCC and W-rich HCP structures, we here approximate the vibrational contribution by a linear interpolation of the elemental free energies plus a correction for the strong anharmonicity of the metastable BCC-Ti phase. We thus write the total Gibbs free energy for phase as
| (4) | |||
and for the sake of visualization the free energy of mixing as
| (5) | |||
For both and , we resort to thermodynamic assessments available from the CALPHAD framework Dinsdale (1991). Equation (4) contains an anharmonic correction term , which is motivated by an analysis of the lattice energy of BCC structure that was carried out using ab-initio molecular dynamics (MD) simulations with the VASP package and the PBE exchange-correlation functional Perdew et al. (1996). In these simulations, supercells comprising 54 atoms were sampled with XXX timesteps of 1 fs using a Nosé–Hoover thermostat.
III Results
III.1 Cluster expansions of mixing energies
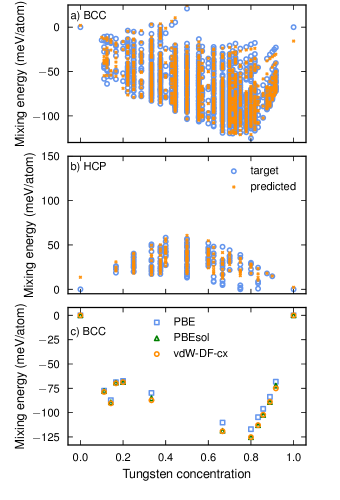
The DFT calculations reveal a negative mixing energy for BCC structures [Fig. 1(a)]. The shape of the mixing energy is very asymmetric with several structures along the convex hull. The lowest mixing energy is obtained for a structure at 80% W. This structure has space group 166 (Rm) and contains 5 atoms in the primitive unit cell.333 The lattice parameters of the ground state structure at 80% W are , , when referred to the conventional (15-atom) unit cell. The sole Ti atom is located at Wyckoff site (), while two tungsten atoms occupy two Wyckoff sites of type () each with and , respectively. All parameters quoted here are from calculations using the vdW-DF-cx method and do not include zero-point motion. For selected structures along the convex hull, we recalculated the mixing energies using the PBE and PBEsol functionals [Fig. 1(c)]. In particular between the PBEsol and vdW-DF-cx functionals the deviations are below one percent.
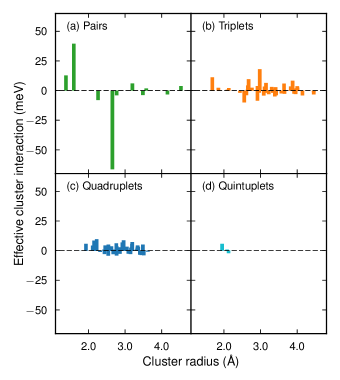
In the CE formalism employed in the present work, reproducing the asymmetric shape of the mixing energy required including clusters up to fifth order and extending over rather long range [Fig. 2(a)]. The final CE to be used in the MC simulations was obtained by training on the whole pool of structures with the ARDR optimization algorithm (see Sect. II.1 for details). The average root mean square error over the validation sets is 3.3 meV/atom and the final CE generally achieves very good agreement with the DFT reference data [Fig. 1(a)]. The accuracy and predictiveness of the CE is also evident from the small errors of the mixing energy [Fig. 1 (a)].
In contrast to the BCC lattice, the mixing energy for the HCP lattice is positive yet also asymmetric [Fig. 1(b)]. Here, the average root mean square error over the validation sets is 5.6 meV/atom.
III.2 Anharmonicity
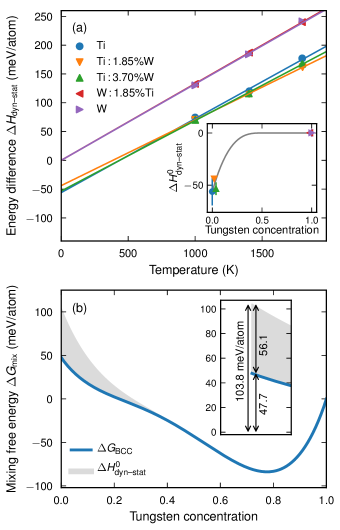
In classical simulations the average potential energy of a system approaches its static value as the temperature goes to zero. This behavior is observed for example for BCC-W as simulated with ab-initio MDFig. 3(a). The average potential energy of the BCC-Ti phase simulated in the same way does, however, not approach its static value but rather extrapolates to a value of . This behavior originates from the metastable character of the BCC-Ti phase and its mechanical instability at zero K, which implies a strongly anharmonic potential well. By contrast, both BCC-W and HCP-Ti are stable at zero temperature and their dynamical behavior up to moderate temperatures can be comfortably described within the quasi-harmonic approximation Gharaee et al. (2017).
The BCC-CE is based on the static BCC-Ti energy. At finite temperatures, the free energy difference at 0 K between the BCC-Ti and HCP-Ti phases is thus severely overestimated (), unlike the CALPHAD assessment, which implicitly takes the correction into account ( at the lowest available temperature). By inclusion of the term , we obtain excellent agreement () with the CALPHAD assessment [Fig. 3(b)].
To achieve a consistent thermodynamic description we must account for the variation of with composition, i.e., we must express in Eq. (4). Unfortunately, a comprehensive analysis of anharmonic behavior is already computationally demanding for the elemental phases Hellman et al. (2013); Ozoliņš (2009); Kadkhodaei et al. (2017). In the present case, we therefore make the basic assumption that smoothly approaches with decreasing Ti concentration. We chose a simple cubic functional form [inset of Fig. 3(a)]
| (6) |
Equation (6) contains a single parameter that determines the concentration at which the correction is fully applied. The thermodynamic analysis presented below was conducted using a value of , motivated by qualitative agreement with ab-initio MD calculations of BCC-Ti with, respectively, 1.85% and 3.70% W [inset of Fig. 3(a)].
We note that a similar correction should in fact also be considered for HCP-W vs BCC-W. As a result of the much larger energy difference between these structures, this effect is, however, insignificant for the phase diagram and has not been considered further (also see Sect. IV).
III.3 Free energy landscape
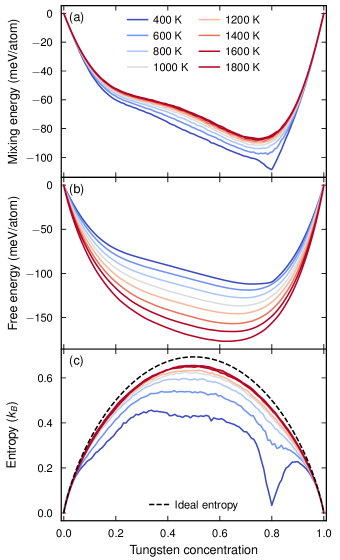
The CEs for BCC and HCP lattices were sampled by MC simulations as detailed in Sect. II.2. The (finite temperature) BCC mixing energy maintains the asymmetric shape of the zero-temperature data [Fig. 4(a)]. It also clearly reveals the emergence of a particularly stable configuration at 80% W, which corresponds to the ground state described above.
From the MC simulations, we furthermore obtained the first derivative of the free energy with respect to concentration via Eq. (3), which was integrated using the trapezoidal rule to yield the mixing free energy [Fig. 4(b)]. Below the free energy of mixing will be used to construct the convex hull and the phase diagram.
By combining mixing free energy and energy, one can extract the entropy of mixing according to
| (7) |
At low temperatures the actual mixing entropy deviates strongly from that of an ideal solution and the ordered structure at 80% W is clearly visible as a pronounced reduction in the mixing entropy [Fig. 4(c)]. At higher temperatures this feature is smoothed out and the mixing entropy becomes closer to that of an ideal solution. Nonetheless, the very pronounced features in the entropy clearly demonstrate the importance of an accurate treatment of alloy thermodynamics beyond simple approximations.
In the case of the HCP structures, mixing energies, free energies, and entropies were obtained in similar fashion as for the BCC lattice. Due to the positive mixing energy, these quantities are, however, much closer to those of an ideal solution and hence are not shown here explicitly. Their determination is nonetheless important in order to obtain a consistent and comprehensive description of the thermodynamics of the relevant crystalline phases.
III.4 Phase diagram
After having determined the free energies of both BCC and HCP phases, one can construct the full temperature, composition, and structure dependent free energy landscape, from which the phase diagram can be extracted. To this end, the free energies for the different phases were combined as described in Sect. II.4. In accordance with experimental reality, our analysis yields three distinct stable crystalline phases, namely a Ti-rich HCP phase (HCP-Ti), a Ti-rich BCC phase (BCC-Ti), and a W-rich BCC phase (BCC-W).
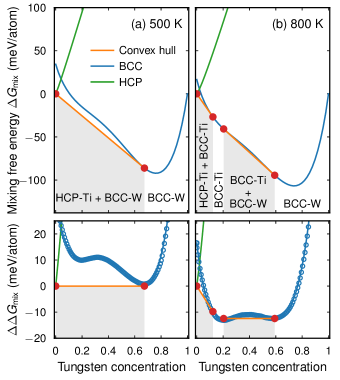
At a temperature of 500 K, the HCP-Ti phase is in equilibrium with BCC-W [Fig. 5(a)] with the latter phase exhibiting a wide stability range with a solubility limit of 67% W. This substantially differs from the values predicted by CALPHAD assessments based on partial experimental data supplemented by approximations for the mixing energy Lee and Lee (1986); Jin and Qiu (1993); Jönsson (1996). Similarly, at a temperature of 800 K we obtain all three phases [Fig. 5(b)].
In order to obtain a description of the phase diagram at all intermediate temperatures, we followed the common approach in alloy thermodynamics of representing the free energy of mixing in terms of a Redlich–Kister expansion
| (8) |
up to order . We then represented the temperature dependence of each of the eight (four per lattice) Redlich–Kister coefficients by third-order polynomials. The interpolated mixing free energies are in very good agreement with our VCSGC-MC data [see points and blue lines in the bottom row of Fig. 5], which allows us to extract the phase boundaries as a continuous function of temperature.
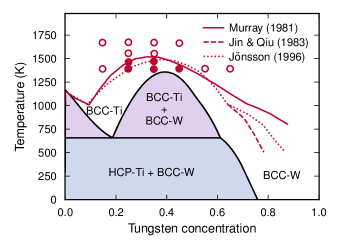
The thus obtained phase diagram [Fig. 6] shows the same phases and phase equilibria as the experimental one. The upper temperature of the BCC-Ti+BCC-W two-phase region is predicted at 1360 K, which is approximately 160 K lower than experiment, and the position of the maximum is predicted at a W concentration of 39% as opposed to approximately 30% in the experiments. The large high-temperature solubility results from a negative mixing energy on the BCC lattice, which also gives rise to finite solubility limit of for Ti in BCC-W down to zero temperature. The eutectoid on the Ti-rich side of the phase diagram is underestimated compared to experiment (657 K vs 1013 K), which comes with an overestimation of the eutectoid point (19% vs 9%). The larger errors on the Ti-rich side are unsurprising given the difficulties associated with the strong anharmonicity of BCC-Ti, which are only treated approximately in this work. We note that we tested different values for parameter in Eq. (6) and found the general shape of the phase diagram to be unaffected. Larger (smaller) values of shift the BCC-W solubility limit further to the W-rich side and tend to increase (decrease) the maximum of the BCC-Ti+BCC-W two phase region.
IV Discussion and conclusions
IV.1 Relevance for the W–Ti system
Above we have demonstrated that the solubility of Ti in BCC-W at low temperatures is larger than previously predicted and remains finite as the temperature approaches zero. This conclusion was reached by combining DFT calculations with effective lattice Hamiltonians, Monte Carlo simulations, and thermodynamic modeling. By comparison, previous studies were based on experimental data, which is only available at temperatures above 1473 K. We note that while the low temperature region of the phase diagrams of refractory metals are exceedingly difficult to sample in equilibrium, they are nonetheless relevant as they determine the driving forces under extreme non-equilibrium situations such as encountered under ion irradiation.
IV.2 General implications
While the present finding pertains to our understanding of the W–Ti phase diagram, it has more general implications for alloy thermodynamics. As outlined in the introduction, binary phase diagrams of metals that exhibit strongly asymmetric solubility are relatively rare. While as demonstrated in the case of the Fe–Cr system, they can arise from competing forms of magnetic order, here we show that this effect can also be observed in non-magnetic systems as a result of different lattice structures.
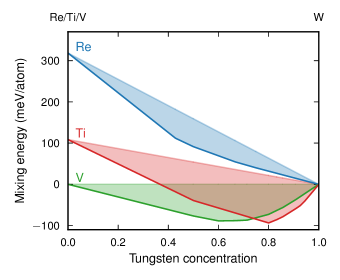
To illustrate this effect consider the mixing energies of W–V (BCC) and W–Re (BCC and HCP) in comparison with W–Ti (Fig. 7; data from Ref. Gharaee et al., 2016). In the case of W–V both end members are BCC, the mixing energy is negative and the phase diagram shows an extended miscibility range (and is symmetric). In the case of W–Re, the calculations yield a negative mixing energy for BCC and an almost vanishing mixing energy for the HCP lattice, very similar to the case of W–Ti described above. The (free) energy difference between HCP-Re (the ground state) and BCC-Re is, however, much larger than in the case of Ti. As a result, the negative mixing energy of the BCC lattice is shifted upward such that the solubility of Re in BCC-W is rather small and approaches zero with vanishing temperature.
The comparison with W–V and W–Re demonstrates that the occurrence of an asymmetric phase diagram in W–Ti is the result of a negative mixing energy on the BCC lattice in combination with a HCP-BCC energy difference that is not too large. This reasoning implies that similar behavior can be expected in other systems that combine different lattice structures with elements that have metastable structures. By extension, this should also apply to effective (“quasi”) phase diagrams between compounds.
IV.3 Computational modeling
Using conventional sampling techniques based on either the semi-grand canonical or canonical ensembles, one cannot simultaneously sample multi-phase regions and derivatives of the free energy. 444We note that the semi-grand canonical and canonical ensemble could be combined to carry out sampling and evolution of the system, respectively. By alternating these techniques it would then in principle be possible to recover information about the first derivative of the free energy. The resulting scheme is, however, costly as it would commonly require many more MC cycles than the VCSGC-MC approach. In the present work, however, we have tackled a system that combines different lattice structures with miscibility gaps. This required the ability to obtain the free energy profile for the different phases as a continuous function of composition (and temperature). Here, we were able to achieve this by using the VCSGC-MC approach, and have thereby demonstrated the power of this methodology to extract free energies and phase diagram information. This suggests that in the future the VCSGC-MC method can be of great utility as the reach of ab initio alloy thermodynamics widens to address more complex and demanding challenges.
IV.4 Short comings and outlook
Arguably the biggest approximation adopted in the present work concerns the description of anharmonic contributions to the free energy. As alluded to above, a direct assessment of the vibrational contributions to the free energy as a function of composition is computationally very demanding Hellman et al. (2013); Ozoliņš (2009); Kadkhodaei et al. (2017). While for vibrationally stable systems this can be achieved within the harmonic approximation van de Walle and Ceder (2002); Huang et al. (2016); Chinnappan et al. (2016), a more comprehensive treatment of the anharmonicity in alloys is one of the remaining challenges in the development of computational alloy thermodynamics.
Acknowledgements.
This work was supported the Swedish Research Council and the Knut and Alice Wallenberg foundation. Computer time allocations by the Swedish National Infrastructure for Computing at NSC (Linköping), C3SE (Göteborg), and PDC (Stockholm) are gratefully acknowledged.References
- Massalski (1990) T. Massalski, ed., Binary Alloy Phase Diagram (ASM International, Materials Park, Ohio, 1990).
- Najafabadi et al. (1993) R. Najafabadi, D. J. Srolovitz, E. Ma, and M. Atzmon, Journal of Applied Physics 74, 3144 (1993).
- Williams et al. (2006) P. L. Williams, Y. Mishin, and J. C. Hamilton, Modelling and Simulation in Materials Science and Engineering 14, 817 (2006).
- Hultgren and Desai (1971) R. R. Hultgren and P. D. Desai, Selected Thermodynamic Values and Phase Diagrams for Copper and Some of Its Binary Alloys (International Copper Research Association, New York, 1971).
- Jiang et al. (1998) J. Jiang, C. Gente, and R. Bormann, Materials Science and Engineering: A 242, 268 (1998).
- Lopasso et al. (2003) E. M. Lopasso, M. Caro, A. Caro, and P. E. A. Turchi, Physical Review B 68, 214205 (2003).
- Ozoliņš et al. (1998) V. Ozoliņš, C. Wolverton, and A. Zunger, Phys. Rev. B 57, 6427 (1998).
- Muzyk et al. (2011) M. Muzyk, D. Nguyen-Manh, K. J. Kurzydłowski, N. L. Baluc, and S. L. Dudarev, Physical Review B 84, 104115 (2011).
- Madelung (1996) O. Madelung, ed., Landolt-Börnstein: Numerical Data and Functional Relationships in Science and Technology, Vol. 5 (Springer-Verlag, Heidelberg, 1996).
- Fredriksson and Sundman (2001) P. Fredriksson and B. Sundman, Calphad 25, 535 (2001).
- Kim et al. (2006) J. Kim, Y. Koo, and B.-J. Lee, Journal of Materials Research 21, 199–208 (2006).
- Ansara et al. (1988) I. Ansara, B. Sundman, and P. Willemin, Acta Metallurgica 36, 977 (1988).
- Pun and Mishin (2009) G. P. Pun and Y. Mishin, Philosophical Magazine 89, 3245 (2009).
- Caro et al. (2006) A. Caro, M. Caro, E. M. Lopasso, and D. A. Crowson, Applied Physics Letters 89, 121902 (2006).
- Bonny et al. (2009) G. Bonny, R. C. Pasianot, and L. Malerba, Philosophical Magazine 89, 711 (2009).
- Olsson et al. (2006) P. Olsson, I. A. Abrikosov, and J. Wallenius, Physical Review B 73, 104416 (2006).
- Klaver et al. (2006) T. P. C. Klaver, R. Drautz, and M. W. Finnis, Physical Review B 74, 094435 (2006).
- Ackland (2006) G. J. Ackland, Physical Review Letters 97, 015502 (2006).
- Sadigh and Erhart (2012) B. Sadigh and P. Erhart, Physical Review B 86, 134204 (2012).
- Sadigh et al. (2012) B. Sadigh, P. Erhart, A. Stukowski, A. Caro, E. Martinez, and L. Zepeda-Ruiz, Physical Review B 85, 184203 (2012).
- Petry et al. (1991) W. Petry, A. Heiming, J. Trampenau, M. Alba, C. Herzig, H. R. Schober, and G. Vogl, Physical Review B 43, 10933 (1991).
- Einarsdotter et al. (1997) K. Einarsdotter, B. Sadigh, G. Grimvall, and V. Ozoliņš, Physical Review Letters 79, 2073 (1997).
- Ozoliņš (2009) V. Ozoliņš, Physical Review Letters 102, 065702 (2009).
- Rudy and Windisch (1968) E. Rudy and S. Windisch, Transactions of the Metallurgical Sociecty AIME 242, 953 (1968).
- Murray (1981) J. L. Murray, Bulletin of Alloy Phase Diagrams 2, 192 (1981).
- Kaufman and Nesor (1975) L. Kaufman and H. Nesor, Metallurgical Transactions 6A, 2123 (1975).
- Lee and Lee (1986) S. K. Lee and D. N. Lee, CALPHAD 10, 61 (1986).
- Jönsson (1996) S. Jönsson, Zeitschrift für Metallkunde 87, 784 (1996).
- Zinkle and Ghoniem (2000) S. J. Zinkle and N. M. Ghoniem, Fusion Engineering and Design 51–52, 55 (2000).
- Rieth et al. (2013) M. Rieth, S. L. Dudarev, S. M. Gonzalez de Vicente, J. Aktaa, T. Ahlgren, S. Antusch, D. E. J. Armstrong, M. Balden, N. Baluc, M. F. Barthe, W. W. Basuki, M. Battabyal, C. S. Becquart, D. Blagoeva, H. Boldyryeva, J. Brinkmann, M. Celino, L. Ciupinski, J. B. Correia, A. De Backer, C. Domain, E. Gaganidze, C. García-Rosales, J. Gibson, M. R. Gilbert, S. Giusepponi, B. Gludovatz, H. Greuner, K. Heinola, T. Höschen, A. Hoffmann, N. Holstein, F. Koch, W. Krauss, H. Li, S. Lindig, J. Linke, C. Linsmeier, P. López-Ruiz, H. Maier, J. Matejicek, T. P. Mishra, M. Muhammed, A. Muñoz, M. Muzyk, K. Nordlund, D. Nguyen-Manh, J. Opschoor, N. Ordás, T. Palacios, G. Pintsuk, R. Pippan, J. Reiser, J. Riesch, S. G. Roberts, L. Romaner, M. Rosiñski, M. Sanchez, W. Schulmeyer, H. Traxler, A. Ureña, J. G. van der Laan, L. Veleva, S. Wahlberg, M. Walter, T. Weber, T. Weitkamp, S. Wurster, M. A. Yar, J. H. You, and A. Zivelonghi, J. Nucl. Mat. 432, 482 (2013).
- Becquart and Domain (2009) C. S. Becquart and C. Domain, J. Nucl. Mat. 385, 223 (2009).
- Dinsdale (1991) A. T. Dinsdale, CALPHAD 15, 317 (1991).
- Sanchez et al. (1984) J. M. Sanchez, F. Ducastelle, and D. Gratias, Physica A 128, 334 (1984).
- Ångqvist et al. (2019) M. Ångqvist, W. A. Munñoz, J. M. Rahm, E. Fransson, C. Durniak, P. Rozyczko, T. H. Rod, and P. Erhart, Adv. Simul. Theo. (2019), accepted.
- Hart and Forcade (2008) G. L. W. Hart and R. W. Forcade, Physical Review B 77, 224115 (2008).
- Hart and Forcade (2009) G. L. W. Hart and R. W. Forcade, Physical Review B 80, 014120 (2009).
- Ekman et al. (2000) M. Ekman, K. Persson, and G. Grimvall, Journal of Nuclear Materials 278, 273 (2000).
- Note (1) We note that in the case of the related W–Re system it has been shown that the BCC lattice remains dynamically stable up to approximately 70% Re, see Ref. Ekman et al., 2000.
- Note (2) The tetragonal shear strain is defined as , where are the eigenvalues of the strain tensor in Voigt notation ordered by magnitude .
- Erhart and Sadigh (2013) P. Erhart and B. Sadigh, Physical Review Letters 111, 025701 (2013).
- Erhart et al. (2013) P. Erhart, J. Marian, and B. Sadigh, Physical Review B 88, 024116 (2013).
- Blöchl (1994) P. E. Blöchl, Physical Review B 50, 17953 (1994).
- Kresse and Joubert (1999) G. Kresse and D. Joubert, Physical Review B 59, 1758 (1999).
- Kresse and Hafner (1993) G. Kresse and J. Hafner, Physical Review B 47, 558 (1993).
- Kresse and Furthmüller (1996) G. Kresse and J. Furthmüller, Computational Materials Science 6, 15 (1996).
- Gharaee and Erhart (2015) L. Gharaee and P. Erhart, Journal of Nuclear Materials 467, 448 (2015).
- Rydberg et al. (2003) H. Rydberg, M. Dion, N. Jacobson, E. Schröder, P. Hyldgaard, S. I. Simak, D. C. Langreth, and B. I. Lundqvist, Physical Review Letters 91, 126402 (2003).
- Dion et al. (2004) M. Dion, H. Rydberg, E. Schröder, D. C. Langreth, and B. I. Lundqvist, Physical Review Letters 92, 246401 (2004).
- Berland and Hyldgaard (2014) K. Berland and P. Hyldgaard, Physical Review B 89, 035412 (2014).
- Klimeš et al. (2011) J. Klimeš, D. R. Bowler, and A. Michaelides, Physical Review B 83, 195131 (2011).
- Björkman (2014) T. Björkman, The Journal of Chemical Physics 141, 074708 (2014).
- Gharaee et al. (2017) L. Gharaee, P. Erhart, and P. Hyldgaard, Physical Review B 95, 085147 (2017).
- Perdew et al. (1996) J. P. Perdew, K. Burke, and M. Ernzerhof, Physical Review Letters 77, 3865 (1996), erratum, ibid. 78, 1396(E) (1997).
- Perdew et al. (2008) J. P. Perdew, A. Ruzsinszky, G. I. Csonka, O. A. Vydrov, G. E. Scuseria, L. A. Constantin, X. Zhou, and K. Burke, Physical Review Letters 100, 136406 (2008).
- Note (3) The lattice parameters of the ground state structure at 80% W are , , when referred to the conventional (15-atom) unit cell. The sole Ti atom is located at Wyckoff site (), while two tungsten atoms occupy two Wyckoff sites of type () each with and , respectively. All parameters quoted here are from calculations using the vdW-DF-cx method and do not include zero-point motion.
- Hellman et al. (2013) O. Hellman, P. Steneteg, I. A. Abrikosov, and S. I. Simak, Physical Review B 87, 104111 (2013).
- Kadkhodaei et al. (2017) S. Kadkhodaei, Q.-J. Hong, and A. van de Walle, Physical Review B 95, 064101 (2017).
- Jin and Qiu (1993) Z.-P. Jin and C. Qiu, Materials Science and Technology 9, 378 (1993).
- Gharaee et al. (2016) L. Gharaee, J. Marian, and P. Erhart, Journal of Applied Physics 120, 025901 (2016).
- Note (4) We note that the semi-grand canonical and canonical ensemble could be combined to carry out sampling and evolution of the system, respectively. By alternating these techniques it would then in principle be possible to recover information about the first derivative of the free energy. The resulting scheme is, however, costly as it would commonly require many more MC cycles than the VCSGC-MC approach.
- van de Walle and Ceder (2002) A. van de Walle and G. Ceder, Review of Modern Physics 74, 11 (2002).
- Huang et al. (2016) L.-F. Huang, B. Grabowski, J. Zhang, M.-J. Lai, C. C. Tasan, S. Sandlöbes, D. Raabe, and J. Neugebauer, Acta Materialia 113, 311 (2016).
- Chinnappan et al. (2016) R. Chinnappan, B. Panigrahi, and A. van de Walle, Calphad 54, 125 (2016).