Comparison of SEDs of very massive radio-loud and radio-quiet AGN
Abstract
The main objective of this work is to establish and interpret the dominant spectral components and their differences in radio-loud (RL) and radio-quiet (RQ) AGN with very massive black holes, and accreting at moderate rates. Such a sample is selected from the Swift/BAT catalogue of AGN having determined optical spectra types and hosting black holes with masses . We confirm our previous results, that radio loudness distribution of Swift/BAT AGN is bimodal and that radio galaxies are about two times X-ray louder than their radio-quiet counterparts. We show that the average X-ray loudness (defined as a ratio of luminosity in the keV band to that at 12 m) of Type 1 and Type 2 AGN is very similar. This similarity holds for both RL and RQ subsamples and indicates negligible dependence of the observed X-ray luminosities on the inclination angle in both populations.
In both the radiative output is dominated by mid-IR and hard X-ray components, and relatively weak UV luminosities indicate large amounts of dust in polar regions.
keywords:
galaxies: active — galaxies: jets — accretion, accretion discs — radiation mechanisms: thermal — radiation mechanisms: non-thermal1 INTRODUCTION
One of the biggest puzzles of the AGN phenomenon is its large diversity regarding the jet production efficiency. This is particularly apparent in AGN with higher accretion rates, where power of a jet traced by radio luminosity can be compared with accretion power traced by optical luminosity of accretion discs or IR luminosity resulting from reprocessing of optical-UV radiation by dusty obscurers. At each Eddington ratio the radio loudness spans by 3 to 4 orders of magnitude (e.g. Sikora et al., 2007). In the case of Blandford-Znajek mechanism of a jet production such a diversity is expected to be related to the range of values of BH spins and magnetic fluxes threading them (Blandford & Znajek, 1977). Studies of differences in spectra of RL and RQ objects may help to establish whether central accumulation of large net magnetic fluxes in RL AGN proceeds during the AGN radiatively efficient phase or prior to it (Sikora et al., 2013; Sikora & Begelman, 2013).
Comparisons of multi-band spectra of RL and RQ AGN were performed in the past for quasars (e.g. Elvis et al., 1994; Richards et al., 2006; Shang et al., 2011) and for the samples composed from broad-line radio galaxies and Seyferts (e.g. Woźniak et al., 1998; Kataoka et al., 2011). The main radiative differences noted by these studies concern the X-ray properties. In particular, the RL objects were found to have on average larger X-ray luminosities and harder X-ray spectra than the RQ ones. However noting that the objects included in the samples of compared RQ and RL objects were selected separately, that radio galaxies have on average larger BH masses and lower Eddington ratios than RQ Seyferts (e.g. McLure & Jarvis, 2004; Kozieł-Wierzbowska et al., 2017), and that the slopes of the X-ray spectra depend on the Eddington ratio (e.g. Gu & Cao, 2009; Trakhtenbrot et al., 2017; She, et al., 2018), the claimed differences might be at least partially affected by the selection methods. Trying to avoid biases resulting from separate selection of RL and RQ samples and from having RL and RQ samples with different average BH masses and Eddington ratios, we decided to carry such comparisons selecting AGN from the BAT AGN Spectroscopic Survey catalogue (BASS; Koss et al., 2017) with similar ranges of BH masses and Eddington ratios. First results of these studies were presented by Gupta et al. (2018). We have confirmed there that RL AGN are X-ray louder than RQ AGN, but did not find statistically significant difference between their X-ray spectral slopes.
In this paper we extended our comparison studies of RL and RQ AGN by covering also other than hard X-ray spectral bands and taking advantage of our sample including both Type 1 and Type 2 AGN. The latter allowed us to verify an isotropy of these radiative features, which are not expected to be affected via absorption by dusty molecular tori. This in particular concerns hard X-rays of Compton-thin AGN and narrow emission lines. Furthermore, having the RL and RQ samples divided into Type 1 and Type 2 subsamples allowed us to make sure that observed in Type 1 AGN UV radiation is dominated by AGN. In order to have reasonable sizes of statistically comparable RL and RQ Type 1 and Type 2 subsamples we had to modify our previous selection criteria. The main change is that presently we include in our sample also those AGN, which before did not have known estimations of BH masses. We calculated their masses using the relation between their BH masses and the NIR luminosities of their host galaxies (Marconi & Hunt, 2003). And in order to avoid a large scatter of BH masses estimated using different methods, the known masses of other AGN were recalculated using also this method (see Appendix A).
The work presented here is organized as follows: in Section 2 we describe procedure of selecting our sample; in Section 3 we present the results of our X-ray analysis; the Section 4 deals with multi-band studies; in Section 5 we discuss our results in the broader context of AGN phenomenon; and the main results are summarized in Section 6.
Throughout the paper we assume a CDM cosmology with , , and .
2 THE SAMPLES
The primary sample of AGN selected in this work is the same as in Gupta et al. (2018). It is taken from the BAT AGN Spectroscopic Survey (Ricci et al., 2017) and then reduced by excluding blazars and Compton-thick (log ) AGN. Such a sample, counting 664 objects, was further reduced by excluding those AGN which do not have optical spectroscopic classification in Koss et al. (2017)
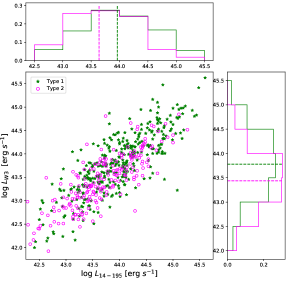
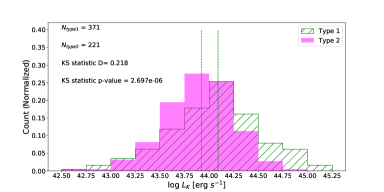
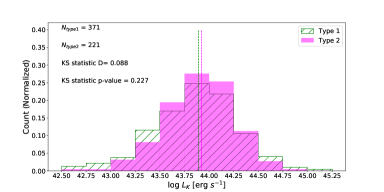
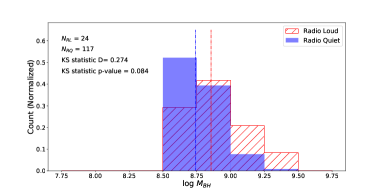
Following this we selected 394 Type 1 AGN and 232 Type 2 AGN, where the Type 1 sample includes all AGN having at least one broad Balmer emission line. All AGN in these samples have data on hard X-ray fluxes ( keV) from Swift/Burst Alert Telescope (Baumgartner et al., 2013) and on mid-IR fluxes from Wide-field Infrared Survey Explorer mission (WISE; Wright et al., 2010; Gupta et al., 2018). Distributions of their X-ray luminosities in the band keV and of mid-IR luminosities at , i.e. , are presented in Fig. 1. They are calculated from fluxes using a standard cosmological formula, but ignoring the K-corrections since the redshifts for our AGN sample are small () and the radiation spectral slopes in these bands are not very different from unity. As we can see in this figure, there is a significant overlap between the distributions of Type 1 and Type 2 AGN. It is confirmed by very low Kolmogorov-Smirnov (KS) test statistic p-values of for the X-ray luminosities and for the MIR luminosity indicating that the two data samples come from the same distribution. This reasserts the unified scheme for AGN (Urry & Padovani, 1995) and affirms that hard X-rays and MIR are both produced quasi-isotropically. As a result we can treat these properties in the Type 1 and Type 2 AGN samples uniformly.
The above Type 1 and Type 2 BAT-AGN subsamples have then been cross-matched with NVSS (National Radio Astronomy Observatory (NRAO) Very Large Array (VLA) Sky Survey; Condon et al., 1998) and SUMSS (Sydney University Molonglo Sky Survey; Bock et al., 1999; Mauch et al., 2003) radio catalogues using the same procedure as in Gupta et al. (2018). Following this we divided our samples for radio-loud (RL), radio-intermediate (RI) and radio-quiet (RQ) AGN, where the RL AGN are defined to have the radio loudness parameter and RQ AGN are defined to have .111 Note that the radio loudness defined by us is about 10 times lower than the one introduced by Kellermann et al. (1989) (see section 2.4 in Gupta et al., 2018). And the reason of using in our definition of radio loudness the MIR luminosity instead of optical luminosity is because at moderate and low accretion rates optical radiation can be significantly contaminated by the stellar radiation.
We hereafter reject from our further analysis RI AGN and those radio-undetected objects which have radio loudness upper limits . This assures of having two ‘clean’ and well contrasted subsamples, those with where radio emission is expected to be strongly dominated by powerful jets, and those with , where the total radio flux can, additionally to weak jets (Smith et al., 2016), be contributed by star-forming regions (e.g. Kimball et al., 2011), accretion disc winds (e.g. Zakamska et al., 2016), and/or accretion disc coronae (e.g. Raginski & Laor, 2016).
Noting that in the samples of AGN with smaller BH masses, the RL AGN are poorly represented (McLure & Jarvis, 2004; Kozieł-Wierzbowska et al., 2017; Gupta et al., 2018), we leave in our samples only AGN with BH masses larger than . Such BHs typically reside in giant ellipticals and their masses can be estimated by using galactic luminosities of old stellar populations (Cappellari, 2016) provided they dominate contribution to near-IR radiation (Marconi & Hunt, 2003; Graham, 2007). The latter condition is satisfied not only in Type 2 AGN, but also in Type 1 AGN if accreting at not very high rates (see e.g. Richards et al., 2006). As we demonstrate in Appendix A, near-IR luminosities of Type 1 AGN are only by a factor larger than near-IR luminosities of Type 2 AGN. Hence, after applying respective corrections, the relation can be applied also for Type 1 AGN in our sample.
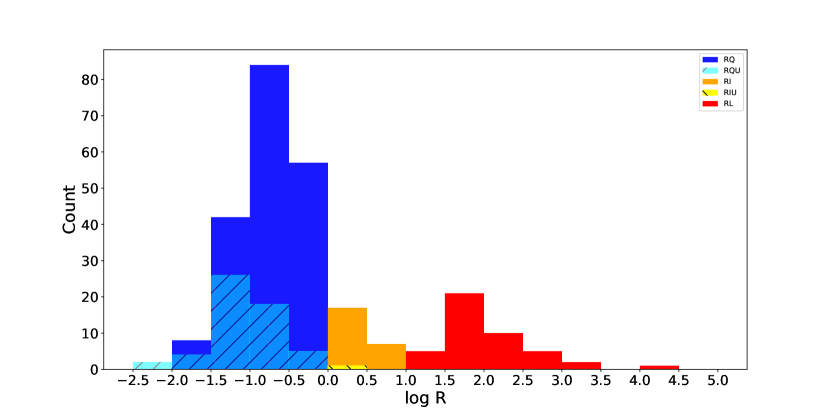
The radio loudness histogram of our final sample (i.e. after removing AGN with ) is shown in Fig. 2. The sample consists of 290 AGN (315 AGN while including RI). Its RL subset has 44 objects (27 Type 1 and 17 Type 2) and the RQ subset has 246 objects (153 Type 1 and 93 Type 2).222The complete catalogue is available as supplementary material online.
3 Comparison of X-ray Properties
3.1 X-ray loudness
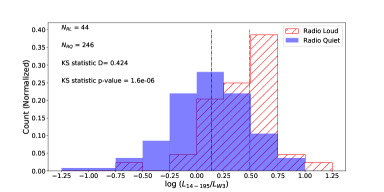
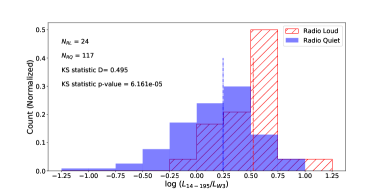
We define the X-ray loudness as the ratio of the hard X-ray luminosities in the band keV to the mid-IR luminosities at . Distributions of X-ray loudness of RL and RQ AGN are shown in Fig. 3. As we can see these distributions have similar shapes, but are shifted against each other, with the median of X-ray loudness of RL AGN being about two times larger. This is in agreement with the result found in our previous work, despite having somewhat differently selected final sample.
3.2 Isotropy of hard X-rays
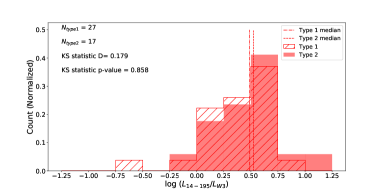
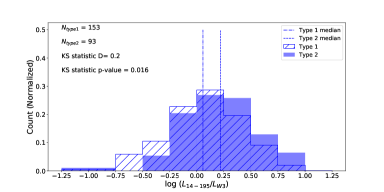
As we argued in our previous paper (Gupta et al., 2018), similar slopes of high energy spectra and of their high energy breaks in the radio-loud and radio-quiet Swift/BAT AGN suggest same location and mechanism of their production in both subsamples. Therefore the larger X-ray loudness of RL AGN may not result from contribution of jets to the hard X-ray spectra, but rather from larger efficiency of hard X-ray production in accretion flows in RL than in RQ AGN. Since the MIR radiation is expected to be isotropic (see e.g. Lusso et al., 2013), this premise can be verified by checking, whether X-ray loudness depends on the angle of view, and if yes, whether it depends similarly in case of RL and RQ AGN. This can be done by noting that the Type 1 AGN are on average observed at much smaller inclination angles than the Type 2 AGN. Results of such a test are presented in the Fig. 4(a) and 4(b). As we can see, the averaged X-ray loudness of Type 1 and Type 2 RL AGN are comparable with median values of 0.49 and 0.52 respectively. In addition their distributions are alike, a fact attested by the relatively large Kolmogorov-Smirnov (KS) test p-value of the null hypothesis being 0.858. We observe a similar trend for the RQ population with the distribution with the medians of the Type 1 and Type 2 subsets being at 0.06 and 0.22 respectively and K-S test p-value of 0.016. This strongly suggest similar regions of production of X-rays and similar underlying mechanisms in both Type 1 and Type 2 and for both the samples of RL and RQ AGN. These results strongly support our earlier premise that the X-ray emission in both RL and RQ AGN is dominated by the accretion flow and is quasi-isotropic.
3.3 X-ray colours
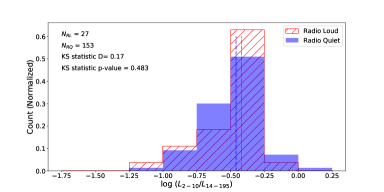
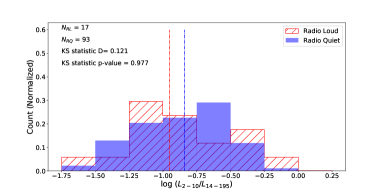
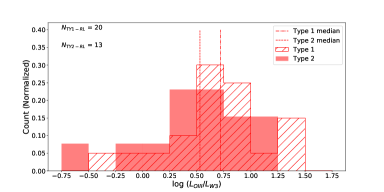
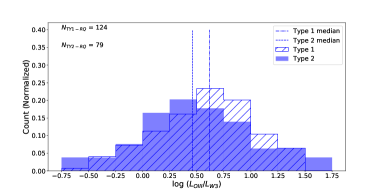
We define the X-ray colour as the ratio of X-ray luminosity in the keV band to the luminosity in the keV band – . The data for the keV was obtained from Ricci et al. (2017). Fig. 5(a) and 5(b) show the normalized distribution of the X-ray colour for the Type 1 (panel a) and Type 2 (panel b) samples. In each panel we have shown the distributions of the RL (hatched red) and RQ (filled blue) subsamples of AGN. The median values are also presented as dashed lines for each sample. For the Type 1 sample we see very similar distributions for the RL and RQ subsets which is indicated by the high K-S test p value of 0.483. Their median values of for the RL subset and for the RQ subset are comparable. We observe a similar phenomena in the Type 2 sample with RL and RQ subsample medians at and respectively and the K-S test p value of 0.977 indicating no statistically significant difference between RL and RQ AGN for either Type 1 or Type 2 populations. Note that harder X-ray colours in Type 2 RL and RQ AGN result from partial absorption of lower energy X-rays by molecular torus in Type 2 AGN.
4 Spectral Energy Distribution
We compare the SEDs of RL and RQ AGN using photometric data covering MIR, NIR, optical-UV (O-UV), and hard X-rays spectral bands. They are collected from WISE, 2MASS, GALEX, and Swift/BAT catalogues. The ways they were extracted from WISE and Swift/BAT catalogues were discussed in Section 2;
the analysis of 2MASS and GALEX data is presented below.
The NIR data for our objects have been obtained from the 2MASS (Two-Micron-All-Sky-Survey) extended (XSC) and point source (PSC) catalogues (Skrutskie et al. 2006; NASA/IPAC Infrared Science Archive), the latter for objects not having matches in XSC catalogue. We used a matching radius of 10 arcsec to determine associations with our sample.
The Galaxy Evolution Explorer (GALEX) is an orbiting space telescope observing galaxies in ultraviolet light. It imaged the sky in two ultraviolet (UV) bands, far-UV (FUV, ), and near-UV (NUV, ), delivering the first comprehensive sky surveys at these wavelengths.
Associations of GALEX sources with our objects have been performed using 2 arcsec matching radius. The UV fluxes were taken from the GALEX catalogue (Bianchi et al., 2017) as well as data from the Mikulski Archive for Space Telescopes (MAST)333https://archive.stsci.edu/missions-and-data. We decided to use GALEX data from MAST for objects that were not reported in the catalogue. We corrected for UV flux extinction in the Milky Way, using the standard relation
,
where is given by
= = {\minibox for
for }
and the Galactic reddenings in directions to associated with our AGN UV sources are provided in the GALEX catalogue.
We found 149 NUV and 131 FUV associations for Type 1 objects and 77 NUV and 61 FUV associations for Type 2 AGN.
Due to the limited angular resolution of GALEX, the UV radiation in Type 1 objects must be considered to be contributed not only by AGN but also by the hot stars in the host galaxies, in Type 2 objects – only by hot stars.
For objects which did not have a valid association we assigned upper limits of their fluxes as based on detection limit of the GALEX survey in the NUV and FUV bands. These fluxes are and for the NUV and FUV bands, respectively. The number of detection is much larger than percent for Type 1 RL and RQ AGN and close to percent for Type 2 objects. Moreover, we observe that for Type 1 sources in both the NUV and FUV bands most of the undetected sources lie below the median value of all the sources. Hence the median values of our sources are statistically significant.
]
The table 1 indicates total numbers of objects in our final sample that were detected per catalogue. The table consists of 290 AGN, 44 RL (27 type 1 and 17 type 2) and 246 RQ (153 type 1 and 93 type 2).
4.1 SED / Multi-band spectra
Having constructed our Type 1 and Type 2 RL and RQ subsets and determined the luminosity in different bands, we proceed to construct the composite SED for each of these samples. For each object in the sample, every available luminosity is normalized with respect to the Eddington luminosity. For objects which did not have a GALEX detection we applied an upper flux limit and determined the corresponding upper limit for luminosity.
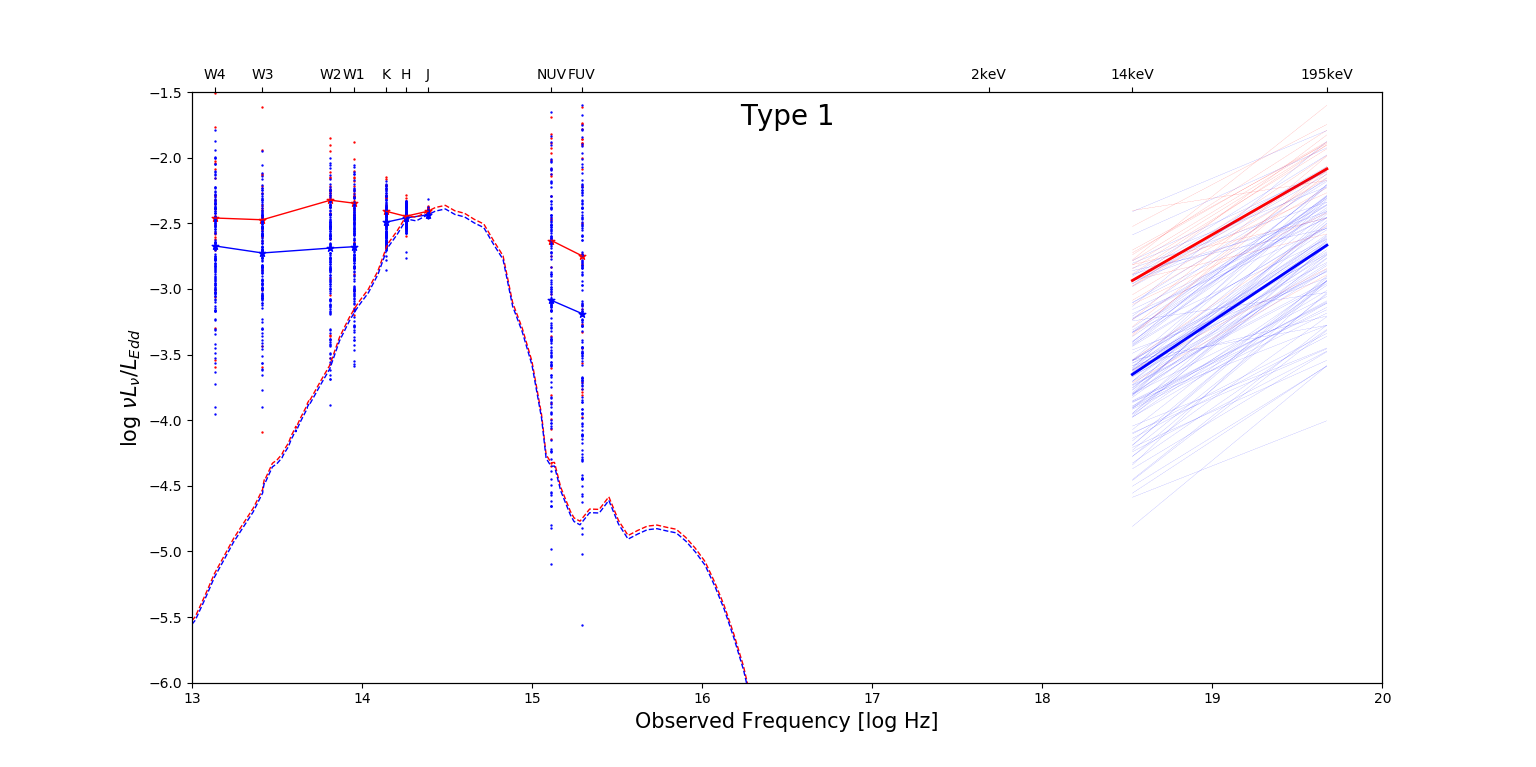
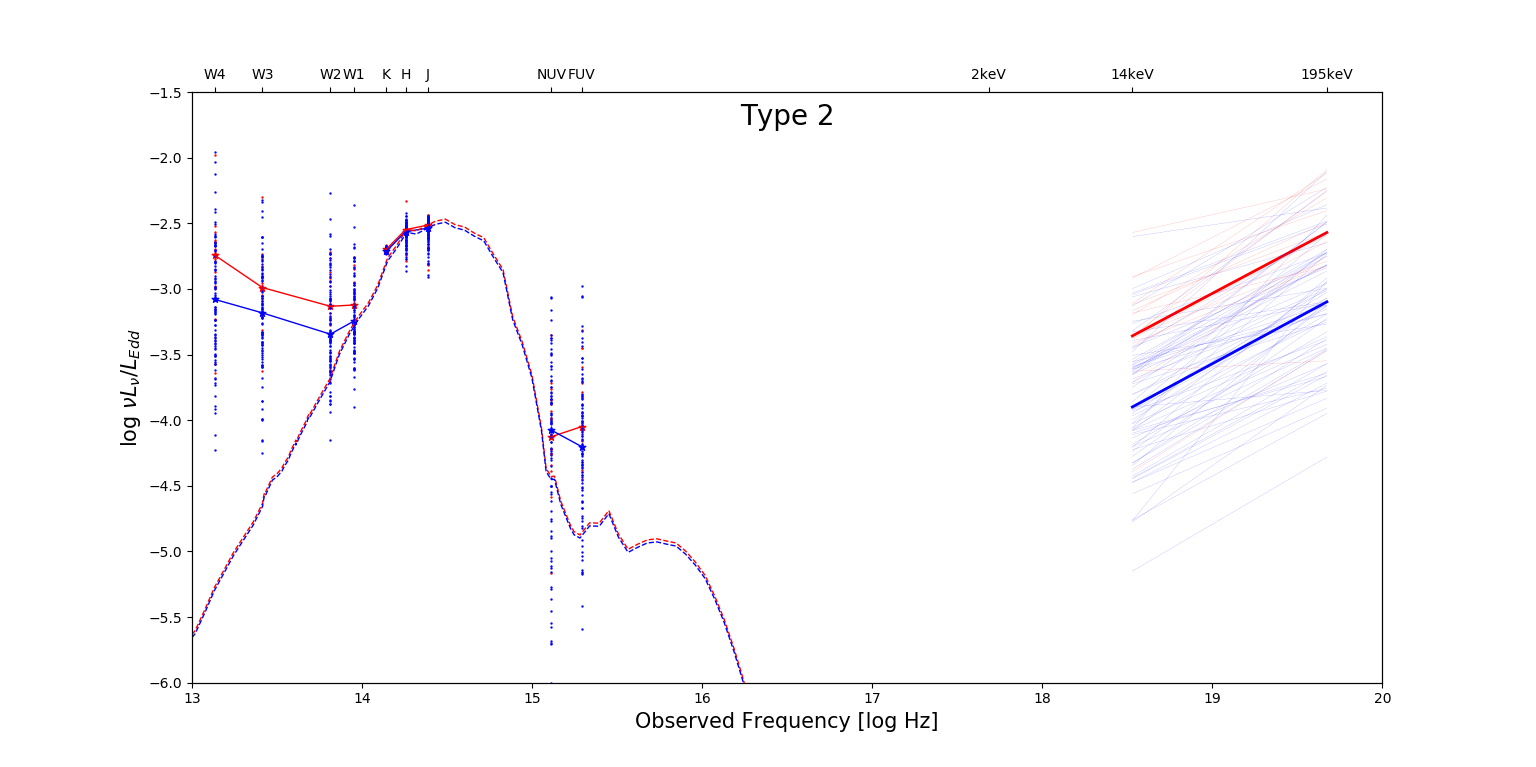
We determine the median luminosities in MIR, NIR and hard X-ray bands. In case of the UV band, the limited number of detections causes that the medians in Type 2 AGN are close to their upper limits, in case of Type 1 AGN they are ‘real’.
The median hard X-ray spectra for RL and RQ AGN are constructed combining median integrated X-ray luminosities with the median spectral slope.
We do not present in the SED figure keV spectra. The observed spectra in this band are curved and presenting all of them together in the visible fasion is rather impossible. Intrinsically they are expected to provide extension of BAT spectra with similar slopes as the BAT ones to lower energies.
We plot also in these figures templates of the giant ellipticals. They are scaled to be equal in the K band to the median luminosities of the RL and RQ samples.
The composite SEDs of Type 1 and Type 2 AGN are presented in Fig. 6 and Fig. 7, respectively. All luminosities are calculated ignoring K-corrections and, hence, presented as a function of the observed frequency. As we can see the SEDs of our objects are contributed not only by the AGN, but also by stars of galaxies hosting those AGN. The latter dominate the radiation in the NIR. And in the case of type 2 AGN and very low Eddington ratio Type 1 AGN they dominate in the optical bands as well. The non-AGN contributions can arise also in other SED portions, in particular in the MIR and UV band as provided there by star formation regions (SFRs). However their significance in the samples studied by us is rather minor: in the MIR band – because SFRs are predicted to produce much redder MIR spectra than observed in the objects of our sample (e.g. Ichikawa et al., 2017; Lyu & Rieke, 2018); and in the UV band only in Type 2 AGN – otherwise domination of UV radiation by SFR should be similar in Type 1 and Type 2 AGN, whereas our Type 1 objects are more UV luminous than Type 2 objects (see Fig. 6 and 7). Hence the SEDs of Type 1 AGN in our samples are dominated by three components, the MIR, UV and hard X-ray ones. Their relative contributions to the total observed luminosities are of the same order. This concerns both RL and RQ AGN, and statistically significant differences appear only in the X-ray band, where the RL AGN are times more luminous than the RQ ones.
| Catalogue | Type 1 | Type 2 | ||
|---|---|---|---|---|
| - | RL | RQ | RL | RQ |
| Total | 27 | 153 | 17 | 93 |
| WISE | 27 | 153 | 17 | 93 |
| 2MASS | 27 | 153 | 17 | 93 |
| Hard X-ray | 27 | 153 | 17 | 93 |
| GALEX FUV | 20 | 111 | 12 | 49 |
| GALEX NUV | 22 | 127 | 13 | 64 |
| OIII | 20 | 124 | 13 | 79 |
5 DISCUSSION
The hard X-ray emitting AGN with black hole masses selected by us are found to accrete at the rates corresponding to Eddington ratio – if not accounting for a few outliers – enclosed between and (see Appendix B and Fig. 12). They have bimodal distribution of radio loudness and a fraction of radio-loud objects is about . Further analysis of our sample including the radio morphologies of the sources, their host galaxies and their environments will be explored in our future works. The observed radiative output of RL and RQ AGN is dominated by MIR and X-ray components and the only significant difference between them is that the RL AGN are on average two times X-ray louder than their RQ counterparts. Possible interpretations of these results are discussed below.
5.1 The origin of hard X-rays in RQ and RL AGN
Production of hard X-rays is commonly interpreted as a result of comptonization of optical-UV radiation of cold accretion disk by hot electrons ( keV) in optically thin coronas (Kubota & Done, 2018, and refs. therein). Such coronas are likely heated by magnetic reconnection (Galeev et al., 1979; Beloborodov, 2017). Another possibility is that hot coronas represent central portions of accretion flows which are predicted by some models to result from conversion of the cold, optically thick and geometrically thin disks into hot, optically thin and geometrically thick inflows (Meyer & Meyer-Hofmeister, 2002; Hogg & Reynolds, 2018). Such models are often applied for AGN in which X-ray reflection features are weak and the radiative output is not dominated by UV bump (e.g. Prieto et al., 2010; Toba et al., 2019; Younes et al., 2019). However noting that weaker reflection features may result also from higher ionization of accretion disks in such AGN, while their relatively lower UV luminosities can come from extinction associated with the polar dust (see section 5.2), truncation of cold accretion disks may not be required.
Interpretation of the origin of hard X-ray is even more uncertain in case of RL AGN. Their larger X-ray loudness than of RQ ones may suggest that X-rays in these objects are partially contributed by the jet base (e.g. Woźniak et al., 1998). However, as we noticed in our previous paper (Gupta et al., 2018), despite the difference in the X-ray loudness, the spectral slopes and high energy breaks are very similar in RL and RQ AGN selected to have similar BH masses and Eddington ratios. We used this as an argument in favor of the same location and same emission mechanism of hard X-ray sources in RL and RQ AGN, the location being the hot corona in the innermost portions of accretion flow and the mechanism – Compton up-scattering of lower energy disk photons. In this paper we explore such interpretation by taking advantage of having in our samples Type 1 and Type 2 AGN which allows us to verify dependence of the X-ray radiation luminosity on the inclination angle. We carried out such verification by comparing distributions of X-ray–to–MIR luminosity (Fig. 3, Fig. 4(a) and Fig. 4(b)). They are found to be very similar for Type 1 and type 2 AGN for both RL and RQ AGN, which suggests that the departure of hard X-rays from the isotropy is statistically insignificant. The isotropy indicates also that X-ray sources in both RQ and RL AGN cannot be too compact, otherwise their isotropy would be strongly affected by gravitational lensing. If trying to interpret the larger X-ray loudness of RL AGN by the jet contribution, this would require tight tuning of parameters discribing the geometry and kinematics of a jet. Furthermore, production of X-rays by a slow jet with similar luminosity as by accretion flow would imply that most of the jet energy required to efficiently power the radio lobes is dissipated and radiatively lost already at the base. Hence, we are tempted to speculate that in both RQ and RL AGN production of X-rays is dominated by hot coronae associated with central portions of accretion flows and that more efficient X-ray production in RL AGN result from larger magnetization of innermost portions of accretion flows and from larger BH spins which are required to afford efficient jet production in the MAD scenario involving the Blandford-Znajek mechanism.
5.2 UV luminosities and the ‘polar’ dust
Having reprocessed UV radiation of accretion disk to MIR radiation in dusty molecular tori and assuming absence of dust in ionization cones (the zone not protected against the UV radiation by the torus) one might expect to get the ratio of MIR to O-UV luminosity of the order CF , where and are the numbers of Type 1 AGN and Type 2 AGN, respectively (Gupta et al., 2016, and refs therein). We note that in our sample the latter ratio is 0.38, while integrated mid-IR luminosity reaches or even exceeds UV luminosities of Type 1 AGN. This strongly implies that a significant fraction of UV radiation is extincted and reprocessed into IR radiation by the dust located within the ionization cone. Presence of such, commonly called, polar dust is theoretically predicted to be common in the AGN accreting at moderate rates, and this is because at such rates the pressure of UV radiation is too small to protect the ionization zone against the dust (Hönig et al., 2013; Hönig & Kishimoto, 2017; Ricci et al., 2017; Lyu & Rieke, 2018). Existence of the polar dust is observationally confirmed by mid-IR interferometric observations (Horst et al., 2009; Gandhi et al., 2009; Kishimoto et al., 2011; Tristram & Schartmann, 2011; López-Gonzaga et al., 2016). They show the extension of mid-IR images along the ionization cones.
Comparing the UV fluxes of our RL and RQ Type 1 AGN (Fig. 6) we can see that UV is less extincted in RL objects. This may result from smaller amount of dust in the vicinity of powerful jets. However this result is statistically weak and need confirmation by future studies using larger samples.
We also compared luminosities of [OIII] lines. We make use of the [OIII] emission line flux from Koss et al. (2017) derived from the SDSS spectra. For both RL and RQ AGN they are found on average stronger in Type 2 objects than in Type 1 AGN (Fig. 8(a) and 8(b)). This difference can be explained by the polar gradient of the dust distribution within the ionization zone. Since the fraction of detection of [OIII] is larger than 50 percent for both Type 1 and Type 2 RL and RQ AGN, the median values of our sources are real for the entire sample (see Section 4).
6 SUMMARY
We summarize our results as follows:
– AGN selected from the Swift/BAT catalogue with black hole masses have bimodal distribution of radio loudness. Medians of radio loudness distribution of RL and RQ AGN differ by a factor , and the radio-loud-fraction is ;
– The only statistically signifcant difference between SEDs of RL and RQ AGN are larger X-ray luminosities in the former class. The isotropy of X-ray luminosities implied by our study in both RL and RQ AGN from finding that hard X-ray-to-MIR luminosity ratios in Type 1 and Type 2 AGN do not differ seems to disfavor explanation of this difference by postulating the jet contribution to hard X-rays in RL AGN. Together with previous findings that slopes and high energy breaks of their hard X-ray spectra are on average very similar in both RL and RQ AGN, it appears to support our premise that in both samples the hard X-ray are produced in hot central portions of accretion flows and that luminosity difference can be associated with having faster rotating BHs and larger magnetic fluxes in AGN producing jets;
– The radiative output of both RL and RQ AGN is dominated by radiation in the MIR and hard X-ray bands. Their observed UV luminosities are likely to be suppressed due to extinction. Lower UV luminosities as compared with those predicted by standard accretion disk models can also result from the accretion disk truncation. However this alone cannot explain MIR luminosities larger than .
Acknowledgements
We thank Greg Madejski for his comments which helped us improve the paper. We acknowledge financial support by the Polish National Science Centre grants 2016/21/B/ST9/01620 and 2017/25/N/ST9/01953.
References
- Baumgartner et al. (2013) Baumgartner, W. H., Tueller, J., Markwardt, C. B., et al. 2013, ApJS, 207, 19
- Beloborodov (2017) Beloborodov, A. M. 2017, ApJ, 850, 141
- Bianchi et al. (2017) Bianchi, L., Shiao, B., & Thilker, D. 2017, ApJS, 230, 24
- Blandford & Znajek (1977) Blandford, R. D., & Znajek, R. L. 1977, MNRAS, 179, 433
- Bock et al. (1999) Bock, D. C.-J., Large, M. I., & Sadler, E. M. 1999, AJ, 117, 1578
- Cappellari (2016) Cappellari M., 2016, ARA&A, 54, 597
- Condon et al. (1998) Condon, J. J., Cotton, W. D., Greisen, E. W., et al. 1998, AJ, 115, 1693
- Elvis et al. (1994) Elvis, M., Wilkes, B. J., McDowell, J. C., et al. 1994, ApJS, 95, 1
- Galeev et al. (1979) Galeev, A. A., Rosner, R., & Vaiana, G. S. 1979, ApJ, 229, 318
- Gandhi et al. (2009) Gandhi, P., Horst, H., Smette, A., et al. 2009, A&A, 502, 457
- Graham (2007) Graham, A. W. 2007, MNRAS, 379, 711
- Gu & Cao (2009) Gu, M., & Cao, X. 2009, MNRAS, 399, 349
- Gupta et al. (2016) Gupta, M., Sikora, M., & Nalewajko, K. 2016, MNRAS, 461, 2346
- Gupta et al. (2018) Gupta, M., Sikora, M., Rusinek, K., & Madejski, G. M. 2018, MNRAS, 480, 2861
- Hogg & Reynolds (2018) Hogg, J. D., & Reynolds, C. S. 2018, ApJ, 854, 6
- Hönig et al. (2013) Hönig, S. F., Kishimoto, M., Tristram, K. R. W., et al. 2013, ApJ, 771, 87
- Hönig & Kishimoto (2017) Hönig, S. F., & Kishimoto, M. 2017, ApJ, 838, L20
- Horst et al. (2009) Horst, H., Duschl, W. J., Gandhi, P., & Smette, A. 2009, A&A, 495, 137
- Ichikawa et al. (2017) Ichikawa, K., Ricci, C., Ueda, Y., et al. 2017, ApJ, 835, 74
- Kataoka et al. (2011) Kataoka, J., Stawarz, Ł., Takahashi, Y., et al. 2011, ApJ, 740, 29
- Kellermann et al. (1989) Kellermann, K. I., Sramek, R., Schmidt, M., Shaffer, D. B., & Green, R. 1989, AJ, 98, 1195
- Kimball et al. (2011) Kimball, A. E., Kellermann, K. I., Condon, J. J., Ivezić, Ž., & Perley, R. A. 2011, ApJ, 739, L29
- Kishimoto et al. (2011) Kishimoto, M., Hönig, S. F., Antonucci, R., et al. 2011, A&A, 536, A78
- Koss et al. (2017) Koss, M., Trakhtenbrot, B., Ricci, C., et al. 2017, ApJ, 850, 74
- Kozieł-Wierzbowska et al. (2017) Kozieł-Wierzbowska, D., Vale Asari, N., Stasińska, G., et al. 2017, ApJ, 846, 42
- Kubota & Done (2018) Kubota, A., & Done, C. 2018, MNRAS, 480, 1247
- López-Gonzaga et al. (2016) López-Gonzaga N., Burtscher L., Tristram K. R. W., Meisenheimer K., Schartmann M., 2016, A&A, 591, A47
- Lusso et al. (2013) Lusso, E., Hennawi, J. F., Comastri, A., et al. 2013, ApJ, 777, 86
- Lyu & Rieke (2018) Lyu, J., & Rieke, G. H. 2018, ApJ, 866, 92
- Marconi & Hunt (2003) Marconi, A., & Hunt, L. K. 2003, ApJ, 589, L21
- Marconi et al. (2004) Marconi, A., Risaliti, G., Gilli, R., et al. 2004, MNRAS, 351, 169
- Mauch et al. (2003) Mauch, T., Murphy, T., Buttery, H. J., et al. 2003, MNRAS, 342, 1117
- McLure & Jarvis (2004) McLure, R. J., & Jarvis, M. J. 2004, MNRAS, 353, L45
- Meyer & Meyer-Hofmeister (2002) Meyer, F., & Meyer-Hofmeister, E. 2002, A&A, 392, L5
- Prieto et al. (2010) Prieto, M. A., Reunanen, J., Tristram, K. R. W., et al. 2010, MNRAS, 402, 724
- Raginski & Laor (2016) Raginski, I., & Laor, A. 2016, MNRAS, 459, 2082
- Ricci et al. (2017) Ricci, C., Trakhtenbrot, B., Koss, M. J., et al. 2017, ApJS, 233, 17
- Ricci et al. (2017) Ricci, C., Trakhtenbrot, B., Koss, M. J., et al. 2017, Nature, 549, 488
- Richards et al. (2006) Richards, G. T., Lacy, M., Storrie-Lombardi, L. J., et al. 2006, ApJS, 166, 470
- Shang et al. (2011) Shang, Z., Brotherton, M. S., Wills, B. J., et al. 2011, ApJS, 196, 2
- She, et al. (2018) She R., Ho L. C., Feng H., Cui C., 2018, ApJ, 859, 152
- Sikora et al. (2007) Sikora, M., Stawarz, Ł., & Lasota, J.-P. 2007, ApJ, 658, 815
- Sikora & Begelman (2013) Sikora, M., & Begelman, M. C. 2013, ApJ, 764, L24
- Sikora et al. (2013) Sikora, M., Stasińska, G., Kozieł-Wierzbowska, D., Madejski, G. M., & Asari, N. V. 2013, ApJ, 765, 62
- Silva et al. (1998) Silva, L., Granato, G. L., Bressan, A., & Danese, L. 1998, ApJ, 509, 103
- Smith et al. (2016) Smith, K. L., Mushotzky, R. F., Vogel, S., et al. 2016, ApJ, 832, 163
- Skrutskie et al. (2006) Skrutskie, M. F., Cutri, R. M., Stiening, R., et al. 2006, AJ, 131, 1163
- Stern & Laor (2012) Stern, J., & Laor, A. 2012, MNRAS, 423, 600
- Toba et al. (2019) Toba, Y., Ueda, Y., Matsuoka, K., et al. 2019, MNRAS, 484, 196
- Trakhtenbrot et al. (2017) Trakhtenbrot, B., Ricci, C., Koss, M. J., et al. 2017, MNRAS, 470, 800
- Tristram & Schartmann (2011) Tristram K. R. W., Schartmann M., 2011, A&A, 531, A99
- Urry & Padovani (1995) Urry, C. M., & Padovani, P. 1995, PASP, 107, 803
- Woźniak et al. (1998) Wozniak, P. R., Zdziarski, A. A., Smith, D., Madejski, G. M., & Johnson, W. N. 1998, MNRAS, 299, 449
- Wright et al. (2010) Wright, E. L., Eisenhardt, P. R. M., Mainzer, A. K., et al. 2010, AJ, 140, 1868-1881
- Younes et al. (2019) Younes, G., Ptak, A., Ho, L. C., et al. 2019, ApJ, 870, 73
- Zakamska et al. (2016) Zakamska, N. L., Hamann, F., Pâris, I., et al. 2016, MNRAS, 459, 3144
Appendix A Estimations
As it is stated in Section 1, BH masses of all AGN in our sample are calculated
using method which is based on the relation between luminosities of host
galaxies and black hole masses (Marconi & Hunt, 2003; Graham, 2007).
We adopted the formula from Graham (2007)
where is the absolute K-band magnitude of the galaxy.
This method can be directly applied for Type 2 AGN, where AGN contribution to near-IR is negligible if any. Using this formula for Type 1 AGN needs to be assured that contribution of AGN radiation to near-IR is much smaller than of the host galaxy. While it is not the case in high accretion rate objects such as quasars, for AGN accreting at rates corresponding with Eddington ratio smaller than the domination of the near-IR luminosities by the host galaxies is well documented (Prieto et al., 2010; Stern & Laor, 2012). Nevertheless since some contribution from AGN is unavoidable, in order to minimize overestimation of BH masses in Type 1 AGN by ignoring it, the K-luminosity used in Graham’s formula is not taken directly from observations but derived from J-luminosity using the template of giant elliptical (Silva et al., 1998).
This leads to lowering the BH mass overestimation because AGN contribution to near-IR is larger in K-band than in J-band. Following this procedure the difference between median values of K-luminosity distributions in Type 1 and Type 2 AGN dissapears (see Fig. 9 and 10). This is as predicted by the Unified Scheme (Urry & Padovani, 1995) and having strongly dominated near-IR luminosity by host galaxies.
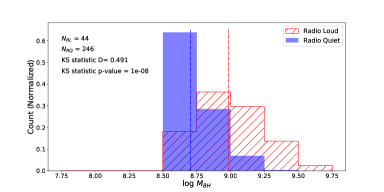
Fig. 11 shows the black hole mass distribution of RL and RQ AGN. Also presented in the figure are the median values of each population.
Appendix B Bolometric luminosities and Eddington ratio
The SEDs of Type 1 AGN are usually dominated by optical-UV, hard X-ray, and MIR components, where the latter can be contributed by dust in the molecular torus as well, as by the polar dust. When amount of the latter is too small to extinct significantly optical-UV radiation, then the bolometric luminosity, defined to be equal to amount of energy produced by the accretion flow per unit of time, is a sum of only two first components. Situation complicates if extinction by the polar dust is not negligible and leads to conversion of some portion of optical-UV radiation to the IR-band. In such a case the bolometric luminosity is given by formula , where , and is the infrared radiation produced in the polar zone. Since the observed MIR luminosity is the sum of MIR emitted in the polar region and in the torus, in order to calculate we need to know what fraction of the total IR luminosity is produced in the polar zone. This could be evaluated from extinction measurements using decrements of narrow emission lines. However the fraction of objects in our sample for which such data are available is very small. Fortunately, we can avoid this problem if noting that the fraction of optical-UV radiation converted to MIR in the circumnuclear molecular torus is . Then noting that infrared luminosity produced by torus is and that the bolometric luminosity can be approximated by formula
Then the bolometric luminosities of all objects in our sample of Type 1 AGN can be calculated individually using following approximations
,
(Note that the intrinsic hard X-ray spectra are approximated by extension of the 14-195 keV BAT spectra down to 1 keV),
,
.
Note that same values of numerical coefficients in formula for and for are accidental. For the IR luminosity it comes from assumption that the IR spectrum have an energy flux index and is enclosed between and , for the O-UV luminosity adopting the template of the spectrum in this band from Marconi et al. (2004).
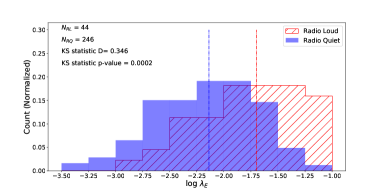
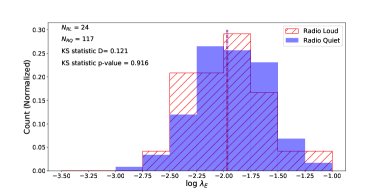
The distribution of the Eddington ratio, , for the whole sample is shown on Fig. 12 and is within the range of . Also presented in the figure are the median values of each population.
Appendix C Redshift selected sample
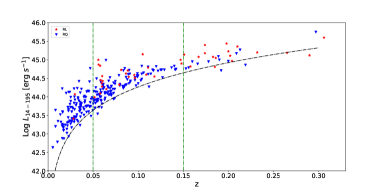
Results of our comparisons of RL and RQ AGN are expected to be biased by having them selected from pretty broad range of redshift (). Since RQ AGN have larger extension of Eddington ratios and of BH masses to lower values than RL AGN, some differentiation of radiative properties of RL and RQ objects can be contributed by having on average RL AGN more luminous than RQ AGN. We verify whether this can explain the difference between X-ray loudness of RL and RQ AGN by limiting our samples to the redshift range (Fig. 13). As we can see comparing Fig. 14 and 15 with Fig. 11 and 12, within this redshift range RL and RQ AGN have very similar distributions and ranges of BH masses and Eddington ratios. For these samples the difference in X-ray loudness dropped, but only by a factor 1.16 (from 2.2 down to 1.9, compare Fig. 3 and 16). This indicates that the difference in X-ray loudness between RL and RQ AGN is real rather than imposed by the selection effects.
Appendix D Catalogue
The complete catalogue is available as supplementary material online. Table 2 gives a brief description of the columns in the catalogue.
| Column Name | Unit | Description |
|---|---|---|
| Name | Counterpart name from Swift/BAT catalogue of AGN | |
| RA | deg | Counterpart RA coordinates from Swift/BAT catalogue of AGN |
| DEC | deg | Counterpart DEC coordinates from Swift/BAT catalogue of AGN |
| z | Redshift | |
| Log of the radio loudness | ||
| Radio_class | Radio classification of object (RL/RQ) | |
| Optical_type | Optical classification | |
| log_MBH | BH mass determined from K-band luminosity | |
| log_Eddington_ratio | Eddington ratio | |
| log_NH | Column density | |
| WISE Luminosity at | ||
| WISE Luminosity at | ||
| WISE Luminosity at | ||
| WISE Luminosity at | ||
| 2MASS Luminosity at | ||
| 2MASS Luminosity at | ||
| 2MASS Luminosity at | ||
| GALEX Luminosity at | ||
| presented is an upper limit | ||
| GALEX Luminosity at | ||
| presented is an upper limit | ||
| X-ray Luminosity in the keV band | ||
| X-ray Luminosity in the keV band | ||
| Gamma_14_195 | Photon index in the X-ray band keV |