Two functionals approach in DFT for the prediction of thermoelectric properties of Fe2ScX (X = P, As, Sb) full Heusler compounds
Abstract
In the quest of new thermoelectric materials with high power factors, full-Heusler compounds having flat band are found to be promising candidates. In this direction, Fe2ScX (X=P,As,Sb) compounds are investigated using mBJ for the band gap and SCAN to describe the electronic bands and phonon properties for thermoelectric applications. The band gaps obtained from mBJ are 0.81 eV, 0.69 eV and 0.60 eV for Fe2ScX compounds, respectively. The phonon dispersion, phonon density of states (DOS) and partial DOS are calculated. The phonon contributions to specific heat are obtained as a function of temperature under harmonic approximation. The electronic band structutre calculated from mBJ and SCAN functionals are qualitatively compared. The effective mass values are calculated at the band extrema from SCAN functional. The thermoelectric parameters are calculated for both hole and electron dopings under semiclassical theory. We use simple, but reasonable method to estimate the phonon relaxation time (). Using the specific heat, estimated and slopes (phase velocity) of acoustic branches in the linear region, lattice thermal conductivity () at 300 K is calculated for three compounds. The obtained values of with constant are 18.2, 13.6 and 10.3 , respectively. Finally, the temperature dependent figure of merit values are calculated for optimal carrier concentrations in the doping range considered, to evaluate the materials for thermoelectric application. The values for n-type Fe2ScX, in 900-1200 K, are 0.34-0.43, 0.40-0.48 and 0.45-0.52, respectively. While, the p-type Fe2ScX have of 0.25-0.34, 0.20-0.28 and 0.18-0.26, respectively in the same temperature range. The values suggest that, Fe2ScX compounds can be promising materials in high temperature power generation application on successful synthesis and further reduction by methods like nanostructuring.
I Introduction
The development of materials which can extract the heat energy and transform it into electrical energy is an important area of research.Gorai et al. (2017); Tritt and Subramanian (2006) Since, devices made out of such materials can be installed at automobile heat generating parts, to convert the industrial waste heat, in home heating appliances, etc. Those materials are termed thermoelectric (TE) materials and device fabricated using them are called thermoelectric generators (TEG).Yang et al. (2016) Research in the area of developing TE materials is important since they can be a very good alternative energy sources in many small scale applications. TEGs are green energy sources compared to the conventional fossil fuel based energy sources. The TE materials with dimensionless figure of merit 1.0 are considered as suitable for TE applications. But, the bottle neck in implementing the most of the existing TE materials into technological applications is due to their poor value of . Therefore, there has been continuous efforts in TE area of research to enhance the efficiency as well as in searching for new TE materials.
Efficiency of a thermoelectric can be increased by maximizing it’s electrical power and by reducing the heat transport by electrons and phonons. The electrical power depends on the electrical conductivity,, and Seebeck coefficient,, of the material.Yang et al. (2016) The transport of heat in a material is decided by the electronic and phonon contributions to thermal conductivity. Thus, in order to have a thermoelectric with high figure of merit, given by the relation,
| (1) |
the power factor, must be higher and thermal conductivity =+ should be lower. The thermal conductivity in a material is a sum of electronic and lattice part of thermal conductivities denoted by and , respectively. Many methods like alloying, nanostructuring are employed to reduce the lattice thermal conductivity by increasing phonon scattering without or least affecting it’s electronic structure.Snyder and Toberer (2008) Another method towards improving efficiency is to improve the power factor of the material. The power factor of a material is mainly decided by it’s electronic structure and such materials are being searched which could have electronic structure that yields high power factor.Mahan and Sofo (1996)
The studies of electronic structure and thermoelectric properties carried out on many Heusler alloys suggested that, they possess a flat conduction band along direction and hence larger effective mass of carriers and higher Seebeck coefficient values.Sharma and Pandey (2014a); Yabuuchi et al. (2013); Barth et al. (2011, 2010) These works suggested that full-Heusler alloys with a semiconducting ground states could be used for thermoelectric applications. Sharma et al. Sharma and Pandey (2014b) reported three new full-Heusler alloys having flat conduction band viz. Fe2ScP, Fe2ScAs and Fe2ScSb with their electronic structure and thermoelectric properties using density functional theory (DFT) calculations. In a DFT calculation, generally band gaps are underestimated and Fe2ScSb compound in the work of Ref.10 was predicted to be a semimetal. The transport coefficients to be calculated in first-principles calculations are highly dependent on the band gap and band structure of the compound. The electronic structure changes depending on the exchange-correlation (XC) functional used in the DFT calculations. Therefore, in the computational discovery of thermoelectric materials, selection and benchmarking of XC functional becomes an important step.
In our previous work Shastri and Pandey (2018a), electronic structure of two iron based Heusler alloys Fe2VAl and Fe2TiSn were studied using five XC functionals. The effective mass values estimated showed the dependence of band features on XC functionals and usefulness of mBJ in predicting accurate band gaps providing a bench mark study. In semiconductors and insulators, transport of heat is mainly through the phonons and thus study of phonon properties is important to understand the thermal conductivity. The phonon calculations are useful in extracting information about stability of the crystal, lattice contribution to specific heat and other thermal properties, and thermal expansion of crystals. A computational study of phonon dispersion of a material along with it’s electronic structure would completely describe TE material which makes phonon calculations, desirable in a study of TE properties. Recently, in the work of Shamim et al.,Sk et al. (2018) the Seebeck coefficient value of Fe2VAl was measured in the range 300-620 K. This experimental values were explained using DFT and Boltzmann transport calculations using different XC functionals. The best matching between the experimental and theoretical values was found, for using the band gap obtained from mBJ and band structure from SCAN or PBEsol. Therefore, motivated by the results of the work of Shamim et alSk et al. (2018), we investigate the electronic structure and thermoelectric properties of the Fe2ScX (X=P, As, Sb) compounds.
To investigate the electronic structure and dependent properties mBJ and SCAN functionals are used. Using the mBJ, band gaps of 0.81, 0.69 and 0.60 are obtained for Fe2ScX (X=P, As, Sb) compounds, respectively. Using SCAN, phonon dispersion , total density of states (DOS) and partial DOS are also calculated. The specific heat contribution from the lattice part of compounds are calculated. The Debye temperatures estimated from the highest phonon frequency for three compounds are 637 K, 556 K and 498 K, respectively. Seebeck coefficient, electrical conductivity per relaxation time, power factor per relaxation time and electronic thermal conductivity per relaxation time are calculated with temperature for different values of electron and hole dopings. The effective mass values are calculated at the band extrema. The electronic band structures obtained from mBJ and SCAN are qualitatively compared. We make use of simple method in this work to estimate phonon relaxation time . Using calculated specific heat, and slopes of acoustic branches in the linear region close to , values at 300 K are calculated. Then to further evaluate the material for TE applications, we calculate temperature dependent for three compounds for the highest power factor giving electron and hole doping concentrations.
II Computational details
In our work, full-potential linearized augmented plane wave (FP-LAPW) method based first-principles DFT program WIEN2kBlaha et al. (2001) is used for the calculation of ground state energy, electronic strcture and total forces on atoms. mBJ exchange potential with LDA correlationTran and Blaha (2009) and SCANSun et al. (2015) exchange-correlation functionals are chosen for the calculations. Here, The lattice parameters are taken from the Ref. 10 and used for electronic properties calculation. Since, phonon frequency is sensitive to the lattice parameter, it is optimized for force calculations with SCAN functional . For force constants and phonon properties calculations phonopyTogo and Tanaka (2015) code is used. Phonon properties are calculated under finite displacement method (FDM) and supercell approach in phonopy. To capture the long-range force constant between atoms a supercell of size 2 x 2 x 2 with 128 atoms is constructed. To create the forces artificially in the system each of inequivalent atoms in the formula unit of Fe2ScX is displaced by 0.02 Bohr in x-direction. To obtain the forces on the atoms in the created supercell, force convergence criteria of 0.1mRy/Bohr is set in the force calculator (WIEN2k). A k-mesh of size 5 x 5 x 5 is used for the force calculations in supercell. The calculations of band structure dependent transport coefficients are done using BoltzTraP program.Madsen and Singh (2006) The ground state total energy calculations are done on dense k-mesh of 50 x 50 x 50 size in order to facilitate transport calculations. The convergence criteria to meet the self-consistency in iterations for total energy 10-4 Ry/cell and for charge/cell is 10-2 electronic charges, respectively are used.
III Results and Discussion
We built the crystal structure of Fe2ScX (X=P, As, Sb) full-Heusler compounds in the cubic L21 phase with sapce group Sharma and Pandey (2014b). In Ref. 10 the ground state formation energy of the static lattices have been calculated. The obtained negative values of formation energies supported the feasibility of synthesis of Fe2ScX (X=P, As, Sb) in laboratories. Further, to study the structural stability of the compounds we have carried out phonon calculations. The phonon frequencies are sensitive to lattice parameter and exchange-correlation functionalSkelton et al. (2015) used in the computation (which was also observed in our previous work.Shastri and Pandey (2018b)) Therefore, the lattice parameters taken from Ref. 10 were optimized to get the ground state lattice parameters for SCAN functional. The equilibrium lattice parameters after fitting the B-M EOSBirch (1947) for the energy-volume curves are 5.704, 5.828, and 6.085 Å for Fe2ScP, Fe2ScAs and Fe2ScSb, respectively. Using these lattice parameters from SCAN phonon dispersion, density of states (DOS) and electronic dispersions are studied.
III.1 Phonon properties
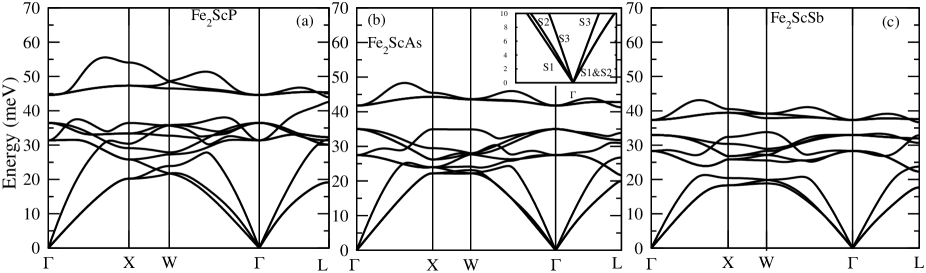
The phonon dispersions for Fe2ScX (X=P, As, Sb) compounds are presented in Fig. 1(a) to (c). The calculated phonon spectrum does not show any negative frequency (or energy) which suggests that crystal is stable for any small atomic displacements about the mean position. Dynamical stability of the compounds found out with phonon calculations and formation energy values from Ref. 10 further supports the possibility of preparation of samples in laboratories.
In the figure, one can observe that maximum phonon energy is decreasing from Fe2ScP to Fe2ScSb. The highest energy phonons are of 55, 48 and 43 meV for Fe2ScP, Fe2ScAs and Fe2ScSb, respectively. The observed decreasing trend in phonon frequency can be mainly due to the following reasons. The radius of atoms X (P, As, Sb) in the unit cell of Fe2ScX is increasing from P to Sb making distance between atoms and hence, the lattice constant to increase from Fe2ScP to Fe2ScSb. Also, the X atoms in the unit cell are heavier in mass on going from P to Sb. Since, the mass of atoms and distance between them are increased the frequency of vibrations of atoms is expected to reduce from first to last compound in the Fe2ScX family. The phonon properties and electronic structure for Fe2ScAs are discussed in our earlier work Shastri and Pandey but, to study the family of Fe2ScX with X = P, As, Sb atoms for thermoelectric applications, we included Fe2ScAs here, for the purpose of completeness in the discussion.
The phonon dispersion for Fe2ScP in Fig. 1 (a) shows three acoustic branches, out of which one branch is degenerate with optical branch at k-points nearer to -point in the - direction. Three optical branches starting at 45 meV are well seperated from the rest of the branches along the k-path directions shown in the plot except near -point, around 43 meV, where the seperation is very much reduced (0.14 meV). This seperation is also noted in the dispersions of Fe2ScAs and Fe2ScSb. In Fe2ScAs above 40 meV and in Fe2ScSb above 35 meV optical branches with clear seperation are situated. In case of Fe2ScSb, optical and acoustic branches are touching only near -point at 22 meV unlike in other two compounds. From phonon dispersion we can also observe that the maximum energy for acoustic phonons in a given compound is reducing from Fe2ScP to Fe2ScSb.
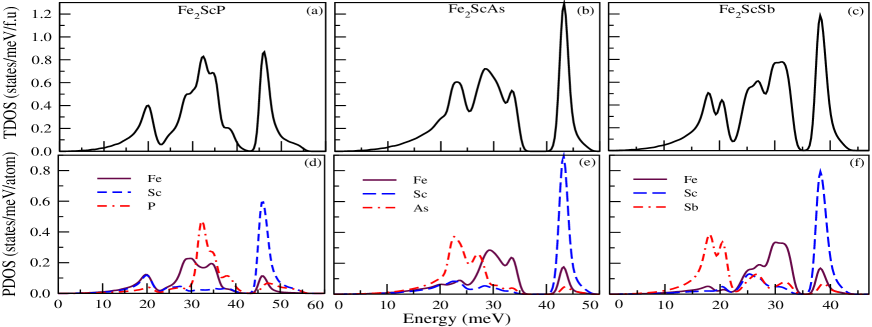
Fig. 2(a)-(c) and (d)-(f) show the calculated phonon total density of states (TDOS) and partial DOS for Fe2ScX (X=P, As, Sb), respectively. From the atom specific phonon DOS of Fe2ScP (Fig. 2(d)), we can see that higher energy optical phonon branches (45-55 meV) are contributed mainly from Sc atom. The considerable number of states for phonons due to the vibrations of lighter mass P atom is in the energy range 30-40 meV. The lower energy acoustic phonons in the range 10-22 meV are mainly due to the Sc and Fe atoms in the unit cell. The contributions to different branches in the phonon dispersion from the atoms in the unit cell of Fe2ScAs can be understood from phonon PDOS in Fig. 2(e). The higher energy states of optical phonons in 40-50 meV are mainly contributed from lighter Sc atom in the formula unit. The major number of vibrational states lying in the intermediate energy region 25-30 meV can be attributed to Fe and As atoms. For Fe2ScSb, TDOS and PDOS of phonon states are shown in Fig. 2(c) and (f), respectively. The heavier Sb atom is contributing considerably to the phonon states in 10-22 meV region. Like in the case of Fe2ScAs, there is a small region in the neighborhood of 35 meV with no phonon states. The higher energy states of optical phonon states (36-43 meV) are primarily due to the Sc atoms (Fig. 2(f)). Fe atom contribution is mainly to phonons of energy 22-34 meV. The vibrational contribution of atoms X (X=P, As, Sb) in the unit cell of Fe2ScX is shifting towards to the phonons of lower energy on crossing to Fe2ScSb from Fe2ScP. The increase in the atomic mass of X elements as well as increase in lattice constant mainly being the reason for this observed shift. But, in all the three cases the peaks in the higher energy range in DOS plots corresponding to three optical branches are substantially due to vibrations of the Sc atom.
| Functional | Fe2ScP | Fe2ScAs | Fe2ScSb |
|---|---|---|---|
| mBJ | 0.81 | 0.69 | 0.60 |
| SCAN | 0.31 | 0.14 | 0.06 |
| PBEsol | 0.30 | 0.09 | - |
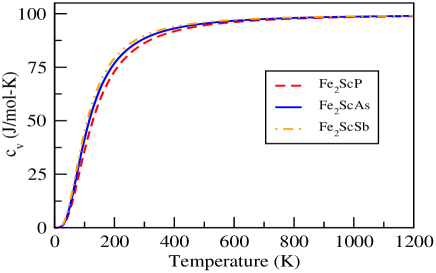
The lattice contributions to the constant volume specific heat of Fe2ScX compounds calculated under harmonic approximation are shown in Fig. 3. At higher temperatures (above 800 K) curves are approaching the classical Dulong and Petit limit of 100 J/mol-K for Fe2ScX compounds. At any temperature, one can see that values for Fe2ScSb Fe2ScAs Fe2ScP compound. The lattice part of thermal conductivity is directly proportional to and hence calculation of is essential for an estimation of of a TE material. From the nature of the curves, one can estimate that at higher temperatures the differences in of Fe2ScX compounds should be mainly due to group velocity and phonon relaxation time rather than due to which are closer to each other in this case. Considering the definition of Debye frequency as a measure of the maximum phonon frequency and Debye temperature, , to be the temperature above which all phonon modes begin to be excitedAshcroft and Mermin (2011), the calculated values of for Fe2ScX (X=P, As, Sb) are 637 K, 556 K and 498 K, respectively. The maximum phonon energy is decreasing from Fe2ScP to Fe2ScSb as mentioned earlier which is the reason for observed trend of .
III.2 Electronic structure
The band gaps of semiconductors and insulators in KS-DFT calcualtions are generally underestimated. But, in a theoretical study or in prediction of new compounds with a band gap for thermoelectric applications, accurate calculation of band gap is essential since the number of carriers thermally excited varies exponentially with band gap. Also, in a DFT calculation, the curvature of bands at the band extrema and band features of electronic dispersion depends on the approximation used for the exchange-correlation part.Shastri and Pandey (2018a) The transport coefficients calculated, depend on the effective mass and group velocity, which are derived from the band structure. Therefore, proper selection of XC functional for any DFT study of TE material is crucial. The question of which functional to choose was addressed in the work of Shamim et al.Sk et al. (2018) as mentioned in the introduction which proposed that the combination of mBJ and SCAN (or PBEsol) functional would better explain the Seebeck coefficient. Thus, to calculate electronic band structure and dependent transport properties, two functionals viz. SCAN and mBJ are used.
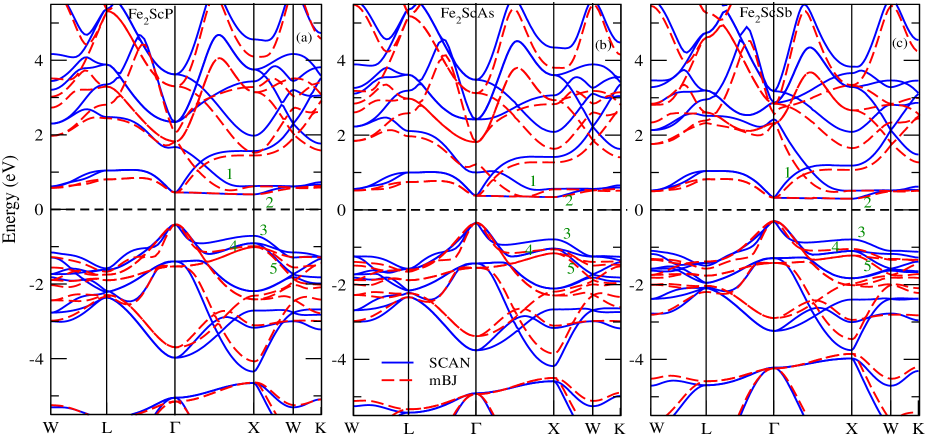
The electronic bandstructure of Fe2ScX (X=P, As, Sb) compounds are shown in Fig. 4(a)-(c), respectively. In the plots, the zero energy corresponds to the Fermi level, , and is set to the middle of the gap. For each compound the indirect band gaps obtained from both functionals are listed in Table I. The indirect band gaps of Fe2ScP and Fe2ScAs obtained in the work of Sharma et al.Sharma and Pandey (2014b) are also included for comparison. Fe2ScSb was predicted as semimetallic while former two compounds as semiconducting from PBEsol calculations in Ref. 10. As can be seen in Table I, the band gap values predicted by SCAN and PBEsol are closer to each other but, much lesser than that from mBJ. The band gaps of Fe2ScP, Fe2ScAs and Fe2ScSb are 0.81, 0.69 and 0.60 , respectively as obtained from mBJ calculations. The mBJ is constructed to give accurate band gaps and the literatures show the good agreement between the experimental and mBJ calculated band gaps.Kim et al. (2010); Shastri and Pandey (2018a) Thus, band gaps predicted in this work could be useful numbers to experimentalists for comparison in case samples are prepared.
The band gap is reducing from Fe2ScP to Fe2ScSb by a value of approximately 0.1 eV in case of mBJ. Therefore, at a given temperature the number of electrons excited into the conduction band are relatively lower in Fe2ScP compared to other two compounds with the relatively least number being in Fe2ScSb. A band gap of mBJ ground state band structure has been introduced into the band structure of SCAN in such a way that conduction band minimum (CBM) at -point and valence band maximum (VBM) at -point from both functionals coincide. This representation of band structure from two functionals depicts (Fig. 4) the differences in the features of dispersion curves at different points along the k-path. The bands numbered 1 to 5 in Fig. 4 are denoted with symbols B1 to B5 in the description. The X atoms in the compound does not found to significantly affect the electronic states in the -4 to -0.3 eV energy range of valence band region. Similarly, bands B1 and B2 in CB region are also slightly altered. This is discernible in the plots since the features of bands qualitatively does not show much difference in energy range mentioned.
In the plots the valence band maximum (VBM) is at -point and CBM is at -point giving indirect band gaps. In all three compounds, the VBM is triply degenerate at -point. Fe2ScX compounds possess a band B2 which is almost flat along the - direction and is dispersive in the direction --. The bands B1 and B2 are degenerate at -point and continues to show degeneracy till -point. The bands B1 and B2 start at the same energy at but along the - and - directions, the bands of SCAN are elevated in energy relative to the mBJ bands. The three valence bands of SCAN starting from and along the directions - and -- are higher in energy relative to mBJ bands. In other words, in the VB region nearer to , SCAN bands are narrower compared to mBJ bands (B3-B5) which implies density of states should be higher near in electronic structure calculated from SCAN . The CBM at -point is doubly degenerate, but the bands 1 and 2 obtained from mBJ are relatively more narrower compared to the bands of SCAN. This implies the density of states in the CB region near is more in mBJ approximated electronic ground state.
The relatively small number of electrons excited into the conduction band decide the transport behavior in a semiconductor.Ashcroft and Mermin (2011) Since, the excited carriers are found almost in the neighborhood of the CB minima or VB maxima, for the three compounds the band extrema are approximated with a parabola to calculate the effective mass. Under the parabolic approximation, effective mass is inversly proportional to the curvature of the parabolic band. Thus, the effective mass values of carriers in a band indicates the curvature of the band. The Seebeck coefficient (S) is directly proportional to the effective mass of charge carriers in the material according to the equationSnyder and Toberer (2008),
| (2) |
In the above relation, is Planck’s constant, is Botlzmann constant, is electronic charge and is carrier concentration, respectively.
The direct band gap from mBJ in these materials are 0.85, 0.72 and 0.62 eV, respectively (Fig. 4). These values of energy gap are much close to the indirect band gaps of mBJ listed in Table I and hence there is finite probability that electron transition takes place between these points too. In order to quantify the curvature of bands from SCAN, the parabola were fitted at band extrema according to the free electron energy equation , where is rest mass of electron and effective mass in terms of mass of electron. The bands numbered 1 to 5 (labeled B1 to B5 in Table II) in Fig. 4 which significantly participate in the transport are fitted with parabola in the vicinity of CB minima at and -points and VB maximum at -point for SCAN functional. The obtained values of effective mass along different directions for Fe2ScX (X=P, As, Sb) for SCAN bands are listed in Table II. The notation, for instance, - denotes the effective mass calculated at -point along to direction.
| Fe2ScP | Fe2ScAs | Fe2ScSb | ||||||||||||
|---|---|---|---|---|---|---|---|---|---|---|---|---|---|---|
| -L | -X | X-X | X-XW | -L | -X | X-X | X-XW | -L | -X | X-X | X-XW | |||
| B1 | 0.26 | 0.13 | 0.19 | 0.10 | 0.16 | 0.09 | ||||||||
| B2 | 0.26 | 20.56 | 39.91 | 1.36 | 0.19 | 46.79 | 36.67 | 1.46 | 0.16 | 50.25 | 37.69 | 1.25 | ||
| B3 | 0.26 | 0.43 | 0.21 | 0.41 | 0.22 | 0.45 | ||||||||
| B4 | 0.26 | 0.42 | 0.19 | 0.41 | 0.16 | 0.45 | ||||||||
| B5 | 0.22 | 0.14 | 0.19 | 0.10 | 0.16 | 0.09 | ||||||||
The effective mass values in Table II clearly highlight the large for band B2 in all three compounds. Along direction are 39.91, 36.67 and 37.69 for three compounds, respectively. For the same band along - direction carriers have greater than along direction. In Fe2ScP, effective mass of the bands B1-B4 is 0.26 and B5 is 0.22, respectivley along - directions. Along the - direction of bands B1, B5, and B3 and B4 are 0.13, 0.14, 0.43 and 0.42, respectively. As can be seen from the table, the band B2 has very large value of effective mass () along and directions and can be called heavy band in Fe2ScX. From Fig. 4 one can observe that at CBM and VBM at the -point, the curvature of mBJ bands are lesser compared to that of SCAN bands. This implies that effective mass if estimated from mBJ should be higher for these compounds. In the work of Kim et al. Kim et al. (2010) for III-V semiconductors effective mass values were estimated using mBJ and found that mBJ effective masses are overestimated with respect to experimental data by 30-50 %. Thus, one may predict that effective mass calculated for SCAN should be nearer to experimental value since these band features also explained the Seebeck coefficient of Fe2VAl in Ref. 12. For a given compound, along the direction the bands B1 to B5 have nearly same curvature. While, along direction, B3 and B4 bands are of similar curvature which is justified by the values in the table.
III.3 Thermoelectric properties
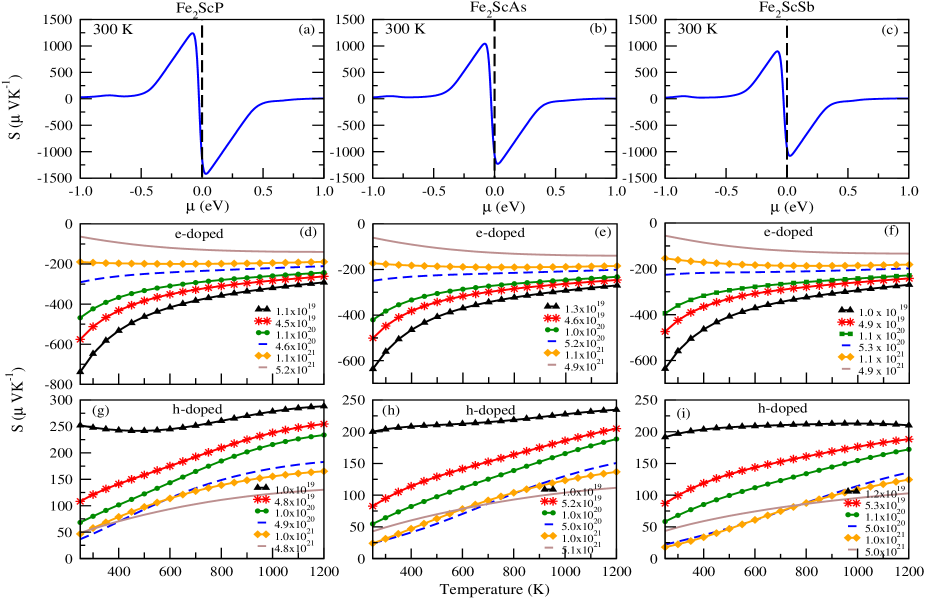
The thermoelectric parameters Seebeck coefficient , electrical conductivity per relaxation time and power factor per relaxation time (PF), are calculated for Fe2ScX compounds under semiclassical transport theory. In order to calculate TE properties, the band structure from SCAN functional and band gap obtained from the mBJ have been used. In Fig. 5(a)-(c), for three compounds the variation with the shifts in chemical potential () are presented at 300 K. The dashed line normal to axis indicates chemical potental for the intrinsic compounds at 0 K. The positive and negative values of in plots correspond to electron and hole doping, respectively. At the temperature of 300 K, vs. curve cuts the =0 line, for Fe2ScP, at -1134 VK-1 and for Fe2ScAs and Fe2ScSb at -1068 and -963 VK-1, respectively. This indicates intrinsic Fe2ScX at 300 K will show negative values which is attributed mainly due to presence of flat conduction band in these compounds. The values of extrema in the curves are reducing from Fe2ScP to Fe2ScSb which implies in Fe2ScP maximum can be obtained either by electron or hole doping.
The maximum value of (at 300 K) for the three compounds are -1421, -1230 and -1080 VK-1 in the order, for shift in of 34, 23 and 24 meV ,respectively. While, the maximum positive values that can be attained by hole doping is relatively lesser compared to electron doping and also requires more doping (Fig. 5(a)-(c), large shift in towards negative side) to get high value. At a given temperature, the is inversly proportional to carrier concentration () and directly proportional to . The band gap of Fe2ScP is 0.81 eV and is the highest in the family of Fe2ScX (Table I) making to be smaller compared to other compounds at a given temperature. This explains the reason for the observed higher in Fig. 5(a) for Fe2ScP compared to other two compounds. We compare the vs. curves with the work of Sharma et al. Sharma and Pandey (2014b) wherein PBEsol functional was used. We observe that the extrema of values calculated as a function of at 300 K are very much lower compared to that of our work. The maximum value of in Ref. 10 for undoped compounds (at =0) was -770, -386, -192 VK-1 for Fe2ScP, Fe2ScAs and Fe2ScSb, respectively. This can be mainly due to the lower band gap predicted by PBEsol (Table I) for Fe2ScX compounds.
In order to find out the proper carrier concentration that would yield and values which maximize the PF, we have doped Fe2ScX compounds with electrons and holes in the range 1x10¹⁹ to 5x1021 cm-3. For the three compounds , and PF values are calculated for various dopings in the temperature range 250-1200 K. Seebeck coefficient values for electron doped compounds are shown in Fig.5 (d)-(f) . For Fe2ScX, values of are decreasing continuously with the increase in the temperature for a given electron doping from 1x1019 cm-3 to 1x1020 cm-3. For 5x1020 cm-3 of doping, the range of (max. -min.) for temperature range under study is reduced. For 1x1021 cm-3 of doping the is not varying substantially with temperature. But, slow increasing nature of is observed for 5x1021 cm-3. This is the general trend of observed in case of electron doping. Also, with increase in the electron doping curves are shifting towards lower values since varies inversly with carrier concentration as given by Eq. (2). The maximum values of are -743, -645, -637 for 1x1019 cm-3 electron doping for Fe2ScX compounds, respectively at 250 K. At any temperature lower doping of 1x1019 cm-3 has higher value. In Ref. 10, nature of the curves for 1x10¹⁹-1x1021 cm-3 of doping are different which can be due the lower band gaps considered compared to present work. The maximum values at 1x1019 cm-3 doping are -500, -400 and 25 for Fe2ScX, respectively.
The nature of curves for different hole dopings are shown in Fig. 5(g)-(i) for three compounds. The maximum is obtained for doping of 1x1019 cm-3 in the temperature range considered and the increment in with the increase in the temperature is less compared to higher dopings. For 5x10¹⁹-5x1021 cm-3 range, is increasing with nature of almost linear in 250-1200 K. But, Seebeck coefficients for dopings of 1x1021 cm-3 and above are crossing lower doping curves at higher temperatures. In Ref. 10, curves for hole doping does not show linear increase behavior as in this work, instead there are peaks in the curves. The reason for the observed differences may be due to the large band gap considered in this work. Comparing the , for hole and electron doped case, one can observe that from Fig. 5, for a given doping electron doping gives larger for Fe2ScX.
The Figure 6 shows the and PF plots for different carrier concentrations as a function of temperature. The electron and hole doping values considered for both and PF are shown only in the respective PF plots, represented in same colors (or symbols). The highlighting feature of plots (Fig. 6(a)-(f)) is that, for any doping values curves are nearly linearly increasing from 250 to 1200 K for all compounds. For doping of 1x10¹⁹-1x1020 cm-3, curves are close to each other for both electron and hole doping. For higher dopings curves are shifting towards higher values. The highest is obtained for doping concentration of 5x1021 cm-3 of both electron and hole type. From 5x10²⁰ to 5x1021 cm-3, the obtained value of , for a given doping concentration is higher for hole type doping compared to electron type. This can be understood as because of the lesser effective mass of holes in valence bands (B3-B5)(Table II) compared to that of electrons with high effective mass in band B2. Since, the charge carrier with higher effective mass has lower mobility and electrical conductivity in semiconductors is related to mobility as, =, where is mobility of charge carriers, higher electrical conductivity of holes is expected in these compounds.
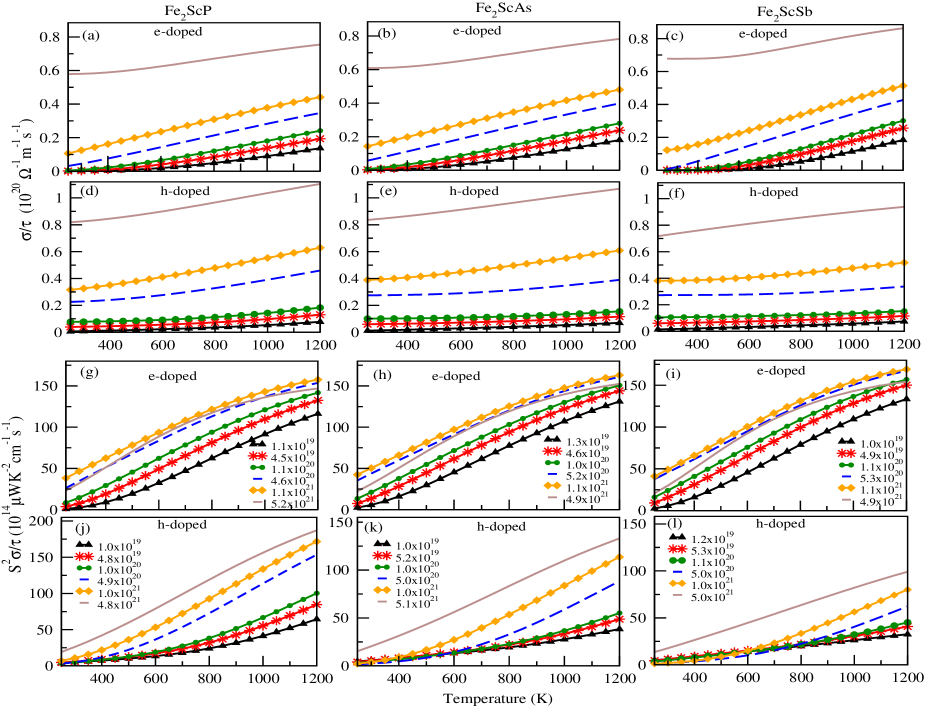
The (PF) plots for Fe2ScX are presented in Fig. 6 (g)-(l) for electron and hole doping in (= 1 PF unit, PFU). For electron doped cases, the PF curves are shifted to higher values with the increased doping concentration except for doping of 5x1021 cm-3. For a given doping, the PF is increasing with temperature from 250 to 1200 K. For temperatures of practical applications, for instance, in automobiles where temperature of heat source, to install TEG is considered as 800 K Gaurav et al. (2017), PF values at these temperatures are, 121, 125 and 131 PFU, for doping of 1x1021 cm-3 for Fe2ScP, Fe2ScAs, and Fe2ScSb, respectively. Thus, for Fe2ScX compounds, to get a high PF from electron doping, 1x1021 cm-3 can be considered as optimal doping concentration in the doping range considered.
For hole doped case also an increasing trend in PF with temperature is observed in Fig. 6 (j)-(l). For doping range 1x10¹⁹-1x1020 cm-3, the PF values are close to each other. At any temperature, for the hole doping of 5x1021 cm-3 highest PF is obtained for these compounds. At 800 K, the values of PF for 5x1021 cm-3 dopings are, 118, 83 and 63 PFU for Fe2ScP, Fe2ScAs, and Fe2ScSb, respectively. From Fig. 6 (j)-(l) we can observe that PF values for a given doping is decreasing from Fe2ScP to Fe2ScSb. The power factor curves in the work of Ref. 10 shows gradual incresing behavior for the carrier concentration of 1x10¹⁷ to 1x1019 cm-3. But, for doping of 1x10²⁰ to 1x1021 cm-3, there are peaks in the PF curves. The maximum PF is obtained for a doping of 5x1021 cm-3 in all three compounds. The maximum values of PF obtained for p-type doping is 90-24 PFU and for n-type doping is 85-54 PFU from Fe2ScP to Fe2ScSb compound in Ref. 10. The values of maximum PFs obtained by using PBEsol functional in the work of Ref. 10 are lesser compared to the present work. The band gaps obtained by PBEsol are lesser compared to mBJ as can be seen in Table I, may be the reason for the observed differences in PF values calculated in two works. From the nature of the PF curves (Fig. 6 (g)-(l)), which are showing increasing behaviour with temperature, we can propose these materials for high temperature thermoelectric applications.
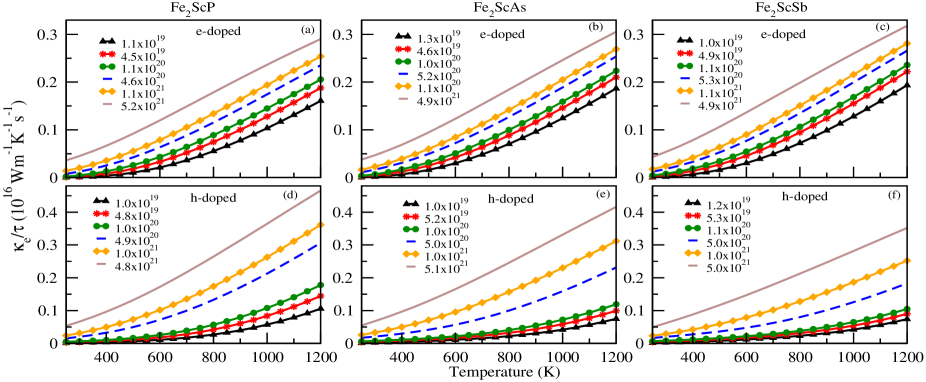
Electronic thermal conductivity per relaxation time () of Fe2ScX compounds for electron and hole dopings considered in this study are shown in Fig. 7 (a)-(c) and (d)-(f), respectively. For three compounds, curves are showing increasing trend with temperature. For optimal doping cases giving the highest PFs 1x1021 cm-3 of electron doping, is increasing from first to last compound while, for hole doping of 5x1021 cm-3 reverse trend is observed. At 800 K, values for electron doping of 1x1021 cm-3 which yields the highest PF are 0.13, 0.14 and 0.15 for Fe2ScX compounds, respectively.
Calculation of of TE material is important to fully evaulate it for TE application. But, calculation of is a difficult and computationally demanding taskTogo et al. (2015). Therefore, any simple method predicting fairly good value of is of much help. Here for a quantitative estimation of in Fe2ScX compounds we resort to a simple method which turns out to provide reasonably good estimation of . The relation for is given byAshcroft and Mermin (2011),
| (3) |
where is constant volume specific heat per unit volume, is phonon phase velocity in linear dispersion and is phonon relaxation time.
Now, to calculate from Eq. 3, the values of , and are needed. The specific heat, is obtained as function of temperature from the phonon calculations. To calculate , three acoustic branches are approximated with linear dispersion, by fitting with straight line in the neighborhood of () of the calculated phonon dispersions. Then is calculated as , the slope of the linear dispersion. To find out , acoustic branches in the - and - directions are considered. Values of of three acoustic branches in two directions are averaged, which we denote by and used to estimate instead of in Eq. 3. Table III shows the values of calculated for three acoustic branches in two directions and values for Fe2ScX, Fe2VAl and Fe2TiSn compounds. The branch notations followed are shown in the inset of Fig. 1 (b).
The Table III shows that the of phonons of three acoustic branches in - directions are reducing from Fe2ScP to Fe2ScSb. In - direction, similar trend in is noted for branch S2 and S3 (which are degenerate), except for S1 in which opposite trend is observed. In - direction, branches S1 and S2 are degenerate and have value of , 102.4, 86.5 and 78.5 for Fe2ScX, respectively. The for Fe2ScX are 112.2, 99.2, and 91.0 , respectively. The observed trend is due to reduction in phonon frequencies on going from first to last compound. In both directions considered, values of phonons in Fe2VAl is greater than that in Fe2TiSn for all branches. The calculated are 116.6 and 107.1 for Fe2VAl and Fe2TiSn, respectively. The phonon of Fe2ScX compounds are lesser compared to Fe2VAl and Fe2TiSn except, for Fe2ScP with of 112.2 .
Once, the quantities and are known, needs to be found out which is the computationally more difficult part. At this step, to estimate the value of , we considered Fe2VAl and later the is benchmarked using Fe2TiSn compound. For the estimation, values are taken from our previous workShastri and Pandey (2018b) and (and ) used are calculated and tabulated in Table III. Using the experimental of Fe2VAlLue and Kuo (2002) at 300 K of 25 , the estimated, is 5x10. The calculated value of for Fe2TiSn using the estimated at the same temperature is 14.8 . This value is close to the experimental value of Leu et al.Lue and Kuo (2004)(7 ) at 300 K. This suggests that the estimated by this method can predict reasonably accurate values of for other three compounds using such a simple approach. It is important to note here that, Fe2VAl, Fe2TiSn and Fe2ScX compounds have same crystal structure and belong to the same class of compounds with similar phonon dispersions which led us to select the former two compounds in the estimation. With the calculated of 5x10 and using and values, the estimated at 300 K for three compounds are 18.2, 13.6 and 10.3 , respectively. The is reducing from Fe2ScP to Fe2ScSb, which may be mainly due to the larger sized and heavier mass elements in the latter compounds.
| Fe2ScP | Fe2ScAs | Fe2ScSb | Fe2VAl | Fe2TiSn | |||||||||||
|---|---|---|---|---|---|---|---|---|---|---|---|---|---|---|---|
| - | - | - | - | - | - | - | - | - | - | ||||||
| S1 | 69.9 | 102.4 | 71.0 | 86.5 | 73.4 | 78.5 | 96.7 | 101.4 | 80.1 | 93.1 | |||||
| S2 | 95.5 | 102.4 | 84.4 | 86.5 | 78.1 | 78.5 | 101.4 | 101.4 | 90.4 | 93.1 | |||||
| S3 | 161.9 | 141.0 | 138.7 | 128.3 | 120.6 | 117.1 | 151.1 | 147.8 | 146.2 | 139.9 | |||||
| 112.2 | 99.2 | 91.0 | 116.6 | 107.1 | |||||||||||
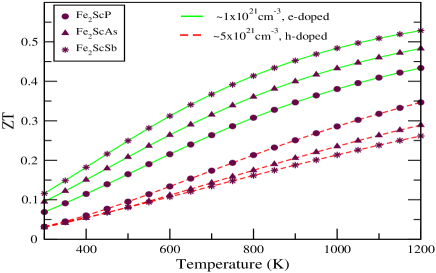
The assessment of TE applicability of Fe2ScX Heusler compounds is done by calculating temperature dependent in 300-1200 K range. For the calculation of from Eq. 1, the estimated at 300 K of the pure compounds are used for all temperatures, which is generally expected to reduce at higher temperatures. Constant electron relaxation time of 1x10 is usedAshcroft and Mermin (2011) in the estimation of and . The temperature dependent values of Fe2ScX compounds are calculated for the highest PF yielding optimal electron (n-type) doping of 1x1021 cm-3 and hole (p-type) doping of 5x1021 cm-3, out of the doping range considered in this study. The obtained for doped Fe2ScX compounds are presented in Fig. 8. The values suggest that Fe2ScX compounds could be promising materials for TE applications with showing the increasing nature with temperature.
From the figure we can see that for electron doping shown, Fe2ScSb has the highest while, for hole doping Fe2ScP shows the highest among the family. The highest is obtained from Fe2ScSb, which in 300-500 K is 0.11-0.25, in the mid-temperature range of 500-900 K is 0.25-0.45 and in high temperature range 900-1200 K is 0.45-0.52. The values obtained from the hole doping of 5x1021 cm-3 for these compounds are lower compared to electron doping. The n-type Fe2ScP has in the range 0.07 to 0.43, while p-type Fe2ScP has 0.03-0.34 which is the highest among p-type Fe2ScX compounds. The doped Fe2ScAs is showing intermediate among the optimal doped Fe2ScX compounds. The range for n-type and p-type Fe2ScAs are 0.09-0.48 and 0.03-0.28 in 300-1200 K, respectively. For last compound in the family, n-type Fe2ScSb, the highest is observed in the range of 0.11-0.52. In case of it’s p-type counterpart of 5x1021 cm-3 doped, at 300 K is 0.03 and it is reaching 0.26 at 1200 K. Higher values are observed in the high temperature region for both type of doping, which hints at the possible applicability in high temperature power generation. The 900-1200 K range for 1x1021 cm-3 doping of Fe2ScX compounds are, 0.34-0.43, 0.40-0.48 and 0.45-0.52, respectively. For the hole doping of 5x1021 cm-3, the values in the same temperature range are 0.25-0.34, 0.20-0.28 and 0.18-0.26, respectively.
The higher observed at temperatures 900 K, indicates that for the high temperature TE power generation, doped Fe2ScX full-Heuslers could be one of the suitable candidates. Currently, doped Si-Ge alloys are one of TE materials in use for power generation in high temperature region with ranges in 673-1273 K of 0.5-0.8 and 0.4-0.6 for n-type and p-type Si-Ge, respectivelySnyder and Toberer (2008). The simultaneous increase in thermopower and electrical conductivity with moderate decrease in thermal conductivity was observed in the work of Makongo et al.Makongo et al. (2011) leading to 2.5 times enhancement for the bulk nanostructured (Zr,Hf)NiSn half-Heusler alloys. In the TE research, with the considerable interest in enhancement of by complex nanostructuringSnyder and Toberer (2008); Dresselhaus et al. (2007), we anticipate that Fe2ScX family of full-Heusler could be worth cosidering next to Si-Ge alloys. Also, the plot, hints that, with both electron and hole doped compounds showing good number, they can be used as n-type and p-type thermoelements in constructing TEGs. Therefore, an attempt by experimental community to synthesize and study the TE properties are highly desired.
IV Conclusions
In the present work, electronic structure and dependent thermoelectric coefficients of Fe2ScX (X=P, As, Sb) compounds are studied using two functionals viz. SCAN and mBJ. The differences in the features of the electronic bands obtained from mBJ and SCAN are brought out by comparison. The effective mass values are calculated at the bands extrema of SCAN. The indirect band gaps for Fe2ScP, Fe2ScAs and Fe2ScSb, obtained from mBJ are 0.81, 0.69 and 0.60 , respectively. , , PF and are calculated for various values of electron and hole doping by introducing band gaps from mBJ into band structures of SCAN under semiclassical transport equations. The PF obtained at the temperature of 800 K for electron doping of 1x1021 cm-3 are 121, 125 and 131 for Fe2ScX where X= P, As, Sb, respectively. While, at the same temperature, highest PF values is obtained for hole doping of 5x1021 cm-3 are 118, 83 and 63 for Fe2ScX, respectively. The phonon dispersion and density of states are calculated for the three compounds which supported the structural stability. The calculated lattice contribution to shows at any temperature are in order Fe2ScSb Fe2ScAs Fe2ScP. The maximum phonon energy (or frequency) for Fe2ScX are 55, 48 and 43 meV, respectively. The Debye temperatures are calculated for three compounds which are 637 K, 556 K and 498 K, respectively. Based on the calculation of slopes of acoustic branches in the linear region and estimated , of Fe2ScX compounds at 300 K are estimated. The for three compounds are 18.2, 13.6 and 10.3 , respectively. In the temperature range 900-1200 K, the values are 0.25-0.34, for the hole doping of 5x1021 cm-3 are 0.20-0.28 and 0.18-0.26, respectively. In the same temperature range, for 1x1021 cm-3 doping are 0.34-0.43, 0.40-0.48 and 0.45-0.52, respectively. Our work suggests that Fe2ScX compounds could be worth considering for high temperature TE applications with both n-type and p-type compounds showing good values.
V Acknowledgements
The authors thank Science and Engineering Research Board (SERB), Department of Science and Technology, Government of India for funding this work. This work is funded under the SERB project sanction order No. EMR/2016/001511.
VI References
References
- Gorai et al. (2017) P. Gorai, V. Stevanović, and E. S. Toberer, Nat. Rev. Mater. 2, 17053 (2017).
- Tritt and Subramanian (2006) T. M. Tritt and M. Subramanian, MRS bulletin 31, 188 (2006).
- Yang et al. (2016) J. Yang, L. Xi, W. Qiu, L. Wu, X. Shi, L. Chen, J. Yang, W. Zhang, C. Uher, and D. J. Singh, NPJ Comput. Mater. 2, 15015 (2016).
- Snyder and Toberer (2008) G. J. Snyder and E. S. Toberer, Nat. Mater. 7, 105 (2008).
- Mahan and Sofo (1996) G. Mahan and J. Sofo, Proc. Nat. Acad. Sci. 93, 7436 (1996).
- Sharma and Pandey (2014a) S. Sharma and S. K. Pandey, J. Phys.: Condens. Matter 26, 215501 (2014a).
- Yabuuchi et al. (2013) S. Yabuuchi, M. Okamoto, A. Nishide, Y. Kurosaki, and J. Hayakawa, Appl. Phys. Express 6, 025504 (2013).
- Barth et al. (2011) J. Barth, G. H. Fecher, B. Balke, T. Graf, A. Shkabko, A. Weidenkaff, P. Klaer, M. Kallmayer, H.-J. Elmers, H. Yoshikawa, et al., Phil. Trans. R. Soc. A 369, 3588 (2011).
- Barth et al. (2010) J. Barth, G. H. Fecher, B. Balke, S. Ouardi, T. Graf, C. Felser, A. Shkabko, A. Weidenkaff, P. Klaer, H. J. Elmers, et al., Phys. Rev. B 81, 064404 (2010).
- Sharma and Pandey (2014b) S. Sharma and S. K. Pandey, J. Phys. D: Appl. Phys. 47, 445303 (2014b).
- Shastri and Pandey (2018a) S. S. Shastri and S. K. Pandey, Comput. Mater. Science 143, 316 (2018a).
- Sk et al. (2018) S. Sk, P. Devi, S. Singh, and S. K. Pandey, Mater. Res. Express 6, 026302 (2018).
- Blaha et al. (2001) P. Blaha, K. Schwarz, G. K. H. Madsen, D. Kvasnicka, and J. Luitz, An augmented plane wave+ local orbitals program for calculating crystal properties (2001).
- Tran and Blaha (2009) F. Tran and P. Blaha, Phys. Rev. Lett. 102, 226401 (2009).
- Sun et al. (2015) J. Sun, A. Ruzsinszky, and J. P. Perdew, Phys. Rev. Lett. 115, 036402 (2015).
- Togo and Tanaka (2015) A. Togo and I. Tanaka, Scripta Mater. 108, 1 (2015).
- Madsen and Singh (2006) G. K. Madsen and D. J. Singh, Comput. Phys. Commun. 175, 67 (2006).
- Skelton et al. (2015) J. M. Skelton, D. Tiana, S. C. Parker, A. Togo, I. Tanaka, and A. Walsh, J. chem. phys. 143, 064710 (2015).
- Shastri and Pandey (2018b) S. S. Shastri and S. K. Pandey, Comput. Mater. Sci. 155, 282 (2018b).
- Birch (1947) F. Birch, Phys. Rev. 71, 809 (1947).
- (21) S. S. Shastri and S. K. Pandey, AIP Conference Proceedings 2019 (accepted) .
- Ashcroft and Mermin (2011) N. Ashcroft and N. Mermin, Solid State Physics (Cengage Learning, 2011).
- Kim et al. (2010) Y.-S. Kim, M. Marsman, G. Kresse, F. Tran, and P. Blaha, Phys. Rev. B 82, 205212 (2010).
- Gaurav et al. (2017) K. Gaurav, S. Sisodia, and S. K. Pandey, J. Renewable Sustainable Energy 9, 064703 (2017).
- Togo et al. (2015) A. Togo, L. Chaput, and I. Tanaka, Phys. Rev. B 91, 094306 (2015).
- Lue and Kuo (2002) C. S. Lue and Y.-K. Kuo, Phys. Rev. B 66, 085121 (2002).
- Lue and Kuo (2004) C.-S. Lue and Y.-K. Kuo, J. of Appl. Phys. 96, 2681 (2004).
- Makongo et al. (2011) J. P. Makongo, D. K. Misra, X. Zhou, A. Pant, M. R. Shabetai, X. Su, C. Uher, K. L. Stokes, and P. F. Poudeu, J. Am. Chem. Soc. 133, 18843 (2011).
- Dresselhaus et al. (2007) M. S. Dresselhaus, G. Chen, M. Y. Tang, R. Yang, H. Lee, D. Wang, Z. Ren, J.-P. Fleurial, and P. Gogna, Advanced materials 19, 1043 (2007).