The effect of Large Magellanic Cloud on the satellite galaxy population in Milky Way analogous Galaxies
Abstract
Observational work have shown that the two brightest satellite galaxies of the Milky Way (MW), the Large Magellanic Cloud (LMC) and the Small Magellanic Cloud (SMC), are rare amongst MW analogues. It is then interesting to know whether the presence of massive satellite has any effect on the whole satellite population in MW analogues. In this article, we investigate this problem using a semi-analytical model combined with the Millennium-II Simulation. MW-analogous galaxies are defined to have similar stellar mass or dark matter halo mass to the MW. We find that, in the first case, the halo mass is larger and there are, on average, twice as many satellites in Milky Way analogs if there is a massive satellite galaxy in the system. This is mainly from the halo formation bias. The difference is smaller if MW analogues are selected using halo mass. We also find that the satellites distribution is slightly asymmetric, being more concentrated on the line connecting the central galaxy and the massive satellite and that, on average, LMC have brought in satellite galaxies with at its accretion, among which satellites are still within a distance of kpc from the LMC. Considering other satellites, we predict that there are satellites with kpc of the LMC. By comparing our model with the early data of Satellites Around Galactic Analogs (SAGA), a survey to observe satellite galaxies around 100 Milky Way analogues, we find that SAGA has more bright satellites and less faint satellites than our model predictions. A future comparison with the final SAGA data is needed.
keywords:
galaxies: halo - galaxies: Local Group - galaxies: dwarfs – Magellanic Clouds1 INTRODUCTION
The cold dark matter (CDM) model makes good predictions regarding structure formation on large scales. However, on small scales the predictions are complicated, due to the complex baryonic processes. Our Milky Way (MW) is the most well-studied galaxy in the universe(e.g. Bland-Hawthorn & Gerhard (2016)). In recent years, dozens of new faint satellites of MW has been observed (e.g., Koposov et al., 2015; Drlica-Wagner et al., 2015; Bechtol et al., 2015), therefore the whole member of MW satellites could be predicted more confidently (e.g., Trowland et al., 2013; Newton et al., 2018). The combination of satellite spatial distribution and kinematical properties (e.g., McConnachie (2012)) makes the MW to be an excellent local laboratory to constrain the CDM model and baryonic physics. For a recent review see Bullock & Boylan-Kolchin (2017) and Navarro (2018).
In fact, two well-known problems have been found when comparing observations with theory. One of them is that the satellites predicted in the CDM model are much more numerous than we have observed (the ”missing satellite” problem, Klypin et al. (1999); Moore et al. (1999)). The problem can be solved by suppressing the star formation rate in low-mass haloes (e.g., Bullock, 2010; Maccio et al., 2010). The other problem is that the predicted central mass density is higher than observed (the ”too-big-to-fail” problem, Boylan-Kolchin et al. (2012). Several solutions have been proposed, such as the possibility that dark matter is not cold (e.g., Lovell et al., 2012; Vogelsberger & Zavala, 2013), an induced core arising from baryon physics and star formation (e.g., Brooks & Zolotov, 2014; Guo et al., 2015; Wetzel et al., 2016; Brooks et al., 2017), the MW having a lower halo mass (e.g., Vera-Ciro et al., 2013; Dierickx & Loeb, 2017) or the MW having a particular quirk of accreting its subhaloes (Kang et al. (2016)).
To solve these problems, on the one hand major effort should be made to search for more faint MW satellites. On the other hand, it is equally important to search more MW analogues to identify whether the MW is an outlier. A few studies have shown that the MW is not typical, especially in terms of its distribution of bright satellites (Liu et al., 2011; Guo et al., 2011; Tollerud et al., 2011; Strigari & Wechsler, 2012). Considering the brightness of Large and Small Magellanic Clouds (LMC & SMC, with and ), studies found that 11 percent of MW analogues contain a satellite like LMC or SMC and only 3.5 percent of them contain equivalents to both bright satellites (Liu et al., 2011). A similar conclusion is also drawn using simulation data (Boylan-Kolchin et al., 2010; Busha et al., 2011; Rodriguez-Puebla et al., 2013; Kang et al., 2016).
Considering the rarity of LMC like satellite in MW analogs, one important question is whether the presence of a massive satellite, such as the LMC, has any effect on the number and spatial distribution of the full satellite population. In particular, does our MW contain more or fewer faint satellite galaxies than its analogues? If there are more satellites, how many of them are contributed by LMC? Answering these questions will shed light on our search for more faint satellites in the MW and the comparison with observations of MW analogues. On the other hand, the effect of a LMC-like satellite on the whole satellite population may depend on how we define the MW-analogous galaxies. Usually, a MW-analogous galaxy is defined as a galaxy that has a dark matter halo similar to that of the MW, around . It is well-known from the halo model ((Zentner et al., 2005; Deason et al., 2013; Mao et al., 2015)) that the number of satellite galaxies, as well as their mass distribution, is related with halo assembly bias. Lu et al. (2016) use an N-body simulation of MW-mass haloes with a fixed mass of to investigate the realtion between LMC and other satellites. They found that the presence of the LMC is correlated with halo assembly history and a different assembly history will have an effect on the number of satellites. Although using dark matter halo to define a MW analogue can be easily applied in simulations, in an observational search of MW analogues it is more straightforward to use the stellar mass or luminosity of the galaxy. The Satellites Aroud Galactic Analogs (SAGA) Survey is an ongoing galaxy survey, the goal of which is to measure the distribution of satellite galaxies around 100 MW analogs down to (Geha et al., 2017). In their first phase of data, the survey has found eight MW analogues and made some comparisons between their samples and the Local Group.
In this article, we investigate the effect of the brightest satellite in the MW-like galaxies using a semi-analytical model of galaxy formation. Although halo assembly is the main driver for the variance of satellites population in the galaxy, some physical effects will produce additional scatter, such as cosmic reionization, galaxy mergers and tidal stripping. A semi-analytical model is able to include these physical process and our model (Luo et al. (2016)) has acquired much better convergence for simulations with different resolutions, which is essential for modelling the faint satellites of the MW. The goal of this work is to find out in which definition of MW-analogous galaxies the presence of a LMC-like satellite will affect the distribution of the whole satellite population. We introduce the data and our definition of MW analogous galaxies in Section 2. In Section 3 we show the satellite numbers and spatial distribution. In Section 4 we compare the model predictions with the recent SAGA results on the distribution of bright satellites to identify whether SAGA has missed some bright or faint satellites. We briefly discuss the results in Section 5.
2 METHODS
In this work, we use the semi-analytical galaxy formation model of Luo et al. (2016) implemented in the Millennium-II simulation (MS-II, Boylan-Kolchin et al. (2009)) to produce model galaxies. The original MS-II simulation is a dark matter only cosmological simulation with particles in a cube box with each side . After rescaling the cosmological parameters from the WMAP1 to the WMAP7 cosmology (a method developed by Angulo & White (2010)), the box size of MS-II is rescaled from to and the mass of each particles are changed from to . It is shown that such a simulation has enough resolution to resolve faint satellite down to (Guo et al., 2015). The semi-analytical model of Luo et al. (2016) is a resolution-independent model based on the Munich galaxy formation model: L-Galaxies (e.g. Kauffmann et al., 1993, 1999; Springel et al., 2001; Croton et al., 2006; De Lucia & Blaizot J, 2007; Guo et al., 2011, 2013; Fu et al., 2010, 2013; Henriques et al., 2015). For more detail about the models, we refer the readers to the references above.
In the L-Galaxies model, galaxies are classified into three types. Type 0 galaxies are those located at the center of Friends-of-Friends (FoF) halo groups and we take these galaxies as centers (host galaxies) of these groups. Therefore, there is only one type 0 galaxy in each FoF group and, in most cases, the type 0 galaxy is the largest and the brightest member of the group. Both type 1 and Type 2 galaxies are regarded as satellite galaxies in the model. A type 1 galaxy is located at the center of a subhalo, which is an overdensity within the FoF halo (Springel, 2010). The halos / subhaloes contain at least 20 bound particles for Millennium-II (Springel et al., 2005; Boylan-Kolchin et al., 2009). Type 2 represents an orphan galaxy without a resolved subhalo and it is usually the descendant of a Type 1 galaxy.
In the literature, the most common way to define MW-analogous galaxies is using the dark matter halo mass. Great efforts have been devoted to measure the dark matter halo mass of the MW and most results lie between and , with the majority concentrated around (Li et al. (2017); see Callingham et al. (2019) and Wang et al. (2015) for a summary of different methods and results). In our work we use two selection criteria to select MW-analogous galaxies. The first one is the virial halo mass and we select galaxies with virial mass between and as MW analogues. The second one is to use the stellar mass of the central galaxy. In the SAGA survey, Geha et al. (2017) define MW-analogous galaxies using the K-band luminosity of the central galaxy; they obtained MW analogues with using the abundance-match method, which is slightly larger than the reported K-band luminosity of the MW in the literature (e.g.,Klypin et al. (2002)). This luminosity range corresponds roughly to stellar mass between and . In this work, we also use this stellar mass range to select the MW-analogous galaxies, partly for comparison with the SAGA results. For satellite galaxies, we use an -band magnitude cut with considering the resolution of the simulation.
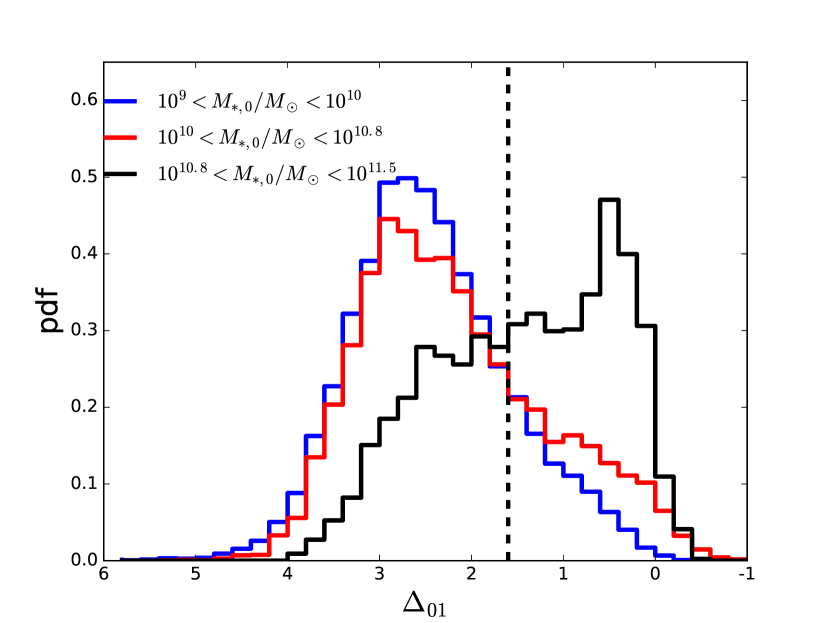
To investigate the effect of a massive satellite galaxy on the distribution of the whole galaxy system, we use the gap in stellar mass between the central galaxy and the most massive satellite, defined as , to quantify the resemblance to the MW. Here denote the stellar mass of the central and the most massive satellite galaxy. The MW has a stellar mass of and LMC have a stellar mass of , thus we use as a standard to split our MW analogues into two classes, with one class containing a large satellite while the other does not.
3 RESULTS
3.1 how does the LMC affect the satellite mass distribution
In this section, we investigate the distribution of and its impact on the stellar mass-halo mass relation, satellite number and spatial distribution.
We first show the distribution of in Fig. 1. We select central galaxies in three mass bins and plot their proportion distribution functions (PDFs) of . The vertical dashed line is the of the MW. It is seen that for small galaxies the gap is larger, while for massive galaxies the gap is smaller, consistent with the results of Kang et al. (2016). As the subhalo mass function (normalized by the host halo mass) is very weakly dependent on the host halo mass (e.g., van den Bosch et al. (2005) ), it is interesting to ask why the gap in stellar mass has a dependence on the central stellar mass or the host halo mass. This is mainly because the star formation in low-mass galaxies decreases rapidly (Guo et al., 2010), leading to a large gap in stellar mass for a given gap in dark matter mass. The plot shows that for galaxies with mass less than the MW () the peak of distribution is larger than 1.6, while for the galaxies with stellar mass larger than MW, the peak value of is lower than 1.6. It means that whether a galaxy group contains a LMC-like satellite is correlated with the mass of the central galaxy.
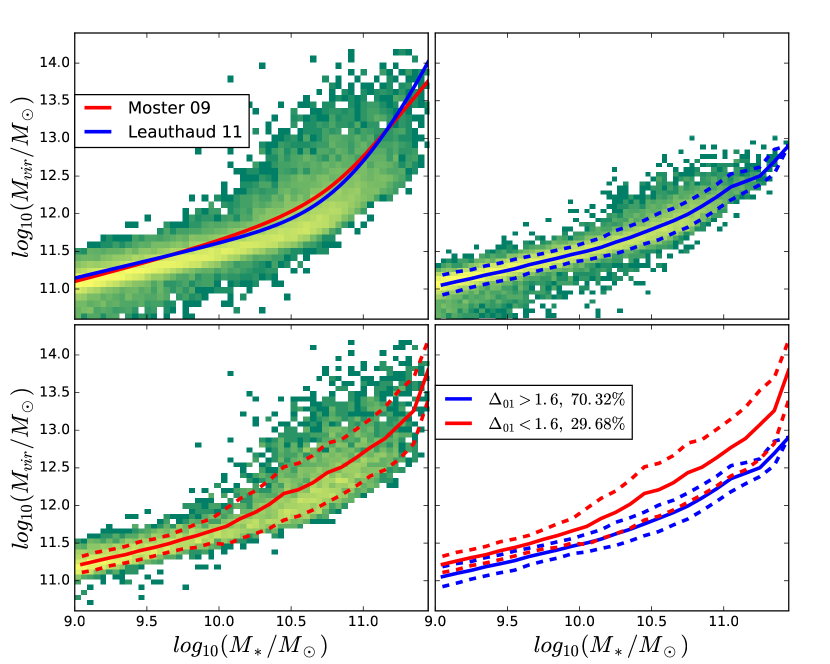
In Fig. 2 we check the stellar mass-halo mass relation for central galaxies in our model. The upper left panel is for all central galaxies with stellar mass between and and the lines show the relations from abundance matching by Moster et al. (2010) (2009, red line) and Leauthaud et al (2011) (2011, blue line). The upper right and lower left panels are for central galaxies with larger/smaller gap. The lower right panel compares the median relations for the two samples. The upper left panel shows that our semi-analtical model (SAM) galaxies agree roughly with the abundance-matching results, indicating that the model parameters are correctly tuned. The lower right panel shows that, at given stellar mass, a galaxy with lower tends to have a larger virial halo mass, which is easy to understand, since both and halo mass are affected by halo assembly history. Such a trend is stronger in massive galaxies.
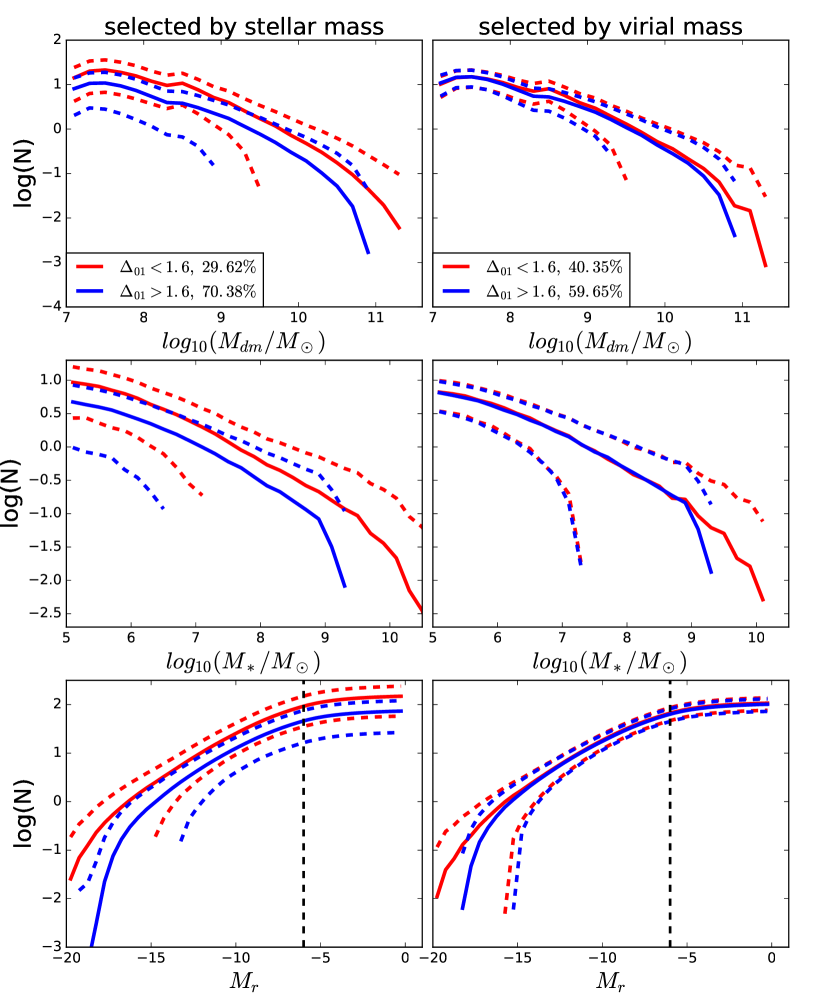
As the halo virial mass of a galaxy is a more physical property, it means that the presence of a massive satellite might have an effect on the whole satellite population. In Fig. 3 we plot the dark matter mass function, stellar mass function and luminosity function of the satellites. In the left column, galaxies are selected by stellar mass, i.e, the MW analogues are selected with stellar mass in the range - . In the right column, MW analogues are selected using halo virial masses in the range - . In each panel, red lines are for galaxies with lower and blue ones for those with larger . As this selection is based on a massive satellite galaxy, which will then introduce a bias at the massive end of each panel, we do not count the most massive satellite galaxy in the sample with lower and only show the mass functions of all other satellite galaxies.
From Fig. 3, it is found that, by selecting MW analogues using the halo virial mass, satellite galaxy distributions have no dependence on except at the very massive end: i.e., the presence of a massive satellite, such as the LMC, has no effect on the total and luminosity distribution of other satellite galaxies. However, if we select MW analogues using the stellar mass of the central galaxy, the presence of a massive satellite will lead to more satellite galaxies around the galaxy (left column). The left column shows that the total number of satellite galaxies will increase by a factor of 2 compared with the cases with larger . This is due mainly to the result that galaxies with lower have larger halo mass. Such an effect is significant and could be verified using a large survey of MW analogues, such as SAGA, with its full coverage of 100 galaxies. We will compare our model predictions briefly with the early results of SAGA in Sec.4.
3.2 Satellite spatial distribution
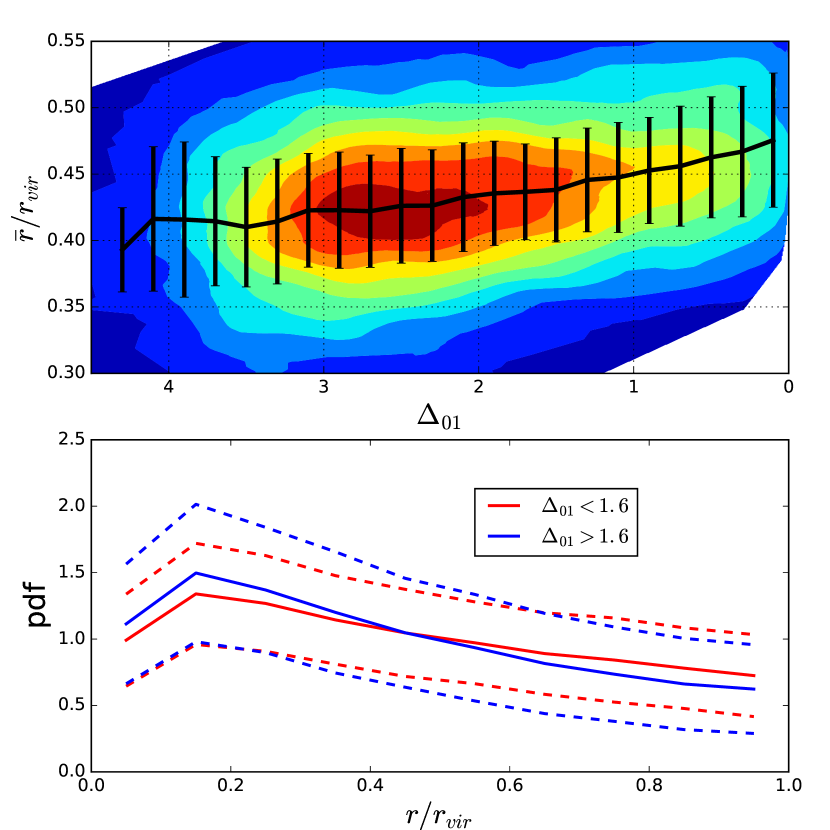
In previous section, we find that the presence of a massive satellite will lead to more satellite galaxies around a galaxy selected by stellar mass. Here we investigate whether the radial and angular distribution of the satellites will be affected by the massive satellite. We show the center-satellite distance distribution in Fig. 4. In the upper panel, the contour shows the distribution, while the black line shows the average distance. In the bottom panel, we show the satellite distance distribution function in units of the virial radius. The dashed lines show the 1 variance. It is found that, when a galaxy system has a lower , more satellites are likely to stay slightly further from central galaxy and the average distance to the central galaxy is also larger.
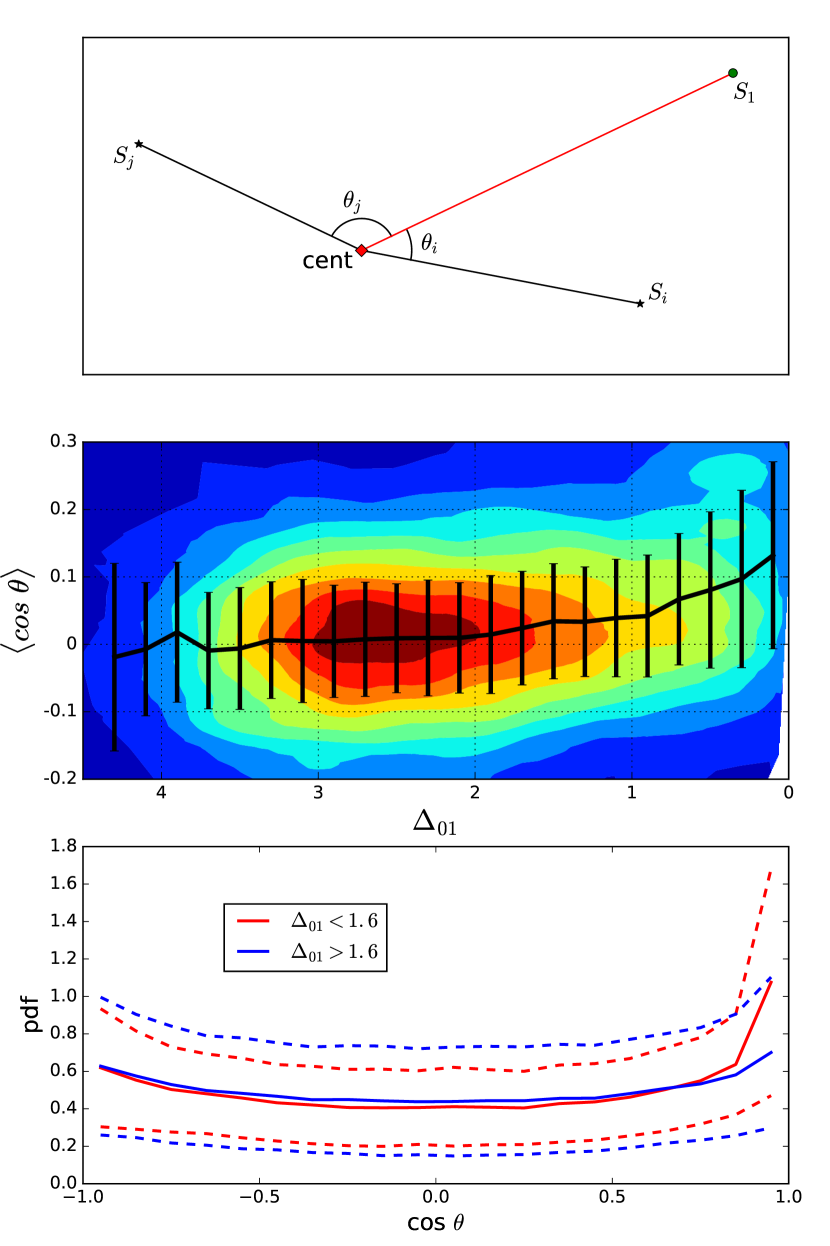
We also show the angular distribution of the satellites in Fig. 5. We define to describe the angular position of satellites with respect to the largest (ie. the most massive) satellite and the configuration of is shown in the top panel. The distribution of average value of cos is shown in the middle panel. As we can see, for larger value, the average value of cos is close to . The average value of cos tends to be larger when decreases, which means the angular distribution of all satellites is affected by a large satellite, with a greater number of satellites located on the same side at the largest satellite. We show the angular distribution of two samples in the bottom panel. The angular distribution of satellites shows some kind of elliptical form, with more satellites staying at the position with cos, especially for galaxies with lower . For MW-like samples, we limit in a narrow range with , about 9 percent of the satellites stay in a narrow cone that shares the orientation of the largest satellite (cos 0.9).
What leads to the slightly larger distance and more narrow angular distribution of satellite galaxies if there is a massive satellite, such as the LMC? One possible reason is that the most massive satellite is recently accreted and is still orbiting in the outer halo region of the central galaxy. As a massive satellite galaxy may have its own satellit, i.e., satellite of a satellite, these satellites are still concentrated around the massive satellite, leading to a slight larger distance and angular distribution towards the massive satellite. Another possible reason is that there is a low potential region between the center and the largest satellites because of their gravity, hence some of the satellites are trapped in the low potential region.
3.3 Satellites in neighborhood of LMC
So far, more than 50 Milky Way satellites have been detected and 13 of them are locate within 50 kpc of the LMC (Koposov et al., 2015; Bechtol et al., 2015; Drlica-Wagner et al., 2015; Homma et al, 2018; Kim & Helmut, 2015). In this section, we will investigate the satellites in the neighborhood of LMC-like satellites and satellites of LMC analogues before their accretion. In last sections, we selected the satellites in our model with a magnitude cut of , considering the resolution limit (see bottom panel in Fig. 3). However, in observations, 12 of 13 satellites in the neighborhood of LMC are faint with , except for the SMC (). In this section, we change our magnitude cut to to make a prediction of satellites near to the LMC. Here we note that our model predictions for very faint satellites may be affected by the simulation resolution.
In the CDM scenario, a satellite galaxy is the remnant of a merger event. For each halo in our model, we trace its massive satellite, labeled as , back to the snapshot before it is accreted. In that snapshot, was a central galaxy in its own FoF group, with a number of satellites in that halo. After merged with a massive galaxy, its satellites become satellites of the new central galaxy and some of them have merged with the central, while others survived.
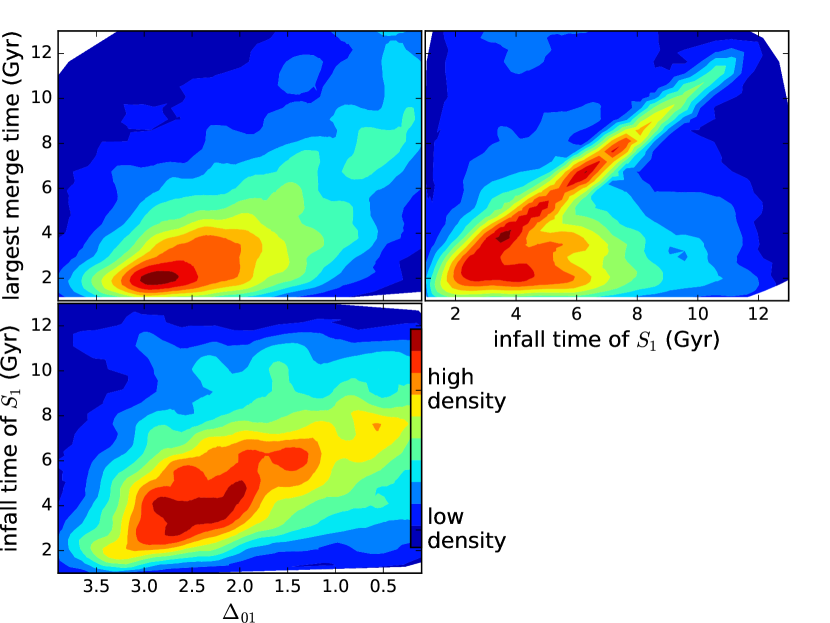
In this section, we investigate the infall time of and the fate of its satellite galaxies after is accreted. We also record the merger time, labelled as the largest merger time of the halo, in which the merger event contributed the greatst number of satellites. In Fig. 6, we show the distributions of the infall time of , the largest merger time and the gap . From the lower left panel, it is found that there is a correlation between infall time and , such that the satellite is more massive the later the merger event. This is reasonable, as the dynamical friction time is short for a massive satellite galaxy, so its presence indicates a very recent merger. The upper right panel shows that there is a very good correlation between the infall time of and the largest merger time, indicating that usually the most massive satellite contributes the highest number of satellite galaxies.
The upper left panel is the relation between the largest merger time and . We use the largest merger time as a tracer to the formation time of the galaxy. When is smaller, the largest merger time tends to be later, which means the value of a galaxy is correlated with the history of halo accretion. Some investigates (e.g., Zentner et al. (2005)) have shown that the gap between the main halo and the largest halo is related to the halo assembly history, which is the main dirver for the gap in stellar mass between galaxies. However, there is some difference between the galaxy gap and the halo gap, since some other processes, such as cosmic reionization and galaxy mergers, might also make some contribution. We have shown in Fig 2 that for the same stellar mass of the center galaxy, the halo mass tends to be larger when a galaxy has a smaller value, suggesting that the deviation of halo mass is correlated with the halo assembly history. Lu et al. (2016) have shown that that galaxies with a slower accretion ratio have a larger central galaxy, considering the relation between halo assembly history and .
Now we check the fate and origin of the satellites around . We classify the satellite galaxies in each halo into three classes, . Class represents all satellites which were satellites of before accretion and have survived until present, ie, they are still satellites in a galaxy group while not merged into other galaxies. Class are the neighbor satellite of , where we define the neighbor as those within a distance of 50 kpc from . Class are neighbors of and they were once satellites of before accretion.
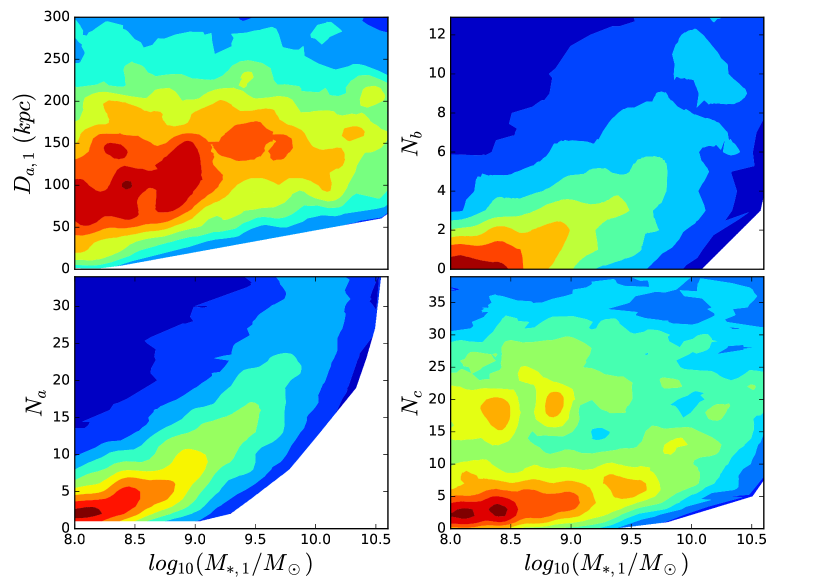
In Fig. 7 we show the properties of the satellites associated with . Note that here the x-axis is the stellar mass of the massive satellite, labeled as . The upper left panel shows the average distance between the largest satellite and class a satellites. The average distance spread from dozens of kpc to hundreds of kpc and shows no significant correlation with the mass of the largest satellite. The average distances is of the order of the virial radius of the host halo, which means that, after infall, most of the satellites of escape from and become satellites of the center galaxy. The lower left and upper right panels show the number of class and class satellites, labeled as and . They show that both and are well correlated with the mass of , indicating that more massive satellites bring more satellites when they infall and may keep more of these satellites from their neighbors for a long time up to the present. The bottom right panel shows the distribution of the number of class satellites, -. There is no strong correlation between and , showing that the number of satellites in neighbors of cannot be predicted from the mass of only.
Fig. 7 is for all MW analogues with stellar mass between and . If we limit the LMC-analogues mass as , we find that there are on average satellites that were satellites of LMC before infall into the MW and satellites still stay in the neighborhood of the LMC, while others are stripped and distributed with a distance larger than kpc to the LMC. If we use the satellite magnitude cut of to select our samples, we find that there are on average satellites that were satellites of the LMC before their infall into the MW and satellites still stay in the neighborhood of LMC with . Dooley et al. (2017) and Shao et al. (2018) also obtained similar conclusions with ours.
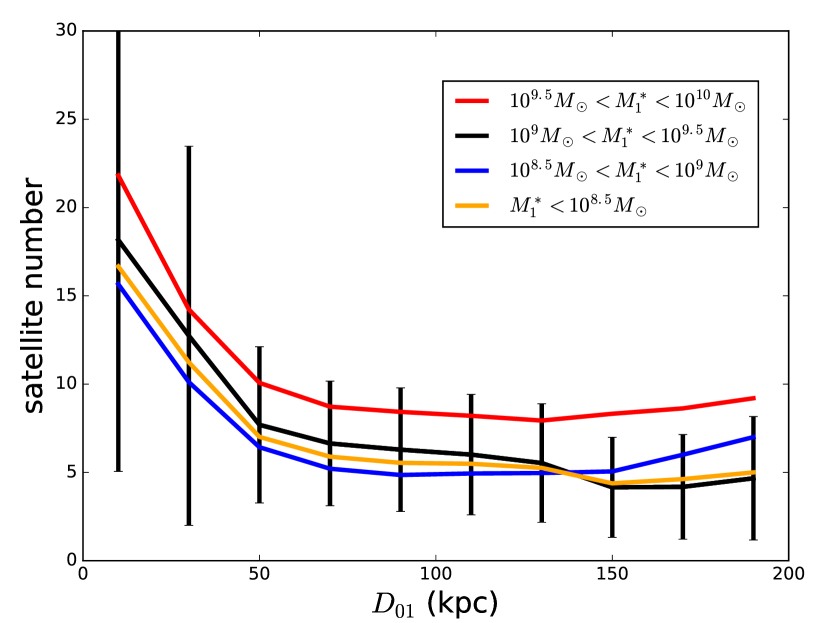
To make a prediction about the neighbor satellites around the massive satellite , in Fig. 8 we show the relation between the number of satellites within kpc of and the distance between the massive satellite and the central galaxy, . Here we show the results of in different mass bins. It is shows that, for larger than , the number of satellites is slightly larger than the numbers in other mass bins, which means the mass of has some effect on the number of neighbor satellites. For LMC like satellites (the black lines) or satellites smaller than LMC (blue and orange lines) , the difference in the number of neighbor satellites is much smaller, while the distance to the central galaxy has a dominant effect on the number of neighbor satellites. We predict from this panel (black line) that satellites with should be observed within 50 kpc of the LMC. If we change the magnitude cut to , there are satellites.
In reality, LMC has only one satellite with (SMC, with ) and 13 satellites with within kpc. Compared with the model, there are more faint satellites and fewer bright satellites observed around the LMC. One possible reason is that the resolution of the simulation we used, MS-II, is still too low and is not able to resolve and trace the very low mass haloes and subhaloes. In addition, in the model we do not consider the stripping of the satellite stellar mass, so the model may overestimate the number of bright satellites.
4 COMPARISON WITH SAGA
SAGA aims to measure the distribution of satellite galaxies up to the luminosity of Leo dwarf () in around 100 MW analogs (Geha et al., 2017). Early results have been published for eight galaxies. The SAGA team found that there is a large scatter between the eight galaxies and, in general, the observed satellite luminosity function has a flatter distribution compared with the prediction. Still, there is a missing satellite problem, with more faint satellites not being observed. In this section we compare the SAGA results with the predictions from our semi-analytical model. Note that here we select MW-analogous galaxies using the stellar mass of a central galaxy with the same coverage as SAGA, as introduced in Section.2.
In the first release data of SAGA, the eight galaxies have 27 satellites in total, among them, one galaxy has nine satellites, while four galaxies have only two satellites, thus the satellite luminosity function of each galaxy has large scatter and depends on the host luminosity. Here we combine the total satellite of the eight host galaxies and plot the luminosity function using the magnitude difference from the host. This will eliminate the dependence on the host luminosity. In Fig. 9 we show the satellite luminosity function as a function of , where , is the r-band luminosity of the satellite and the host galaxy.
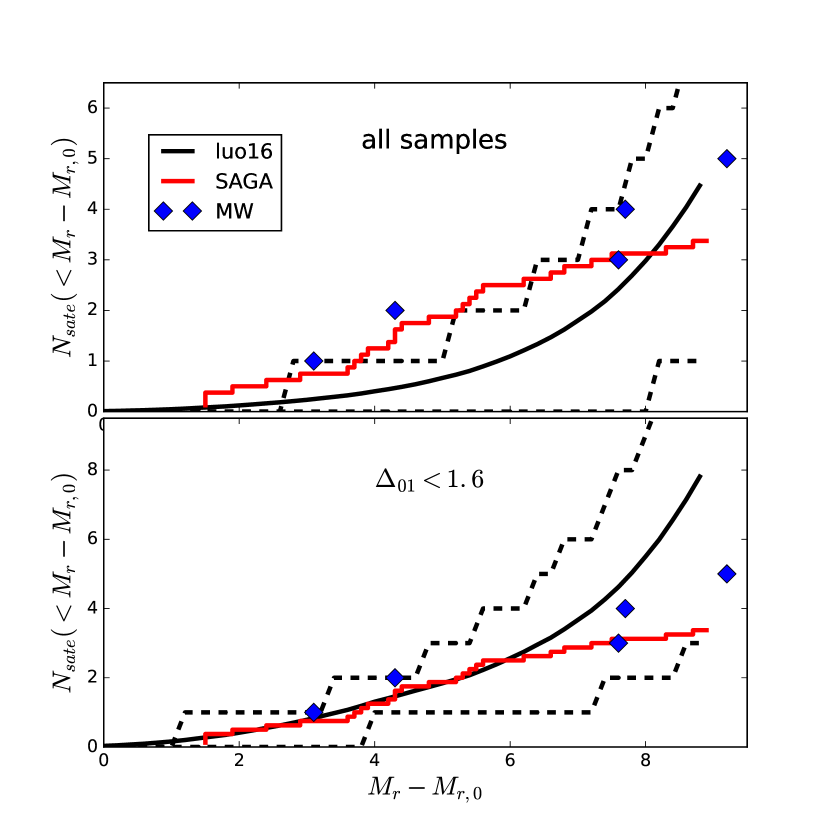
The upper panel of Fig. 9 shows that, in general, the satellite luminosity of the MW is consistent with our model prediction, indicating that the SAM (Luo et al., 2016) has correctly captured the physics of galaxy formation on small scales. This is not surprising, as the model is based on the L-Galaxy model (e.g., Guo et al. (2013)), which is tuned to fit the galaxy stellar mass function up to the very faint end. The satellites distribution from SAGA is very similar to that of the MW, except at the faint end, where SAGA has fewer faint satellites. Compared with the SAM prediction, both SAGA and MW have more bright satellite galaxies, but SAGA has fewer faint satellites than the predictions. One possible reason is that SAGA missed some faint satellites, which may be due to its observational strategy. On the other hand, our model might have something incorrect, which means some phenomenon in observations is not well reproduced, such as missing satellite problem.
In the bottom panel of Fig. 9, we plot the distribution of samples with . We find that, once we compare SAGA and MW satellite distributions with samples that contain a large satellite, the model agrees well with observation data at the bright end, while the model shows more satellites at the faint end. This indicates that the contribution of the most massive satellites should not be negelected when we define MW analogues using stellar mass selection.
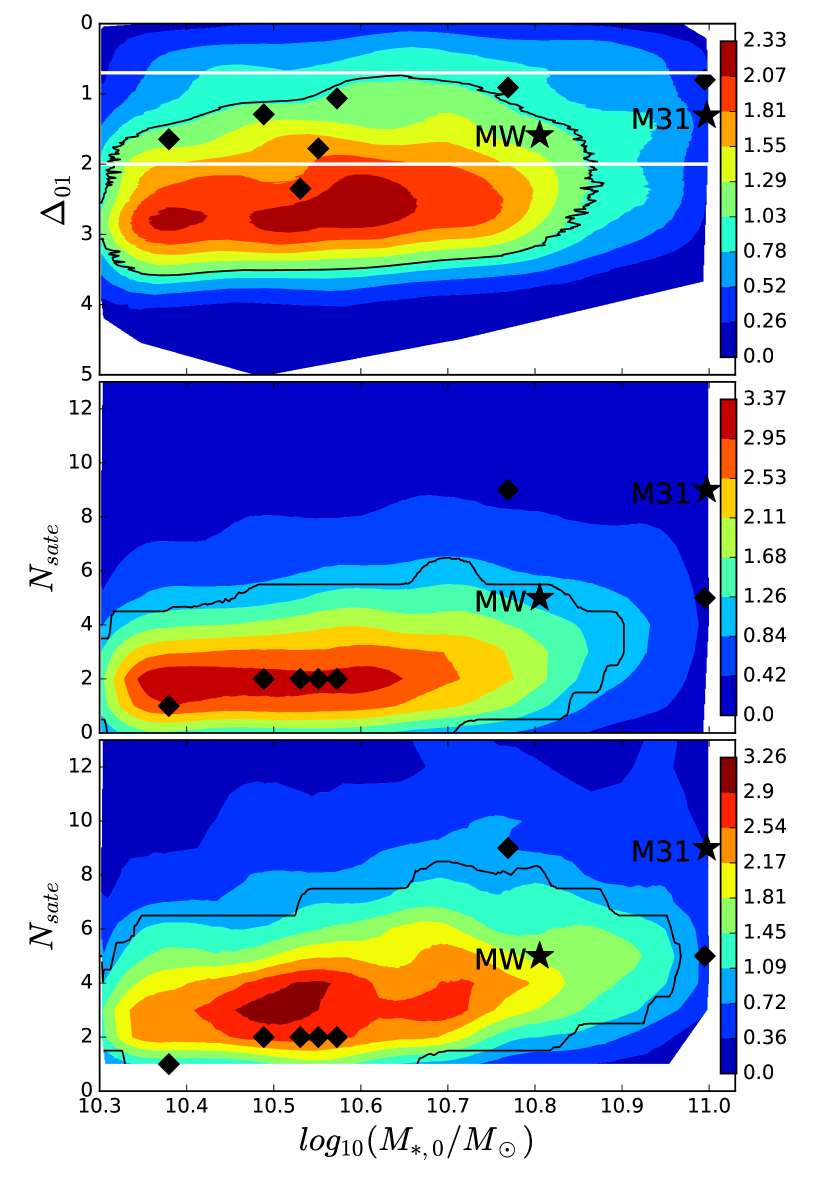
Now we check further if the distribution of the brightest satellite in SAGA is consistent with the model prediction. In upper panel of Fig. 10, we show the relation between and the stellar mass of the central galaxy. The black diamonds represent SAGA galaxies, and black stars denote the MW and M31. It is seen that there is a weak trend that larger central galaxies have smaller , consistent with the result in Fig. 1. Compared with the model result, most SAGA have a smaller , also consistent with that of MW and M31. From Section.3, we have found that the stellar mass-halo mass relation is dependent on the stellar mass of the central galaxy and .
Then we estimate the deviation between SAGA and our simulation samples. Here we only count the number of satellites, , with according to the magnitude limit of SAGA. In the middle panel of Fig. 10, the colored contour shows the distribution of for all model galaxies regardless of their . The SAGA galaxies seem to have similar satellite numbers to the model prediction, but we notice that all SAGA galaxies have smaller than most of the model galaxies (see the upper panel of Fig. 10). Therefore, considering the effect of the most massive satellite, as discussed in Section 3, the SAGA galaxies may underestimate the number of satellites. We then select central galaxies covering the same stellar mass and as the SAGA galaxies, corresponding roughly to the region covered by white lines in the upper panel of Fig. 10. The expected number of satellites is shown in the lower panel of Fig. 10. It is seen that both the satellite numbers of both the MW and M31 are consistent with our model, but the SAGA galaxy have a deficit of about two satellites on average per host galaxy. As previously shown, the satellites produced in our model that have not yet been found in observations should be faint, close to the detection limit of .
Finally, we note that SAGA currently only has satellite data for eight galaxies, as also mentioned by their article (Geha et al., 2017), i.e. the sample size is still too small. With more data available in future, the satellite luminosity function can be measured more accurately and comparison with the model will be more reliable.
5 CONCLUSIONS AND DISCUSSION
Both observational and theoretical studies have found that the Milky Way (MW) is atypical in that it contains more bright satellites, such as the LMC and SMC, than the MW analogues. In this work, we use model galaxies from a semi-analytical model combined with high-resolution N-body simulations to study the effect of the largest satellite in a galaxy system on the whole satellite population. In particular, we select the MW-analogous galaxies in our sample and investigate the effect on the satellite number density and spatial distribution when there is an LMC-like satellite. Our results can be summarized as follows:
-
•
By selecting MW analogues using the stellar mass of the central galaxy, we find that galaxies with an LMC-like satellite have a larger dark matter halo mass and more satellite galaxies than those without an LMC-like satellite. The difference disappears when MW analogues are selected using the halo virial mass. We also find that the gap between the center and the largest satellite is correlated with the largest merger time.
-
•
The space distribution of satellites tends to be slightly away from the center galaxy and to be asymmetric, with more satellites concentrated on the line between the central galaxy and the largest satellite when there is a large satellite. The degree of anisotropy is correlated with the mass of the largest satellite.
-
•
A large satellite is accreted into the MW more recently and brings more satellites if its mass is larger. It is found that the LMC has brought satellites with into the MW and about satellites still remain in the neighborhood with distance kpc from the LMC. Others have been scattered into the MW halo. Considering the contribution of satellites not from the LMC, we predict there are on average satellite galaxies within a distance of kpc from the LMC. This number is less than is observed around the LMC (13 satellites). We note that the simulation we used does not have high enough resolution to resolve and trace very low-mass haloes and subhaloes. Thus a further study using higher-resolution simulation is called for.
-
•
When comparing the early data from SAGA with the Milky Way and the model, we find that SAGA has a similar distribution of bright satellites to the MW and our semi-analytical model and has fewer faint satellites than our model. On the one hand, we suggest that the deviation between SAGA and our model might be due to their observation techeniche, which means that SAGA is focusing on finding bright satellites. On the other hand, the deviation might be due to the inaccurate of our model. However, the conclusion should be taken with caution, as there are currently satellites data for eight galaxies from SAGA and a further comparison is needed after it finishes the survey for about 100 MW analogues.
We select MW analogues containing an LMC-like satellite and predict the number of satellites in the neighborhood of LMC-like satellites. In the true MW system, LMC and SMC stay very close to each other and each of them has their own small-scale satellite system. LMC and SMC might affect each other and the satellites around them may be influenced by these two big members, which might make the satellite distribution deviate from our prediction. Besides this, such as the shape and colour of the central galaxy and the large-scale environment, might also influence the satellite distribution; these are not included in this work. We believe that further high-resolution hydrodynamical simulation of MW analogues would be ideal to study the satellites around the LMC and SMC.
Acknowledgments
The Millennium-II Simulation data bases used in this article and the web application providing online access to them were constructed as part of the activities of the German Astrophysical Virtual Observatory (GAVO). We thank the anonymous referee for valuable suggestions on the article. This work is supported by the National Key Basic Research Program of China (2015CB857003), the NSFC (No. 11333008, 11825303, 11861131006, 11703091). We thank Qi Guo and the members of our labotory for useful discussion.
References
- Angulo & White (2010) Angulo R. E., White S. D. M., 2010, MNRAS, 405, 143
- Bechtol et al. (2015) Bechtol K., et al., 2015, ApJ, 807, 50
- Bland-Hawthorn & Gerhard (2016) Bland-Hawthorn J., GerHard O., 2016, ARA&A, 54, 529
- Boylan-Kolchin et al. (2009) Boylan-Kolchin M., Springel V., White S. D. M., Jekins A., Lemson G., 2009, MNRAS, 398, 1150
- Boylan-Kolchin et al. (2010) Boylan-Kolchin M., Springel V., White S. D. M., Jekins A., 2010, MNRAS, 406, 896
- Boylan-Kolchin et al. (2012) Boylan-Kolchin M., Bullock J. S., Kaplinghat M., 2012, MNRAS, 422, 1203
- Brooks & Zolotov (2014) Brooks, A. M., Zolotov A., 2014, ApJ, 786, 87
- Brooks et al. (2017) Brooks A. M. et al., 2017, ApJ, 850, 97
- Bullock & Boylan-Kolchin (2017) Bullock J. S., Boylan-Kolchin M., 2017, ARA&A, 55, 343
- Bullock (2010) Bullock J. S., 2010, arXiv: 1009.4505
- Busha et al. (2011) Busha M. T. et al., 2011, ApJ, 743, 117
- Callingham et al. (2019) Callingham T. et al., 2019, MNRAS, 484, 5453
- Croton et al. (2006) Croton D. J. et al., 2006, MNRAS, 365, 11
- De Lucia & Blaizot J (2007) De Lucia G., Blaizot J., 2007, MNRAS, 375, 2
- Deason et al. (2013) Deason A. J., Conroy C., Wetzel A. R., Tinker J. L., ApJ, 777, 154
- Dierickx & Loeb (2017) Dierickx, M. I. P., Loeb A., 2017, ApJ, 847, 42
- Dooley et al. (2017) Dooley G. A. et al., 2017, MNRAS, 472, 1060
- Drlica-Wagner et al. (2015) Drlica-Wagner A., et al., 2015, ApJ, 813, 109
- Fu et al. (2010) Fu J., Guo Q., Kauffmann G., Krumholz M. R., 2010, MNRAS, 409, 515
- Fu et al. (2013) Fu J. et al., 2013, MNRAS, 434, 1531
- Geha et al. (2017) Geha M. et al. 2017, ApJ, 847, 4
- Guo et al. (2010) Guo Q., White S., Li C., Boylan-kolchin M., 2010, MNRAS, 404, 1111
- Guo et al. (2011) Guo Q. et al., 2011, MNRAS, 413, 101
- Guo et al. (2013) Guo Q. et al., 2013, MNRAS, 428, 1351
- Guo et al. (2015) Guo Q., Cooper A. P., Frenk C., Helly J., Hellwing W. A., 2015, MNRAS, 454, 550
- Henriques et al. (2015) Heneiques B. M. B. et al., 2015, MNRAS, 451, 2663
- Homma et al (2018) Homma D. et al., 2018, PASJ, 70S, 18
- Kang et al. (2016) Kang X., Wang L., Luo Y., 2016, MNRAS, 460, 2152
- Kauffmann et al. (1993) Kauffmann, G., White S. D. M., Guiderdoni B., 1993, MNRAS, 264, 201
- Kauffmann et al. (1999) Kauffmann, G., Colberg J. M., Diaferio A., White S. D. M., 1999, MNRAS, 303, 188
- Kim & Helmut (2015) Kim D., Jerjen H., 2015, ApJ, 808, L39
- Klypin et al. (2002) Klypin A., Zhao H., Somerville R. S., 2002, ApJ, 573, 597
- Klypin et al. (1999) Klypin, A., Kravtsov A., Valenzuela O., Prada F., 1999, ApJ, 522, 82
- Koposov et al. (2015) Koposov S., Belokuiov V., Torrealba G., Wyn Evans N., 2015, ApJ, 805, 130
- Leauthaud et al (2011) Leauthaud A., Tinker J., Behroozi P. S., Busha M. T., Wechsler R. H., 2011, ApJ, 738, 45
- Li et al. (2017) Li Z., Jing Y. P., Qian Y., Yuan Z., Zhao D., 2017, ApJ, 850, 116
- Liu et al. (2011) Liu L., Gerke B. F., Wechsler R. H., Behroozi P. S., Busha M. T., 2011, ApJ, 733, 62
- Lovell et al. (2012) Lovell M. et al., 2012, MNRAS, 420, 2318
- Lu et al. (2016) Lu Y. et al., 2016, ApJ, 830, 59
- Luo et al. (2016) Luo Y., Kang X., Kauffmann G., Fu J., 2016, MNRAS, 458, 366
- Maccio et al. (2010) Maccio A. et al., 2010, MNRAS, 402, 1995
- Mao et al. (2015) Mao Y. Y., Williamson M., Wechsler R. H., 2015, ApJ, 820, 21
- McConnachie (2012) McConnachie A. W., 2013, AJ, 144, 4
- Moore et al. (1999) Moore B. et al., 1999, ApJ, 524, L19
- Moster et al. (2010) Moster B. P. et al., 2010, ApJ, 710, 903
- Navarro (2018) Navarro J. F., 2018, arXiv: 1810.07431
- Newton et al. (2018) Newton O., Cautun M., Jenkins A., Frenk C. S., Helly J. C., 2018, MNRAS, 479, 2853
- Rodriguez-Puebla et al. (2013) Rodriguez-Puebla A., Avila-Reese V., Drory N., 2013, ApJ, 773, 172
- Shao et al. (2018) Shao, S. et al., 2018, MNRAS, 476, 1796
- Strigari & Wechsler (2012) Strigari L. E., Wechsler R. H., 2012, ApJ, 749, 75
- Springel et al. (2001) Springel V., White S. D. M., Tormen G., Kauffmann G., 2001, MNRAS, 328, 726
- Springel et al. (2005) Springel V. et al., 2005, Nature, 435, 629
- Springel (2010) Springel V., 2010, ARA&A, 48, 391
- Tollerud et al. (2011) Tollerud E. J., Boylan-Kolchin M., Barton E. J., Bullock J. S., Trinh C. Q., 2011, ApJ, 738, 102
- Trowland et al. (2013) Trowland H., Lewis G., Bland-Hawthorn J, 2013, ApJ, 762, 72
- van den Bosch et al. (2005) van den Bosch F. C., Yang X. H., Mo H. J., Norberg P., 2005, MNRAS, 356, 1233
- Vera-Ciro et al. (2013) Vera-Ciro C. A. et al., 2013, MNRAS, 428, 1696
- Vogelsberger & Zavala (2013) Vogelsberger, M., Zavala J., 2013, MNRAS, 430, 1722
- Wang et al. (2015) Wang, W., Han J., Cooper A. P., Cole S., Frenk C., Lowing B., 2015, MNRAS, 453, 377
- Wetzel et al. (2016) Wetzel A. R., et al., 2016, ApJ, 827, L23
- Zentner et al. (2005) Zentner A. R., et al., 2005, Apj, 624, 505
- (62)