Transmission of danger information
past physical barriers by ants
Abstract
Can insects transmit information about a threat through a physical barrier they cannot cross? While the emission and detection of alarm pheromones is the universally accepted mechanism of panic communication, there are still open questions about the specific pheromones and type of ant-to-ant contacts involved in specific scenarios, and how relevant is the role of non-chemical communication. Here we report experiments suggesting that “panicked” ants can transmit danger information through a physical barrier to nestmates located in a safe arena when danger is simulated by using insect repellent. As ants in the safe arena get danger information from nestmates trapped in an area contaminated with a chemical, they retreat from the barrier in average. Visual clues and pure mutual antennation seem to play a minor role as mechanisms of danger information transmission through the obstacle. A detailed quantification of the ant behavior reveals that examination of the legs of ants in the danger arena by nestmates in the safe one may be relevant for danger information transmission.
Introduction
One of the first attempts to demonstrate that ants are able to transmit danger information to other ants was reported in 1881 by Sir John Lubbock. To investigate the matter, he used state of the art technology of his day: the telephone. He “disturbed” a nest of Lasius niger having a telephone held close over the nest. A second telephone was placed at a nearby nest of the same species, assuming that, if any audible danger signal was transmitted through the telephone line, “the ants in the other nest ought to have been thrown in confusion”. Unfortunately, the author did not find any evidence of it [1]. More than 130 years later, the subject of how ants communicate danger is still not fully understood.
Ants are known to use a wide variety of mechanisms for communication [2, 3, 4] like acoustic signals [5], tapping [6], oral transfer of substances (trophalaxis) [7] and even “simple" physical contact [8]. However, there is consensus that the emission and detection of specific chemicals called pheromones is their main communication mechanism [9, 10]. In fact, ants use different pheromones to transmit information related to scenarios spanning from foraging to danger. Communication mechanisms are further complicated by the fact that the effects of pheromones are caste, age, and context-dependent [11, 12]. In particular, the reaction to alarm pheromones may be either “Flight" or “Fight": in the first, the receivers escape from the source of danger, while in the second they are attracted to, and eventually attack, the threat [13, 14]. However, which of the two is triggered by the pheromone depends on many factors, such as the pheromone specific chemical composition and concentration, the spatial context where the emission and detection takes place, and the age of the participating ants [2, 15, 16].
The eventual touching between the antenna of two ants, known as mutual antennation, is believed to allow recognition of members of the same nest [2] –-a process involving both sensing and emission of chemical signals [17, 18]. Other uses of mutual antennation are the subject of debate, like the possibility of communicating nestmates the correct (and incorrect!) foraging paths [8, 19, 4]. One unanswered question, for example, is whether ants can transmit any danger information by mutual antennation. Our previous research on foraging ants submitted to a localized perturbation suggests that danger information is not transmitted by mutual antennation over large distances [20]: a short-range study is necessary.
Here we investigate the transmission of information from a group of ants located into a first physical space were they are experiencing danger associated to an insect repellent, to ants located into a different physical space. Our experiments reveal that “panicked” ants of the species Atta insularis [20, 21, 22] locked into an arena where the repellent is injected, are able to transmit danger information to ants in a safe arena, located on the opposite side of a separating barrier. Instead of being “thrown in confusion” (or trying to help their endangered nestmates) the ants in the safe area react by moving away from the barrier. Experiments performed with different types of barriers suggest that visual clues and mutual antennation are not the ways danger information is transmitted: “body search” seems to be needed –with emphasis in legs.
Results
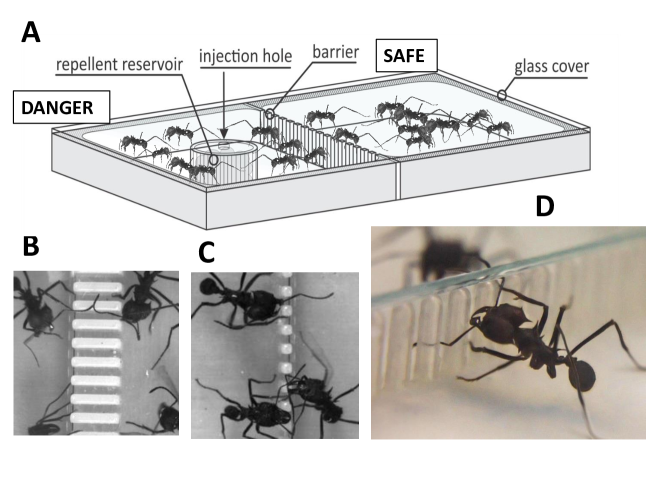
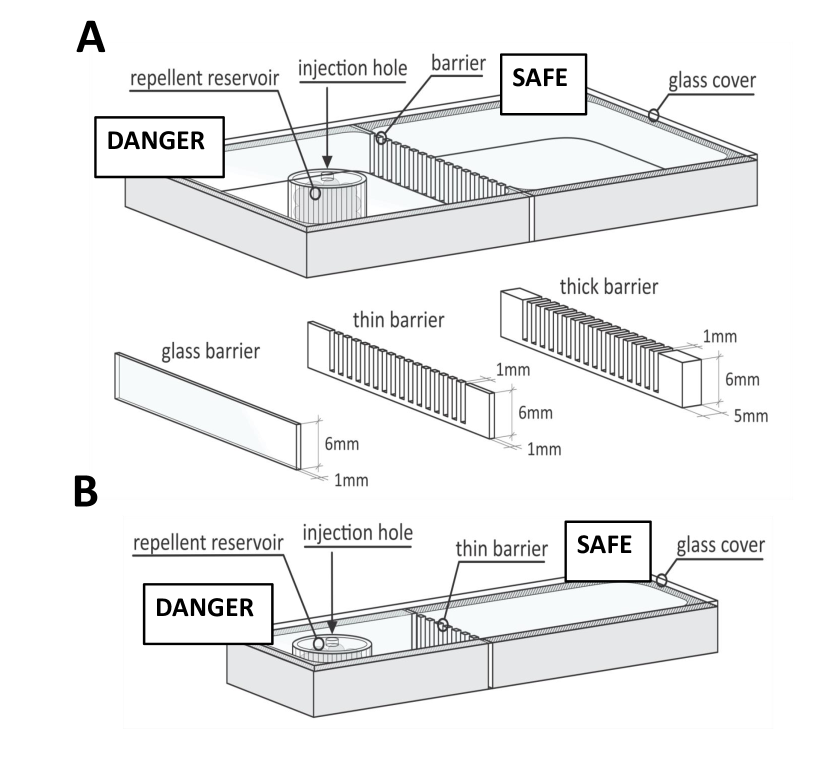
A system consisting in two-cells separated by a barrier was designed to probe the possible transmission of danger information by ants in one cell to ants in the other cell through an obstacle –see Fig.1A. In a typical experiment, ants are deposited in both cells, which are filmed during 5 minutes. Then, an insect repellent is added at the center of the DANGER cell, and another 10 minutes of film is taken. In a CONTROL experiment, the same procedure is followed, except for the fact that no ants are introduced into the DANGER arena. We hypothesize that, if ants in the SAFE arena move away from the barrier after the addition of the repellent a significantly larger distance than they do during a CONTROL experiment, DANGER information has been transmitted by the “panicked" ants in the DANGER cell to the ants in the SAFE cell, beyond any “passive" diffusion of the repellent through the barrier.
In an attempt to understand the details of the possible mechanisms of danger information transmission, we use different kinds of barriers (see section “Experimental details"). The GLASS barrier is a glass wall, the THICK barrier is made in such a way that ants from both sides of the barrier can touch their respective antennas, but cannot antennate the bodies of individuals in the opposite arena (Fig.1B), while the THIN barrier does allow it (Fig.1C, D).
The experiments are performed in workers of the ant species Atta insularis, called bibijagua in Cuba.
Collective behavior: response of the center of mass
After converting the video images to binary format, we track the Center of Mass (CM) of the black pixels (assumed to be proportional to the presence of ants) in both cells for each protocol. As illustrated in Fig.2, A to C, for typical experiments in the 2D Arena, the motion of the CM at the DANGER cell is always near its geometrical center, independently from the protocol used. A similar situation holds for the SAFE cell, with the conspicuous exception of THIN, where the CM of mass tends to move away from the barrier starting a few seconds after the repellent is added to the left cell. Fig.2, E to H shows the time evolution of the x-position of the CM at the SAFE cell, corresponding to the average between repetitions of each type of experiment (the plotted data is tabulated in table TableA1 as Additional Information, where and are the initial and final potisions of the CM, respectively).
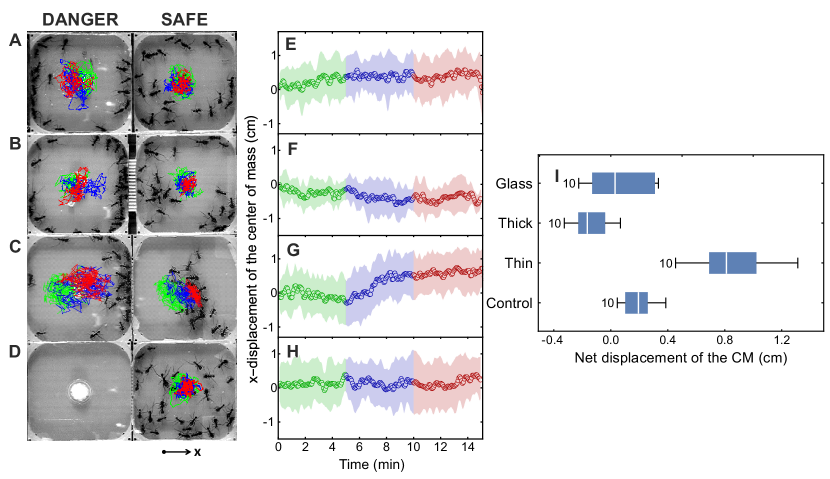
After each experiment is replicated times, we quantify the motion of the CM in the SAFE cell by plotting its net displacement, calculated as the difference between its final and its initial positions averaged over the 5th and 15th minutes of the experiment, respectively (averaging over the first and the last 5 minutes yields qualitatively similar output). The results are plotted in Fig.2I, and corroborate the picture suggested by Fig.2, A to H: Only in the THIN protocol, the addition of repellent at the DANGER cell induces an “escape response” in the ants trapped in the SAFE cell.
The fact that the net displacement of the CM in the THIN protocol statistically differs from the other ones was demonstrated using the Mann-Whitney non-parametric test [23] (see Statistical Analysis section). With this we are also saying that the CONTROL experiment shows that the mere diffusion of the repellent from the DANGER to the SAFE cell does not produce a significant shift of the CM in the SAFE cell. So, the “escape response” at the SAFE cell is mediated by some kind of danger information transmitted by panicked ants at the DANGER cell, to the ants at the SAFE cell.
Fig.2C also reveals an interesting behavior the ants in the SAFE arena follow as they escape from the barrier after addition of repellent in the DANGER cell: they often cluster together at a certain distance from the barrier, avoiding touching the other three walls of the SAFE cell. The retreat process is gradual, taking from to minutes, measured as the saturation time in a curve like the one shown in Fig.2G. Such behavior is quite different from the immediate reaction seen in ants when directly exposed to insect repellent [21].
Individuals in the crowd
Having established that only the THIN protocol promotes the propagation of danger information through the barrier, we study in detail the individual behavior of ants confined in the SAFE cell of the 2D arena only using thin barriers. randomly selected ants were tracked manually during different repetitions of the THIN protocol: and individuals from the SAFE (right) and DANGER (left) cells, respectively. Fig.3A illustrates typical trajectories of just one ant in the DANGER cell and one ant in the SAFE cell. The color code is the same as the one used before: green, blue and red correspond to the first, second and third 5-minute periods of an experiment. The trajectories suggest that ants at the DANGER cell tend to move away from the center of the cell as soon as the repellent is added (i.e., after the first minutes of the experiment), and rapidly tend to concentrate near walls, especially near the wall separating both cells. This behavior seems to be related to the existence of slits in the separating wall, while the other three walls are smooth. The tendency to explore the boundaries is consistent with the interpretation that the ants seek to escape from the DANGER cell, and are in an alarm (or panic) state. In some occasions, we observed that ants in the DANGER cell walked near the walls revolving around the center either clockwise or counterclockwise, reminiscent of classical patterns observed in army ants when moving in featureless arenas [24] and in “marching locusts” [25].
More importantly, Fig.3A also reveals that the trajectory of a typical ant in the SAFE cell shows a qualitatively different kind of motion: each ant follows a spatially complex path which includes eventual excursions to explore the barrier after the addition of the repellent in the DANGER arena: for example, one exploration to the zone near the barrier is seen in Fig.3A occurring during the second 5 minutes of the experiment –blue line. However, the change in average position of the ant between the beginning and the end of the experiment is not random: it will be quantified using a graph we have called “touch-and-go” plot (). The idea behind the plot is to examine the correlation between the averaged final and initial positions of the ant, and the time it spends in excursions to explore the barrier during a given experiment or section of an experiment. In other words: plots indicate how important is the potential information an ant receives at the barrier, to decide what will be its “final destination” inside the SAFE cell.
The plots for individuals in the 2D experiments, is shown in Fig.3, B and C. Such graphs are constructed in the following way, based on the tracked trajectory of an individual ant: the total time spent by the ant near the barrier (i.e., at a distance from it equal or smaller than half body length) is plotted in the horizontal axis of the graph, while the net displacement perpendicular to the barrier during the time window of interest, is plotted along the vertical axis (notice that such plots give information of ants in the safe zone being near the barrier, but we do not know if nestmates were simultaneously on the opposite side of the barrier at the DANGER arena). We have made plots for the first minutes of the experiment, before the addition of the repellent (Fig.3B), and for the last minutes of the experiment, where ants in the DANGER cell are in panic (Fig.3C). The displacement for the first 5 minutes of the experiment (i.e., before the addition of the repellent in the DANGER cell) was calculated as , where the first and second terms in the right side of the expression are time averages of the horizontal position of the ant between minutes and , and during the first minute of the experiments, respectively. The displacement for the last minutes of the experiment (i.e., after the addition of the repellent in the DANGER cell) was calculated as where the first and second terms in the right hand of the expression are time averages of the horizontal position of the ant during the 15th and the 5th minutes of the experiment, respectively (averaging the first 5 minutes and last 5 minutes yields qualitatively similar results). Notice that these displacements are represented as the size of the vertical segments in the plots.
The plot for the first minutes of the experiment (Fig.3B) shows that the ants in the SAFE cell either approach or move away from the barrier. That behavior includes ants that spent time near the barrier (open circles) and also those that never got near it (gray circles). If displacements are averaged over all tracked ants, we get zero, with a standard deviation represented by the horizontal gray band in the graph. Notice that some ants have spent lapses with a total duration somewhat larger than seconds near the barrier.
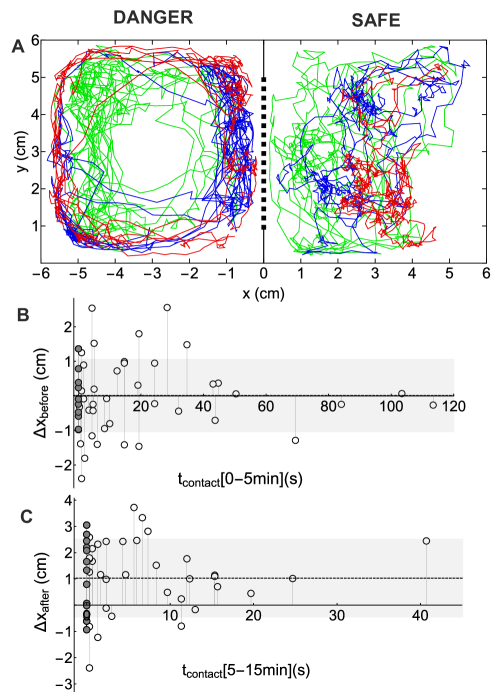
The plot for the last minutes (Fig.3C) reveals a completely different situation for the ant dynamics in the SAFE cell: most ants spend substantially smaller times near the barrier, and show a net motion away from it. It results in an average displacement over all the tracked ants of approximately , indicated by the dotted horizontal line in Fig.3C. Interestingly, the retreat from the barrier is not a behavior exclusive of the ants that visited it (open circles) but also of some of those that were always far from it (gray circles): it strongly suggests that danger information is not only transmitted through the barrier from the DANGER to the SAFE arenas, but also within the SAFE arena. So, the collective reaction in the SAFE cell shown in Fig.2, C and G may be due to a combination of two factors: the escape of individuals away from the barrier after acquiring danger information that tunnels through it, complemented by the influence of those “informed” ants on nestmates that never got near the barrier either by pushing them or by passing some “chemical cue" to their nestmates in the same arena. This constitutes a peculiar combination of individualistic and (possibly) altruistic behaviors. We underline that ants in the SAFE arena touching the barrier are able to sense the danger transmitted from nestmates in the DANGER side, but they move away instead of trying to help them or attacking the possible threat.
All in all, if our results are compared with experiments in natural conditions showing that ants do not transmit danger information over meter-long distances in a foraging line [20], it may be concluded that the transmission of danger information between individuals is a short-ranged phenomenon (where short-ranged may be defined as a few body-lengths).
Communication through the barrier between isolated individuals
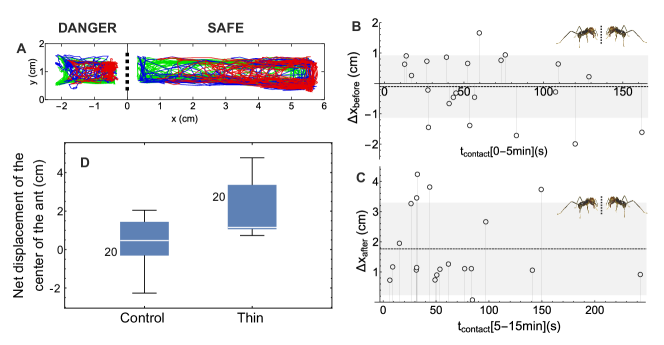
In order to gain further understanding on the mechanisms of danger information transmission through the barriers, we performed experiments in a Quasi-1D setup (Fig.6B). We followed protocols analogous to the THIN and CONTROL ones explained above, but introducing just one ant per cell.
The Quasi-1D results are quantified in graphs modified to underline the role of ant-ant communication at the barrier, that we will call Ant-Ant- plots. There, the total contact time near the barrier is counted only when there are ants near the barrier simultaneously at both sides of it. Fig.4B shows the Ant-Ant- plot before adding repellent. As in the case of Fig.3B, there was very little average motion of the ants away from the barrier before injecting the repellent fluid in the DANGER arena. Fig.4C displays the Ant-Ant- plot after adding repellent. The basic tendency to move away from the barrier seen in Fig.3C is confirmed here. However, there are some differences: both the total shift away from the barrier and the total time spent near it are larger in the Quasi-1D experiments than in the 2D ones. One possible explanation is that the absence of nestmates sharing the SAFE cell facilitates repeated explorations of the barrier, and also make easier the escape from it: single ants move more freely than when they share their space with nestmates. Moreover, if we compare Fig.4C with the simple graphs for the Quasi-1D experiment after addition of repellent, we see that shorter times spent near the barrier when ants are on the other side (Fig.4C) results in large net shifts away from it: this adds extra evidence supporting the fact that ant-to-ant contact through the barrier is crucial to provoke the escape reaction of the ants located in the SAFE zone. In the next section we further discuss the possible mechanisms involved.
Finally, Fig. 4D displays the difference in the net horizontal motion of the ant in the SAFE cell for THIN and CONTROL quasi-1D experiments, averaged over 20 repetitions. Again, the Mann-whitney non-parametric test was applied [23] (see Statistical Analysis section), which demonstrated significant difference between the average position shift. As in the case of the 2D experiments, it becomes clear that the presence of an ant in the DANGER arena significantly increases the motion away from the barrier of the ant in the SAFE arena.
Interactions at the barrier
A final set of observations were made to further understand the specific mechanism of danger transmission through the barrier.
Firstly, out of the experiments involving individual ants were chosen: those that showed the biggest net retreats of the ant in the safe arena after interacting in any way with the barrier or with the ant in the danger arena. In order to establish a quantitative criterium, we chose the 8 videos where the net shift away from the barrier was above the average of the 20 experiments, which was of approximately 1.6 cm. We defined a contact as any situation where the center of mass of the ant in the SAFE arena is less than cm from the barrier (i.e., the ant is within one body length from the barrier). Firstly, from the videos mentioned above, all the contacts were automatically registered before and after the repellent was applied. Then, from each of the 8 videos, we selected the contacts that were immediately followed by a motion of 5 cm or more away from the barrier, resulting in an average contacts per video. Those interactions are assumed to be the most influential in the ant escape behavior. All in all, we studied a total of nearly events ( of them before and after application of the repellent).
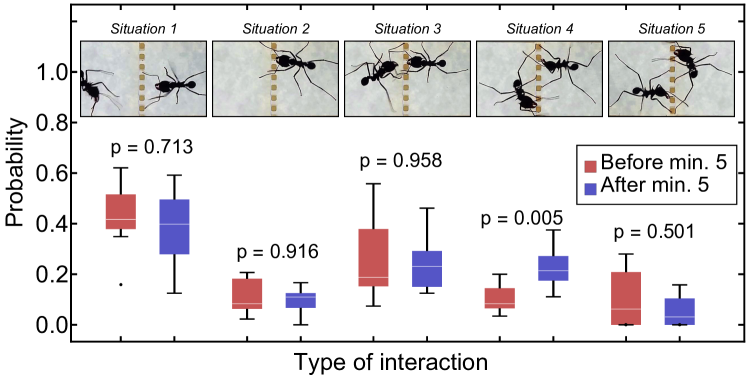
The horizontal axis in Fig.5 shows the different kinds of interactions that were observed in each contact. Situation shows the case when the ant in the safe arena simply caresses the barrier with its antennae. Situation is given when the ant explores with the antennae through the barrier. Situation , when mutual antennation occurs. Situation , when the ant on the safe arena touches with its antennae at least one leg of the ant in the danger arena, and Situation shows the inverse of the latter. While antennating the ground of the safe arena near the barrier is also a possibility (perhaps checking if some chemical has been sprayed through the barrier from the danger arena), it was not systematically observed.
The vertical axis in the lower row of Fig.5 is the probability of these interactions happening. It is obtained by dividing the amount of interactions of a given type, by all the interactions within the same period (i.e., the first minutes or the last minutes of the experiment). The red bars stand for the first minutes and the blue ones, for the last minutes. The white stripe within the boxes stands for the median and the extremes of the boxes for the and quantiles, being the dots outside the boxes the outliers. We applied a Mann-Whitney test with a significance level of , to each given type of interactions in order to find possible differences between the behavior prior and after applying the repellent. The graph reveals that only for Situation 4 there is a significant change in ant behavior after the injection of the repellent.
Discussion
The use of different types of barriers in our experiments allows us to eliminate a number of possible mechanisms of panic transmission. First of all, the absence of statistically significant motion away from the barrier in the GLASS experiments demonstrates that optical signals generated by the panicked ants within the DANGER arena do not transfer information to the ants in the SAFE arena. Interestingly, our results based on the use of a thick barrier, where antenna-antenna touching is the only way we observed of ant-ant physical contact (Fig.1D) also suggest that pure mutual antennation is by itself not enough to transmit effective alarm signals.
Then one possibility is that ants in the DANGER arena generate a certain combination of chemicals which are detected by nestmates touching them through the barrier. The first candidates are alarm pheromones secreted by the mandibular glands when mandibles are opened [26]. However, ants in the safe area did not display the typical behavior observed in Atta foragers in response to their own alarm pheromones (possibly 4-methyl-3-heptanone) [16]. No other kinds of alarm behavior like rapid walking with open mandibles, attacking the source of odor (the barrier, in the case of the SAFE arena), or rapid walking with intense movement of the antenna were observed [27]. Finally, the “rescue behavior” recently seen in other ant species exposed to either their own “help pheromones” or just in the presence of other ants in danger was not observed in our experiments [28, 29].
Fig.5 suggests that the only kind of interaction that substantially increases in importance after the addition of the repellent is the antennation of ants in the safe area on the legs of ants in the danger area (Situation 4, ). Interestingly, Figure 5 indicates that Situations 1, 2, 3 and 5 do not show any statistically increase after addition of repellent, so they have little chance to be responsible for the transmission of danger information. Our observation that the antennation by the ants in the SAFE arena to the legs of ants in the DANGER arena is the most frequent type of contact at the barrier introduces a number of plausible explanations. One is that specific chemicals emitted by some of the several exocrine glands located in the legs [30] of the panicked ants may provoke the retreat of their nestmates on the SAFE arena. The second is that panicked ants in the DANGER arena carry to the barrier, especially in their legs, the scent of the repellent fluid used in the experiments, so it is more easily detected by ants on the other side by antennating their panicked nestmates through the bars –which is more a danger cue than true communication. In any case, such interest in extracting information from the legs is consistent with an observation of Wang et al. [18] referring to Iridomyrmex purpureus ants: “workers paid more attention to the antennae of the non-nestmate and the legs of nestmates”.
We have also established that the receptors of danger information eventually tend to aggregate together in the SAFE arena, moving away from the source of panic, a behavior very well known in very distant species, like fish when detecting an alarm odor [24, 31]. In our case, the clustering may help the protection of individuals from the threat, but certainly restricts the possibility of exploring systematically the source of danger information, which is more freely tackled by individual ants.
In summary, our experiments reveal that ants confined in an arena that are directly submitted to a threat (an insect repellent, in our case) show a distinct, fast reaction to escape from the source of danger. These “pacnicked” ants seem to transmit information to nestmates into a safe area only if the physical obstacle separating the two arenas is so that ants in the safe arena can antennate different parts of the bodies of their panicked partners, especially their legs. Optical signals or pure mutual antennation do not seem to be the relevant mechanisms for information transmission. Furthermore, the informed ants in the safe arena are not “thrown in confusion” [1]. Their reaction is opposite to it: in average, they move away from the barrier over a time span of the order of minutes, clustering at a certain distance, while individuals eventually detach from the cluster to examine the barrier, and return. The transmission of information from the ants in the danger side may or may not be truly altruistic, but the reaction of the ants in the safe area indicates a non-altruistic behavior.
Experimental
0.1 Experimental details
Two types of devices have been designed for the experiments. The first is the 2D setup, shown in the upper panel of Fig.6A. It consists in 3D printed cells of separated by different types of barriers, as represented in the lower panel of Fig.6A. The GLASS barrier is a tall wall of thick transparent glass. The THICK barrier is a row of tall vertical pins of rectangular cross section . The THIN barrier is similar, but with pins of square cross section of each. The second setup is shown in Fig.6B, and consists in a modification of the 2D setup where only a section of the THIN barrier is used. We call it quasi-1D setup.
The 2D setup is used to study collective behavior, as follows: groups of approximately 25 freshly collected workers of Atta insularis [20, 21, 22] are introduced into each of the two cells separated by a barrier. The cells are covered by glass plates. After 5 minutes, micro-liters of Citronella insect repellent [21] is injected at the center of the left cell through a -diameter hole in the covering plate (the repellent is absorbed by a cotton blob stuffed into a 1-cm diameter porous cylinder 3D-printed as part of the cell). The left and right cells will be referred to as DANGER and SAFE, respectively. We term our protocols GLASS, THICK and THIN, corresponding to the use of barriers shown in Fig.6. Fig.2, A, B and C shows snapshots of GLASS, THICK and THIN experiments, respectively. Finally, the CONTROL protocol is similar to THIN, except for the fact that the DANGER cell is always empty of ants (the repellent is added just as in previous protocols). Fig.2D shows a snapshot of a control experiment. The cells are thoroughly cleaned with an ethanol-water solution previous to experiments.
The Quasi-1D setup is used for individual behavior experiments. The protocol followed is basically the same described above for the THIN barrier, except for the fact that only one ant is introduced into each of the two cells.
The cells where fabricated from Durus White 430 polymer, using an Stratasys Objet30 3D printer. Data were collected using 5 colonies of Atta insularis located in different neighborhoods of La Habana, Cuba. Collections and experiments were made during different times along 2015, 2016 and 2017, including all seasons. Worker ants were picked up one by one by hand from fully developed foraging lanes, within 21:00 and 24:00 hours, and introduced into plastic cylindrical containers of 5 cm diameter and 20 cm height, used to carry them to the laboratory. The collected individuals had an average body length of 8 mm, with minimum and maximum values of 4 mm and 12 mm, respectively. All tests were performed in temperature conditions ranging from 27 and 310C. Collected ants were poured into the DANGER and SAFE cells approximately 30 minutes after collection in order to minimise the stress associated to removal from the foraging trail, and the experiment started .
The insect repellent used (Citronella) was produced by Labiofam (La Habana, Cuba). Citronella is the name given to an essential oil obtained from the leaves and stems of different species of Cymbopogon (lemongrass). While its exact action mechanism is not fully understood, it is clear is that Octopamine (OCT) is the target for essential oils activity in insects. Its presence has a correlation with active or stressful behavior and it is called the insects “fight or flight” hormone [32]. Based on the behavior that we have observed in our experiments, “flight” seems to be what is happening to the ants in the DANGER arena after the repellent is added –no “fight” signals are observed. When a stressful situation arises, ants’ octapaminergic system gets turned on by an increase in octopamine secretion. Essential oils components (such as those on citronella) mimic the effect of octopamine by binding the octopamine receptors [33]. Hence, we may say that our ants are reacting to the repellent in a similar fashion that they would to a (generic) source of danger.
0.2 Statistical analysis
The statistical data analysis was performed using the software Wolfram Mathematica . In order to determine if the behavior of the THIN experiments was significantly different from those corresponding to the GLASS, THICK and CONTROL experiments we employed a Mann-Whitney technique for testing the null hypothesis that the samples come from the same population or from identical populations with respect to the average (related to data shown in 2I). The null hypothesis is rejected at the level. So, using a significant level and applying the test to the pairs THIN-THICK, THIN-GLASS and THIN-CONTROL separately, we find that the three p-values are , and , respectively. Then, the THIN protocol statistically differs from the others.
For the case of the quasi-1D experiments, the same test was applied with the same significance level, yielding a p-value of , which demonstrates the statistical difference between the CONTROL and THIN protocols also in the quasi-1D experiments.
For the case of the graph shown in Fig.5, we also applied a Mann-Whitney test with a significance level of , to each given type of interactions in order to find possible differences between the behavior prior and after applying the repellent. The respective p-values are shown in Fig.5. Other tests were performed in order to check the same null hypothesis.
Acknowledgements
T. Shinbrot and A. J. Batista-Leyva are gratefully acknowledged for useful discussions. We thank A. Serrano for helping in the design of Fig.1. E.A. acknowledges an Invited Professorship supported by the CNRS at the University of Lyon. We acknowledge the insightful reports of two unknown referees.
Author contributions statement
E.A., M.S.T. and O.R. designed the experiments. G.S and O.R. constructed experimental apparatus. A.Re., F.T., E.A., A.Ri. and M.C. and performed the experiments. A.Re. and F.T. developed and programmed the image analysis software. A.Re., F.T., E.A., M.C., A.Ri. and O.R. analyzed the data. E.A, O.R, A.Re, M.C. and M.S.T. wrote the manuscript.
References
- [1] Lubbock, J. Observations on ants, bees, and wasps power of communication by somethig approaching to language. \JournalTitleNature 23, 255–258 (1881).
- [2] Hölldobler, B. & Wilson, E. O. The ants (Harvard University Press, 1990).
- [3] Jackson, D. E. & Ratnieks, F. L. Communication in ants. \JournalTitleCurrent Biology 16, R570–R574 (2006).
- [4] Popp, S., Buckham-Bonnett, P., Evison, S. E. F., Robinson, E. J. H.& Czaczkes, T. J. No evidence for tectile communication of direction in foraging Lasius ants. \JournalTitleInsect. Soc. , DOI 10.1007/s00040-017-0583-6 (2017).
- [5] Casacci, L. P. et al. Ant pupae employ acoustics to communicate social status in their colony’s hierarchy. \JournalTitleCurrent Biology 23, 323–327 (2013).
- [6] Franks, N. R. & Richardson, T. Teaching in tandem-running ants. \JournalTitleNature 439, 153–153 (2006).
- [7] LeBoeuf, A. C. et al. Oral transfer of chemical cues, growth proteins and hormones in social insects. \JournalTitleelife 5, e20375 (2016).
- [8] Reznikova, A. Experimental Paradigms for Studying Cognition and Communication in Ants (Hymenoptera: Formicidae). \JournalTitleMyrmecological News 11, 201 (2008).
- [9] Wilson, E. O. Chemical communication among workers of the fire ant solenopsis saevissima (fr. smith) 1. the organization of mass-foraging. \JournalTitleAnimal Behaviour 10, 134–147 (1962).
- [10] d’Ettorre, P., Deisig, N. & Sandoz, J.-C. Decoding ants’ olfactory system sheds light on the evolution of social communication. \JournalTitleProceedings of the National Academy of Sciences 114, 8911–8913 (2017).
- [11] Sasaki, T., Hölldobler, B., Millar, J. G. & Pratt, S. C. A context-dependent alarm signal in the ant temnothorax rugatulus. \JournalTitleJournal of Experimental Biology 217, 3229–3236 (2014).
- [12] Norman, V. C., Butterfield, T., Drijfhout, F., Tasman, K. & Hughes, W. O. Alarm pheromone composition and behavioral activity in fungus-growing ants. \JournalTitleJournal of Chemical Ecology 43, 225–235 (2017).
- [13] Wilson, E. O. & Regnier Jr, F. E. The evolution of the alarm-defense system in the formicine ants. \JournalTitleThe American Naturalist 105, 279–289 (1971).
- [14] Verheggen, F. J., Haubruge, E. & Mescher, M. C. Alarm pheromones—chemical signaling in response to danger. \JournalTitleVitamins & Hormones 83, 215–239 (2010).
- [15] Vander Meer, R. K. & Alonso, L. E. Pheromone directed behavior in ants. \JournalTitlePheromone communication in social insects, Westview Press, Oxford 3–33 (1998).
- [16] Hughes, W. O. & Goulson, D. Polyethism and the importance of context in the alarm reaction of the grass-cutting ant, atta capiguara. \JournalTitleBehavioral Ecology and Sociobiology 49, 503–508 (2001).
- [17] Hojo, M. K. et al. Antennal rna-sequencing analysis reveals evolutionary aspects of chemosensory proteins in the carpenter ant, camponotus japonicus. \JournalTitleScientific reports 5, 13541 (2015).
- [18] Wang, Q., Goodger, J. Q., Woodrow, I. E. & Elgar, M. A. Location-specific cuticular hydrocarbon signals in a social insect. \JournalTitleProceedings of the Royal Society B: Biological Sciences 283, 20160310 (2016).
- [19] Robinson, E. J. H., Jackson, D. E., Holcombe, M., & Ratkiens, F. L. W., Insect communication: “no entry" signal in ant foraging. \JournalTitleNature 438, 442 (2005).
- [20] Tejera, F., Reyes, A. & Altshuler, E. Uninformed sacrifice: Evidence against long-range alarm transmission in foraging ants exposed to localized abduction. \JournalTitleThe European Physical Journal Special Topics 225, 663–668 (2016).
- [21] Altshuler, E. et al. Symmetry breaking in escaping ants. \JournalTitleThe American Naturalist 166, 643–649 (2005).
- [22] Nicolis, S. C. et al. Foraging at the edge of chaos: Internal clock versus external forcing. \JournalTitlePhysical Review Letters 110, 268104 (2013).
- [23] Mann, H. B. & Whitney, D. R. On a test of whether one of two random variables is stochastically larger than the other. \JournalTitleThe annals of mathematical statistics 18, 50–60 (1947).
- [24] Scheneirla, T. C. Army ants: a study of social organization (Freeman, 1971).
- [25] Buhl, J. et al. From disorder to order in marching locusts. \JournalTitleScience 312, 1402–1406 (2006).
- [26] Blum, M. S. Alarm pheromones. \JournalTitleAnnual Review of Entomology 14, 57–80 (1969).
- [27] Veloso Francelino, M. R. et al. Polyethism and nestmate recognition in the alarm reaction of atta leaf-cutting ants. \JournalTitlePhysiological Entomology 33, 37–42 (2008).
- [28] Frank, E. T. et al. Saving the injured: Rescue behavior in the termite-hunting ant megaponera analis. \JournalTitleScience Advances 3, e1602187 (2017).
- [29] Taylor, K., Visvader, A., Nowbahari, E. & Hollis, K. L. Precision rescue behavior in north american ants. \JournalTitleEvolutionary Psychology 11, 665–677 (2013).
- [30] Billen, J. Occurrence and structural organization of the exocrine glands in the legs of ants. \JournalTitleArthropod Structure & Development 38, 2–15 (2009).
- [31] Sumpter, D. J. Collective Animal Behavior (Princeton University Press, 2010).
- [32] Hoyle, G. Evidence that insect dorsal unpaired medican (DUM) neurons are octopaminergic. \JournalTitleJournal of Experimental Zoology 193, 425–431 (1975).
- [33] Rattan, R. S. Mechanism of action of insecticidal secondary metabolites of plant origin. \JournalTitleArthropod Structure & Development 29, 913–920 (2010).