Assessment of Faster R-CNN in Man-Machine collaborative search
Abstract
With the advent of modern expert systems driven by deep learning that supplement human experts (e.g. radiologists, dermatologists, surveillance scanners), we analyze how and when do such expert systems enhance human performance in a fine-grained small target visual search task. We set up a 2 session factorial experimental design in which humans visually search for a target with and without a Deep Learning (DL) expert system. We evaluate human changes of target detection performance and eye-movements in the presence of the DL system. We find that performance improvements with the DL system (computed via a Faster R-CNN with a VGG16) interacts with observer’s perceptual abilities (e.g., sensitivity). The main results include: 1) The DL system reduces the False Alarm rate per Image on average across observer groups of both high/low sensitivity; 2) Only human observers with high sensitivity perform better than the DL system, while the low sensitivity group does not surpass individual DL system performance, even when aided with the DL system itself; 3) Increases in number of trials and decrease in viewing time were mainly driven by the DL system only for the low sensitivity group. 4) The DL system aids the human observer to fixate at a target by the 3rd fixation, potentially explaining boosts in performance. These results provide insights of the benefits and limitations of deep learning systems that are collaborative or competitive with humans.
1 Introduction
Visual search is an ubiquitous activity that humans engage in every day for a multitude of tasks. Some of these search scenarios are explicit such as: searching for our keys on our desk; while other are implicit such as looking for pedestrians on the street while driving [13]. Visual search may also be trivial as in the previous example or may require stronger degrees of expertise accumulated even over many years such as radiologists searching for tumours in mammograms, as well as military surveillance operators, or TSA agents who must go over a high collection of images in the shortest amount of time. Indeed the successes of Deep Learning Systems have already been shown to compete with Dermatologists in [17] as well as Radiologists [35] for cancerous tumor detections.
Most of the expert systems work has been explored in the medical imaging domain, more specifically in radiology. Litjens et al. [29] compiled an overview of 300 Deep Learning papers applied to medical imaging. In the work of Kooi et al., CNN’s and other Computer Aided Detection and Diagnosis (CAD) classifiers are compared to each other as automatic diagnosis agents [27]. They find that deep learning systems rival expert radiologists, as is the recent paper of Rajpurkar et al. when having radiologists diagnosing pneumonia [35]. Arevalo et al. benchmark CNN’s to classical computer vision models such as HOG and explore the learned representations by such deep networks in the first convolutional layer [3]. The majority of studies have evaluated automated intelligent agents via classical computer vision or end-to-end deep learning architectures v.s. humans. See Litjens et al. [29] for an overview of 300 Deep Learning papers applied to medical imaging.
Other bodies of work regarding collaborative human-machine scenarios in computer vision tasks include: image annotation [39], machine teaching [40, 25], visual conversational agents [6], cognitive optimization [12], and fined-grained categorization [4]. Conversely, there has also been a recent trend comparing humans against machines in certain tasks with the goal of finding potential biological constraints that are missing in deep networks. These comparisons have been done in object recognition [20, 14, 34], perceptual discrimination [16] and visual attention [10].
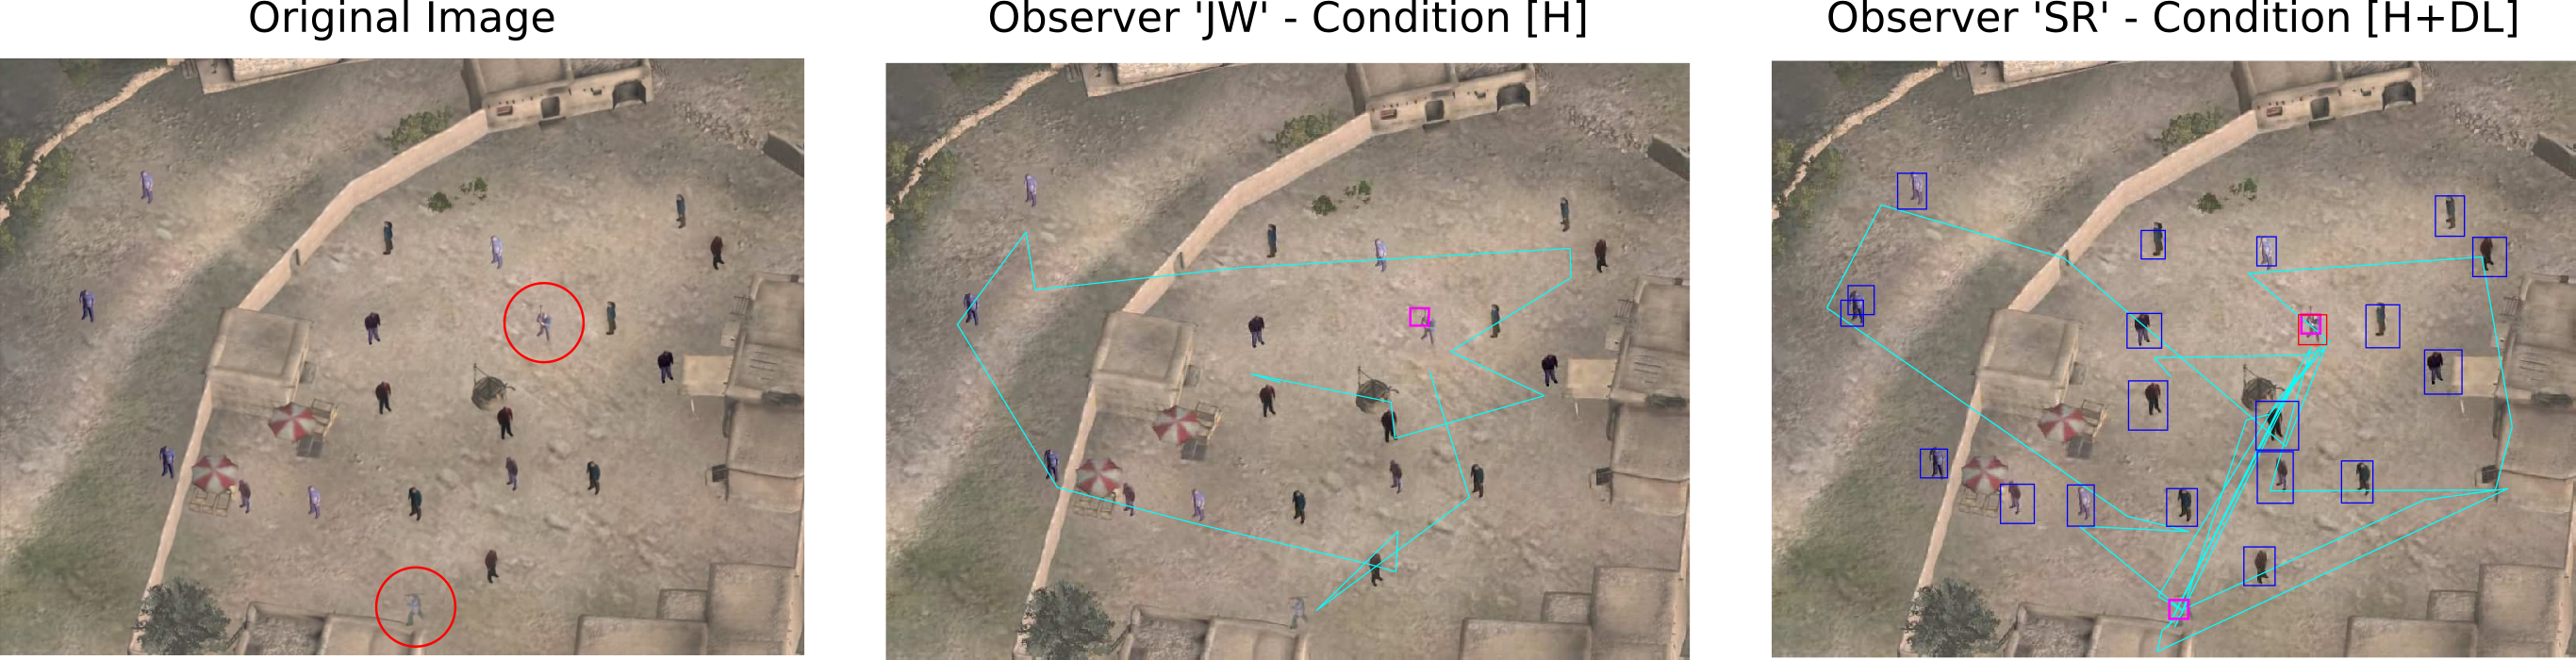
In many applications, mixed DL and human teams are a likely next step prior to replacement of the human expert by the expert system [26, 17, 12, 42, 33]. Given current paradigms in computer vision technology that rely on bounding box candidate regions proposals and evaluations of multiple regions of interest [31] as is the case of models from HOG [9] and DPM [18] to Faster R-CNN [38] and YOLO [36], how well do they integrate with humans whose visual search system is foveated by nature [11, 7, 2]? We are interested in evaluating the influences of DL systems on human behavior working together during visual search for a small target in naturalistic scenes (see Figure 1).
Perhaps the most relevant work of human-machine collaboration to ours is that of Kneusel & Mozer [26]. Such thorough study investigates the influence on human performance of the visualization of the intelligent system’s cues used to indicate the likely target locations. target presence. Our main contribution is complementary: 1) We argue for an interaction between the human’s observer performance level and that of the intelligent system in determining its influence on decisions; 2) We present eye tracking analysis to evaluate the influence of the Faster R-CNN on fixation strategies and types of errors: target not fixated (fixation errors) vs. targets fixated and missed (recognition errors).
In this paper we focus on these questions as there is still ongoing debate in the field regarding the use of expert Deep Learning systems supplementing human experts.
2 Overview of Main Experiment
To analyze how man and machine work together in a visual search task, we designed an experiment with 2 main conditions: Human [H], and Human + Deep Learning [H+DL]. The search task was to find individuals holding weapons among groups of individuals without weapons. The people were embedded in a complex scene. In the following sub-sections, we describe in detail the experiments (stimuli, experimental design & apparatus). We evaluated the influence of the Faster-RCNN on the following human behavioral measures during visual search:
-
1.
Target detection performance.
-
2.
Receiver Operating Characteristic (ROC) curves.
-
3.
Viewing time and number of trials.
-
4.
Pattern of eye movements.
2.1 Creation of Stimuli
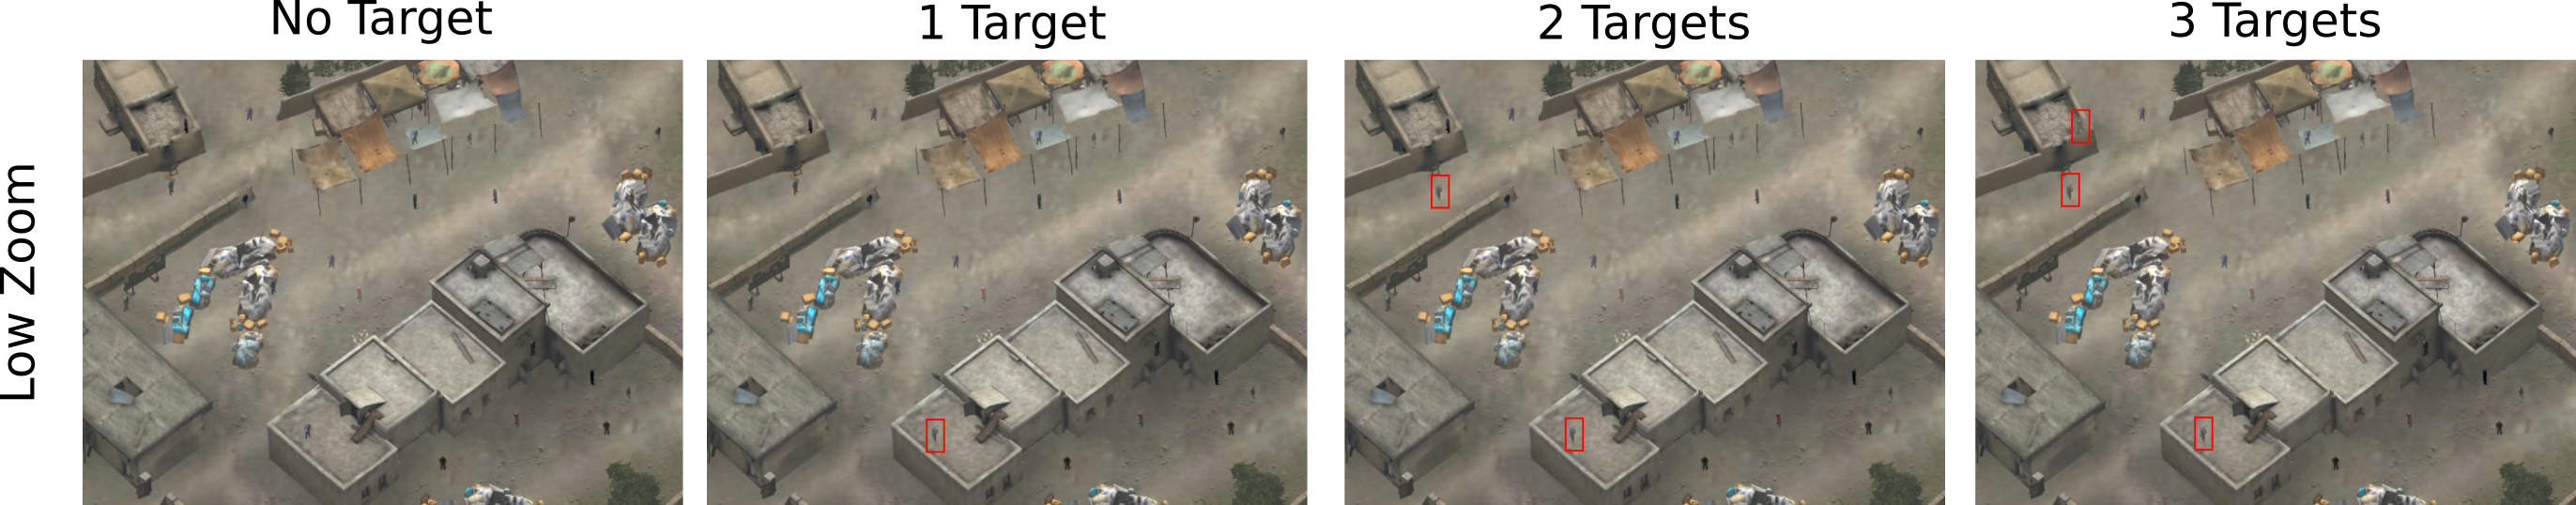
We selected 120 base images with no targets from the dataset of Deza et al. [12] that contained a variety of rendered outdoor scenes with different levels of clutter and three levels of zoom. We then randomly picked 20 locations (uniformly distributed) within each image to locate targets (individuals with weapon) and distractors (individuals without weapons). We ran a canny edge detection [5] filter to compute major edges in each images such as walls, trees and other structures. If one of the previously randomly selected locations landed on an edge, we would resample uniformly from any place in the image until an edge-less location was found. Our image generation model would also re-sample a candidate location if they were overlapping with a previous person location. Once the 20 locations were verified, we generated 4 different versions of the same background image such that each version had targets (totalling ) with the rest of candidate locations having non-targets (a.k.a. friends or persons without weapons). We used Poisson blending [32] on each of the locations to blend the inserted individuals into the background scene. Each image was rendered at px. Example scenes of the Low Zoom condition can be seen in Figure 2, where the difficulty of trying to find a target (a person with a weapon) is quite high.
2.2 Experimental Design
Our main experiment had a factorial design to dissociate improvements caused by the DL System and those due to human learning. In the experimental design each observer participated in two consecutive sessions in one of the following orders: [H,H] (Human, Human), [H,H+DL] (Human, Human + Deep Learning), [H+DL,H] (Human + Deep Learning, Human) and [H+DL,H+DL] (Human + Deep Learning, Human + Deep Learning). Comparison of performance improvements in the Human, Human + Deep Learning vs. the Human, Human conditions allows determining whether performance increases are due to the DL system or simply human learning effects. In addition, we are interested in dissecting learning and ordering effects as it could be the case that the performance differences in the second session are independent of the use of the DL system.
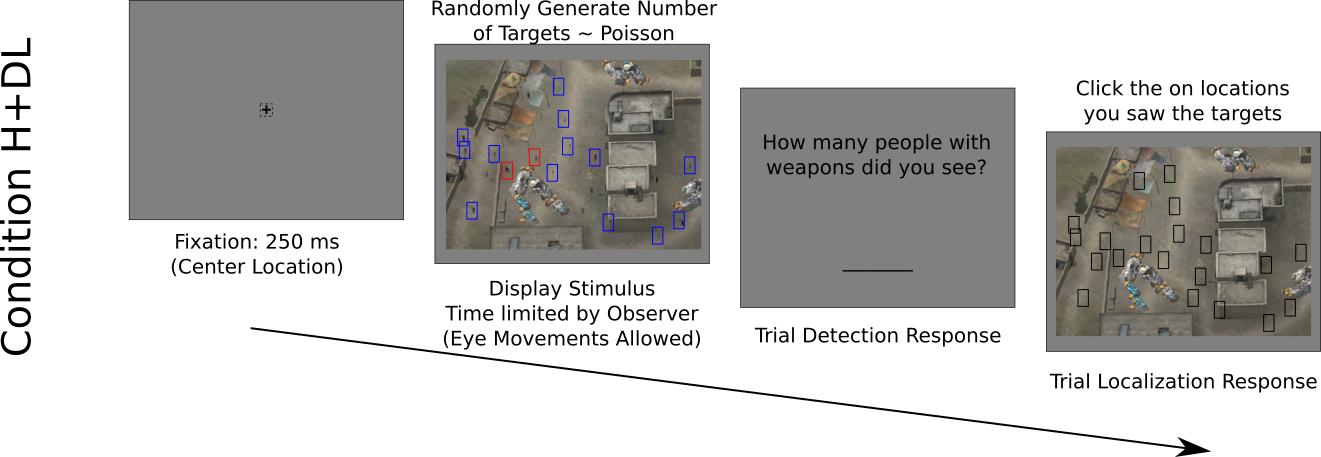
To make a direct comparison between the DL System and humans, the observers reported the number of individuals with weapons (targets). Observers also spatially localized the targets by clicking on the location of the detected target individuals on a subsequently presented image that contained the background image and bounding box locations (but no individuals) of all the potential target candidates. This evaluation paradigm is well matched to the DL system which also localizes targets with no apriori knowledge of how many targets are present in an image. The number of target per images was randomly selected with a truncated Poisson Distribution where:
| (1) |
We fixed the value of which represents the average number of targets per trial, such that ; ; and .
2.3 Apparatus
An EyeLink 1000 system (SR Research) was used to collect Eye Tracking data at a frequency of 1000Hz. Each participant was at a distance of 76 cm from a LCD screen on gamma display, so that each pixel subtended a visual angle of px. All images were rendered at pixels . Eye movements with velocity over and acceleration over were categorized as saccades. Every trial began with a center fixation cross, where each subject had to fixate the cross with a tolerance of .

3 Training and Testing for Man and Machine
3.1 Human: Training and Testing
A total of 120 observers divided in four groups of 30 performed the [H,H], [H,H+DL], [H+DL,H], [H+DL,H+DL] sessions respectively.
Training: Each observer engaged in 3 practice trials at the beginning of each session. Feedback was given at the end of each practice trial analogous to providing a supervised signal.
Testing: Observers were instructed to optimize two general goals: The first was to maximize the total number of trials on each of the 20 minute sessions. The second was to maximize their performance when engaging in visual search. We emphasized that they had to do well maximizing both goals, such that they should not rush over the trials and do a poor job, but neither should they over dwell on search time for every image. No feedback was given at the end of each trial. See Figure 3 for experimental flow.
3.2 Deep Learning System: Training and Testing
We trained a Faster R-CNN object detection framework [38] which uses a VGG-Net [41] for object detection and the candidate region proposals. We picked Faster R-CNN over YOLO [36], SSD [30], R-FCN [8] given the experiments done by Huang et al. where they show that Faster-RCNN overperforms the other models performance-wise [24]. While running multiple object detectors in this experiment would have enriched our evaluation, we are limited by the fact that we will need multiple subjects to be ran for each DL system. One of the other reasons we did not pick YOLO over Faster-RCNN is that Real-Time detection in our experiments is not an issue given that we saved all the detected bounding boxes and scores in memory. In addition YOLO might not perform as well as Faster-RCNN for detecting small objects [37]. Finally, the wide-spread of VGG-Net and Faster-RCNN make them both ideal candidates for our experiments.
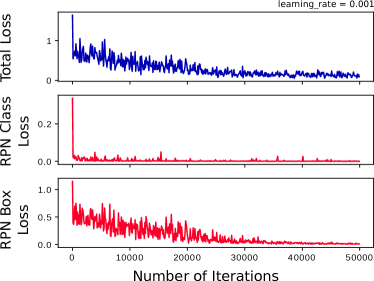
Training: We trained the network on tensorflow [1] for over 5000 iterations as shown in Figure 4, after having it pre-trained with 70000 iterations on a collection of images from ImageNet achieving standard recognition performance. The images fed to the network for training were images, consisting of 7 rotated rotated versions and 20 person inputs (10/10 friends/foes) for each of the 3 target sizes. Small rotations, crops, mirroring and translations were used for data augmentation. The images that were rendered for testing had never been seen from the network, and were rendered with a mix of randomly sampled individuals with and without weapons from the held out dataset.
Testing: Candidate bounding boxes developed by the system always overlayed on possible person locations irrespective of whether the individual carried a weapon. Thus the DL System never produced a Location-driven False Alarm, all mistakes delivered by the system were recognition/classification based. Bounding box candidates with a threshold lower than were discarded, and overlaying bounding boxes (doubles) were removed with non-maximal suppression (NMS).
With these configurations both the DL System and the Human are prone to make the same type of judgments and mistakes. For example: 1) Humans are not allowed to click on the same locations more than twice (computer as well given NMS); 2) The Human and DL system both have a finite collection of possible locations from where to select the target locations. In addition, the experiment is free-recall for humans as they are allowed to report any number of targets per image without prior information. The DL system has the same criteria since the computation of target location via the Region Proposal Network (RPN) does not depend on any prior of the number of targets seen in the image.
4 Results
The results shown in this paper focus on the subgroup of trials that showed small targets given the greater difficulty in detection for both man and machine.
Observer Sensitivity: We quantified the influence of the DL system across groups of observers with different abilities to find the target (hit rate). We split the participants from the [H,H+DL] condition into two groups contingent on their sensitivity (hit rate): the first group was the high sensitivity group who had a hit rate higher than the DL system in the first session, conversely the second group was the low sensitivity group who had a lower hit rate than the DL system. We ran an unpaired t-test to verify that there were indeed performance differences, and found a significant difference for the high sensitivity group and the low sensitivity group . This effect was visible across all other conditions: [H+DL,H] with , , ; [H,H] with , , ; and [H+DL,H+DL] with , , .
4.1 Target Detectability
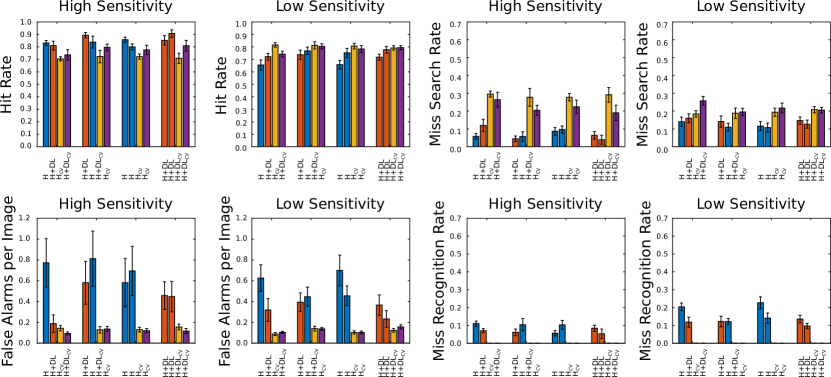
In the following subsection we describe the collection of the metrics used in our analysis that come from the signal detection theory literature [22] and medical imaging/radiology (search and recognition errors) [28]. We group such metrics contingent on the sensitivity of each observer and plot these values in Figure 5.
-
1.
Hit Rate per Image (HR): The total number of targets correctly selected at divided by the total number of targets in the image.
-
2.
False Alarms per Image (FA): The total number of false positives (disctractor individuals without weapons incorrectly labelled as targets).
-
3.
Miss Rate per Image (MR): 1.0 - Hit Rate per Image. We divide the Miss Rate in two types:
-
•
Search Errors Rate per Image (SER): The total number of targets that were not foveated and missed divided by the total number of targets in the image. For the machine we consider these as bounding boxes where the output probability did not exceed the confidence threshold , as one could otherwise argue that the machine ‘foveates’ everywhere.
-
•
Recognition Errors Rate per Image (RER): The total number of targets that were foveated, yet incorrectly perceived as friends (when they are actually foes) divided by the total number of targets in the image. It should be observed that RER and SER should add up to the Miss Rate per Image.
-
•
We performed two sets of mixed factor design ANOVA’s for within conditions: [H] and [H+DL]; between conditions: order effects [H,H+DL] and [H+DL,H]; and between subjects. Each mixed ANOVA was ran separately for the high and low sensitivity groups. We found the following results:
False Alarms per Image: A main effect of reduction of False Alarms with the presence of the DL system for both the high and low sensitivity group: , and .
Search Error Rate: No significant differences in terms of search error rate between conditions. Although we did find that on average the search error rate was lower for the high sensitivity group: unpaired, two-tailed, .
Recognition Error Rate: No reduction in recognition error rate for the high sensitivity group, but a marginal main effect for reduction in recognition error rate for the low sensitivity group in the presence of the DL system , as well as a marginal ordering effect (showing [H+DL] or [H] first) .

4.2 Assessment of the Human and Machine Receiving Operating Characteristics
Similar to the work of Esteva et al. [17], we decided to investigate how do humans perform compared to the DL system when the system performs individually along its entire receiver operating characteristic (ROC) curve, including its operation point at . It may be possible that we find that the DL system performs much better overall than the human observers even for the high sensitivity group, as a higher sensitivity might also imply high false alarm rates and thus less discriminability. This is an effect that can usually be explained within the context of signal detection theory [22]. If the ROC point of the human observers with or without assistance is outside of the DL ROC curve (ocre and purple for the each of the 2 sessions respectively), then we can say that the humans observers collectively perform better than the machine.
To compute the ROC curve per image we require both the TPR (True Positive Rate) and FPR (False Positive Rate) per image . Note that FPR is not be confused with False Alarms per Image as plotted in Figure 5. If is the number of hits the observer performs on the image, and the number of false alarms restricted to the clicked bounding box locations: We will compute , and , where is the total number of possible bounding boxes that an observer has to choose from to make a selection for target present, and is the number of true targets there are in the image . These statistics were averaged for both the machine to plot an entire ROC curve, and for the human observers plotting the ROC points as depicted in Figure 6.
To analyze variability in the observers behaviour as well as decision strategies we will use estimates of target detectability () and decision bias () s.t.
| (2) |
and
| (3) |
where is the inverse of the cumulative normal distribution.
In what follows of the remaining subsection we focus on comparing two types of conditions across each others along previously mentioned metrics. These are mainly: [H,H+DL] vs [H,H], to investigate how the observer ROC changes in the second session with the presence of the DL system, and also [H+DL,H] vs [H+DL,H+DL] which investigates if the observer’s signal detectability and criterion change as a function discarding/continuing the DL system in the second session.
Detectability : We performed an unpaired t-test across the second sessions comparing [H,H+DL] vs [H,H], and [H+DL,H] vs [H+DL,H+DL], and did not find any statistically significant changes in .
Decision bias : Only the high sensitivity group showed differences in bias when the DL system was removed in the second session . vs in the [H,H+DL] vs [H,H] condition.
We finally summarized the detectability and bias scores across all observers, pooled over both sessions, and split by sensitivity and condition [H] vs [H+DL], and compared these to the machine in Table 1:
| detectability | bias | |||
|---|---|---|---|---|
| [H] | [H+DL] | [H] | [H+DL] | |
| High | ||||
| Low | ||||
| DL | ||||
It is clear that when removing any learning effects of session order, that only human observers with high sensitivity perform better than the DL system, while the low sensitivity group does not surpass individual DL system performance, even when aided with the DL system itself.
4.3 Analysis of Viewing Time and Number of Trials
Viewing Time: We found significant ordering effects for the high sensitivity group in viewing time spent per trial , but did not find any effects for the presence of the DL system. However, we did find an interaction for order and presence of the DL system . As for the low sensitivity group we did not find an ordering effect , and rather did find a main effect in the presence of the DL system . This effect is shown in Figure 7 as a decrease in viewing time. In addition we found an interaction of order and presence of the DL system .
Perhaps a striking and counter-intuitive difference worth emphasizing is that the low sensitivity group spends less time than the high sensitivity group viewing each image when the system is on independent of order. Although this is understandable as our splits are driven by the performance of the observer on their first session independent of the presence of the DL system or not. In general, bad performing observers will very likely go over the image faster than high performing observers which are more careful when examining the image. Indeed, to account for differences in the splits, we ran an unpooled t-test to compare between all the [H+DL] sessions in the high and low sensitivity groups (across all orders) and found that the average viewing time (VT) differences were seconds, and seconds, with .
Number of Trials: All the results we found for Viewing Time are analogous and statistically significant when analyzing number of trials – as the total time per session in the experiment is constricted to 20 minutes, and both these quantities are inversely proportional to each other. Figure 7 shows such equivalence and how a low viewing time generally translates to a high number of trials across all conditions.

4.4 Analysis of Eye-Movements
Performance metrics may change as a function of the DL system as well as over each session, but how will human behaviour change as a function of such conditions? In this subsection we decided to investigate the role of eye-movements in decision making and how they may be related to performance levels. More specifically we computed the euclidean distance in degrees of visual angle between the observer’s fixation location and the closest of all possible targets as shown in Eq. 4:
| (4) |
To investigate such question, we decided to create boxplots of the first 5 fixations across all observers split in each one of the viewing conditions and also by sensitivity. This can be seen in Figure 8 which suggests that generally, observers who are enhanced when the DL system is on, fixate at a target (contingent to a target being present) by the third fixation. Thus we see how the DL system enhances fixating at the target with fewer eye movements. Qualitative and complimentary plots to this can be observed in Figure 9, where we show sample gaze and scan path of observers when performing search in all of these conditions.
What is most revealing about the homogeneity in fixating first at a target with the DL system on, is that this result might explain how most observers either from the high or low sensitivity group may achieve a boost in target detectability as shown previously in Table 1.


5 Main Takeaways from Analysis
-
1.
Target detection performance: The DL system reduces the False Alarm rate per Image on average across observer groups of both high/low sensitivity.
-
2.
Receiving Operator Characteristics: We found an interaction where only the human observers with high sensitivity perform better than the DL system, while the low sensitivity group does not surpass individual DL system performance, even when aided with the DL system itself.
-
3.
Viewing time and number of trials: The Deep Learning system only increases the number of trials for the low sensitivity group.
-
4.
Pattern of eye movements: The DL system encourages fixating at the target by the 3rd fixation, independent of other factors.
6 Discussion
While there has been a great maturation in terms of success of deep learning systems regarding object detection, there are still many limitations in object detection, such as: adversarial examples [21], fine-grained detection [23], small objects(targets) [15]. Adversarial examples have clearly exposed important limitations in current deep learning systems, and while having an experimental setup of visual search with and without adversarial examples would be interesting, it is not the focus of our work. The outcome is somewhat predictable and guaranteed: humans would achieve a higher recognition rate than computers – yet we do not discard the possibility that performing a study similar to ours with the presence of adversarial images is relevant and should be explored in future work. On the other hand, future work regarding integrating human and machines in visual search in the presence of human-like adversarial examples [16] might also be of great interest as explored in the recent work of Finlayson et al. [19] applied to medical images.
In this paper, we thus centered our efforts in studying a more real and applicable problem which is fine-grained small object detection and classification with a limited number of training exemplars that uses a commonly deployed pre-trained VGG16 [41]. We found that, for a current DL system, its influence on human search performance interacts with the observers’ sensitivity. This highlights the complexity of integration of DL systems with humans experts. It is likely that these interactions also depends on the performance level of the DL system as well as the observers’ trust on the DL system.
With the recent surge of DL systems applied to Medical imaging, we believe that these experimental insights will be transferable to such and other human-machine collaborative domains.
Acknowledgments
This work was supported by the Institute for Collaborative Biotechnologies through contract W911NF-09-0001 with the U.S. Army Research Office.
References
- [1] M. Abadi, P. Barham, J. Chen, Z. Chen, A. Davis, J. Dean, M. Devin, S. Ghemawat, G. Irving, M. Isard, et al. Tensorflow: A system for large-scale machine learning.
- [2] E. Akbas and M. P. Eckstein. Object detection through search with a foveated visual system. PLOS Computational Biology, 13(10):1–28, 10 2017.
- [3] J. Arevalo, F. A. González, R. Ramos-Pollán, J. L. Oliveira, and M. A. G. Lopez. Representation learning for mammography mass lesion classification with convolutional neural networks. Computer methods and programs in biomedicine, 127:248–257, 2016.
- [4] S. Branson, G. Van Horn, C. Wah, P. Perona, and S. Belongie. The ignorant led by the blind: A hybrid human–machine vision system for fine-grained categorization. International Journal of Computer Vision, 108(1-2):3–29, 2014.
- [5] J. Canny. A computational approach to edge detection. In Readings in Computer Vision, pages 184–203. Elsevier, 1987.
- [6] P. Chattopadhyay, D. Yadav, V. Prabhu, A. Chandrasekaran, A. Das, S. Lee, D. Batra, and D. Parikh. Evaluating visual conversational agents via cooperative human-ai games. arXiv preprint arXiv:1708.05122, 2017.
- [7] B. Cheung, E. Weiss, and B. Olshausen. Emergence of foveal image sampling from learning to attend in visual scenes. arXiv preprint arXiv:1611.09430, 2016.
- [8] J. Dai, Y. Li, K. He, and J. Sun. R-fcn: Object detection via region-based fully convolutional networks. In Advances in neural information processing systems, pages 379–387, 2016.
- [9] N. Dalal and B. Triggs. Histograms of oriented gradients for human detection. In Computer Vision and Pattern Recognition, 2005. CVPR 2005. IEEE Computer Society Conference on, volume 1, pages 886–893. IEEE, 2005.
- [10] A. Das, H. Agrawal, L. Zitnick, D. Parikh, and D. Batra. Human attention in visual question answering: Do humans and deep networks look at the same regions? Computer Vision and Image Understanding, 163:90–100, 2017.
- [11] A. Deza and M. P. Eckstein. Can peripheral representations improve clutter metrics on complex scenes? In Neural Information Processing Systems, 2016.
- [12] A. Deza, J. R. Peters, G. S. Taylor, A. Surana, and M. P. Eckstein. Attention allocation aid for visual search. arXiv preprint arXiv:1701.03968, 2017.
- [13] M. P. Eckstein. Visual search: A retrospective. Journal of vision, 11(5):14–14, 2011.
- [14] M. P. Eckstein, K. Koehler, L. E. Welbourne, and E. Akbas. Humans, but not deep neural networks, often miss giant targets in scenes. Current Biology, 27(18):2827–2832, 2017.
- [15] C. Eggert, D. Zecha, S. Brehm, and R. Lienhart. Improving small object proposals for company logo detection. In Proceedings of the 2017 ACM on International Conference on Multimedia Retrieval, pages 167–174. ACM, 2017.
- [16] G. F. Elsayed, S. Shankar, B. Cheung, N. Papernot, A. Kurakin, I. Goodfellow, and J. Sohl-Dickstein. Adversarial examples that fool both human and computer vision. arXiv preprint arXiv:1802.08195, 2018.
- [17] A. Esteva, B. Kuprel, R. A. Novoa, J. Ko, S. M. Swetter, H. M. Blau, and S. Thrun. Dermatologist-level classification of skin cancer with deep neural networks. Nature, 542(7639):115, 2017.
- [18] P. F. Felzenszwalb, R. B. Girshick, D. McAllester, and D. Ramanan. Object detection with discriminatively trained part-based models. IEEE transactions on pattern analysis and machine intelligence, 32(9):1627–1645, 2010.
- [19] S. G. Finlayson, I. S. Kohane, and A. L. Beam. Adversarial attacks against medical deep learning systems. arXiv preprint arXiv:1804.05296, 2018.
- [20] R. Geirhos, D. H. Janssen, H. H. Schütt, J. Rauber, M. Bethge, and F. A. Wichmann. Comparing deep neural networks against humans: object recognition when the signal gets weaker. arXiv preprint arXiv:1706.06969, 2017.
- [21] I. J. Goodfellow, J. Shlens, and C. Szegedy. Explaining and harnessing adversarial examples. arXiv preprint arXiv:1412.6572, 2014.
- [22] J. GREEN Dand SWETS. Signal detection theory and psychophysics, 1988.
- [23] B. Hariharan, P. Arbelaez, R. Girshick, and J. Malik. Object instance segmentation and fine-grained localization using hypercolumns. IEEE transactions on pattern analysis and machine intelligence, 39(4):627–639, 2017.
- [24] J. Huang, V. Rathod, C. Sun, M. Zhu, A. Korattikara, A. Fathi, I. Fischer, Z. Wojna, Y. Song, S. Guadarrama, et al. Speed/accuracy trade-offs for modern convolutional object detectors.
- [25] E. Johns, O. Mac Aodha, and G. J. Brostow. Becoming the Expert - Interactive Multi-Class Machine Teaching. In CVPR, 2015.
- [26] R. T. Kneusel and M. C. Mozer. Improving human-machine cooperative visual search with soft highlighting. ACM Transactions on Applied Perception (TAP), 15(1):3, 2017.
- [27] T. Kooi, G. Litjens, B. van Ginneken, A. Gubern-Mérida, C. I. Sánchez, R. Mann, A. den Heeten, and N. Karssemeijer. Large scale deep learning for computer aided detection of mammographic lesions. Medical image analysis, 35:303–312, 2017.
- [28] E. A. Krupinski. Current perspectives in medical image perception. Attention, Perception, & Psychophysics, 72(5):1205–1217, 2010.
- [29] G. Litjens, T. Kooi, B. E. Bejnordi, A. A. A. Setio, F. Ciompi, M. Ghafoorian, J. A. van der Laak, B. van Ginneken, and C. I. Sánchez. A survey on deep learning in medical image analysis. Medical image analysis, 42:60–88, 2017.
- [30] W. Liu, D. Anguelov, D. Erhan, C. Szegedy, S. Reed, C.-Y. Fu, and A. C. Berg. Ssd: Single shot multibox detector. In European conference on computer vision, pages 21–37. Springer, 2016.
- [31] J. Malik, P. Arbeláez, J. Carreira, K. Fragkiadaki, R. Girshick, G. Gkioxari, S. Gupta, B. Hariharan, A. Kar, and S. Tulsiani. The three r’s of computer vision: Recognition, reconstruction and reorganization. Pattern Recognition Letters, 72:4–14, 2016.
- [32] P. Pérez, M. Gangnet, and A. Blake. Poisson image editing. ACM Transactions on graphics (TOG), 22(3):313–318, 2003.
- [33] J. R. Peters, V. Srivastava, G. S. Taylor, A. Surana, M. P. Eckstein, and F. Bullo. Human supervisory control of robotic teams: integrating cognitive modeling with engineering design. IEEE Control Systems, 35(6):57–80, 2015.
- [34] R. Pramod and S. Arun. Do computational models differ systematically from human object perception? In Proceedings of the IEEE Conference on Computer Vision and Pattern Recognition, pages 1601–1609, 2016.
- [35] P. Rajpurkar, J. Irvin, K. Zhu, B. Yang, H. Mehta, T. Duan, D. Ding, A. Bagul, C. Langlotz, K. Shpanskaya, et al. Chexnet: Radiologist-level pneumonia detection on chest x-rays with deep learning. arXiv preprint arXiv:1711.05225, 2017.
- [36] J. Redmon, S. Divvala, R. Girshick, and A. Farhadi. You only look once: Unified, real-time object detection. arXiv preprint arXiv:1506.02640, 2015.
- [37] J. Redmon and A. Farhadi. Yolo9000: better, faster, stronger.
- [38] S. Ren, K. He, R. Girshick, and J. Sun. Faster r-cnn: Towards real-time object detection with region proposal networks. In Advances in neural information processing systems, pages 91–99, 2015.
- [39] O. Russakovsky, L.-J. Li, and L. Fei-Fei. Best of both worlds: human-machine collaboration for object annotation. In Proceedings of the IEEE Conference on Computer Vision and Pattern Recognition, pages 2121–2131, 2015.
- [40] P. Y. Simard, S. Amershi, D. M. Chickering, A. E. Pelton, S. Ghorashi, C. Meek, G. Ramos, J. Suh, J. Verwey, M. Wang, et al. Machine teaching: A new paradigm for building machine learning systems. arXiv preprint arXiv:1707.06742, 2017.
- [41] K. Simonyan and A. Zisserman. Very deep convolutional networks for large-scale image recognition. arXiv preprint arXiv:1409.1556, 2014.
- [42] B. Wolfe, J. Dobres, R. Rosenholtz, and B. Reimer. More than the useful field: considering peripheral vision in driving. Applied ergonomics, 65:316–325, 2017.