Studying Cultural Differences in Emoji Usage across the East and the West
Abstract
Global acceptance of Emojis suggests a cross-cultural, normative use of Emojis. Meanwhile, nuances in Emoji use across cultures may also exist due to linguistic differences in expressing emotions and diversity in conceptualizing topics. Indeed, literature in cross-cultural psychology has found both normative and culture-specific ways in which emotions are expressed. In this paper, using social media, we compare the Emoji usage based on frequency, context, and topic associations across countries in the East (China and Japan) and the West (United States, United Kingdom, and Canada). Across the East and the West, our study examines a) similarities and differences on the usage of different categories of Emojis such as People, Food & Drink, Travel & Places etc., b) potential mapping of Emoji use differences with previously identified cultural differences in users’ expression about diverse concepts such as death, money emotions and family, and c) relative correspondence of validated psycho-linguistic categories with Ekman’s emotions. The analysis of Emoji use in the East and the West reveals recognizable normative and culture specific patterns. This research reveals the ways in which Emojis can be used for cross-cultural communication.
Introduction
Emoji, a Japan-born ideographic system, offers a rich set of non-verbal
cues to assist textual communication. The Unicode Standard 11.0 specified
over Emojis111http://unicode.org/Emoji/, ranging
from facial expressions (‘Smileys’ such as ![]() ) to everyday objects
(such as
) to everyday objects
(such as ![]() ). Starting as a visual aid for textual communication, Emojis’
non-verbal nature has led to suggestions that they are universal across
cultures (?). In this paper, we examine cross-cultural
usages of Emojis based on (1) linguistic differences across languages
(and cultures) in expressing emotions (?),
and (2) diversity in perceiving different constructs among cultures (?).
Specifically, we compare Emoji use in terms of frequency,
context, and topic associations across two eastern countries – China
and Japan – and three western countries – United States of America
(US), United Kingdom (UK) and Canada. Hereafter, we refer to the collection
of US, UK, and Canadian cultures as ‘the Western culture’ (or simply
‘the West’), the collection of Japanese and Mandarin-speaking Chinese
as ‘the East(-ern culture)’ with an acknowledgment that there are
several other countries which can be added to each group (?).
We study the differences using distributional semantics learned over
large datasets from Sina Weibo and Twitter, two closely related microblog/social media platforms.
). Starting as a visual aid for textual communication, Emojis’
non-verbal nature has led to suggestions that they are universal across
cultures (?). In this paper, we examine cross-cultural
usages of Emojis based on (1) linguistic differences across languages
(and cultures) in expressing emotions (?),
and (2) diversity in perceiving different constructs among cultures (?).
Specifically, we compare Emoji use in terms of frequency,
context, and topic associations across two eastern countries – China
and Japan – and three western countries – United States of America
(US), United Kingdom (UK) and Canada. Hereafter, we refer to the collection
of US, UK, and Canadian cultures as ‘the Western culture’ (or simply
‘the West’), the collection of Japanese and Mandarin-speaking Chinese
as ‘the East(-ern culture)’ with an acknowledgment that there are
several other countries which can be added to each group (?).
We study the differences using distributional semantics learned over
large datasets from Sina Weibo and Twitter, two closely related microblog/social media platforms.
Past psychological research assessing emotional experience between the East and the West found both universal and culture-specific types of emotional experience (?). If Emojis are a form of emotional experience and expression as prior studies have shown (?), it is expected that we can find interpretable and substantial similarity in Emoji usage and also distinct cultural patterns. In other words, which Emojis are used, the contexts where they are used, and what they semantically refer to will bear resemblance across languages, even when no common character is shared between their writing systems. At the same time, there will also be unique cultural elements in how certain types of Emojis are used and interpreted.
Research Questions
Due to the richness and diversity of the Emojis, it is difficult to hypothesize a priori how specific Emojis may differ. Therefore, we undertake an abductive approach to construct explanatory theories as patterns emerge from our analysis (?). Normatively, we fundamentally expect similar patterns of Emoji usage to appear across both cultures. We also seek to explore when there may be specific cultural divergence. Therefore, we attempt to answer the following research questions to explore and quantify the normativeness and distinctiveness of Emoji usage across the two cultures:
-
1.
How does frequency of different Emojis (as individuals and in categories) vary across the East and the West?
-
2.
How distinct is Emoji usage across cultures in terms of validated psycho-linguistic categories they are often associated with?
-
3.
How do the semantics of Emoji usage vary when compared against known universal emotion expressions emotions (Ekman basic emotion categories (?)) across both cultures?
Background and Related Work
Weibo and Twitter: Analogs?
Weibo and Twitter have been studied to understand the differences in content and user behaviors in multiple contexts (?; ?). Notwithstanding the challenge of working with a non-random, non-representative sample of social media users, several psychological traits and outcomes can be inferred from posts, including users’ demographics (?; ?), personality (?; ?), location (?; ?), as well as status of stress (?; ?), and mental health (?; ?) on both platforms. Demonstrated in these prior studies, the empirical value suggests that the two platforms are representative albeit to different countries. Several of the above mentioned studies have used Linguistic Inquiry Word Count (LIWC) (?), which has psychometrically validated categories, such as emotional valence, religion, and money etc. in multiple languages.
Role of Culture in Emotion Expression and Perception
Prior psychological research on emotion (?; ?) suggests that evolutionary and biological processes generate universal expressions and perceptions of emotions. For example, facial expressions is one of such universal channels that convey emotions across populations (?). On the other hand, culture can play a significant role in shaping emotional life. Specifically, different cultures may value different types of emotions (e.g., Americans value excitement while Asians prefer calm) (?), and there are different emotional display rules across cultures (?). Furthermore, besides representing emotions, the Emoji system also explicitly contains cultural symbols and thus potentially represents the distinctive values and beliefs of cultures (?). Prior works also suggest that culture plays a key role in predicting perceptions of affect (?; ?; ?). In general, psychological research reveals both cultural similarities and differences in emotions (?).
Emojis: A Proxy for Emotions?
From a methodological perspective, most large scale cross-cultural psychology research projects have used a survey-based approach to assess similarities and differences in emotions (?). Analyzing use of Emojis between the Eastern and the Western contexts provides an opportunity to assess a plethora of behaviors related to emotion expression and, arguably, emotional symbols that are culturally embedded. This enhances our understanding of similarities and differences in emotional life across cultures at a large scale but fine-grain level.
Prior Studies on Emojis
Prior research on Emojis can be divided primarily into three themes: (1) studying Emojis as a source of sentiment annotation, (2) analyzing differences in Emoji perception based on rendering, and (3) understanding similarities and differences in Emoji usage across different populations. We focus on studying the similarities and differences in Emoji usage across cultures.
The studies by (?; ?) are the closest to our work where authors explore the meaning and usage of Emojis in social media across four European languages, namely American English, British English, Peninsular Spanish and Italian, and across two cities in Spain respectively. They observe that the most frequent Emojis share similar semantic usages across these Western languages providing support for the normative claims of Emojis. However, to fully examine the issue of normativeness, we need to go beyond examining only Western contexts by also examining East-West similarity.
Since Emojis have been found to be very promising in downstream applications such as sentiment analysis and several techniques, utilizing Unicode descriptions (?; ?), multi-Emoji expressions (?), and including diverse Emoji sets (?) etc., have been proposed to improve Emoji understanding, culture-specific norms and platform-rending effects (?; ?; ?) can be used for improving personalization.
Methods
This work received approval from University of Pennsylvania’s Institutional Review Board (IRB). Code repository is available online222https://github.com/tslmy/ICWSM2019.
Data Collection
To obtain data for the US, UK, Canada and Japan, we used Twitter data from a archive from the TrendMiner project (?), which used the Twitter streaming API. Since Twitter is not widely used in China, we obtained Weibo data. Since Weibo lacks a streaming interface (as Twitter) for downloading random samples over time, we queried for all posts from a given user. The list of users were crawled using a breadth-first search strategy beginning with random users.
| Culture | Country | # Posts crawled | # Posts after lang. filter | # Posts after geo-location | # Users |
| West | USA | 29.32M | 18.99M | 18.57M | 4.39M |
| UK | 6.74M | 5.12M | 4.83M | 1.31M | |
| Canada | 1.6M | 1.16M | 1.12M | 0.32M | |
| East | Japan | 481.39M | 82.56M | 17.51M | 2.06M |
| China | 486.18M | 205.22M | 1.00M | ||
Pre-processing
The count of posts for each country after each stage of pre-processing and final user counts is shown in Table 1.
Geo-location:
On Twitter, the coordinates or tweet country location (whichever was available) was used to geo-locate posts. On Weibo, user’s self-identified profile location was used to identify the geo-location of messages. We used messages posted in the year 2014 in both corpora.
Language Filtering:
To remove the confounds of bilingualism (?), we filter posts by the languages they are composed in. Language used in each Twitter post (or ‘tweets’ hereafter) is detected via langid (?). Tweets written in languages other than English in US, UK and Canada, and Japanese in Japan are removed. Weibo posts are filtered for Chinese language using pre-trained fastText language detection models (?), due to its ability to distinguish between Mandarin and Cantonese (we used only Mandarin posts in our analysis). Further, traditional Chinese characters are converted to Simplified Chinese using hanziconv Python package 333https://pypi.org/project/hanziconv/ to conform with LIWC dictionary used in later sections. We also remove any direct re-tweets (indicated by ‘RT @USERNAME:’ on Twitter and ‘@USERNAME//’ on Weibo).
Tokenizing:
Twitter text was tokenized using Social Tokenizer bundled with ekphrasis444https://github.com/cbaziotis/ekphrasis, a text processing pipeline designed for social networks. Weibo posts were segmented using Jieba555https://github.com/fxsjy/jieba considering its ability to discover new words and Internet slang, which is particularly important for a highly colloquial corpus like Sina Weibo. Using ekphrasis, URLs, email addresses, percentages, currency amounts, phone numbers, user names, emoticons and time-and-dates were normalized with meta-tokens such as ‘<url>’, ‘<email>’, ‘<user>’ etc. Skin tone variation in Emojis was introduced in 2015, and consequently no skin-toned Emoji was captured in our corpora gathered from 2014.
Training Embedding Models
To study the lexical semantics across both cultures, we trained a Word2Vec Continuous Bag-of-Words (CBoW) model on each corpus/country (?). These models were trained for 10 epochs with learning rates initialized at and allowed to drop till . The dimension of learned token vectors was chosen to be based on previous work (?). To counter effects due to the randomized initialization in the Word2Vec algorithm, each model was trained 5 times independently. In all our analysis, we used the vector embeddings across the 5 instances for every analysis and then averaged the resulting projections.
Measuring Topical Differences
In order to investigate topical differences across cultures, we use LIWC dictionaries in Chinese (?) and in English (?) to be consistent across languages. Since LIWC is not available in Japanese, we used methods from prior work (?) to translate the word lists from Chinese and English into Japanese. The LIWC dictionary is a language-specific, many-to-many mapping of tokens (including words and word stems) and psychologically validated categories. Each category (a curated list of words) is found to be correlated with and also predictive of several psychological traits and outcomes (?).
We use the terms ‘tokens’, ‘Emojis’, ‘words’, etc. interchangeably with their corresponding vectorial representations. Next, we define our auxiliary term ‘category vectors’, compute Emoji-category similarities, and analyze correlations.
Preparing category vectors:
In each corpus separately, for each LIWC category , all tokens (in vectorial representations ) in this category are averaged into one vector, which we term as “category vector” :
for corpus where is the amount of tokens in the LIWC category in the corpus , and is the -th token in the LIWC category in the corpus .
Acknowledging that LIWC captures only verbal tokens, and that Emojis, as non-verbal tokens, may have substantial differences to verbal tokens captured during Word2Vec training stage, we orthonormalize axial vectors using Gram-Schmidt algorithm (?), to ensures they capture more distinctive features between LIWC categories.
Computing cosine similarities:
Separately in each corpus , for each pair of Emoji ![]() ,
,
![]() (in vectorial representation )
and category vector , a cosine similarity is computed:
(in vectorial representation )
and category vector , a cosine similarity is computed:
For clarity, we define . Per-country cosine similarities are then averaged across each culture to reveal the western and the eastern cosine similarities:
and
for the category .
Spearman Correlation Coefficients:
For each of the LIWC categories shared across all corpora, , we correlate the Western Emoji Usage vector and the Eastern Emoji Usage vector , denoting the Spearman correlation coefficient with . Here, is the total number of Emojis present in all corpus and appeared for at least times in total.
Results and Discussion
Frequency of Emoji Usage
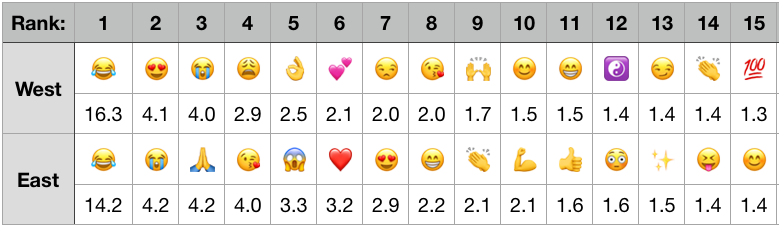
Among the Emojis defined in Emoji 1.0666Published in August 2015, Emoji 1.0 is closest to 2014, the year from which our corpora were gathered. by Unicode777http://unicode.org/Public/emoji/1.0/emoji-data.txt, Emojis appeared in all corpora. Only of them appeared more than times. Figure 1 shows most frequently seen Emojis in each culture. Across the two cultures, Spearman correlation coefficient (SCC) is (two-tailed t-test p-value ). These statistics indicate a strong correspondence in the types of Emojis favored across these two cultures. This reveals normativeness in the types of Emojis used between East and West.
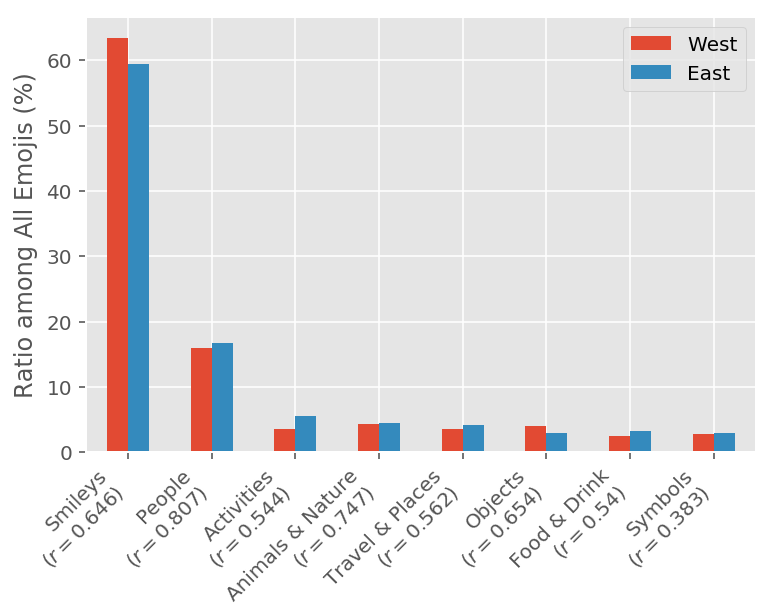
Further, we sum up the usage frequencies by Unicode Category of Emojis. Figure 2 shows the frequency of these categories, denoted with SCCs for Emoji frequencies within each category, representing the similarity between Westerners and Easterners in using the Emojis in each category. While the SCC values range from moderate () to high (), suggesting a high correspondence of Emoji usage patterns, drilling down by categories of Emojis is elucidating. The lowest correlations in Emoji usage occur in the ‘Symbols’, ‘Food & Drink’, and ‘Activities’ categories. This is not surprising, because cultures often have their own meaning symbols that are representative of specific values (?). Moreover, culture is often instantiated in cuisines representing dietary preferences, identities, and ecology (?). Further, culture also influences the time spent across the world on work, play, and development activities (?).
Semantic Similarity of Emojis
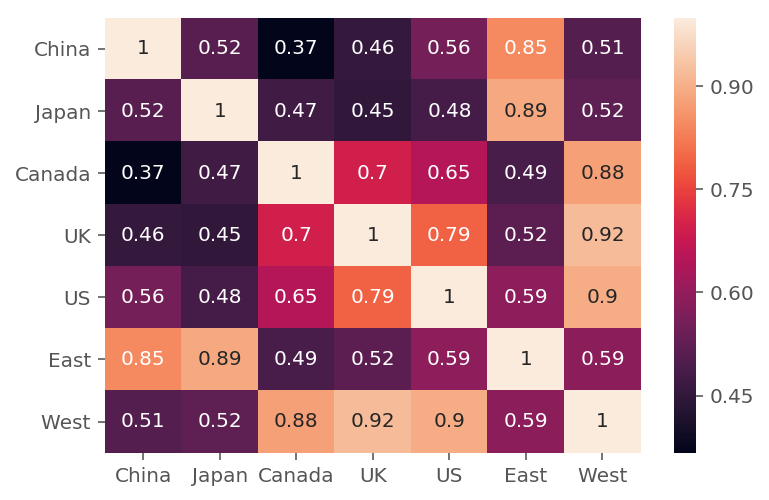
Vector representations allow for mathematical projections, which essentially serve as a measure of similarity. We compute a pairwise similarity for each pair of Emojis in each country, and use the vectors of per-country pairwise Emoji similarities as the basis of generating a country-level pairwise similarity matrix (shown in Figure 3). The Pearson correlation coefficient between the West and the East is , indicating similarity in the semantics of Emoji usage even across two different cultures. While this supports some level of normativity, we find that this level of East-West similarity is lower than previous findings (?) of Emoji semantics across four Western languages where similarity matrices of Emojis were correlated . Our within Western nation correlations were similar to past findings, ranging from to . Altogether, these results reveal that there is still normativity in Emoji usage across East-West with the moderate positive Pearson correlation, though there is less similarity than if we were to compare across Western nations.
Association with Psycholinguistic Categories
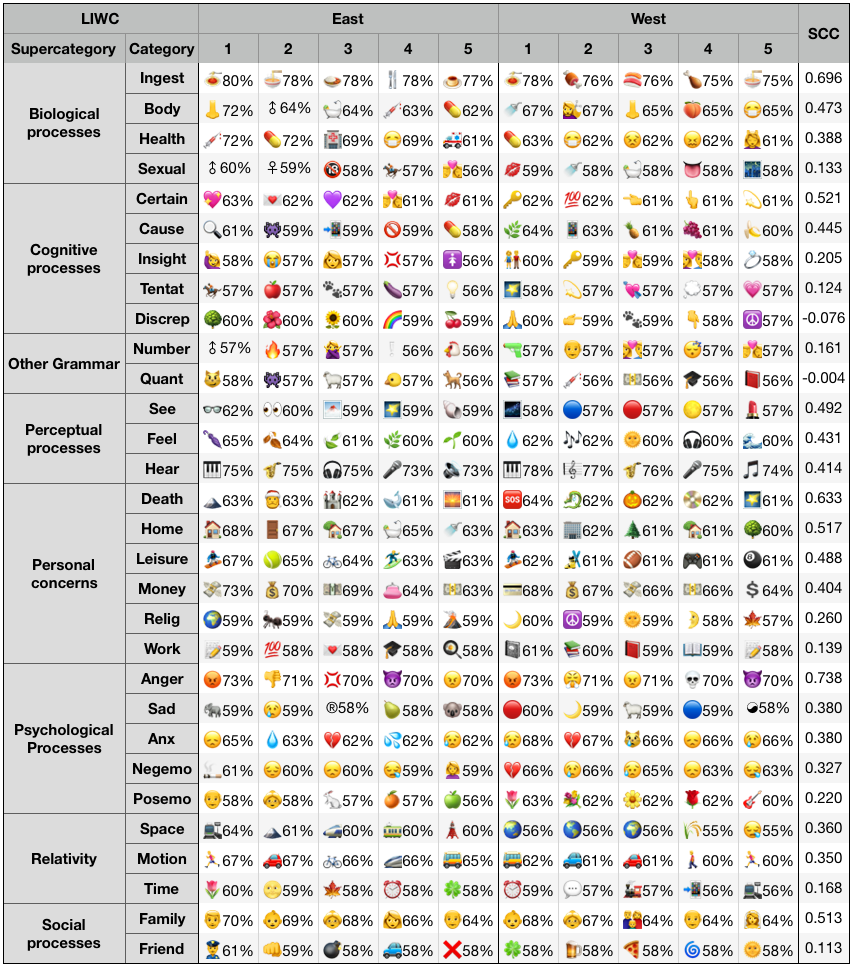
Figure 4 demonstrates top 5 Emojis similar to each LIWC category in the East and in the West. Specifically, these results reveal the correspondence between the LIWC category (and all its related words) and a set of Emojis. The extent that SCCs are high shows that the same set of words across two cultures relate to the same types of Emojis; low SCCs reveal that the same category of words is associated with different Emojis across the two cultures.
There is overall evidence for normativeness between East and West in how concepts captured by LIWC are represented by Emojis. Almost all the LIWC categories have positive SCCs and the median SCC is . At the same time, there are also specific categories that reveal more distinctiveness between the two cultures. In the next paragraphs, we describe specific findings in an exploratory manner.
Substantively, LIWC categories can be represented from words into Emoji expressions; the rank-order correlations reveal if these Emoji expressions overlap in reflecting the specific category.
East-West Similarities.
LIWC categories that are most similar in terms Emojis are ‘Ingest’, ‘Death’, ‘Anger’, ‘Money’, ‘Home’, and ‘Family’. Prima facie, many of these categories are recognized as universal and the choice of Emojis to represent these categories are the most similar. Given that money is a medium of exchange in almost all societies of the world given global capitalism (?), ‘Money’ is a category that is universally understood and regarded
in a similar way and this is represented as such with
Emojis (![]() ,
, ![]() , etc.). This also applies to the Emoji expressions in
the category of ‘Death’ (
, etc.). This also applies to the Emoji expressions in
the category of ‘Death’ (![]() and
and ![]() in the East;
in the East; ![]() ,
, ![]() , etc. in the West) which is the ultimate issue all humans face (?).
Similarly, the categories of emotion ‘Anger’ (
, etc. in the West) which is the ultimate issue all humans face (?).
Similarly, the categories of emotion ‘Anger’ (![]() , etc.) is tied to
the basic emotions of anger which has been found to be universally
expressed and recognized facially (?). The
category of Ingest (
, etc.) is tied to
the basic emotions of anger which has been found to be universally
expressed and recognized facially (?). The
category of Ingest (![]() , etc.) and how people imbibe food as expressed
in Emojis are also similar based on the rank-order correlations.
, etc.) and how people imbibe food as expressed
in Emojis are also similar based on the rank-order correlations.
East-West Differences.
At the same time, amid similarity overall, we also observe that there
are some cultural dimensions that emerge from the plots as the Emojis
for rice bowl (![]() ) and ramen (
) and ramen (![]() ) dominated the East, while meat-related
Emojis (
) dominated the East, while meat-related
Emojis (![]() ,
, ![]() , etc.) take the majority in the West (?; ?).
On the other hand, the LIWC categories that have lower correlations,
and indeed even, inverse correlations show that Emojis used to express
these constructs are likely different overall.
‘Insight’, ‘Discrepancy’, ‘Quantitative’, ‘Number’, ‘Time’, ‘Friend’,
and ‘Work’ have small or near-zero correlations. This seems to be
in line with categories that are linked to cultural influence. In
terms of the grammatical categories of ‘Quantifiers’ and ‘Number’,
given that there are differences in the grammar and syntax of Chinese,
Japanese, and English, this difference is also understandable. Similarly,
‘Time’ is often viewed symbolically and is laden with cultural meaning;
moreover, there are differences in the importance of keeping time
and the timing of events (?). East Asians
and Westerner also have differences in interpersonal dealings. With
regard to the former, Confucianism places a premium on harmony and
proper relationships as the basis for Asian society whereas Westerners
often place greater importance in outcomes and direct communication (?).
This is revealed in differences in the category of ‘Friend’ in how
Emojis are used to express that idea. To a larger extent, it also
extends to the broader category of social processes where we also
find a low correlation on Emojis expressing the concept of ‘Family’.
Emojis also seem to reflect governmental policies. For example, the
Chinese government had been banning game consoles till 2015, and –
in our dataset collected from 2014 – the game controller Emoji ‘
, etc.) take the majority in the West (?; ?).
On the other hand, the LIWC categories that have lower correlations,
and indeed even, inverse correlations show that Emojis used to express
these constructs are likely different overall.
‘Insight’, ‘Discrepancy’, ‘Quantitative’, ‘Number’, ‘Time’, ‘Friend’,
and ‘Work’ have small or near-zero correlations. This seems to be
in line with categories that are linked to cultural influence. In
terms of the grammatical categories of ‘Quantifiers’ and ‘Number’,
given that there are differences in the grammar and syntax of Chinese,
Japanese, and English, this difference is also understandable. Similarly,
‘Time’ is often viewed symbolically and is laden with cultural meaning;
moreover, there are differences in the importance of keeping time
and the timing of events (?). East Asians
and Westerner also have differences in interpersonal dealings. With
regard to the former, Confucianism places a premium on harmony and
proper relationships as the basis for Asian society whereas Westerners
often place greater importance in outcomes and direct communication (?).
This is revealed in differences in the category of ‘Friend’ in how
Emojis are used to express that idea. To a larger extent, it also
extends to the broader category of social processes where we also
find a low correlation on Emojis expressing the concept of ‘Family’.
Emojis also seem to reflect governmental policies. For example, the
Chinese government had been banning game consoles till 2015, and –
in our dataset collected from 2014 – the game controller Emoji ‘![]() ’
that dominates West in ‘Leisure’ is nowhere to be seen in the East.
’
that dominates West in ‘Leisure’ is nowhere to be seen in the East.
With regard to the categories of Discrepancy and Work having lower correlations, our explanations are at best speculative. The category of ‘Discrepancy’ (containing the textual tokens ‘should’, ‘could’, ‘would’) may be expressed differently with Emojis due to the deferential culture and higher power-distance in the Eastern context as opposed to the Western context (?; ?).
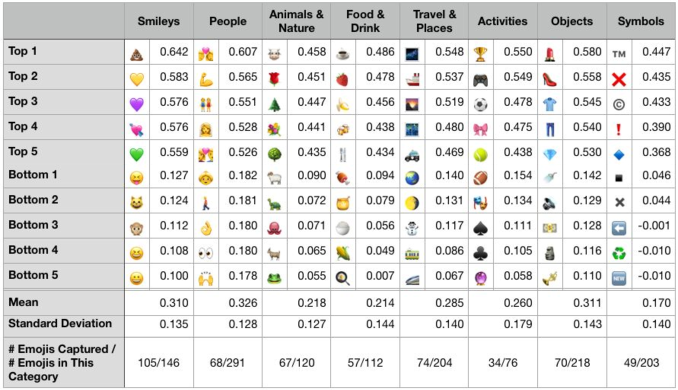
Icon Differences
Given that Emojis are based on an ideographic system where each symbol represents a specific concept, it is also important to examine how Emojis are similar or different between the Eastern and Western contexts. For this, we transpose the results from association with psycholinguistic categories to determine the extent Emojis are similar based on how the different LIWC categories are projected onto the Emojis. Figure 5 shows the top 5 and bottom 5 Emojis (ranked by SCC) across both platforms for each Unicode category. The mean and std. dev of each of these categories are also presented. Social scientific theories emphasizing on the universality of basic emotions suggests that emotion-expressing Emojis tend to show high convergence even between distinct cultures such as the East and the West (?; ?). Therefore, it is expected that categories of ‘Smileys’ and ‘People’ would likely be more convergent compared to other categories. Consistent with this expectation, the Emoji categories of ‘Smileys’ and ‘People’ display relatively higher mean correlations between both cultures ( and respectively).
A significant cultural difference component is language itself as it forms the basis of cultural expression. The use of emics, from within the social group, in anthropology and psychology where cultural behaviors and ideas are understood from the context of the culture itself emphasizes the specificity and distinctiveness of language rather than its commonality (?). From this view, the ‘Symbols’ category is likely to converge less. This was borne out from the relatively low average correlations () between Eastern and Western cultures for the ‘Symbols’ category.
It is again important to note that there appears to be evidence for the universality of Emojis from this analysis as there is a positive correlation across all the different Emoji categories. Further categories such as ‘Objects’ and ‘Travel’ had similar levels of correlations as ‘Smileys’ and ‘People’.
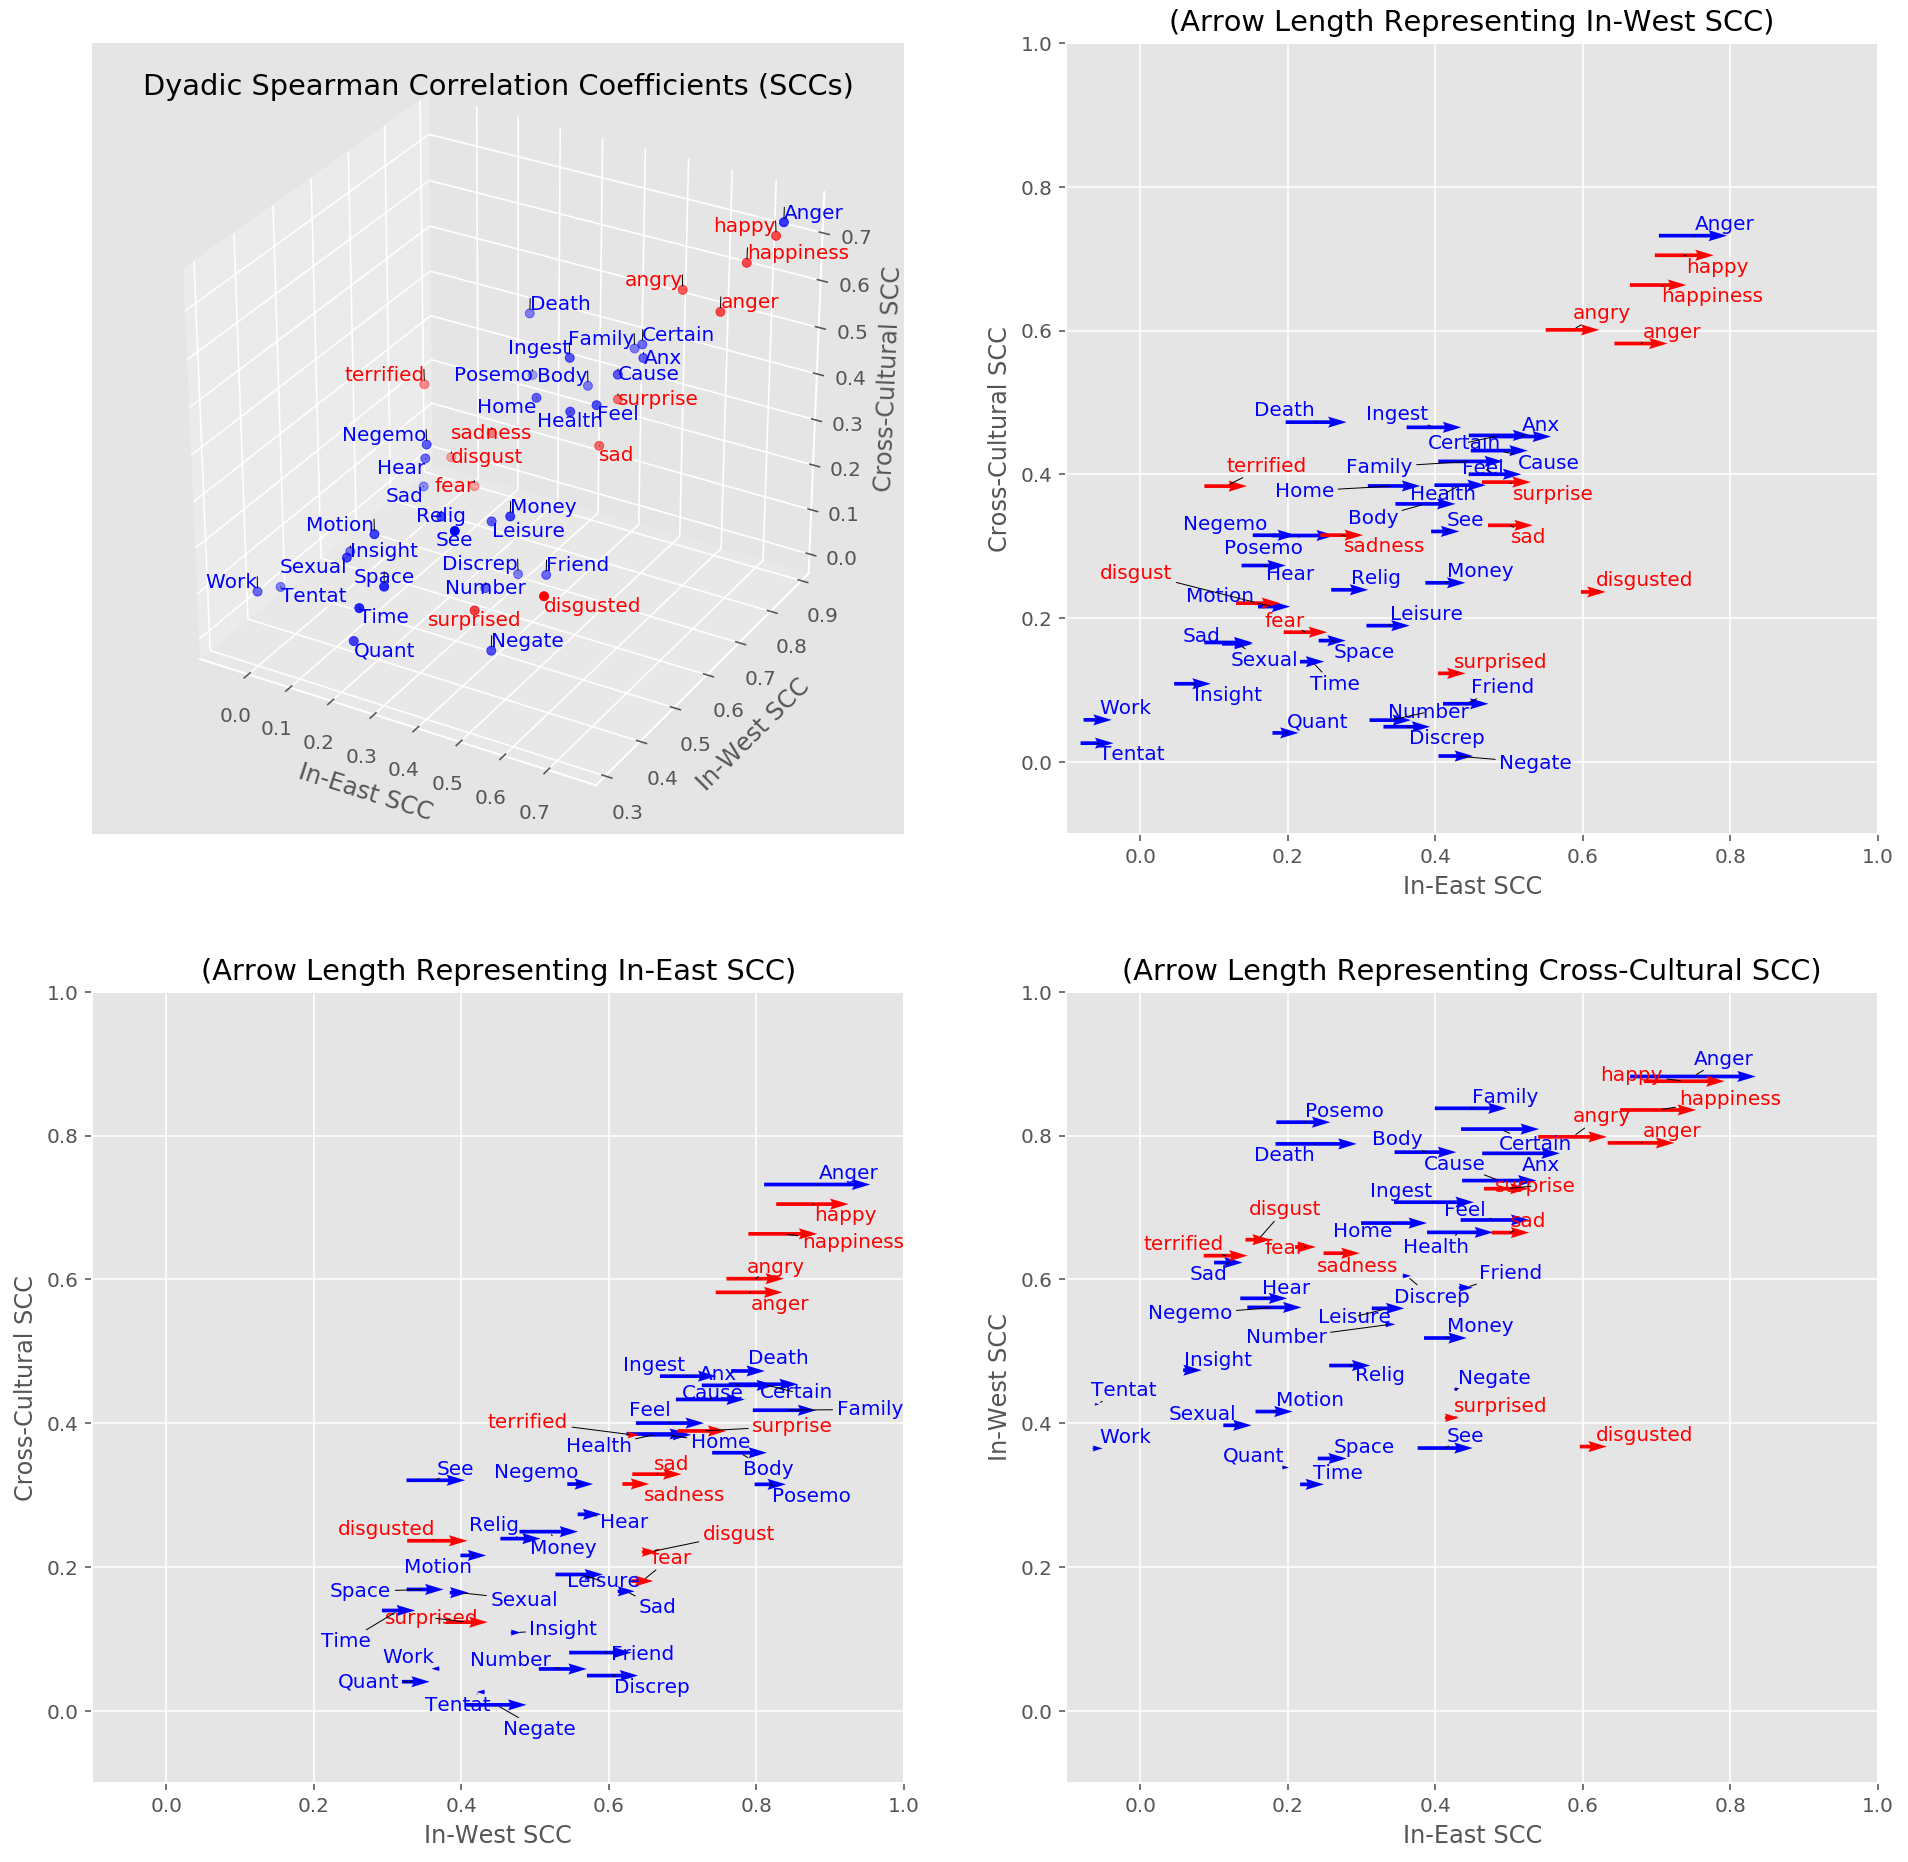
Association with Universal Ekman Emotions
We further investigated the semantics of Emoji usage and how they vary when compared against expression of universal basic emotions (specifically Ekman categories). If Emoji representations are normative, we would find similar levels of SCCs with basic emotion categories. As LIWC does not cover all 6 Ekman basic emotions (?), we looked at specific emotion words such as ‘anger’ and ‘happy’. To overcome the selection bias in part of speech, we considered both nouns and adjective forms. We consider individual word vectors learned from each Word2Vec model. Hence, we extend the previous definition of ‘category vector’ to include also Ekman emotion words. For each LIWC category and Ekman emotion word , SCCs between country pairs are computed. Represented by , they are then averaged with respect to whether and are both from the East (‘In-East SCCs’), both from the West (‘In-West SCCs’), or different cultures (‘Cross-Cultural SCCs’). The 3 vectors are plotted as coordinates in the 3D scatter graph in Figure 6. We find that, based on SCC magnitudes, there is a greater similarity in Emoji representation among Western nations compared to the East. LIWC categories such as ‘Friend’, ‘Insight’, ‘Motion’, ‘Work’, and ‘Number’ had relatively low similarities within Western and Eastern contexts and also did not have substantial East-West similarity. However, categories such as ‘Anger’, ‘posemo’ (positive emotion), ‘Death’, and ‘Family’ had relatively higher similarities within Western and Eastern contexts and also higher similarities across the two cultures. Ekman emotion word terms were also included in the quiver plots to assess the degree to which basic emotions are similar within and also across Eastern and Western cultures. We found that the most universal terms were with regard to anger and happiness (i.e., similarity within and between cultures). However, with regard to surprise, disgust, sadness, and fear there was less relative similarity across cultures. We emphasize relative because this also confirms our findings that the Emoji representations instantiated in LIWC categories have a substantial degree of normativeness; therefore, we find that even basic emotion categories (e.g., surprise, disgust, sad/sadness, fear/terrified) do not uniquely distinguish themselves to have much higher cross-cultural SCCs, although we do see a trend that some categories like ‘Quant’, ‘Time’, ‘Work’, and ‘Space’ have lower cross-cultural convergence.
Limitations and Future Work
In this paper, we find, amid similarity, that there are some cultural dimensions that emerge from how the semantics of Emoji vary across both cultures. While these differences were studied primarily from the perspective of Emoji use, a large portion of it could potentially also be attributed to the text of the post. By training Word2Vec models with both text and Emoji tokens across the East and the West, and by analyzing the Emoji associations with word categories as captured by LIWC, we attempt to uncover the interactions between both. However, it would be interesting to study the cross-cultural variation in text and Emoji usage independently to quantify each. Approaches from recent work on understanding Emoji ambiguity in English (?) could be coupled with ours to achieve this goal.
Even though we attempted to compare Emoji usage in 2 Eastern countries (Japan and China) and 3 Western countries (US, UK, and Canada) respectively, we nevertheless used two different platforms, namely Weibo and Twitter to represent each. We also used LIWC from Chinese and English, and obtained Japanese version by translating the Chinese LIWC. This could potentially introduce confounds around platform differences, over and above cultural differences. To minimize this, we restricted posts based on geo-location, dropped bilingual posts, and analyzed posts in the primary language of communication in each country. Prior studies also found a lot of similarities in user demographics, intention of use and topical differences (?; ?; ?). However, it would be promising to look at data from other sources (such as smart phone users (?)) where social desirability and censorship confounds might be lower to further validate the findings in our study.
All our analyses were based on correlation rather than causality. Because of the richness and diversity of the Emojis, it is difficult to hypothesize a priori how specific Emojis may differ. Therefore, we undertook an abductive approach to construct explanatory theories as patterns emerged from our analysis (?). For social science research, these methods offer data-driven insights into group and user behaviors which can be used to generate new hypotheses for testing and can be used to unobtrusively measure large populations over time. Commercial applications include improving targeted online marketing, increasing acceptance of Human Computer Interaction systems and personalized cross-cultural recommendations for communication.
Future work should investigate similarities and differences in other socio-psychological constructs. Also, considering the promise of Emojis in downstream application tasks such as sentiment analysis, studies should explore the contribution of Emojis in multi-modal and cross-lingual sentiment analysis and transfer learning tasks.
Conclusion
In this paper, we compared Emoji usage based on frequency, context, and topic associations across countries in the East (China and Japan) and the West (United States, United Kingdom, and Canada). Our results offer insight into cultural similarities and differences at several levels. In general, we found evidence for the normativeness, or the universality, of Emojis. While there are relative differences in that Western users tend to use more Emojis than Eastern users, the relative frequencies in different types of Emojis are correlated across cultures. Moreover, distributional semantics found that the Emoji expressions were clustered in a similar manner across cultures. Even when we used universal basic emotions as a benchmark, we found that Emojis were represented in a cross-culturally similar manner compared to these basic emotion expressions.
At the same time, we found that there appear to also interpretable distinctions between Emoji use based on topical analyses. Emojis were culturally specific as certain types of Emojis such as rice-based dishes had the highest projection on the LIWC category of ‘Ingest’ in the East while a mix of meat and spaghetti had the highest project on the same category in the West. Analysis at the icon level reveal support for general social scientific theories of cultural similarities and differences where relative similarities were found more in terms of the ‘Smileys’ and ‘People’ icons whereas relative differences were found for ‘Symbols’ icons. Nevertheless, these findings need to be construed from the perspective that there appears to be a robust thread of cross-cultural similarity in Emoji patterns.
References
- [Aaker, Benet-Martinez, and Garolera 2001] Aaker, J. L.; Benet-Martinez, V.; and Garolera, J. 2001. Consumption symbols as carriers of culture: A study of japanese and spanish brand personality constucts. Journal of personality and social psychology 81(3):492.
- [Ahn et al. 2011] Ahn, Y.-Y.; Ahnert, S. E.; Bagrow, J. P.; and Barabási, A.-L. 2011. Flavor network and the principles of food pairing. Scientific reports 1:196.
- [Bagozzi, Wong, and Yi 1999] Bagozzi, R. P.; Wong, N.; and Yi, Y. 1999. The role of culture and gender in the relationship between positive and negative affect. Cognition & Emotion 13(6):641–672.
- [Barbieri et al. 2016] Barbieri, F.; Kruszewski, G.; Ronzano, F.; and Saggion, H. 2016. How cosmopolitan are emojis?: Exploring emojis usage and meaning over different languages with distributional semantics. In Proceedings of the 2016 ACM on Multimedia Conference, 531–535. ACM.
- [Barbieri, Espinosa-Anke, and Saggion 2016] Barbieri, F.; Espinosa-Anke, L.; and Saggion, H. 2016. Revealing patterns of twitter emoji usage in barcelona and madrid. Frontiers in Artificial Intelligence and Applications. 2016;(Artificial Intelligence Research and Development) 288: 239-44.
- [Barbieri, Ronzano, and Saggion 2016] Barbieri, F.; Ronzano, F.; and Saggion, H. 2016. What does this emoji mean? a vector space skip-gram model for twitter emojis. In LREC.
- [Berger and Dore 1996] Berger, S., and Dore, R. P. 1996. National diversity and global capitalism. Cornell University Press.
- [Björck 1994] Björck, Å. 1994. Numerics of gram-schmidt orthogonalization. Linear Algebra and Its Applications 197:297–316.
- [Boers 2003] Boers, F. 2003. Applied linguistics perspectives on cross-cultural variation in conceptual metaphor. Metaphor and Symbol 18(4):231–238.
- [Brislin and Kim 2003] Brislin, R. W., and Kim, E. S. 2003. Cultural diversity in people’s understanding and uses of time. Applied Psychology 52(3):363–382.
- [Danesi 2016] Danesi, M. 2016. The semiotics of emoji: The rise of visual language in the age of the internet. Bloomsbury Publishing.
- [Eid and Diener 2009] Eid, M., and Diener, E. 2009. Norms for experiencing emotions in different cultures: Inter-and intranational differences. In Culture and Well-Being. Springer. 169–202.
- [Eisner et al. 2016] Eisner, B.; Rocktäschel, T.; Augenstein, I.; Bošnjak, M.; and Riedel, S. 2016. emoji2vec: Learning emoji representations from their description. arXiv preprint arXiv:1609.08359.
- [Ekman 1992] Ekman, P. 1992. An argument for basic emotions. Cognition & emotion 6(3-4):169–200.
- [Ekman 1993] Ekman, P. 1993. Facial expression and emotion. American psychologist 48(4):384.
- [Ekman 2016] Ekman, P. 2016. What scientists who study emotion agree about. Perspectives on Psychological Science 11(1):31–34.
- [Elfenbein and Ambady 2003] Elfenbein, H. A., and Ambady, N. 2003. Universals and cultural differences in recognizing emotions. Current directions in psychological science 12(5):159–164.
- [Farh, Hackett, and Liang 2007] Farh, J.-L.; Hackett, R. D.; and Liang, J. 2007. Individual-level cultural values as moderators of perceived organizational support–employee outcome relationships in china: Comparing the effects of power distance and traditionality. Academy of Management Journal 50(3):715–729.
- [Felbo et al. 2017] Felbo, B.; Mislove, A.; Søgaard, A.; Rahwan, I.; and Lehmann, S. 2017. Using millions of emoji occurrences to learn any-domain representations for detecting sentiment, emotion and sarcasm. arXiv preprint arXiv:1708.00524.
- [Fishman 1980] Fishman, J. A. 1980. Bilingualism and biculturism as individual and as societal phenomena. Journal of Multilingual & Multicultural Development 1(1):3–15.
- [Gao et al. 2012] Gao, Q.; Abel, F.; Houben, G.-J.; and Yu, Y. 2012. A comparative study of users’ microblogging behavior on sina weibo and twitter. In International Conference on User Modeling, Adaptation, and Personalization, 88–101. Springer.
- [Guntuku et al. 2015a] Guntuku, S. C.; Lin, W.; Scott, M. J.; and Ghinea, G. 2015a. Modelling the influence of personality and culture on affect and enjoyment in multimedia. In 2015 International Conference on Affective Computing and Intelligent Interaction (ACII), 236–242. IEEE.
- [Guntuku et al. 2015b] Guntuku, S. C.; Scott, M. J.; Yang, H.; Ghinea, G.; and Lin, W. 2015b. The cp-qae-i: A video dataset for exploring the effect of personality and culture on perceived quality and affect in multimedia. In 2015 Seventh International Workshop on Quality of Multimedia Experience (QoMEX), 1–7. IEEE.
- [Guntuku et al. 2018] Guntuku, S. C.; Buffone, A.; Jaidka, K.; Eichstaedt, J.; and Ungar, L. 2018. Understanding and measuring psychological stress using social media. arXiv preprint arXiv:1811.07430.
- [Guntuku et al. 2019] Guntuku, S. C.; Preoţiuc-Pietro, D.; Eichstaedt, J. C.; and Ungar, L. 2019. What twitter profile and posted images reveal about depression and anxiety.
- [Haig 2005] Haig, B. D. 2005. An abductive theory of scientific method. Psychological methods 10(4):371.
- [Harris 1976] Harris, M. 1976. History and significance of the emic/etic distinction. Annual review of anthropology 5(1):329–350.
- [Hofstede 1983] Hofstede, G. 1983. National cultures in four dimensions: A research-based theory of cultural differences among nations. International Studies of Management & Organization 13(1-2):46–74.
- [Huang et al. 2012] Huang, C.-L.; Chung, C. K.; Hui, N.; Lin, Y.-C.; Seih, Y.-T.; Lam, B. C.; Chen, W.-C.; Bond, M. H.; and Pennebaker, J. W. 2012. The development of the chinese linguistic inquiry and word count dictionary. Chinese Journal of Psychology.
- [Kaye, Malone, and Wall 2017] Kaye, L. K.; Malone, S. A.; and Wall, H. J. 2017. Emojis: Insights, affordances, and possibilities for psychological science. Trends in cognitive sciences 21(2):66–68.
- [Kübler-Ross 1973] Kübler-Ross, E. 1973. On death and dying. Routledge.
- [Larson and Verma 1999] Larson, R. W., and Verma, S. 1999. How children and adolescents spend time across the world: work, play, and developmental opportunities. Psychological bulletin 125(6):701.
- [Li et al. 2014] Li, L.; Li, A.; Hao, B.; Guan, Z.; and Zhu, T. 2014. Predicting active users’ personality based on micro-blogging behaviors. PloS one 9(1):e84997.
- [Li et al. 2019] Li, M.; Guntuku, S. C.; Jakhetiya, V.; and Ungar, L. H. 2019. Exploring (dis-)similarities in emoji-emotion association on twitter and weibo. In EMOJI2019 colocated with The WebConf. ACM.
- [Lin et al. 2016] Lin, H.; Jia, J.; Nie, L.; Shen, G.; and Chua, T.-S. 2016. What does social media say about your stress? In Proceedings of IJCAI.
- [Lin, Lachlan, and Spence 2016] Lin, X.; Lachlan, K. A.; and Spence, P. R. 2016. Exploring extreme events on social media: A comparison of user reposting/retweeting behaviors on twitter and weibo. Computers in Human Behavior 65:576–581.
- [López and Cap 2017] López, R. P., and Cap, F. 2017. Did you ever read about frogs drinking coffee? investigating the compositionality of multi-emoji expressions. In Proceedings of the 8th Workshop on Computational Approaches to Subjectivity, Sentiment and Social Media Analysis, 113–117.
- [Lu et al. 2016] Lu, X.; Ai, W.; Liu, X.; Li, Q.; Wang, N.; Huang, G.; and Mei, Q. 2016. Learning from the ubiquitous language: an empirical analysis of emoji usage of smartphone users. In Proceedings of the 2016 ACM International Joint Conference on Pervasive and Ubiquitous Computing, 770–780. ACM.
- [Lui and Baldwin 2012] Lui, M., and Baldwin, T. 2012. langid. py: An off-the-shelf language identification tool. In Proceedings of the ACL 2012 system demonstrations, 25–30. Association for Computational Linguistics.
- [Ma 2013] Ma, L. 2013. Electronic word-of-mouth on microblogs: A cross-cultural content analysis of twitter and weibo. Intercultural Communication Studies 22(3).
- [Matsumoto 1990] Matsumoto, D. 1990. Cultural similarities and differences in display rules. Motivation and emotion 14(3):195–214.
- [Mikolov et al. 2013] Mikolov, T.; Sutskever, I.; Chen, K.; Corrado, G. S.; and Dean, J. 2013. Distributed representations of words and phrases and their compositionality. In Advances in neural information processing systems, 3111–3119.
- [Miller et al. 2016] Miller, H.; Thebault-Spieker, J.; Chang, S.; Johnson, I.; Terveen, L.; and Hecht, B. 2016. Blissfully happy” or “ready to fight”: Varying interpretations of emoji. Proceedings of ICWSM 2016.
- [Miller et al. 2017] Miller, H. J.; Kluver, D.; Thebault-Spieker, J.; Terveen, L. G.; and Hecht, B. J. 2017. Understanding emoji ambiguity in context: The role of text in emoji-related miscommunication. In ICWSM, 152–161.
- [Miller Hillberg et al. 2018] Miller Hillberg, H.; Levonian, Z.; Kluver, D.; Terveen, L.; and Hecht, B. 2018. What i see is what you don’t get: The effects of (not) seeing emoji rendering differences across platforms. Proceedings of the ACM on Human-Computer Interaction 2(CSCW):124.
- [Pennebaker et al. 2015] Pennebaker, J. W.; Boyd, R. L.; Jordan, K.; and Blackburn, K. 2015. The development and psychometric properties of liwc2015. Technical report.
- [Pennebaker, Francis, and Booth 2001] Pennebaker, J. W.; Francis, M. E.; and Booth, R. J. 2001. Linguistic inquiry and word count: Liwc 2001. Mahway: Lawrence Erlbaum Associates 71(2001):2001.
- [Preotiuc-Pietro et al. 2012] Preotiuc-Pietro, D.; Samangooei, S.; Cohn, T.; Gibbins, N.; and Niranjan, M. 2012. Trendminer: An architecture for real time analysis of social media text.
- [Prescott and Bell 1995] Prescott, J., and Bell, G. 1995. Cross-cultural determinants of food acceptability: recent research on sensory perceptions and preferences. Trends in Food Science & Technology 6(6):201–205.
- [Quercia et al. 2011] Quercia, D.; Kosinski, M.; Stillwell, D.; and Crowcroft, J. 2011. Our twitter profiles, our selves: Predicting personality with twitter. In Privacy, Security, Risk and Trust (PASSAT) and 2011 IEEE Third Inernational Conference on Social Computing (SocialCom), 2011 IEEE Third International Conference on, 180–185. IEEE.
- [Russell et al. 2013] Russell, J. A.; Fernández-Dols, J.-M.; Manstead, A. S.; and Wellenkamp, J. C. 2013. Everyday conceptions of emotion: An introduction to the psychology, anthropology and linguistics of emotion, volume 81. Springer Science & Business Media.
- [Salehi et al. 2017] Salehi, B.; Hovy, D.; Hovy, E.; and Søgaard, A. 2017. Huntsville, hospitals, and hockey teams: Names can reveal your location. In Proceedings of the 3rd Workshop on Noisy User-generated Text, 116–121.
- [Sap et al. 2014] Sap, M.; Park, G.; Eichstaedt, J.; Kern, M.; Stillwell, D.; Kosinski, M.; Ungar, L.; and Schwartz, H. A. 2014. Developing age and gender predictive lexica over social media. In Proceedings of the 2014 Conference on Empirical Methods in Natural Language Processing (EMNLP), 1146–1151.
- [Schwartz 1994] Schwartz, S. H. 1994. Beyond individualism/collectivism: New cultural dimensions of values.
- [Shibata et al. 2016] Shibata, D.; Wakamiya, S.; Kinoshita, A.; and Aramaki, E. 2016. Detecting japanese patients with alzheimer’s disease based on word category frequencies. In Proceedings of the Clinical Natural Language Processing Workshop (ClinicalNLP), 78–85.
- [Tay et al. 2011] Tay, L.; Diener, E.; Drasgow, F.; and Vermunt, J. K. 2011. Multilevel mixed-measurement irt analysis: An explication and application to self-reported emotions across the world. Organizational Research Methods 14(1):177–207.
- [Tian et al. 2018] Tian, X.; Batterham, P.; Song, S.; Yao, X.; and Yu, G. 2018. Characterizing depression issues on sina weibo. International journal of environmental research and public health 15(4):764.
- [Tsai, Knutson, and Fung 2006] Tsai, J. L.; Knutson, B.; and Fung, H. H. 2006. Cultural variation in affect valuation. Journal of personality and social psychology 90(2):288.
- [Uchida and Kitayama 2009] Uchida, Y., and Kitayama, S. 2009. Happiness and unhappiness in east and west: themes and variations. Emotion 9(4):441.
- [Van den Berghe 1984] Van den Berghe, P. L. 1984. Ethnic cuisine: Culture in nature. Ethnic and Racial Studies 7(3):387–397.
- [Wijeratne et al. 2017] Wijeratne, S.; Balasuriya, L.; Sheth, A.; and Doran, D. 2017. Emojinet: An open service and api for emoji sense discovery. In Eleventh International AAAI Conference on Web and Social Media.
- [Xu and Mori 2011] Xu, M., and Mori, N. 2011. Fast text character set recognition. US Patent 7,865,355.
- [Yum 1988] Yum, J. O. 1988. The impact of confucianism on interpersonal relationships and communication patterns in east asia. Communications Monographs 55(4):374–388.
- [Zhang et al. 2016] Zhang, W.; Caines, A.; Alikaniotis, D.; and Buttery, P. 2016. Predicting author age from weibo microblog posts. In LREC.
- [Zhong et al. 2015] Zhong, Y.; Yuan, N. J.; Zhong, W.; Zhang, F.; and Xie, X. 2015. You are where you go: Inferring demographic attributes from location check-ins. In Proceedings of the eighth ACM international conference on web search and data mining, 295–304. ACM.
- [Zhu et al. 2018] Zhu, Y.; Guntuku, S. C.; Lin, W.; Ghinea, G.; and Redi, J. A. 2018. Measuring individual video qoe: A survey, and proposal for future directions using social media. ACM Transactions on Multimedia Computing, Communications, and Applications (TOMM) 14(2s):30.