Subject Cross Validation in Human Activity Recognition
Abstract.
K-fold Cross Validation is commonly used to evaluate classifiers and tune their hyperparameters. However, it assumes that data points are Independent and Identically Distributed (i.i.d.) so that samples used in the training and test sets can be selected randomly and uniformly. In Human Activity Recognition datasets, we note that the samples produced by the same subjects are likely to be correlated due to diverse factors. Hence, k-fold cross validation may overestimate the performance of activity recognizers, in particular when overlapping sliding windows are used. In this paper, we investigate the effect of Subject Cross Validation on the performance of Human Activity Recognition, both with non-overlapping and with overlapping sliding windows. Results show that k-fold cross validation artificially increases the performance of recognizers by about 10%, and even by 16% when overlapping windows are used. In addition, we do not observe any performance gain from the use of overlapping windows. We conclude that Human Activity Recognition systems should be evaluated by Subject Cross Validation, and that overlapping windows are not worth their extra computational cost.
1. Introduction
Wearable sensors and mobile devices keep transforming society at an increasing pace, creating a wide range of opportunities for knowledge extraction from new data sources. Human Activity Recognition (HAR), in particular, is an active research area due to its potential applications in security, virtual reality, sports training, and health care. For instance, it has been used to detect anomalous behaviors such as falls (bianchi2010barometric, ) and to track movement-related conditions in seniors (chen2014implementing, ).
Most HAR systems rely on an Activity Recognition Process (ARP) to label activities. An ARP segments sensor data in time windows, from which it extracts feature vectors that are then fed to a classifier. ARPs have several hyperparameters such as the size of the time windows and the type of features extracted. Works such as (banos2014window, ) and (sousa2017comparative, ) showed the impact of these parameters on ARP performance, and provided guidelines to optimize them.
The main technique to evaluate model performance and tune hyperparameters is k-fold Cross Validation (k-fold CV) (arlot2010survey, ). It assumes that samples are Independent and Identically Distributed (i.i.d.), that is, data points are independently drawn from the same distribution. However, in HAR datasets, samples that belong to the same subject are likely to be related to each other, due to underlying environmental, biological and demographics factors. In addition, there is often a temporal correlation among samples of a subject, due to, for example, fatigue, training, experience. As a result, k-fold CV might overestimate classification performance by relying on correlations within subjects.
Furthermore, two types of sliding windows are used for time series segmentation: non-overlapping ones, in which time windows do not intersect, and overlapping ones, in which they do (lara2013survey, ). Overlapping windows share data samples with each other, which further increases within-subject correlations (coggeshall2005asset, ). This is another infringement to the i.i.d assumption in k-fold CV, potentially further overestimating classification performance.
To address this issue, this paper investigates the impact of Subject Cross Validation (Subject CV) on ARP, both with overlapping and with non-overlapping sliding windows. Through Subject CV, we quantify and discuss the performance overestimation resulting from k-fold CV.
The question of validation is a timely topic in HAR. k-fold CV is widely employed, and examples are found both with overlapping and with non-overlapping windows. For instance, a well-known reference on HAR is (morris2014recofit, ), which applies ARP on a dataset of accelerometer and gyroscope data collected from 114 participants over 146 sessions. The authors address three major challenges namely (1) segmenting exercise from intermittent non-exercise periods, (2) recognizing which exercise is being performed, and (3) counting repetitions. Data points are windowed into 5-second overlapping windows sliding at 200ms and subsequently, each window is transformed into 224 features. Linear support vector machines (SVM) are used in the classification stage, and evaluated by k-fold CV. Spectacular performance is achieved, with precision and recall greater than 95% to identify exercise periods, recognition of up to 99% for circuits of 4 exercises, and counting accurate to 1 repetition 93% of the time.
Another example is (banos2014window, ), which we use as a baseline for our work. In their work, the authors evaluate several classifiers on a dataset of 17 subjects, using non-overlapping windows and k-fold CV. In particular, they investigate the selection of window sizes for optimal classification performance. They reach an F1-score close to 1 with the k-nearest neighbors classifier.
The main contributions of our work are:
-
•
An in-depth investigation of how ARP performance is impacted by k-fold CV.
-
•
The proposal of Subject CV as a more reliable and robust validation of ARP.
-
•
A set of publicly available scripts to help the research community further shed light on the important topic of HAR validation.
In Section 2, we present background in ARP, cross validation, and sliding windows. We also describe the baseline study from which we started. In Section 3 we explain our ARP setting, and in Section 4 we present our results. Finally, we discuss their impact in Section 5, and we summarize our conclusions in Section 6.
2. Background
In this section, we overview the ARP process, describe the difference cross validation methods, and present the previous study by Banos et al. (banos2014window, ), that we use as a baseline comparison.
2.1. Activity Recognition Process
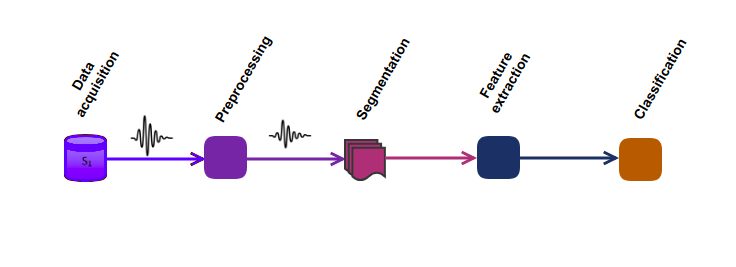
ARP, also known as activity recognition chain, is composed of a sequence of signal processing, pattern recognition, and machine learning techniques (bulling2014tutorial, ). It mainly consists of the 5 steps shown in Figure 1 and explained hereafter.
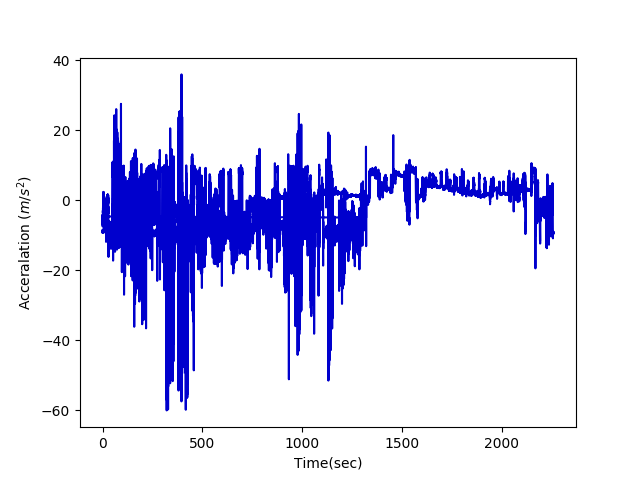
Data acquisition. Several sensors are attached to different body parts. They mostly acquire 3D acceleration, gyroscopic data and magnetic field measurements, as shown in Figure 2. Sensor discretize signals at a given frequency, typically 50Hz for daily activities or 200Hz for fast sports, and transmit the resulting data points to the receiver.
Pre-processing. Data points coming from sensors may include artifacts of various origins such as electronic fluctuations, sensor malfunctions, and physical activities (arlot2010survey, ). To eliminate such artifacts, filtering techniques are commonly applied, such as the Butterworth low-pass filter used in (morris2014recofit, ), (selles2005automated, ) and (najafi2003ambulatory, ). Filtering should be used with care as it may also remove valuable information from the signals.
Segmentation. Discrete data points produced by the sensors are partitioned into time windows labeled from the most frequent activity in the window. The number of data points in a time window, a.k.a the window size, heavily impacts the performance of the model (bulling2014tutorial, ) (banos2014window, ). The current method to select the window size is empirical and time consuming: it simply tests different values to find the optimal one (bulling2014tutorial, ).
Feature extraction. Each time window is then transformed to a vector of features such as auto-correlation features (morris2014recofit, ), or statistical moments. These features are then used to help discriminate various activities.
Classification. Finally, a classifier is trained on the vector of features and corresponding labels, and assigns future observations to one of the learned activities. According to (lara2013survey, ), Decision trees, Naive Bayes, SVM, k-nearest neighbors, Hidden Markov Models and ensemble classifiers such as Random Forest are the most important classifiers in HAR.
The window size in the segmentation step and the feature selection in feature extraction step are hyperparameters of the ARP, usually selected by trial and error as in (banos2014window, ). They must be selected by the user and (as others have shown and we will show later in our paper) can greatly impact the performance of the model.
2.2. Cross Validation Methods
The ultimate goal of ARP is to build a model that generalizes well, such that activities learned from a reduced set of subjects can be recognized in larger populations. Generalizability therefore has to be properly evaluated.
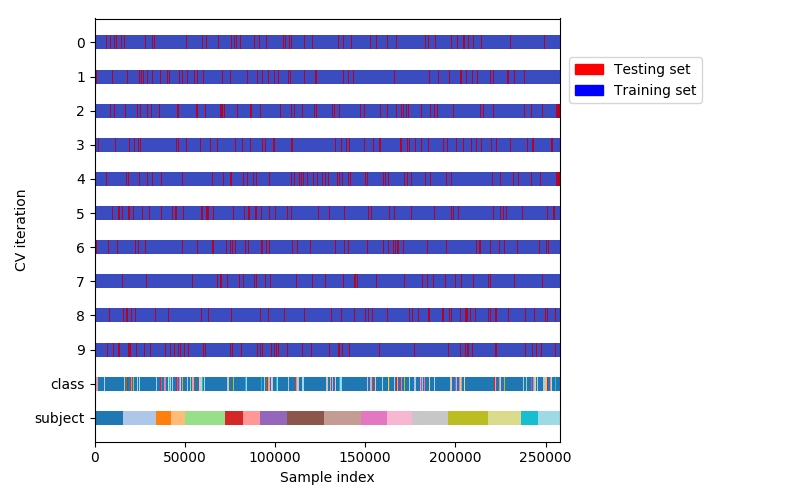
In k-fold CV (Figure 3) the overall data is randomly partitioned in k equal subsets. The model is then trained on k-1 subsets, and the remaining one is used for testing (trevor2009elements, ). The main assumption of k-fold CV is that samples are Independent and Identically Distributed (i.i.d.) (arlot2010survey, ), which means that all the data points are sampled independently from the same distribution. Under such an assumption, the test set can be any part of the dataset.
However, samples drawn from a given subject are likely to not be independent, for two reasons. First, there is a strong inter-subject variability in the way activities are conducted (bulling2014tutorial, ). This means that the similarity of samples drawn from the same subject is likely to be higher than that of samples drawn from different subjects. Several factors might explain such variability, including sex, gender, age or experience. Second, there is a temporal dependence between activities performed by the same subject: the similarity between samples drawn in a short time interval, for instance in the same training session in case of training activities, will most likely be higher than that of samples drawn further apart in time. This is due to factors such as fatigue and training.
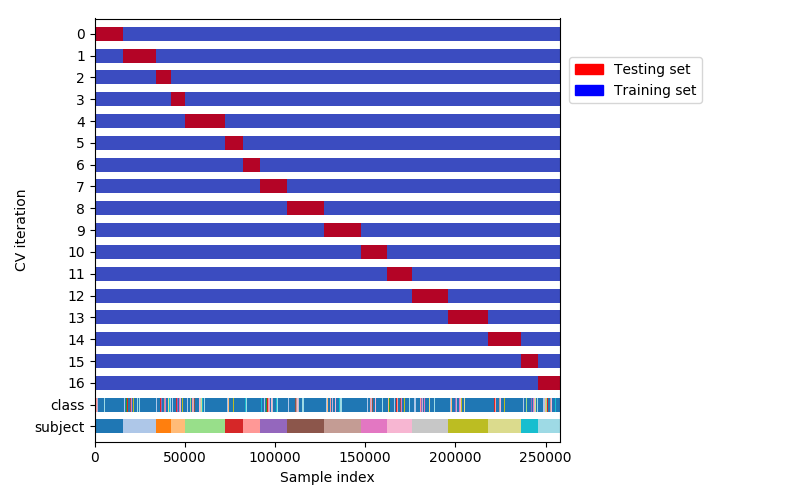
To address these issues, Subject CV (Figure 4) splits the training and testing sets by subject. That is, in each fold the model is trained on all the subjects except one, which is used for testing. The intra-subject dependencies present in k-fold CV are hence removed. In this case, the number of folds is lower or equal to the number of subjects in the dataset.
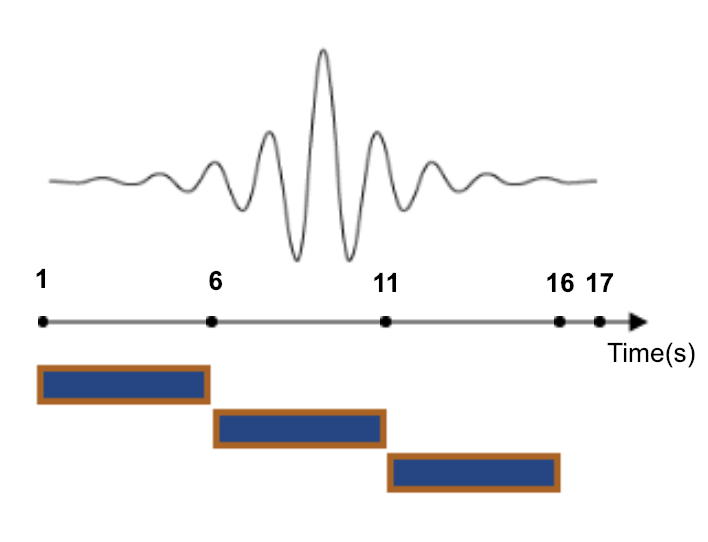
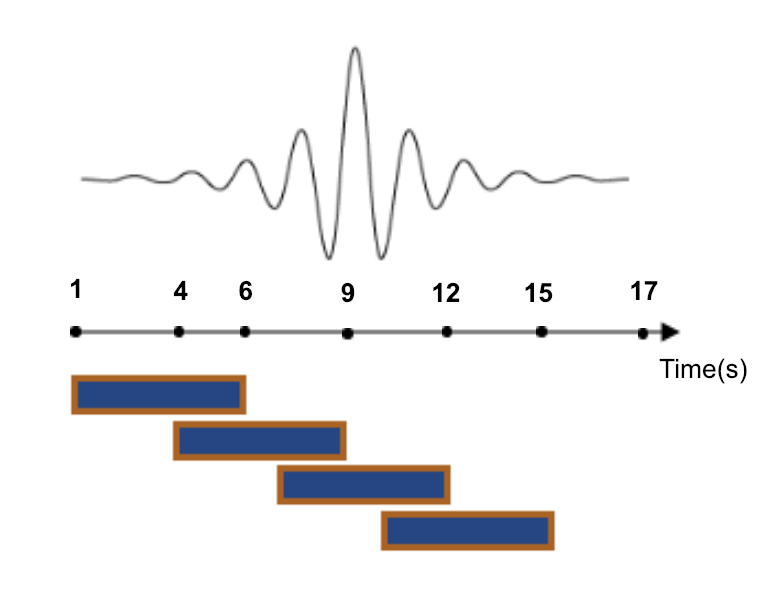
Overlapping sliding windows. In the segmentation step of ARP, the data points are windowed to capture the dynamics of activities. This process assumes that each window is an approximation of the signal for which the classifier will have to make a decision. Figure 5 illustrates the non-overlapping and overlapping windowing techniques. Non-overlapping windows are commonly considered less accurate compared to overlapping windows because (1) overlapping windows result in more data points, which usually increases the performance of classifiers, and (2) non-overlapping windows may miss important events in the dataset. A more formal discussion of the superiority of overlapping windows over non-overlapping ones can be found in (coggeshall2005asset, ).
2.3. Baseline study
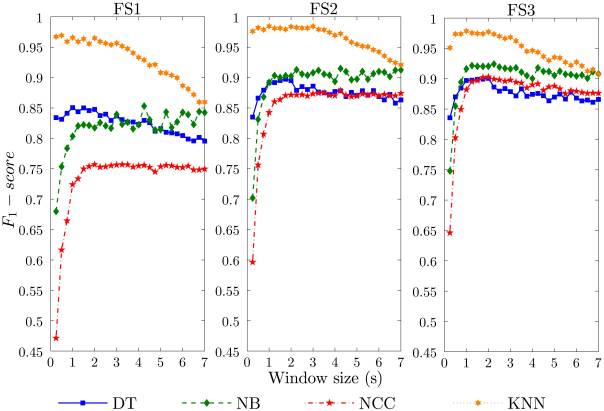
Our study reproduces and extends the work in (banos2014window, ), where the authors apply ARP on the 17-subject dataset described in (banos2012benchmark, ). They segment the signals without pre-processing, using non-overlapping time windows with diverse sizes ranging from 0.25s to 7s. They consider three different feature sets, namely the mean only (FS1), the mean and standard deviation (FS2), and the mean, standard deviation, maximum, minimum and mean crossing rate (FS3). They compare four classifiers: C4.5 Decision Trees (DT), K-Nearest Neighbors (KNN) with k=3, Naive Bayes (NB) and Nearest Centroid Classifier (NCC). They report F1-scores through a ten-fold cross-validation. Finally, they select optimal window sizes through a grid search process over specified values. Figure 6 illustrates their results for different feature sets and classifiers.
3. Experiment design
The motivation for our study is to investigate the effect of Subject CV on ARP. We consider both overlapping and non-overlapping sliding windows.
3.1. Dataset
We use the dataset described in (banos2012benchmark, ), one of the most complete public datasets for HAR in terms of the number of activities and subjects. The dataset consists of data collected from 17 subjects of diverse profiles while wearing 9 Xsens111https://www.xsens.com inertial measurement units on different parts of their body. Subjects performed 33 fitness activities (Table 1) ranging from warm up to fitness exercises in an out-of-lab environment. Each sensor provides tri-directional acceleration, gyroscope, and magnetic field measurements as well as orientation estimates in quaternion format (4D). Only acceleration was used in (banos2014window, ), and hence in our study. The dataset also provides data for three sensor displacement scenarios namely “default”, “self-placement” and “mutual-displacement” to compare the sensor anomalies, but as in (banos2014window, ), only the data from default scenario is used in our study.
| Activities | |
|---|---|
| Walking (1 min) | Upper trunk and lower body opposite twist (20x) |
| Jogging (1 min) | Arms lateral elevation (20x) |
| Running (1 min) | Arms frontal elevation (20x) |
| Jump up (20x) | Frontal hand claps (20x) |
| Jump front & back (20x) | Arms frontal crossing (20x) |
| Jump sideways (20x) | Shoulders high amplitude rotation (20x) |
| Jump leg/arms open/closed (20x) | Shoulders low amplitude rotation (20x) |
| Jump rope (20x) | Arms inner rotation (20x) |
| Trunk twist (arms outstretched) (20x) | Knees (alternatively) to the breast (20x) |
| Trunk twist (elbows bended) (20x) | Heels (alternatively) to the backside (20x) |
| Waist bends forward (20x) | Knees bending (crouching) (20x) |
| Waist rotation (20x) | Knees (alternatively) bend forward (20x) |
| Waist bends (reach foot with opposite hand) (20x) | Rotation on the knees (20x) |
| Reach heels backwards (20x) | Rowing (1 min) |
| Lateral bend (10x to the left + 10x to the right) | Elliptic bike (1 min) |
| Lateral bend arm up (10x to the left + 10x to the right) | Cycling (1 min) |
| Repetitive forward stretching (20x) | |
3.2. Study setup
Similar to (banos2014window, ), we did not apply any pre-processing to the dataset. We used both overlapping and non-overlapping windows. Overlapping windows were sliding at 200 ms, with window sizes ranging from 0.25 s to 7 s. For instance, a 5-second window shared 4.8 s of data with the previous one. For non-overlapping windows, we used the same settings as in (banos2014window, ): disjoint windows with sizes ranging from 0.25 s to 7 s. We used the same feature sets as in (banos2014window, ), namely FS1 (mean only), FS2 (mean and standard deviation) and FS3 (mean, standard deviation, maximum, minimum and mean crossing rate). Finally, for the classification part, we used the following classifiers: Decision Tree (DT), K-nearest neighbors (KNN, K=3), Naive Bayes (NB), Nearest Centroid Classifier (NCC). We used these classifiers as implemented in scikit-learn 0.20 (pedregosa2011scikit, ).
To evaluate model performance, we used both k-fold CV, as in (banos2014window, ), and Subject CV. We use the F1-score as performance measure, computed as follows:
In our multi-class scenario, we compute the F1-score using the total number of true positives, false negatives, and false positives across all the classes. This is known as f1_micro in scikit-learn (pedregosa2011scikit, ), by opposition with f1_macro that averages F1-scores computed in each class individually.
4. Results
The goal of our study is to explore the importance of Subject CV in ARP, both with non-overlapping and with overlapping windows. In this section, the impact of Subject CV and overlapping windows on the system described in (banos2014window, ) is explored.
4.1. Experiment 1: k-fold CV, non-overlapping windows
In this experiment, we intend to reproduce the work in (banos2014window, ) and use it as a baseline for further evaluations. We applied the ARP as explained in Section 2.3, on the dataset described in Section 3.1, using the classifiers in (banos2014window, ). For each window size, we partitioned the dataset in non-overlapping windows and extracted feature sets FS1, FS2 and FS3 in each window. We trained the classifiers on the resulting feature vectors, and measured their average F1-score over 10-fold CV.
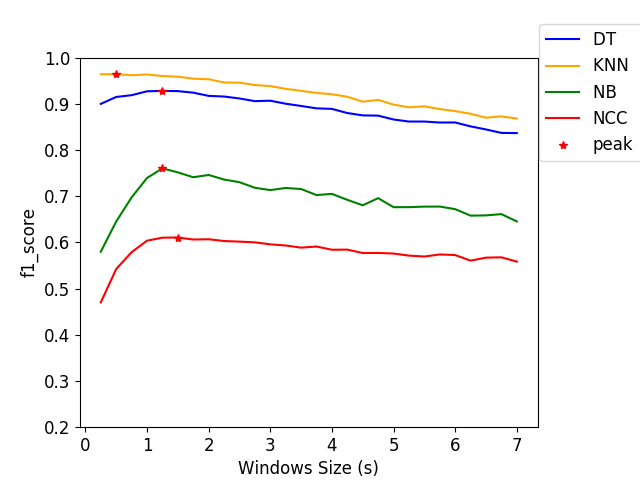
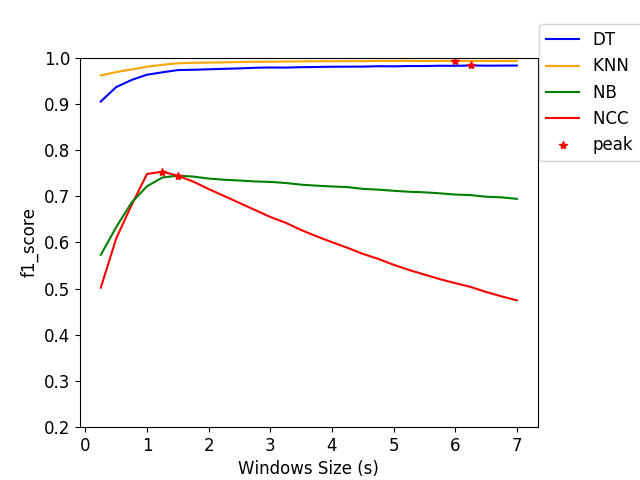
Figure 7 shows the F1-scores of the classifiers for different window sizes. The classifiers can be categorized in two performance groups: (1) KNN and DT show good performance (average F1-score: 0.8969 for FS3), while (2) NB and NCC show poor performance (average F1-score: 0.6578 for FS3). Similar to (banos2014window, ) (Figure 6), the performance of the first group (KNN and DT) decreased with the size of the window. For the second group, the F1-score increased until it reached a maximum, around 1 second, then decreased (NCC) or remained almost constant (NB). Quantitatively, the F1-scores of KNN are very similar to the ones in (banos2014window, ); KNN ranked first among all classifiers for all feature sets, with F1-scores above 0.96. However, the F1-scores of NB, DT and NCC are slightly different from the scores in (banos2014window, ). For FS3, the average F1-scores were 0.89 (DT), 0.71 (NB) and 0.6 (NCC) while in (banos2014window, ), we estimate them as 0.86, 0.91 and 0.88 respectively. As in (banos2014window, ), the performance of the models improves on average as the feature set becomes richer, i.e., from FS1 to FS2, and from FS2 to FS3. In particular, FS2 notably improves the performance of NCC and NB compared to FS1. Finally, as in (banos2014window, ), KNN and DT perform best for the smallest window size (0.25 s), but NB and NCC need larger window sizes. In both case, 1 s was a cut-off value for the window size, for all feature sets and all classifiers: beyond this value, no important performance benefits were obtained.
4.2. Experiment 2: k-fold CV, overlapping windows
As explained earlier, overlapping windows increase the dependence between time windows, which potentially increases classification performance measured through k-fold CV. In this experiment, we use overlapping windows to explore their effect on the ARP system described in (banos2014window, ).
The only difference between this experiment and Experiment 1 is in the segmentation step. Here, each window slides at 200 ms. We selected 200 ms as in (morris2014recofit, ).
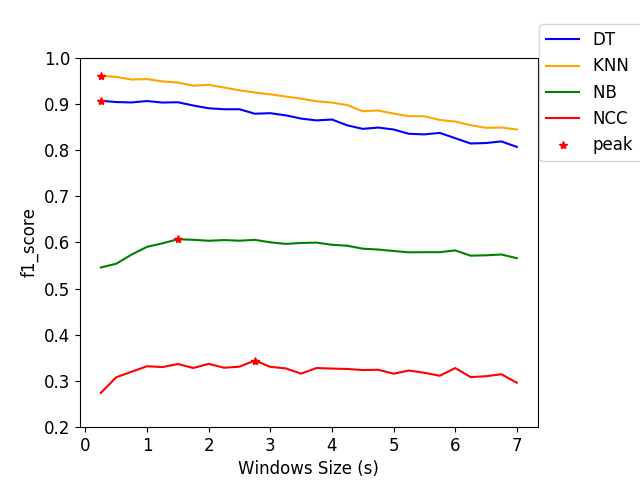
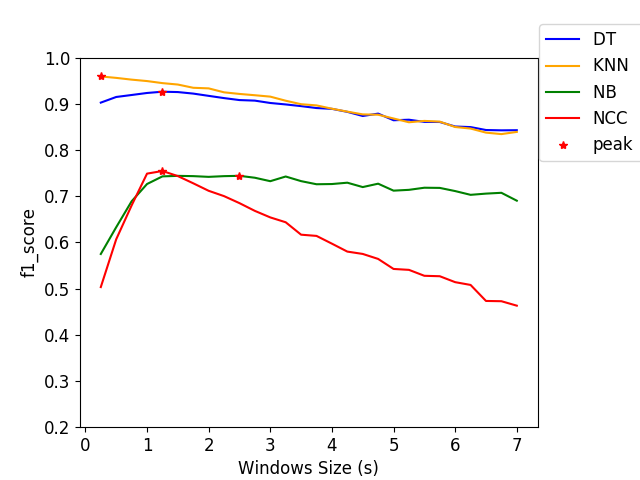
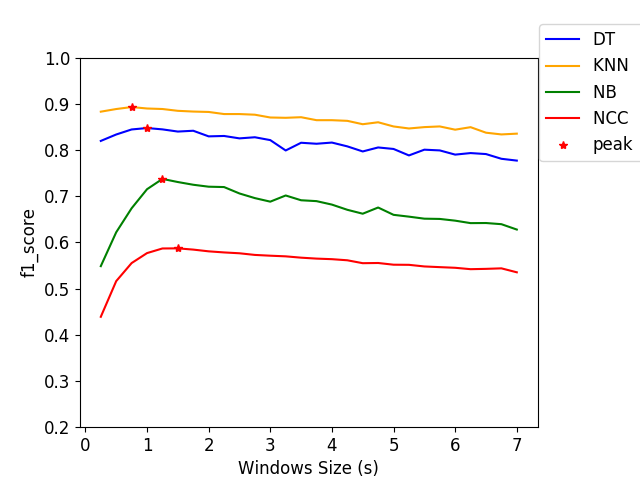
Our results are shown in Figure 8. Similar to Experiment 1, we observe the same two performance groups. However, the trend is inverted in the first group: now, the F1-score increases with the window size. Quantitatively, the F1-score of KNN and DT increased by about 10% on average, but that of NB and NCC remained similar. KNN was the best performing classifier for all feature sets, as in the Experiment 1. However, KNN no longer allows us to maximally reduce the window size. As in the Experiment 1, overall, the richer the feature set used, the higher the performance obtained. Optimal window sizes (peak values in the Figures) are very different compared to the Experiment 1, in particular for KNN and DT.
These results show that overlapping sliding windows further overestimate classification performance by k-fold CV, due to the dependency between datapoints.
4.3. Experiment 3: Subject CV, non-overlapping windows
In this experiment we measured the effect of Subject CV on the ARP system of (banos2014window, ). The only difference between this experiment and Experiment 1 is the evaluation approach. We applied the ARP with the same settings as previously, except that we replaced k-fold CV by Subject CV.
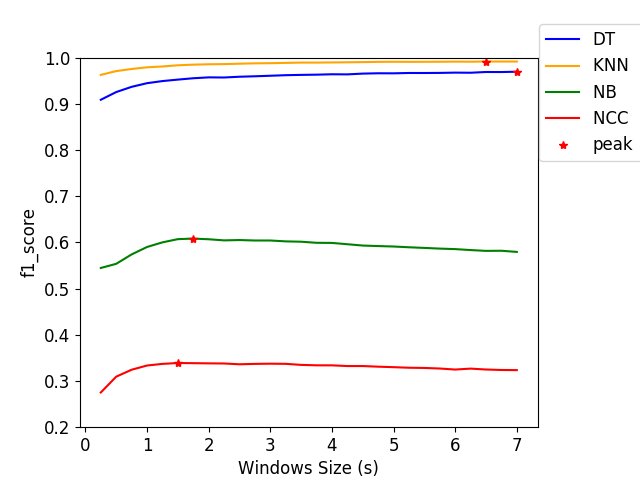
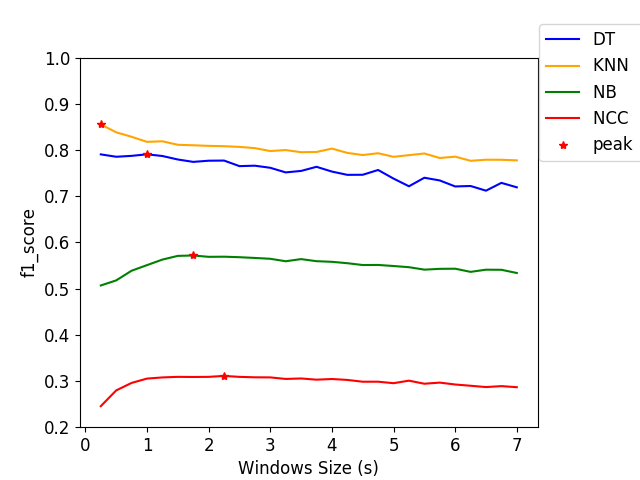
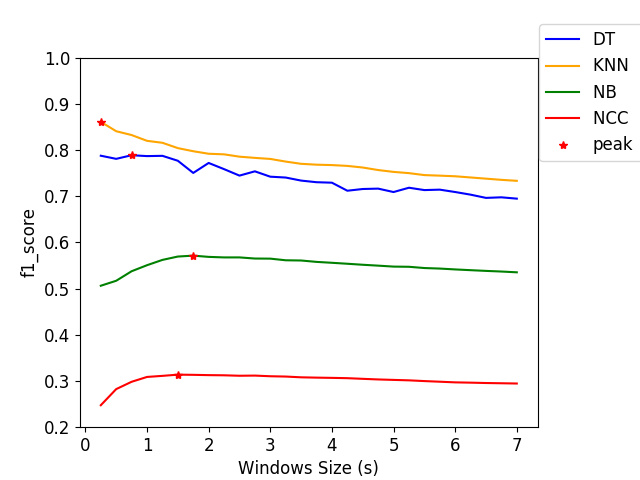
Our results are shown in Figure 9. The two groups of classifiers remained unchanged from Figure 7. Although the trends are similar, important quantitative differences between F1-scores are observed for KNN and DT: here, F1-scores of KNN and DT peaked at 0.89 and 0.85, while in Figure 6, they reached their peaks at 0.99 and 0.93 respectively. In comparison, the performance for NB and NCC remained stable. As before, the F1-score of classifiers increased as the feature sets enriched. Regarding the optimal window sizes, in comparison to those in (banos2014window, ), they remained almost unchanged and 1 second remained a cut-off value.
Overall the results show that Subject CV removes the overestimation observed in k-fold CV.
4.4. Experiment 4: Subject CV, overlapping sliding windows
In Experiment 3, we observed that applying Subject CV instead of k-fold CV heavily changes the performance of the best classifiers. Here we measure how overlapping windows impact the results of Experiment 3.
To conduct this experiment, the parameters used in Experiment 3 remained the same, except the sliding windows. Here, we use overlapping sliding windows with 200 ms sliding.
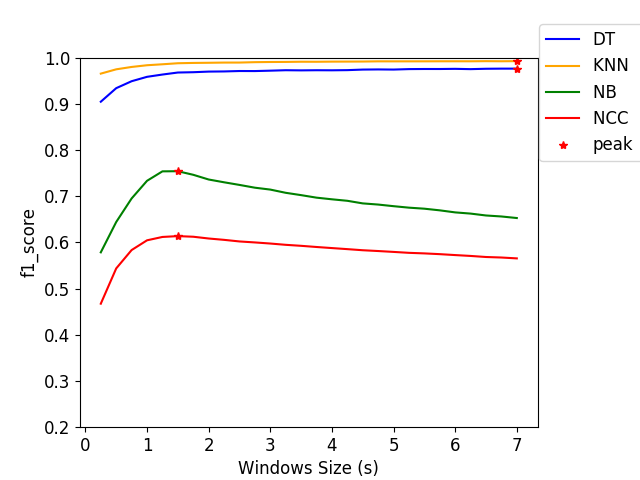
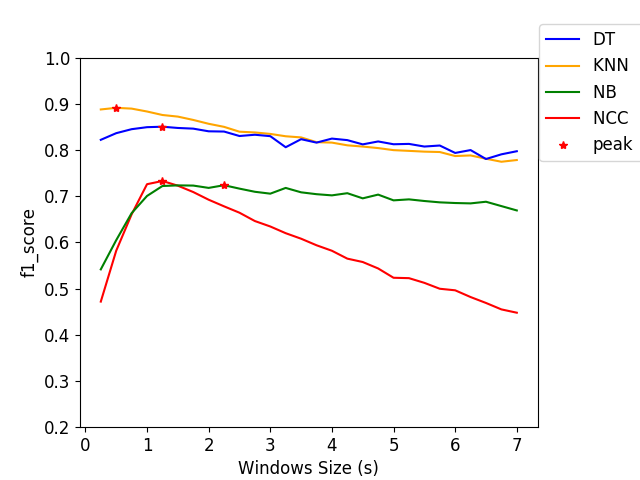
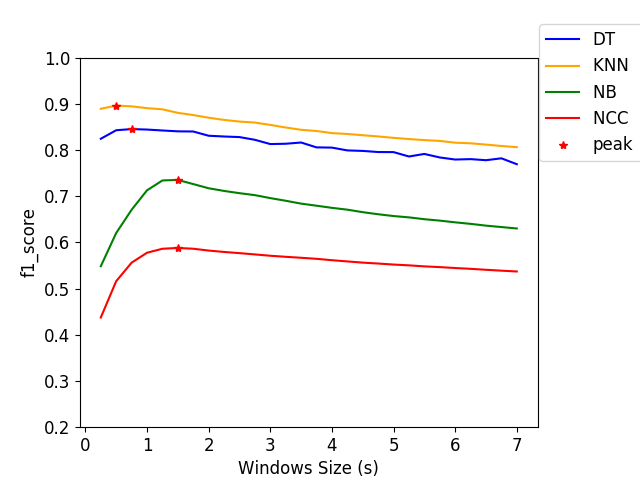
Our results are reported in Figure 10. As in the previous experiments, the classifiers can be categorized in two groups. The relationship between window size and F1-score stayed unchanged compared to Experiment 3 and conducted experiment in Experiment 1. More precisely, contrary to the analyses described in Section 4.2, using overlapping sliding windows did not inverse the trend of KNN and DT. This finding shows that such an approach is not a determining factor when used with Subject CV process. Quantitatively, the F1-score of models was the same as in Experiment 3. Likewise, using richer feature sets led to better performance. As for optimal window size, in general, there were no noticeable differences compared to Experiment 3.
Overall the results of this experiment show that the artificial performance increase of overlapping windows observed in k-fold CV (Experiment 3) does not appear with Subject CV.
5. Discussion
As can be seen by comparing Figures 7 and 9, using Subject CV instead of k-fold CV reduces the F1-score of KNN and DT by 10% on average, which is substantial. It confirms our hypothesis that samples drawn from the same subject cannot be considered independent. In an ARP setup, k-fold CV overestimates the classification performance and should therefore be avoided.
The detrimental effect of k-fold CV is even larger when overlapping time windows are used. In this case, as can be seen by comparing Figures 8 and 10, Subject CV reduces the F1-score of KNN and DT by 16% on average. This further confirms that within-subject dependencies between time windows account for a significant part of the performance measured through k-fold CV. Furthermore, for overlapping windows, the performance difference between k-fold CV and Subject CV increases with the window size. This is consistent with our previous comments, as the amount of overlap between overlapping windows, and therefore their correlation, also increases with the window size.
When using Subject CV, the impact of using overlapping windows is minor to negligible, as can be seen by comparing Figure 9 to Figure 10. This is in contradiction with the common argument that overlapping windows improve classification performance by bringing more data to the classifier. However, it also confirms our hypothesis that the performance increase coming from overlapping windows is in fact coming from the extra correlation between time windows, when k-fold CV is used.
The best observed F1-scores dropped from 0.96 in k-fold CV (reached for KNN and FS3) to 0.89 in Subject CV (KNN, FS3). This substantial difference opens an opportunity to improve the performance of HAR. We speculate from this study that building a dataset with a larger number of subjects would help reaching a better classification performance. Indeed, it seems difficult to capture the diversity of human behaviors in 33 activities with only 17 subjects.
As can be seen by comparing Figure 7 and Figure 8, optimal window sizes are different when overlapping sliding windows are used and when they are not. This is mainly because overlapping windows increase the dependency between data points: as window sizes increase, the correlation between windows also increases. This does not happen with non-overlapping windows, which explains the difference in optimal window sizes.
The results in Figure 7 are in agreement with the ones in (banos2014window, ): F1-scores are not identical but close, and trends are generally consistent. This general agreement between our results and the ones in (banos2014window, ) reinforces our confidence in our results. The slight difference between our F1-score values might be coming from variations in the way the F1-scores are computed. F1-score is a harmonic mean between precision and recall; in case of multiclass targets, it can be computed in different ways. For instance, metrics can be calculated globally by counting total true positives, false negatives and false positives, or they can be calculated within each class. We calculated the F1-score globally, using the so-called “micro” method in scikit-learn 0.20 (pedregosa2011scikit, ). The randomness involved in sample selection for k-fold CV, as well as other hyperparameters of the classifiers such as ”classification criteria” and ”max depth” for DT, might also explain some of the observed variations. In the future, we recommend to share all the parameters of the classifiers, for instance by sharing the scripts used for training, to improve reproducibility.
The size of segmented data by overlapping sliding windows technique is almost 9 times of data produced by non-overlapping one. As a result, the training time for classifiers on overlapping windowed datasets is also much higher than for non-overlapping ones. In spite of such increase in size and computation, this technique does not improve the performance of the classifiers when used with Subject CV.
Choosing the right validation framework also depends on the target application. Here, we assumed that the ARP system would be used on a different population of subjects than it was trained on, which we believe is the main use case for such systems. However, in some cases, it might be relevant to train and test the system on the same subject, for instance when active learning is used. In such situations, Subject CV would obviously underestimate classification performance. Other forms of cross validation should be investigated for such situations.
There might also be situations where Subject CV would still overestimate performance, in case other confounding factors are present. For instance, data acquisition conditions (site, protocol, sensors and their parametrization), subject demographics, or even pre-processing steps might also introduce spurious correlations between samples that would lead to performance overestimations. Our results only studied one aspect of the larger problem of results evaluation, which should remain a constant concern.
6. Conclusion
We conclude that k-fold CV overestimates the performance of HAR systems by about 10% (16% when overlapping windows are used), and should therefore not be used in this context. Instead, Subject CV provides a performance evaluation framework closer to the goal of activity recognition systems: we recommend its use for performance evaluation and hyperparameter tuning in ARP. We also conclude that overlapping sliding windows aggravate the performance overestimation done by k-fold CV, but do not improve the performance measured by Subject CV. Their added-value in our context therefore seems limited.
7. Reproducibility
All the source codes for conducted experiments are available in our GitHub repository 222http://www.github.com/big-data-lab-team/paper-generalizability-window-size. It contains the scripts to segment the dataset (banos2012benchmark, ) for different window sizes, feature sets and sliding window techniques. There is also a script for training and testing all mentioned classifiers on windowed datasets. Finally it also contains code to reproduce all presented figures in this paper.
8. Acknowledgments
This work was funded by a Strategic Project Grant from the Natural Sciences and Engineering Research Council of Canada. We thank Martin Khannouz for his useful comments. We also thank the authors of (banos2014window, ) for making their dataset publicly available.
References
- [1] Federico Bianchi, Stephen J Redmond, Michael R Narayanan, Sergio Cerutti, and Nigel H Lovell. Barometric pressure and triaxial accelerometry-based falls event detection. IEEE Transactions on Neural Systems and Rehabilitation Engineering, 18(6):619–627, 2010.
- [2] Ke-Yu Chen, Mark Harniss, Shwetak Patel, and Kurt Johnson. Implementing technology-based embedded assessment in the home and community life of individuals aging with disabilities: A participatory research and development study. Disability and Rehabilitation: Assistive Technology, 9(2):112–120, 2014.
- [3] Oresti Banos, Juan-Manuel Galvez, Miguel Damas, Hector Pomares, and Ignacio Rojas. Window size impact in human activity recognition. Sensors, 14(4):6474–6499, 2014.
- [4] Wesllen Sousa, Eduardo Souto, Jonatas Rodrigres, Pedro Sadarc, Roozbeh Jalali, and Khalil El-Khatib. A comparative analysis of the impact of features on human activity recognition with smartphone sensors. In Proceedings of the 23rd Brazillian Symposium on Multimedia and the Web, pages 397–404. ACM, 2017.
- [5] Sylvain Arlot, Alain Celisse, et al. A survey of cross-validation procedures for model selection. Statistics surveys, 4:40–79, 2010.
- [6] Oscar D Lara, Miguel A Labrador, et al. A survey on human activity recognition using wearable sensors. IEEE Communications Surveys and Tutorials, 15(3):1192–1209, 2013.
- [7] Stephen Coggeshall and Guowei Wu. Asset allocation and long-term returns: An empirical approach. 2005.
- [8] Dan Morris, T Scott Saponas, Andrew Guillory, and Ilya Kelner. Recofit: using a wearable sensor to find, recognize, and count repetitive exercises. In Proceedings of the SIGCHI Conference on Human Factors in Computing Systems, pages 3225–3234. ACM, 2014.
- [9] Andreas Bulling, Ulf Blanke, and Bernt Schiele. A tutorial on human activity recognition using body-worn inertial sensors. ACM Computing Surveys (CSUR), 46(3):33, 2014.
- [10] Ruud W Selles, Margriet AG Formanoy, Johannes BJ Bussmann, Peter J Janssens, and Henk J Stam. Automated estimation of initial and terminal contact timing using accelerometers; development and validation in transtibial amputees and controls. IEEE transactions on neural systems and rehabilitation engineering, 13(1):81–88, 2005.
- [11] Bijan Najafi, Kamiar Aminian, Anisoara Paraschiv-Ionescu, François Loew, Christophe J Bula, and Philippe Robert. Ambulatory system for human motion analysis using a kinematic sensor: monitoring of daily physical activity in the elderly. IEEE Transactions on biomedical Engineering, 50(6):711–723, 2003.
- [12] Oresti Baños, Miguel Damas, Héctor Pomares, Ignacio Rojas, Máté Attila Tóth, and Oliver Amft. A benchmark dataset to evaluate sensor displacement in activity recognition. In Proceedings of the 2012 ACM Conference on Ubiquitous Computing, pages 1026–1035. ACM, 2012.
- [13] Hastie Trevor, Tibshirani Robert, and Friedman JH. The elements of statistical learning: data mining, inference, and prediction, 2009.
- [14] Fabian Pedregosa, Gaël Varoquaux, Alexandre Gramfort, Vincent Michel, Bertrand Thirion, Olivier Grisel, Mathieu Blondel, Peter Prettenhofer, Ron Weiss, Vincent Dubourg, et al. Scikit-learn: Machine learning in python. Journal of machine learning research, 12(Oct):2825–2830, 2011.