Spectroscopic line parameters of NO, NO2, and N2O for the HITEMP database
Abstract
This work describes the update of NO along with the incorporation of NO2 and N2O to the HITEMP database. Where appropriate, the HITRAN line lists for the same molecules have also been updated. This work brings the current number of molecules provided by HITEMP to seven. The initial line lists originating from ab initio and semi-empirical methods for each molecule have been carefully validated against available observations and, where necessary, adjustments have been made to match observations. We anticipate this work will be applied to a variety of high-temperature environments including astronomical applications, combustion monitoring, and non-local thermodynamic equilibrium conditions.
keywords:
High-temperature spectroscopy, NO , NO2 , N2O , line lists , HITEMP1 Introduction
Nitrogen oxides play a key role in atmospheric chemistry. Nitric oxide (NO) and nitrogen dioxide (NO2), collectively referred to as NOx, are a primary source of air pollution and contribute to the formation of smog and acid rain [1]. Nitrous oxide (N2O), while not considered a strict member of the NOx family, is a major greenhouse gas and has recently overtaken chlorofluorocarbons (CFCs) as the dominant anthropogenic cause of ozone depletion [2]. Additional nitrogen oxides can be observed in the terrestrial atmosphere; however their abundance is significantly smaller and not considered here.
Atmospheric NOx is primarily a consequence of the combustion of fossil fuels at high temperatures. However, NOx is also readily produced by other means, including the burning of biomass material (natural and man-made), soil emissions [3], and lightning strikes [4].
NOx gases are highly poisonous and detrimental to air quality. For this reason, NOx gases are heavily monitored and regulated by governments (e.g., via the Clean Air Act in the USA) and can be measured in human breath samples when monitoring health effects [5]. Diesel engines are notorious for the levels of NOx they produce during the combustion process, since the formation of NOx is strongly coupled to combustion temperatures [6]. The monitoring of NOx emissions is therefore a crucial aspect of the automotive industry. A recent international scandal centered on the under-reporting of diesel engine emissions: the highlighted NOx emissions exceeded legal levels by up to 40 times [7]. The spectroscopy of NOx has been applied to non-invasive thermometry of high-enthalpy environments [8] and in situ measurements of the exhaust gases of coal-fired power plants [9] and vehicles [10].
In addition to combustion environments, NO is also present in observations of nightglow in the atmospheres of Earth [11], Mars [12], and Venus [13]. Terrestrial emission from the thermosphere has also shown NO to be in non-local thermodynamic equilibrium (NLTE) [14], requiring the consideration of high rotational transitions in limb-view radiative transfer models. N2O, commonly referred to as laughing gas (and used worldwide as an anaesthetic), can be employed as a component for rocket propulsion [15], remaining relatively stable up to 1100 K.
Additionally, NOx gases have been predicted to be present in the atmospheres of Earth-like exoplanets [16], with N2O proposed as a potential biosignature [17].
1.1 The HITRAN and HITEMP databases
The HITRAN database contains detailed molecular spectroscopic parameters of 49 molecules (along with absorption cross-sections, collision-induced absorption spectra and data of aerosol properties), with HITRAN2016 [18] the most recent version. It is freely available at HITRANonline111https://hitran.org, and includes spectroscopic parameters of NO, NO2 and N2O. The HITRAN database is used as an input source for radiative-transfer codes in a variety of applications, but the principal use for HITRAN is in the remote sensing of the terrestrial atmosphere. The parameters have a reference temperature of 296 K, and a description of all HITRAN parameters is given in Ref. [18]. The HITRAN data are extremely successful at modeling spectra in the temperature regime of the terrestrial atmosphere. Recent updates have expanded HITRAN to include additional broadening parameters for H2, He, and CO2 of relevance to the atmospheres of Jupiter, Saturn and Mars [19]. However, application of HITRAN to environments with elevated temperatures can lead to an incomplete model. This incompleteness is a consequence of HITRAN containing predominantly rotational, vibrational and electronic transitions that are relevant for the terrestrial atmosphere (and typically observed). For this reason, it is not necessary to include some high rotational transitions, many vibrational hot bands, or extremely weak transitions since they have no observable effect to the spectrum (at terrestrial atmospheric temperatures). However, as the temperature increases, the distribution of populated energy levels changes such that these ‘weak’ transitions can no longer be ignored.
The original HITEMP database [20] was established to be a molecular spectroscopic database specifically aimed at modeling gas phase spectra for high-temperature applications. Improvements in the accuracy of theoretical calculations for high temperature (e.g., Ref. [21]) enabled significant advancements for the characterization of high-temperature environments (e.g., exoplanet atmospheres [22]). These studies prompted a comprehensive update to the HITEMP database, leading to HITEMP2010 [23], for which the most reliable data was collated for five molecules: H2O, CO2, CO, NO and OH.
The most noticeable difference between the HITRAN and HITEMP databases is the number of lines included for each molecule. As an example, the principal isotopologue of H2O currently has 141,360 lines when downloaded from HITRANonline, as opposed to 114,241,164 in HITEMP2010: an 800-fold increase (both line lists cover the same wavenumber range of 0 to almost 30,000 cm-1). This increase in the number of transitions will also increase the burden on line-by-line calculations by a similar order. These (numerous) additional lines are not necessary for terrestrial atmospheric applications and are not included in HITRAN.
Where possible, the HITRAN data are consistent with HITEMP. However, providing consistency between HITRAN and HITEMP is a challenge for molecules with numerous experimental and theoretical reference sources, and often involves substituting the HITRAN data into these (extremely large) theoretical line lists: a non-trivial task. Differing theoretical methods and mixing of modes can mean that quantum number assignments between sources are not necessarily comparable for high polyads, and unique line identification becomes a challenge. For both HITRAN and HITEMP, particular attention is given to the validation of line lists and care is taken when merging data, but occasionally this method can introduce small discontinuities in line positions or intensities as the data sources change.
The line parameters included for HITEMP are described in Ref. [23], and are also provided at a reference temperature of 296 K. While this may seem low for a high-temperature database, the consistency with HITRAN helps to avoid confusion (for example when a simulation code uses both databases simultaneously such as in a scenario where a hot source is viewed through a layered atmosphere). Furthermore, the line intensities of both databases () can be routinely scaled to an alternate temperature (), using
| (1) |
where K, is the second radiation constant (i.e., cmK), is the total partition sum, is the lower state energy and is the transition frequency (both in cm-1). All quantities used in Eq. 1 are provided via the HITRAN and HITEMP databases.
Since the release of HITEMP2010, there have been a number of experimental, theoretical, and semi-empirical studies aimed at improving the high-temperature modeling of small molecules. This work describes the update of NO and and additions of NO2 and N2O to the HITEMP database. The molecules are described in order of their ID in HITRAN.
2 Nitrous Oxide (molecule 4)
2.1 Description of N2O line lists
N2O was not included as part of HITEMP2010 [23], and for the HITEMP update described in this work, only 14N216O will be considered. This updated N2O line list has been completed using current line parameters from HITRAN2016 [18] and the recent NOSD-1000 [24] line list. These line lists are briefly described.
2.1.1 N2O in HITRAN2016
HITRAN2016 contains five isotopologues of N2O: 14N216O, 14N15N16O, 15N14N16O, 14N218O, 14N217O with relative abundances of 0.990333, 0.003641, 0.003641, 0.001986, 0.000369, respectively.
The 14N216O line list predominantly constitutes line positions and intensities from Toth [25]. However, pure rotational transitions are included from Rothman et al. [26] and Chance et al. [27]. Infrared measurements of the band () near 17 m (580 cm-1) are from Johns et al. [28] and data for the and bands are taken from Daumont et al. [29]. A small number of additional lines have been added that were absent from the Toth [25] line list. In total, the HITRAN2016 14N216O line list constitutes 33,074 lines and covers the cm-1 range.
2.1.2 The NOSD-1000
The Nitrous Oxide Spectroscopic Databank at 1000 K (NOSD-1000) includes only 14N216O [24]. The purpose of NOSD-1000 is to have a line list capable of simulating the spectrum of 14N216O at high-resolution, and at high temperatures. The production of the NOSD-1000 has been performed in a similar way to previous work on CO2 [30] (which was incorporated into HITEMP2010 [23]). NOSD-1000 has been calculated using an effective Hamiltonian and respective effective dipole moment operator. Their parameters have been fit to observed line positions and intensities. The line widths have been calculated using a semi-empirical approach. The NOSD-1000 line list is available to download from the Institute of Atmospheric Optics222ftp://ftp.iao.ru/pub/LTS/NOSD-1000 and contains more than 1.4 million transitions covering the cm-1 spectral region, with an intensity cutoff at cm/molecule applied at 1000 K.
2.2 Comparisons of NOSD-1000 and recalculation
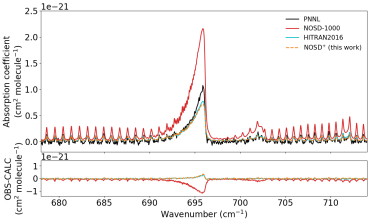
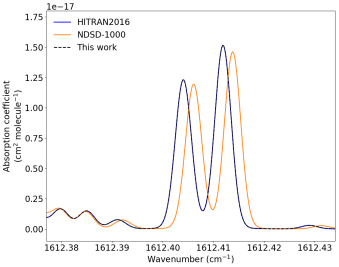
Broadband comparisons between absorption cross-sections calculated using NOSD-1000, HITRAN2016, and Pacific Northwest National Laboratory (PNNL) [31] line lists at 25∘C and cm-1 showed mostly excellent agreement. However, in the spectral region containing the (perpendicular ) band, a large intensity discrepancy between NOSD-1000 and both HITRAN2016 and PNNL was observed (as shown in Fig. 1). Furthermore, it was apparent that using the NOSD-1000 line list to calculate the N2O spectra at lower temperatures would result in missing features, a consequence of the intensity cutoff applied at 1000 K.
The intensity error associated with the spectral region was improved for this work by correcting the effective dipole moment used to calculate intensities. This prompted a full re-calculation of the line list, to produce NOSD-1000b along with NOSD-500b and NOSD-296b (calculated at 1000 K, 500 K and 296 K, respectively). The NOSD-1000b line list contained a lower intensity cutoff, and was adjusted for each temperature. These corrected line lists are summarized in Table. 1. It should be noted that the lowering of the intensity cutoffs for these line lists improves the completeness at high temperatures. However, many interpolyad resonance interactions, which become more frequent for highly-excited states, have not been accounted for. As a result, these perturbed bands may display considerable shifts in line positions and, consequently, the line intensity between perturbed bands will be redistributed. These effects should not be observable for low resolution comparisons, but may be seen at high resolution.
| Line list | Temperature | Intensity cutoff | Number |
|---|---|---|---|
| (K) | (cm/molecule) | of lines | |
| NOSD-1000 | 1000 | 1,405,069 | |
| NOSD-296b | 296 | 164,153 | |
| NOSD-500b | 500 | 786,511 | |
| NOSD-1000b | 1000 | 3,453,360 |
2.3 Combining line lists
The three NOSD line lists for 14N216O described in Sect. 2.2 have been converted into HITRAN format and all intensities have been scaled to 296 K (using Eq. 1). However, each individual list only remains applicable at the calculated temperature, since each intensity cutoff excluded strong lines at higher or lower temperatures. To provide an update for HITEMP, it was therefore necessary to combine these line lists into a merged version (NOSD+) that would be applicable over the full K temperature range.
In order to merge these line lists, all 164,153 transitions at 296 K (i.e., contained in NOSD-296b) are retained. The NOSD-500b line list is then compared to NOSD-296b and any lines which do not appear at 296 K (in this case, 622,774) are added to the merged list. Finally, NOSD-1000b is compared to the merged list, and any line which does not appear in this list (2,712,285) are included. This NOSD+ contains a total of 3,499,212 unique lines. It is worth noting that the NOSD-1000b line list did not contain 45,852 lines that are strong at lower temperatures. These lines typically include low rotational levels of fundamental vibrational bands and equates to almost 28% of the NOSD-296b line list.
Due to the change in the intensity cutoff between the three line lists, the new NOSD+ line lists remains complete for 14N216O between K for an intensity cm/molecule. Between 500 K and 1000 K the NOSD-1000+ is complete for an intensity cm/molecule, which will gradually scale toward cm/molecule at 500 K. An absorption cross section calculated using NOSD+ at 25∘C is also included in Fig. 1, showing the improvement over the previous NOSD-1000 list.
One aim of HITEMP is to remain consistent with HITRAN where appropriate. Since the data contained in HITRAN are considered to be the most accurate available, it was considered appropriate to retain these lines for the HITEMP update. Hence, lines that appear in HITRAN2016 replace the corresponding lines in NOSD+.
The infrared spectrum of N2O can be divided into a polyad spectral structure since cm-1 . For calculated line lists, it is well know that this causes a problem for assignments due to the heavy mixing of the three vibrational modes. Therefore, the HITRAN2016 lines have been matched to corresponding lines in NOSD+ for positions to within cm-1, intensities to within a factor of 2, and lower-state energies also to within cm-1.
The HITRAN quantum number format for N2O uses spectroscopic nomenclature (, , , , , symmetry). The generalized nomenclature used for the NOSD calculation, includes polyad number, symmetry, , and eigenvalue ranking number (i.e., , symmetry, , ). When converting to the spectroscopic nomenclature, it is necessary to retain for uniqueness, since the other parameters are retained, or can be calculated (e.g., , where , , and are the quantum numbers of the normal modes of vibration). Hence, has been added to the global quantum numbers provided for 14N216O. Five bands of 14N216O in HITRAN2016 did not include symmetry for some of the quantum number assignments (i.e, 0000-0000, 1000-1000, 0200-0200, 0110-0000, 0600-1000), but were provided in NOSD+. For internal consistency, line assignments from NOSD+ have been applied to all lines (included those added from HITRAN2016) to avoid accidental doubling of assignments.
Additional isotopologues contained in HITRAN2016 have also been added to NOSD+. One should keep in mind that the lack of bands for high temperature of these isotopologues are not sufficient for high-temperature applications, but are provided for consistency with HITRAN.
2.4 Comparisons at 800 K
A lack of high-temperature experimental observations of N2O makes it difficult to validate the NOSD+ line list at high temperatures. Tashkun et al. [24] provide a demonstration for the suitability of the NOSD-1000 line list for high temperatures, by comparing to a low-resolution measurement between 2025–2275 cm-1 (FWHM = 1.0 cm-1) at 873 K [33]. As expected, NOSD+ performs equally well since all lines that appear at 1000 K with cm/molecule have been included. To compare the accuracy of this line list, it is also necessary to have a comparison at high resolution.
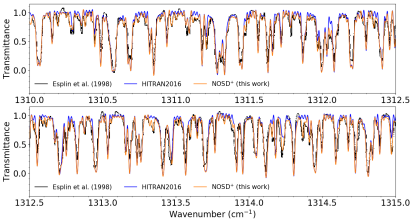
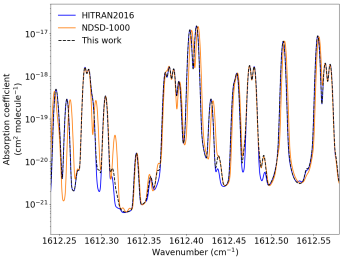
Esplin et al. [34] measured the spectrum of N2O between cm-1 at a temperature of 800 K and pressure of 4 Torr. The data of Esplin et al. [34] were unavailable as supplementary files, so a spectral overlay (with an estimated transmittance scale) had to be used for comparisons. A limited high-resolution comparison can be made between cm-1 in the vicinity of the fundamental. Figure 2 displays a comparison between the measurement overlay and transmission spectra calculated using the HITRAN2016 and NOSD+ line lists. An excellent agreement is observed for NOSD+, with an improvement over HITRAN2016 throughout the spectral region (although HITRAN2016 performs well in this limited comparison). These improvements are due to a general increase in the ‘baseline’ of the calculated NOSD+ spectrum (a consequence of the significant increase in hot band transitions), as well as the inclusion of missing spectral features (e.g., at 1313.35 cm-1), which are not included in HITRAN2016.
2.5 Overview of the NOSD+ line list added to the HITEMP database
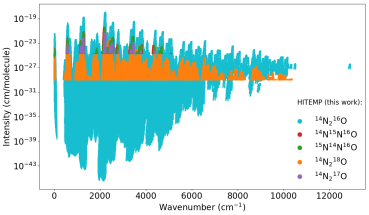
N2O was not previously included as part of HITEMP2010. The NOSD+ line list, produced for this work, provides the most complete N2O line list currently available and has therefore been used to update HITEMP. The NOSD+ line list is summarized in Table 2 and a full spectral overview is shown in Fig. 3.
| Isotopologue | 14N216O | 14N15N16O | 15N14N16O | 14N218O | 14N217O |
|---|---|---|---|---|---|
| Isotopologue line count | 3,499,212 | 4,222 | 4,592 | 116,694 | 1,705 |
| Natural abundance | 0.990333 | 0.003641 | 0.003641 | 0.001986 | 0.000369 |
| (cm-1) | 0.838 | 5.028 | 4.858 | 0.791 | 550.956 |
| (cm-1) | 12,899.137 | 5075.714 | 4703.049 | 10,363.675 | 4426.259 |
| (cm/molecule) | 3.750 | 5.220 | 4.720 | 1.000 | 2.016 |
| (cm/molecule) | 1.004 | 3.423 | 3.512 | 1.931 | 4.016 |
3 Nitric Oxide (molecule 8)
3.1 Description of NO line lists
There have been six line lists of NO that have been considered for inclusion to the HITEMP database. These line lists are briefly described below.
3.1.1 NO in HITRAN2016
The NO line parameters in HITRAN2016 [18] include data for three isotopologues, specifically 14N16O, 15N16O and 14N18O, with natural abundances of 0.993974, 0.003654 and 0.001993, respectively.
The 14N16O data constitute 103,701 lines of the X –X electronic transition including all and components. The maximum vibrational level is with a maximum and between cm-1. -doubling is included for bands , , , , and , with hyperfine splitting included where available. The majority of these data were provided by Goldman et al. [35] and described in Rothman et al. [36]. Some small corrections were made during the production of HITRAN2008 [37], with the inclusion of 948 magnetic dipole transitions included for the band. Recent analysis by Sulakshina and Borkov [38] observed small systematic shifts for unresolved -doublets of sub-bands, corresponding to the additions from Goldman et al. [35].
The inclusion of the isotopologue data for NO is described in detail by Gordon et al. [18]. For the 15N16O and 14N18O isotopologues, there are 699 and 679 lines of the fundamental band of X X , respectively.
3.1.2 NO in HITEMP2010
The line parameters of the 115,610 lines of NO contained in HITEMP2010 [23] include the three isotopologues also in HITRAN2016, and have remained unchanged since that publication. They primarily include data from Goldman et al. [35] with , and . An intensity threshold was not applied, meaning some intensities are cm/molecule. HITRAN2016 updates for NO have not been applied to HITEMP2010, meaning there are small inconsistencies when compared to HITRAN2016. Consequently, the HITEMP2010 line list has not been used as part of this update.
3.1.3 NO in the CDMS
Recent FarIR/microwave data from the Cologne Database for Molecular Spectroscopy, CDMS [39], have been made available by Müller et al. [40]. These data contain five isotopologues of NO, including 14N16O, 14N18O and 15N16O (along with 14N17O and 15N18O that were not used as part of this update). A fit for all isotopolgues was performed using SPFIT [41], and included hyperfine splitting. For each isotopologue, the pure rotational transitions have been determined using SPCAT [41]. For 14N16O, the band was also included.
The data for the and bands of 14N16O are available to download333https://cdms.astro.uni-koeln.de/classic/entries/ as two files (c030517.cat and c030518.cat) and contain 2955 and 1626 lines respectively, with . These files have been converted from the standard CDMS format into that of HITRAN. The electric dipole selection rules (Q-branch: , ; P-/R-branches: , ) are used to identify and assign magnetic dipole transitions, since these selection rules are reversed. The line strengths have been adjusted for isotopic abundance (therefore multiplied by 0.993974) and differences between database reference temperatures ( K, K) have been accounted for (see Appendix of Ref. [37]). The total internal partition sums, TIPS2017 [42], have been used to scale temperatures. The conversion from CDMS to HITRAN format is different for each and depends on , such that for the CDMS quantum number code 0 refers to and the CDMS quantum number code 1 refers to . For , this conversion is reversed. Magnetic dipole transitions are labelled with in the HITRAN notation, and these lines are included alongside electric dipole transitions (-, -, -branches), quadrupole transitions (-, -branches), and octupole transitions (-, -branches).
Wavenumber and intensity uncertainty codes for the CDMS line list are described in A.
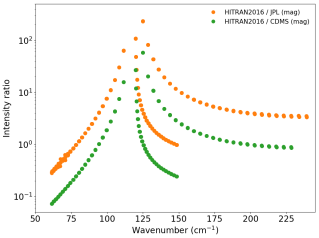
Magnetic dipole transitions in CDMS for the component of the band of 14N16O have been compared to HITRAN2016 magnetic dipole transitions provided by Goldman et al. [35]. These magnetic dipole transitions, in the cm-1 range, are stronger than the “forbidden” electric dipole transitions for the same band. CDMS and HITRAN2016 show similar agreement when compared to experimental measurements of the -branch (near 124 cm-1) [43]. However, significant disagreement of almost two orders of magnitude can be seen for other transitions of this band (Fig. 4). This disagreement is likely due to the alternative approaches used to the calculate the magnetic transition dipole moment. The values from Goldman et al. [35] have previously been used in atmospheric retrievals and it was decided to retain these values for this work. Hence, no magnetic dipole transitions from the CDMS database have been included as part of this update. These comparisons do highlight a need for additional work to validate these data.
The same method was used to convert the 15N16O and 14N18O isotopologues from CDMS to HITRAN format. There are 1626 lines of 15N16O (file c031512.cat) and 3027 lines of 14N18O (file c032513.cat). The magnetic dipole transitions have also been excluded from these lists.
3.1.4 NO in the JPL catalogue
In addition to the CDMS data, an extended line list for 14N16O is available to download444https://spec.jpl.nasa.gov/ftp/pub/catalog/catdir.html through the Jet Propulsion Laboratory (JPL) Molecular Spectroscopy Catalog [44]. This line list (file c030008.cat) contains 9765 lines and is calculated using the same programs as the CDMS line lists (i.e., SPFIT/SPCAT), but with alternative fitting coefficients and a [45].
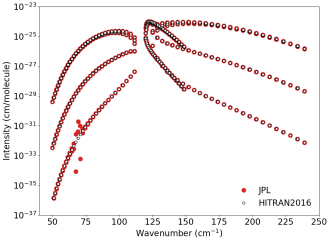
The JPL data set was converted into the HITRAN format following the same procedure as described for the CDMS data (also using TIPS2017).Magnetic dipole transitions from the JPL line list were also excluded, as they were seen to exhibit a greater disagreement than the CDMS line list when compared to HITRAN2016 values (Fig. 4). A comparison of the band (, ) to HITRAN2016 indicates large intensity discontinuities near 70 cm-1, as shown in Fig. 5. These discrepancies occur for the -branch where . The JPL lines therefore do not improve on the current HITRAN2016 data and have been excluded from this update.
3.1.5 ExoMol: NOname
A comprehensive semi-empirical line list, NOname, has been published by Wong et al. [46] for six isotopologues of NO, as part of the ExoMol project [47]. These data were earmarked by Gordon et al. [18] to be included as part of the next HITRAN/HITEMP update. The line lists are calculated for six isotopologues: 14N16O, 15N16O, 14N18O, which are included in HITRAN2016, as well as 14N17O, 15N17O, 15N18O that have not been included in this update. Each line list is constructed using empirical energy levels (and line positions) and high-level ab initio intensities. The effective Hamilton is obtained from a fit to available experimental positions using SPCAT and SPFIT. Data from the CDMS line list [40] is also included. Secondly, a variational model is built by fitting to the experimentally obtained energy levels and positions using the Duo program for diatomic molecules [48]. This enables the NOname line list to be extended to include higher vibration bands and rotational levels. The wavenumber coverage is 0–40,040 cm-1, with and (with ), and the associated partition function () is applicable up to 5000 K. The full NOname line list is constructed by stitching together lines from both methods at and (for 14N16O). Hence, line positions and intensities for and are taken from Duo.
The data for each isoptopologue are divided into the standard ‘states’ and ‘trans’ ExoMol files555http://exomol.com/data/molecules/NO/14N-16O/NOname/, which separates the state assignments from the individual transitions. Each transition has been converted into the HITRAN format (i.e., at reference temperature 296 K) with the appropriate transition information included [18]. The intensities have been adjusted for natural abundance and the partition function from TIPS2017 [42] has been used to remain consistent with current HITRAN2016 data (and the line lists described above). Wavenumber and intensity uncertainty codes are described in A.
The 15N16O and 14N18O isotopologues show a slight intensity decrease when compared to HITRAN2016. However, Heinrich et al. [5] have observed that HITRAN2016 intensities of 15N16O appear to be overestimated when monitoring the isotopic ratios of NO in human breath. Combined with the good overall agreement observed for 14N16O, the 15N16O and 14N18O NOname line lists improve on the HITRAN2016 values and have also been included as part of this update.
3.2 Comparisons of the NOname line list
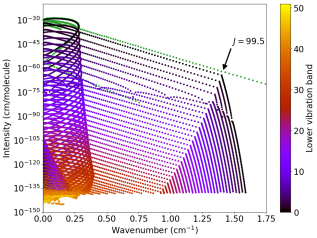
The stitching point used in NOname leads to an unexpected line position error for lines with as shown in Fig. 6. The line position errors are most noticeable for the -branch with of the bands and arise from the change in energy levels from the ones calculated with SPFIT/SPCAT to those calculated with Duo. Both methods have their disadvantages when extrapolating far beyond experimental observations. However, Duo energy levels are steadily declining from the real values even within the the range probed by experiments. This especially concerns -doubled splitting which is not correctly modeled by Duo even at low ’s. Here the differences lead to a discontinuity at for all vibrational bands. This effect is seen for all bands throughout the NOname line list. As a consequence of this discontinuity, all lines with and have been excluded from this 14N16O update. For the 15N16O and 14N18O isotopologues, the Duo stitching point occurs at a lower vibrational level; therefore transitions for these isotopologues with have been excluded.
For , the -, - and -branches of the components show good agreement when compared to HITRAN2016. However, the -branches with of the band display significant intensity differences when compared to values in HITRAN2016 (up to 3 orders of magnitude) and have also been excluded from this update. Indeed, this difference can be seen in Fig. 6, where values from HITRAN2016 are seen to be significantly stronger then the corresponding values in NOname. These transitions are between the -doubling components and the intensities calculated with Duo are not reliable here due to the aforementioned problem with modelling of the energy splitting associated with this doubling. Interestingly this effect does not influence intensities in other bands as the -doubling splitting is much smaller than separation between rotational and especially rovibrational levels.
The MARVEL approach [49, 50] used to obtain empirical energy levels in the calculation of NOname is similar to the RITZ method [30] used by Sulakshina and Borkov [38]. Their comparisons between energy levels for resolved -doublets of 14N16O coincide within the experimental uncertainty below .
An additional filter was applied because of numerical artifacts (e.g., noise) observed in the variational transition dipole moments for (see Fig. 4 of Ref. [46]). The nature of these artifacts, and their impact on the calculated intensities of diatomic molecules, has previously been described in detail by Medvedev et al. [51, 52]. These data filters were also applied to the 15N16O and 14N18O line lists of NOname.
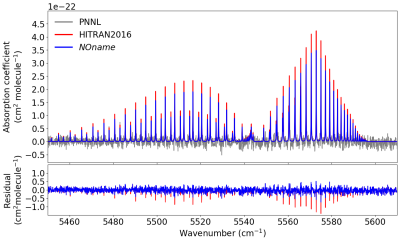
Furthermore, the NOname line intensities have been compared to experimental observations of overtone bands. Lee et al. [53] measured line intensities for the , , , , and bands, and Bood et al. [54] measured the band. For the band, the NOname intensities agreed well with experiment [53], but were approximately 15% weaker than HITRAN2016 (Fig. 7). Diode-laser absorption measurements [55, 56] were able to verify the NOname line intensities for the band. A further comparison has been performed against experimental cross-sections from PNNL [31], and is shown in Fig. 8. An absorption cross section calculated using HITRAN2016 displays a larger residual than the corresponding cross sections calculated using NOname.


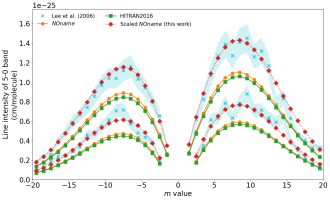
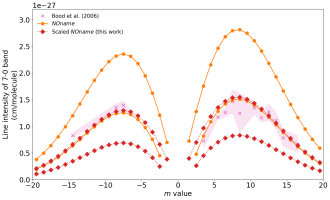
Excellent agreement was observed for the majority of vibrational bands. However some differences have been observed: these are shown in Fig. 9. For the band, the NOname intensities are too weak when compared to both HITRAN2016 and experiment [53]. For the band, the NOname line intensities show good agreement with HITRAN2016, but differ from experimental values [53]. For the band, the difference between the NOname line intensities and Bood et al. [54] is approximately a factor of two. Hence, a scale factor of 1.35, 1.30 and 0.55 has been applied to all , and bands, respectively. The scaled NOname intensities are also included in Fig. 9 for comparison.
3.2.1 HSPM2018
For atmospheric applications, it is important to include high rotational levels for NLTE observations. However Section 3.2 describes the removal of these lines from NOname. Therefore, for this work the SPCAT/SPFIT calculation used as part of Wong et al. [46] for 14N16O has been extended to produce the HSPM2018 line list. This line list extends to for and for , with . Hyperfine splitting has been ignored. The associated NOname line intensities have been combined with these line positions to retain consistency. See A for details regarding uncertainty codes.
3.3 Combining line lists of NO
This work describes the construction of a suitable NO line list to update HITEMP. The vast majority of lines are included from NOname, with a hierarchical merging of additional line lists outlined below.
The reduced 14N16O NOname line list (described in Sect. 3.2) was taken as the starting point. It extends up to cm-1, with , and . Some of these bands have had their intensity scaled (, and ). One should also note that only a small fraction of the band from the NOname line list has been taken, for the reasons explained earlier.
For the and bands, line positions and intensities from the CDMS line list (see Sect. 3.1.3) have replaced any corresponding lines in NOname. Lines from HITRAN2016 that make up the , , , , and bands have also replaced any corresponding lines in NOname, providing they were not included in the CDMS line list (or from Goldman et al. [35]). These bands retain their hyperfine splittings, and magnetic dipole transitions from HITRAN2016 for the band have also been included.
For bands with and , lines from the HSPM2018 line list have been used to replace the lines from NOname that were excluded because of the Duo stitching point. This includes and for , and and for . For bands with to , the line positions from Goldman et al. [35] (and also in HITRAN2016) with have also been used to replace the excluded lines from NOname.
It should be noted that for -branches of the and components of the and bands, the CDMS line strengths differ by almost 20% when compared to HITRAN2016 values. It is difficult to assess the validity of these intensity differences because the methods used for calculation are very different, and no experimental measurements exist to access intensities where the largest differences are observed. A slight intensity discontinuity will therefore be seen in the line list produced for this work.
For the 15N16O and 14N18O isotopologues, only lines contained in the CDMS line lists have been used to replace those from NOname. The combined line lists containing all three isotopologues are shown in Fig. 10.
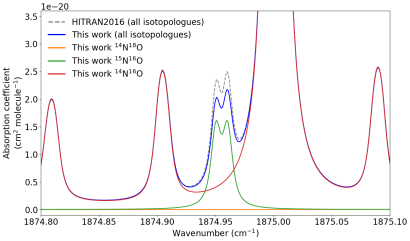
Heinrich et al. [5] have previously reported that the intensities of 15N16O were overestimated in HITRAN. Their method uses a carbon monoxide laser to spectroscopically analyze human breath for isotopic ratios of NO near 1875 cm-1 when monitoring a variety of health conditions. Fig. 11 shows the spectral region used by Heinrich et al. [5] to measure the abundance of 15N16O. The line list produced for this work shows a reduction in intensity for the 15N16O lines by approximately 16% (when compared to HITRAN2016). This supports the conclusion of Heinrich et al. [5], and would correct their retrieved abundances to within experimental uncertainty.
3.4 Reanalysis of HITRAN2016 broadening and shift parameters for NO
HITRAN2016 contains inconsistent broadening parameters for NO caused by intermediate updates. This work provides an opportunity to reanalyze the available line broadening and pressure shift parameters to create a consistent line list.
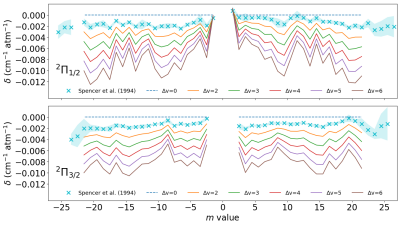
3.4.1 Pressure shifts for NO
Measurements of the pressure shifts were obtained from Spencer et al. [57] for the fundamental vibration band. Calculating pressure shifts for additional vibration bands () has been described by Hartmann and Boulet [58] using
| (2) |
where refers to the reference band measurements, and for -branch and for -branch transitions. In this case, which simplifies Eq. 2 to
| (3) |
where the symmetric and asymmetric components are given by
| (4) |
| (5) |
This method has previously been used for CO pressure shifts in HITRAN2016 [59].
3.4.2 Broadening parameters for NO
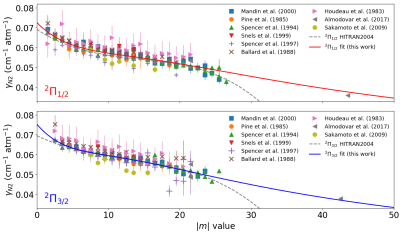
The air-broadening (Lorentz half width) for NO has been determined by refitting the available data for N2- and O2-broadening. Fig. 13 includes the data that were used to obtain the N2-broadening parameters. These data encompass the fundamental band [57, 60, 61, 62, 63], and the [64, 65], [66] and [67] overtones. The measurements of Almodovar et al. [63] were taken at high temperature (1000 K), which they estimate gives an 10% error (when comparing to measurements at 296 K) due to the breakdown of the single power law for large temperature ranges. For this reason, the values from Almodovar et al. [63] have been increased by 10%. Considering the available data and associated uncertainties, there was no justification for a vibrational dependence to the N2-broadening, and all vibrational bands have been included in a least squares weighted fit. A new Padé approximation functional form,
| (6) |
has been used to provide improved performance for high- transitions. A separate fit has been used for and 3/2 components and the coefficients for N2-broadening are given in Table 3.
| Broadener | |||||||
|---|---|---|---|---|---|---|---|
| N2 | 1/2 | 6.926 | 3.312 | 9.551 | 4.751 | 2.244 | 1.362 |
| N2 | 3/2 | 1.159 | 9.463 | 1.540 | 8.590 | 7.366 | 3.999 |
| O2 | 1/2 | 5.156 | 2.204 | 7.739 | 5.651 | 1.113 | 1.174 |
| O2 | 3/2 | 1.018 | 6.262 | 1.515 | 9.218 | 5.476 | 2.893 |
| Self | 1/2 | 2.935 | 1.486 | 3.561 | 3.017 | 2.049 | 1.745 |
| Self | 3/2 | 7.619 | 8.825 | 95.45 | 6.114 | 6.421 | 3.056 |
The O2-broadening data include the fundamental band [68] and overtone [69] (Fig. 14). Chackerian et al. [68] have previously observed an approximate 17% difference between O2- and N2-broadening. Therefore, to improve the fitting performance for large , the N2-broadening measurements from Almodovar et al. [63] have been scaled by 17% and included in the fit. The same functional form has been used (Eq. 6) and the fitting coefficients for O2-broadening are provided in Table 3.
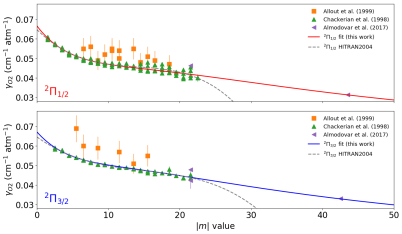
Instead of separate N2- and O2-broadening parameters, HITRAN and HITEMP provide air-broadening for all line-by-line molecules as standard. Hence, the values for O2- and N2-broadening are combined, such that
| (7) |
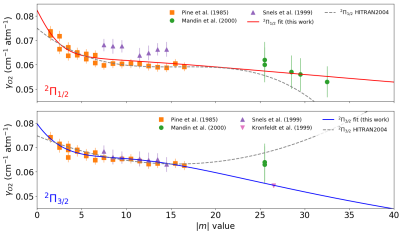
Self-broadening for NO has also been revisited. The primary source of self-broadening data comes from the overtone measured by Pine et al. [64], which formed the basis of NO self-broadening in HITRAN2004 [36]. These measurements have been combined with additional data for the overtone [65] as well as data for the overtone [66]. A single value for the -doublet of the fundamental has also been included from Kronfeldt et al. [70]. The self-broadening data from Ballard et al. [61] for the fundamental has been omitted from the fit due to large disagreement with the accepted values of Pine et al. [64]. Indeed, Goldman et al. [35] previously favored the Pine et al. [64] measurements over the Ballard et al. [61] measurements as they provided improved consistency with the results of Spencer et al. [62], also used in this work. Again, Eq. 6 has been used perform a least squares weighted fit of the available data (Fig. 15), and the fitting coefficients are provided in Table 3.
3.5 Overview of the updated NO line list for HITRAN and HITEMP
The NO line list described in this work has been used to update the HITEMP database.
Due to the reanalysis of the broadening and pressure shift parameters, the HITRAN database has also been updated. An intensity threshold has been used to limit the number of lines included in the HITRAN update. For any line with at , 296, 500, 1000 and 2000 K (where cm/molecule), the transition is retained in the HITRAN list. The purpose of this threshold is to keep the NO list complete at the higher temperatures observed in NLTE observations. An additional threshold of cm/molecule has been used to avoid a three-digit exponent in the HITRAN “.par” format. These thresholds have not been applied to the HITEMP update.
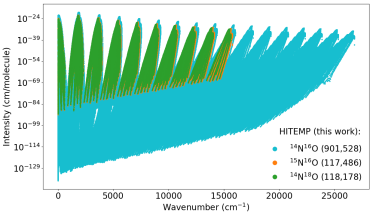
A summary of the updated HITRAN and HITEMP line lists for NO is given in Table 4. An overview of the complete HITEMP line list can be seen in Fig. 10.
| HITEMP (this work) | HITEMP2010 | HITRAN (this work) | HITRAN2016 | |
| Total line count | 1,137,192 | 115,610 | 384,305 | 105,079 |
| 14N16O line count | 901,528 | 114,232 | 251,898 | 103,701 |
| 15N16O line count | 114,486 | 699 | 67,370 | 699 |
| 14N18O line count | 118,178 | 679 | 65,037 | 679 |
| 184.5 | 125.5 | 156.5 | 125.5 | |
| 29 | 14 | 26 | 14 | |
| 16 | 5 | 14 | 5 | |
| (cm-1) | 1.00 | 1.00 | 1.00 | 1.00 |
| (cm-1) | 26,777 | 9,273 | 23,727 | 9,273 |
| (cm/molecule) | 1.72 | 2.18 | 1.00 | 1.45 |
| (cm/molecule) | 2.32 | 2.32 | 2.32 | 2.32 |
4 Nitrogen Dioxide (molecule 10)
4.1 Description of NO2 line lists
NO2 was not included as part of HITEMP2010 [23]. A new line list of NO2 has been completed for this work using current line parameters contained in HITRAN2016 [18] and the recent NDSD-1000 [71] line list. These line lists are briefly described below.
4.1.1 NO2 in HITRAN2016
The NO2 line parameters in HITRAN2016 include data for the principal isotopologue (14N16O2) with a natural abundance of 0.991616. This constitutes 104,223 lines in the region 0 – 3075.0 cm-1 with intensities cm/molecule (see Perrin et al. [72] for a detailed description). The data encompass three infrared regions dominated by the , and bands (13.3, 6.2 and 3.4 m, respectively), in addition to pure rotational transitions. All regions contain spin-rotation interactions (), but pure rotation and fundamental transitions also include additional hyperfine structure.
4.1.2 The NDSD-1000
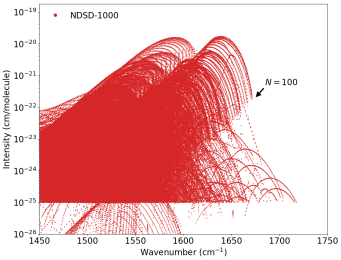
The Nitrous Dioxide Spectroscopic Databank at 1000 K (NDSD-1000) contains data of the principal isotopologue of NO2 in the region 466 – 4476 cm-1, and is intended for simulating spectra of NO2 up to a temperature of 1000 K [71]. The databank has been constructed from a global model of line intensities and positions, through the application of an effective Hamiltonian and dipole operator approach, with the inclusion of spin-rotation interaction (). This method produces line positions with a root mean square residual of 0.015 cm-1 when compared to observations, which can be as low as 0.001 cm-1 for fundamental bands. In addition, the databank also provides broadening coefficients and temperature-dependent exponents at 296 and 1000 K. NDSD-1000 is available as five separate files666ftp://ftp.iao.ru/pub/NDSD/ separated by polyad bands for , 2, 3, 4 and 6 (where , and , , and are the quantum numbers of the normal modes of vibration), with a total of 1,051,689 lines.
During the construction of the databank, only transitions with an intensity cm/molecule at 296 or 1000 K have been included. In addition, restrictions were also applied to the maximum rotation levels ( and ). This is because of a poor convergence of the polynomial expansion for both effective operators (Hamiltonian and electric dipole) due to the limited coverage of the input data ( and ) [71]. This was to retain accuracy for high resolution applications; however these excluded lines would be suitable for low resolution comparisons. Where possible, lower-state energy levels have been taken from HITRAN2016 for accuracy. It should be noted that the restrictions applied to the maximum rotation levels will limit the completeness at higher temperature regimes. For example, Fig. 16 shows how the population of these higher rotation levels becomes relatively strong at 1000 K for region.
A recent article by Perrin et al. [73] highlighted issues with the intensities of the original NDSD-1000 line list. Intensities between the and electron spin rotation components were shown to be inconsistent with high-resolution experimental measurements and previous literature values (including HITRAN2016). Consequently, the line intensities were recalculated [74], and Fig. 17 shows the improvement for intensity when compared to HITRAN2016. The recalculated intensities from Lukashevskaya et al. [74] are used for the update described in this work.
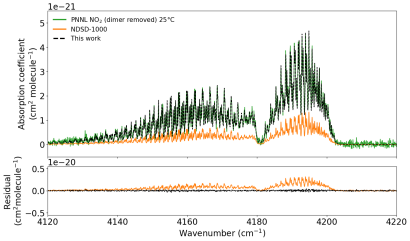
Lukashevskaya et al. [71] compared PNNL absorption cross sections [31] of NO2 to those based on the NDSD-1000 line list for the spectral regions containing , 2 and 4 polyad bands. Fig. 18 shows a similar comparison for the band (part of ) where there are no data included in HITRAN2016. It was apparent that the NDSD-1000 line list was approximately 3.5 times weaker than the PNNL observations for the region. Hence, all lines from NDSD-1000 have been scaled by a factor or 3.5 for this work.
It should be noted that integrated line intensities for the band () provided by Stephen et al. [75] is in excellent agreement with NDSD-1000 (before the scale factor is applied). This is because the NDSD-1000 line intensities are based on the measurements of Stephen et al. [75]. Excellent agreement is also seen between integrated line intensities of bands in the region. However, only a scale factor was necessary for bands. The relative band intensities of the PNNL cross sections are reliable because the cm-1 spectral region is recorded as a single measurement. This led us to the conclusion to give preference to the PNNL data.
4.2 Combining line lists of NO2
Perrin et al. [73] demonstrated that the line intensities and positions of HITRAN2016 were excellent at reproducing high-resolution Fourier transform spectral measurements of line intensities. Similar accuracy has also previously been demonstrated for the other data included in HITRAN2016 [76, 77, 78, 72]. While the line intensities of the NDSD-1000 line list have been corrected, the positions and intensities of HITRAN2016 are generally superior. HITRAN2016 also includes hyperfine structure. For these reasons, the NDSD-1000 line list has been used to supplement the HITRAN2016 data when producing the NO2 line list for this work.
The five polyad regions of the NDSD-1000 line lists have been combined and converted into the standard HITRAN format [18]. The line parameters for HITRAN and HITEMP are provided at a reference temperature of 296 K. Therefore the intensities, air- and self-broadening, and temperature exponents calculated at 296 K have been retained from the NDSD-1000 line list.
All transitions from NDSD-1000 that are not included in HITRAN have been combined with the HITRAN2016 line list to create an NO2 line list for this work. This line list includes numerous hot and combination bands that were not part of HITRAN2016, with an increased spectral coverage from 0 – 4476 cm-1.
Intensity comparisons between lines lists show good agreement. However for some small regions with large and (e.g., for the band), the intensities of NDSD-1000 begin to diverge from HITRAN2016. This is a consequence of the differing methods for the treatment of intensities. In the case of HITRAN, the effective Hamiltonians have been treated for a single or group of interacting vibrational states, as opposed to the global approach used for NDSD-1000. This will lead to slight intensity discontinuities at the merging points in the line list of this work. However, since cm/molecule for HITRAN2016, these discontinuities occur at weak regions of the NO2 spectrum.
Recently, Vasilenko et al. [79] reported on comparisons between NDSD-1000 and HITRAN2016 line lists and their potential influence on remote sensing applications. They have observed that the spectral parameters in two databases are different, however, it was erroneously concluded that HITRAN2016 was incorrect. In reality for the lines that are sufficiently strong in the range of temperatures encountered in the terrestrial atmospheres, the line intensities and positions in HITRAN2016 are superior to those from NDSD-1000 (as outlined above). With that being said some weak lines and bands are indeed missing in HITRAN2016 and it makes sense to include them here.
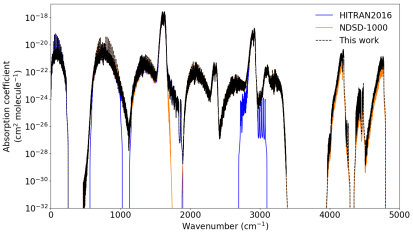
One benefit of including all HITRAN2016 NO2 lines into this work is that comparisons will agree with previous work. Fig. 17 contains a small spectral region highlighted by Perrin et al. [73] to demonstrate the differing intensities of HITRAN2016 and NDSD-1000. Here the NDSD-1000 intensities are shown to have been improved; however the wavenumber shifts remain. It can be seen that this work matches HITRAN2016 almost exactly. A logarithmic scale has also been used to indicate where this work and HITRAN2016 differ. Furthermore, Fig. 18 also includes a cross section calculated using this work, where a clear improvement over NDSD-1000 is seen when compared to PNNL. The full spectral range is shown in Fig. 19, and this work is seen to provide the most compete data set for the spectral region up to 4476 cm-1.
4.2.1 Recalculation of pressure shifts for NO2 and updates to HITRAN
Pressure-induced line shifts for air () have also been included for this work. The pressure shifts from HITRAN2016 are based on multi-spectrum measurements of the fundamental band by Benner et al. [80]. These shifts depend on (where for - and -branches and for -branches) and have been fit to dependent quadratic functions (up to ).
To expand these pressure-shift functions (, where 001 refers to ) to other vibrational bands, a scaling factor has been applied as was done for HITRAN2004 [36]. This factor is based on the ratio of approximate band centers such that the new pressure-induced shift,
| (8) |
where refers to the band center of each fundamental band (, , and cm-1) and is the change in quanta for each vibrational band between upper and lower states. For transitions with , the values of have been used, and has been limited to the maximum measured values of Benner et al. [80] for each .
While calculating the pressure shifts for the this work, it became apparent that the pressure shifts in HITRAN2016 for NO2 contained a number of errors. For consistency, Eq. 8 has been used to recalculate the pressure shifts of lines that were included from HITRAN2016. Furthermore, HITRAN2016 contains no or 6 lines. These bands are observed in comparisons with PNNL spectra (e.g., Fig. 18), and therefore the and lines (with scaled intensities described above) have been used to update HITRAN for lines with cm/molecule. The updated NO2 HITRAN line list now contains 125,193 lines, an increase of 20,970 lines when compared to HITRAN2016.
4.3 Overview of the NO2 line list for HITEMP
A summary of the NO2 line list produced for this work and used to update HITEMP is given in Table 5, alongside a summary of HITRAN2016 and the additional HITRAN update based on this work. A full cross section overview of the this work is shown in Fig. 19.
| HITEMP (this work) | HITRAN (this work) | HITRAN2016 | |
|---|---|---|---|
| Total line count | 1,108,709 | 125,193 | 104,223 |
| Vibrational band count | 261 | 31 | 11 |
| (cm-1) | 0.498 | 0.498 | 0.498 |
| (cm-1) | 4775.320 | 4775.320 | 3074.153 |
| (cm/molecule) | 2.29 | 4.24 | 4.24 |
| (cm/molecule) | 1.30 | 1.30 | 1.30 |
5 Conclusions
High-temperature line lists of NOx (i.e., NO and NO2) and N2O have been compiled, which (along with the CO line list from [59]) marks the first updates to the HITEMP database since Rothman et al. [23]. In addition to these high-temperature line lists, updates to the HITRAN database for NO and NO2 have also been performed. In the case of NO the spectral range in HITRAN is being extended, while intensities of some of the bands have been improved, as well as the intensity ratios between isotopologues. In the case of NO2 new bands have been added extending into NIR. The HITRAN updates are already available through the HITRAN website (https://hitran.org). This work also demonstrates the necessary validation steps that are required before data are included as part of the HITRAN and HITEMP databases. We anticipate numerous uses for the line lists presented here, including combustion monitoring, terrestrial atmospheric observations, breath analyses, and astrophysics applications.
It is well understood that using HITRAN data for applications outside of the appropriate temperature and wavenumber ranges can lead to issues of incompleteness. HITEMP data are no different. The appropriate temperature ranges for each molecule in HITEMP depends on the underlying data used to populate each line list. The HITRAN and HITEMP data can both be used at 296 K; however we stress that for elevated temperatures, only HITEMP should be used. For N2O and NO2, the majority of lines have been provided by NOSD-1000 and NDSD-1000 line lists, respectively, which suggest a maximum applicable temperature of 1000 K. In practice, the maximum applicable temperature (for completeness) may be below this value, particularly for NO2, due to restrictions on maximum rotational levels (and missing polyad bands). We therefore advise caution when using the HITEMP N2O and NO2 data at temperatures approaching this temperature limit. For NO, Wong et al. [46] suggest a maximum applicable temperature of 5000 K (for the NOname line list). In forming the HITEMP line list for NO for this work, data have been excluded because of doubts regarding accuracy for high rotational levels and vibrational bands. It is therefore expected that the maximum temperature range is also reduced. While it is difficult to place a value for the maximum applicable temperature for this work (due to merging and data restrictions), we advise caution when using this line list for temperatures beyond 4000 K. If the complete versions of each line lists are required, we refer the reader to the reference sources.
In addition to line intensities, the broadening, temperature exponents and pressure shift parameters also depend on temperature. For HITEMP (and HITRAN), these parameters are provided at the reference temperature of 296 K. However, the uncertainties for these parameters will increase as the temperature increases. Adding numerous parameters at specific temperature ranges is not practical for the HITEMP database, but new formalisms have been proposed [81] that will be considered for future editions of HITEMP. If additional parameters are required (that were not included in this work), we again refer the reader to the reference sources.
The PNNL infrared absorption cross-section archive is an excellent source for room temperature comparisons. However the relative low spectral resolution (0.1 cm-1) is insufficient for high-resolution comparisons. One difficulty when validating line lists is a lack of high-resolution spectra available in the literature, particularly at high temperatures. The point has recently been emphasized by Fortney et al. [82] when considering the data requirements necessary for interpreting future exoplanet atmospheric observations.
This work expands the HITEMP database to include seven molecules. N2O and NO2 are new additions and they join H2O, CO2, CO and OH, with NO being updated. Recent advancements in theoretical and semi-empirical methods have increased the reliability of calculated line lists. Further improvements are therefore planned for HITEMP over the coming month/years, these include the addition of new molecules (CH4, SO2, NH3, HCN, C2H2, PH3, C2, CH, CN and H), additions adapted from HITRAN2016 (HF, HCl, HBr, HI and H2), as well as updates for H2O, CO2, CO and OH.
Access to both the HITRAN and HITEMP databases is freely available through the HITRAN website (https://hitran.org). The considerable size of the HITEMP line lists mean that these data are available to download as static files. In the near future a more flexible structure will be introduced. The HAPI libraries are undergoing significant updates, which enable a substantial speed improvement for calculations; thereby allowing HAPI to carry out line-by-line calculations on large HITEMP linelists. The HITRAN data are available via a more flexible SQL structure, and can be downloaded from the website or through the HAPI software (see Ref. [32] for more details).
6 Acknowledgements
We would like to acknowledge N. N. Lavrentieva and A. C. Dudaryonok for their work in the production of the NOSD-1000 and NDSD-1000 line lists, as well as A. Wong for work on the NOname line list. Update of the HITRAN and HITEMP databases was supported through the NASA Aura and PDART grants NNX17AI78G and NNX16AG51G, respectively.
7 References
References
- Logan [1983] J. A. Logan, Nitrogen oxides in the troposphere: Global and regional budgets, Journal of Geophysical Research 88 (1983) 10,785–10,807.
- Ravishankara et al. [2009] A. R. Ravishankara, J. S. Daniel, R. W. Portmann, Nitrous Oxide (N2O): The Dominant Ozone-Depleting Substance Emitted in the 21st Century, Science 326 (2009) 123.
- van der A et al. [2008] R. J. van der A, H. J. Eskes, K. F. Boersma, T. P. C. van Noije, M. van Roozendael, I. de Smedt, D. H. M. U. Peters, E. W. Meijer, Trends, seasonal variability and dominant NOx source derived from a ten year record of NO2 measured from space, Journal of Geophysical Research (Atmospheres) 113 (2008) D04302.
- Price et al. [1997] C. Price, J. Penner, M. Prather, NOx from lightning: 1. Global distribution based on lightning physics, Journal of Geophysical Research 102 (1997) 5929–5941.
- Heinrich et al. [2009] K. Heinrich, T. Fritsch, P. Hering, M. Mürtz, Infrared laser-spectroscopic analysis of 14NO and 14NO in human breath, Applied Physics B: Lasers and Optics 95 (2009) 281–286.
- Miller [2005] B. G. Miller, Coal Energy Systems, Sustainable World Series, Elsevier Academic Press, London, 2005.
- Barrett et al. [2015] S. R. H. Barrett, R. L. Speth, S. D. Eastham, I. C. Dedoussi, A. Ashok, R. Malina, D. W. Keith, Impact of the volkswagen emissions control defeat device on US public health, Environmental Research Letters 10 (2015) 114005.
- Spearrin et al. [2014] R. M. Spearrin, I. A. Schultz, J. B. Jeffries, R. K. Hanson, Laser absorption of nitric oxide for thermometry in high-enthalpy air, Measurement Science and Technology 25 (2014) 125103.
- Chao et al. [2011] X. Chao, J. B. Jeffries, R. K. Hanson, In situ absorption sensor for no in combustion gases with a 5.2μm quantum-cascade laser, Proceedings of the Combustion Institute 33 (2011) 725 – 733.
- Yamamoto et al. [2011] Y. Yamamoto, H. Sumizawa, H. Yamada, K. Tonokura, Real-time measurement of nitrogen dioxide in vehicle exhaust gas by mid-infrared cavity ring-down spectroscopy, Applied Physics B: Lasers and Optics 105 (2011) 923–931.
- Gerard [1975] J. C. Gerard, Satellite observations of the nitric oxide nightglow, Geophysical Research Letters 2 (1975) 179–182.
- Bertaux et al. [2005] J.-L. Bertaux, F. Leblanc, S. Perrier, E. Quemerais, O. Korablev, E. Dimarellis, A. Reberac, F. Forget, P. C. Simon, S. A. Stern, B. Sandel, Nightglow in the Upper Atmosphere of Mars and Implications for Atmospheric Transport, Science 307 (2005) 566–569.
- Garcia Munoz et al. [2009] A. Garcia Munoz, F. P. Mills, G. Piccioni, P. Drossart, From the Cover: The near-infrared nitric oxide nightglow in the upper atmosphere of Venus, Proceedings of the National Academy of Science 106 (2009) 985–988.
- Gardner et al. [2007] J. L. Gardner, B. Funke, M. G. Mlynczak, M. López- Puertas, F. J. Martin-Torres, J. M. Russell, S. M. Miller, R. D. Sharma, J. R. Winick, Comparison of nighttime nitric oxide 5.3 m emissions in the thermosphere measured by MIPAS and SABER, Journal of Geophysical Research (Space Physics) 112 (2007) A10301.
- Zakirov et al. [2001] V. Zakirov, M. Sweeting, T. Lawrence, J. Sellers, Nitrous oxide as a rocket propellant, Acta Astronautica 48 (2001) 353–362.
- Ardaseva et al. [2017] A. Ardaseva, P. B. Rimmer, I. Waldmann, M. Rocchetto, S. N. Yurchenko, C. Helling, J. Tennyson, Lightning chemistry on Earth-like exoplanets, Monthly Notices of the Royal Astronomical Society 470 (2017) 187–196.
- Schwieterman et al. [2018] E. W. Schwieterman, N. Y. Kiang, M. N. Parenteau, C. E. Harman, S. DasSarma, T. M. Fisher, G. N. Arney, H. E. Hartnett, C. T. Reinhard, S. L. Olson, V. S. Meadows, C. S. Cockell, S. I. Walker, J. L. Grenfell, S. Hegde, S. Rugheimer, R. Hu, T. W. Lyons, Exoplanet Biosignatures: A Review of Remotely Detectable Signs of Life, Astrobiology 18 (2018) 663–708.
- Gordon et al. [2017] I. E. Gordon, L. S. Rothman, C. Hill, R. V. Kochanov, Y. Tan, P. F. Bernath, M. Birk, V. Boudon, A. Campargue, K. V. Chance, B. J. Drouin, J. M. Flaud, R. R. Gamache, J. T. Hodges, D. Jacquemart, V. I. Perevalov, A. Perrin, K. P. Shine, M. A. H. Smith, J. Tennyson, G. C. Toon, H. Tran, V. G. Tyuterev, A. Barbe, A. G. Császár, V. M. Devi, T. Furtenbacher, J. J. Harrison, J. M. Hartmann, A. Jolly, T. J. Johnson, T. Karman, I. Kleiner, A. A. Kyuberis, J. Loos, O. M. Lyulin, S. T. Massie, S. N. Mikhailenko, N. Moazzen-Ahmadi, H. S. P. Müller, O. V. Naumenko, A. V. Nikitin, O. L. Polyansky, M. Rey, M. Rotger, S. W. Sharpe, K. Sung, E. Starikova, S. A. Tashkun, J. V. Auwera, G. Wagner, J. Wilzewski, P. Wcisło, S. Yu, E. J. Zak, The HITRAN2016 molecular spectroscopic database, Journal of Quantitative Spectroscopy and Radiative Transfer 203 (2017) 3–69.
- Wilzewski et al. [2016] J. S. Wilzewski, I. E. Gordon, R. V. Kochanov, C. Hill, L. S. Rothman, H2, He, and CO2 line-broadening coefficients, pressure shifts and temperature-dependence exponents for the HITRAN database. Part 1: SO2, NH3, HF, HCl, OCS and C2H2, Journal of Quantitative Spectroscopy and Radiative Transfer 168 (2016) 193–206.
- Rothman et al. [1995] L. S. Rothman, R. B. Wattson, R. Gamache, J. W. Schroeder, A. McCann, HITRAN HAWKS and HITEMP: high-temperature molecular database, in: J. C. Dainty (Ed.), Atmospheric Propagation and Remote Sensing IV, volume 2471 of Society of Photo-Optical Instrumentation Engineers (SPIE) Conference Series, 1995, pp. 105–111. doi:10.1117/12.211919.
- Barber et al. [2006] R. J. Barber, J. Tennyson, G. J. Harris, R. N. Tolchenov, A high-accuracy computed water line list, Monthly Notices of the Royal Astronomical Society 368 (2006) 1087–1094.
- Tinetti et al. [2007] G. Tinetti, A. Vidal-Madjar, M.-C. Liang, J.-P. Beaulieu, Y. Yung, S. Carey, R. J. Barber, J. Tennyson, I. Ribas, N. Allard, G. E. Ballester, D. K. Sing, F. Selsis, Water vapour in the atmosphere of a transiting extrasolar planet, Nature 448 (2007) 169–171.
- Rothman et al. [2010] L. S. Rothman, I. E. Gordon, R. J. Barber, H. Dothe, R. R. Gamache, A. Goldman, V. I. Perevalov, S. A. Tashkun, J. Tennyson, HITEMP, the high-temperature molecular spectroscopic database, Journal of Quantitative Spectroscopy and Radiative Transfer 111 (2010) 2139–2150.
- Tashkun et al. [2016] S. A. Tashkun, V. I. Perevalov, N. N. Lavrentieva, NOSD-1000, the high-temperature nitrous oxide spectroscopic databank, Journal of Quantitative Spectroscopy and Radiative Transfer 177 (2016) 43–48.
- Toth [2004] R. A. Toth, Linelist of N2O parameters from 500 to 7500 cm-1, JPL online, https://mark4sun.jpl.nasa.gov/n2o.html (2004).
- Rothman et al. [1987] L. S. Rothman, R. R. Gamache, A. Goldman, L. R. Brown, R. A. Toth, H. M. Pickett, R. L. Poynter, J. M. Flaud, C. Camy- Peyret, A. Barbe, N. Husson, C. P. Rinsland, M. A. H. Smith, The HITRAN database: 1986 edition, Applied Optics 26 (1987) 4058–4097.
- Chance et al. [1994] K. Chance, K. W. Jucks, D. G. Johnson, W. A. Traub, The Smithsonian Astrophysical Observatory database SAO92., Journal of Quantitative Spectroscopy and Radiative Transfer 52 (1994) 447–457.
- Johns et al. [1996] J. W. C. Johns, Z. Lu, M. Weber, J. M. Sirota, D. C. Reuter, Absolute Intensities in the 2Fundamental of N2O at 17 m, Journal of Molecular Spectroscopy 177 (1996) 203–210.
- Daumont et al. [2002] L. Daumont, C. Claveau, M. R. Debacker-Barilly, A. Hamdouni, L. Regalia-Jarlot, J. L. Teffo, S. Tashkun, V. I. Perevalov, Line intensities of 1̂4̂N”21̂6̂O: the 10 micrometers region revisited, Journal of Quantitative Spectroscopy and Radiative Transfer 72 (2002) 37–55.
- Tashkun et al. [2003] S. A. Tashkun, V. I. Perevalov, J. L. Teffo, A. D. Bykov, N. N. Lavrentieva, CDSD-1000, the high-temperature carbon dioxide spectroscopic databank, Journal of Quantitative Spectroscopy and Radiative Transfer 82 (2003) 165–196.
- Sharpe et al. [2004] S. W. Sharpe, T. J. Johnson, R. L. Sams, P. M. Chu, G. C. Rhoderick, P. A. Johnson, Gas-Phase Databases for Quantitative Infrared Spectroscopy, Applied Spectroscopy 58 (2004) 1452–1461.
- Kochanov et al. [2016] R. V. Kochanov, I. E. Gordon, L. S. Rothman, P. Wcisło, C. Hill, J. S. Wilzewski, HITRAN Application Programming Interface (HAPI): A comprehensive approach to working with spectroscopic data, Journal of Quantitative Spectroscopy and Radiative Transfer 177 (2016) 15–30.
- Rosenmann et al. [1997] L. Rosenmann, B. Khalil, R. Le Doucen, Calculations and measurements of N2O absorption at high temperature in the 4.5 m region., Journal of Quantitative Spectroscopy and Radiative Transfer 57 (1997) 477–483.
- Esplin et al. [1988] M. P. Esplin, W. M. Barowy, R. J. Huppi, G. A. Vanasse, High Resolution Fourier Spectroscopy of Nitrous Oxide at Elevated Temperatures, Mikrochimica Acta 3 (1988) 403.
- Goldman et al. [1998] A. Goldman, I. R. Brown, W. G. Schoenfeld, M. N. Spencer, J. Chackerian, C., L. P. Giver, H. Dothe, C. P. Rinsland, L. H. Coudert, V. Dana, J. Y. Mandin, Nitric oxide line parameters: review of 1996 HITRAN update and new results., Journal of Quantitative Spectroscopy and Radiative Transfer 60 (1998) 825–838.
- Rothman et al. [2005] L. S. Rothman, D. Jacquemart, A. Barbe, D. Chris Benner, M. Birk, L. R. Brown, M. R. Carleer, C. Chackerian, K. Chance, L. H. Coudert, V. Dana, V. M. Devi, J. M. Flaud, R. R. Gamache, A. Goldman, J. M. Hartmann, K. W. Jucks, A. G. Maki, J. Y. Mandin, S. T. Massie, J. Orphal, A. Perrin, C. P. Rinsland, M. A. H. Smith, J. Tennyson, R. N. Tolchenov, R. A. Toth, J. Vander Auwera, P. Varanasi, G. Wagner, The HITRAN 2004 molecular spectroscopic database, Journal of Quantitative Spectroscopy and Radiative Transfer 96 (2005) 139–204.
- Rothman et al. [2009] L. S. Rothman, I. E. Gordon, A. Barbe, D. C. Benner, P. F. Bernath, M. Birk, V. Boudon, L. R. Brown, A. Campargue, J. P. Champion, K. Chance, L. H. Coudert, V. Dana, V. M. Devi, S. Fally, J. M. Flaud, R. R. Gamache, A. Goldman, D. Jacquemart, I. Kleiner, N. Lacome, W. J. Lafferty, J. Y. Mandin, S. T. Massie, S. N. Mikhailenko, C. E. Miller, N. Moazzen-Ahmadi, O. V. Naumenko, A. V. Nikitin, J. Orphal, V. I. Perevalov, A. Perrin, A. Predoi-Cross, C. P. Rinsland, M. Rotger, M. Šimečková, M. A. H. Smith, K. Sung, S. A. Tashkun, J. Tennyson, R. A. Toth, A. C. Vandaele, J. Vander Auwera, The HITRAN 2008 molecular spectroscopic database, Journal of Quantitative Spectroscopy and Radiative Transfer 110 (2009) 533–572.
- Sulakshina and Borkov [2018] O. Sulakshina, Y. Borkov, Critical evaluation of measured line positions of 14n16o in x2pi state, J. Quant. Spectrosc. Radiat. Transf. 209 (2018) 171 – 179.
- Endres et al. [2016] C. P. Endres, S. Schlemmer, P. Schilke, J. Stutzki, H. S. P. Müller, The Cologne Database for Molecular Spectroscopy, CDMS, in the Virtual Atomic and Molecular Data Centre, VAMDC, Journal of Molecular Spectroscopy 327 (2016) 95–104.
- Müller et al. [2015] H. S. P. Müller, K. Kobayashi, K. Takahashi, K. Tomaru, F. Matsushima, Terahertz spectroscopy of N18O and isotopic invariant fit of several nitric oxide isotopologs, Journal of Molecular Spectroscopy 310 (2015) 92–98.
- Pickett [1991] H. M. Pickett, The fitting and prediction of vibration-rotation spectra with spin interactions, Journal of Molecular Spectroscopy 148 (1991) 371–377.
- Gamache et al. [2017] R. R. Gamache, C. Roller, E. Lopes, I. E. Gordon, L. S. Rothman, O. L. Polyansky, N. F. Zobov, A. A. Kyuberis, J. Tennyson, S. N. Yurchenko, A. G. Császár, T. Furtenbacher, X. Huang, D. W. Schwenke, T. J. Lee, B. J. Drouin, S. A. Tashkun, V. I. Perevalov, R. V. Kochanov, Total internal partition sums for 166 isotopologues of 51 molecules important in planetary atmospheres: Application to HITRAN2016 and beyond, Journal of Quantitative Spectroscopy and Radiative Transfer 203 (2017) 70–87.
- Varberg et al. [1999] T. D. Varberg, F. Stroh, K. M. Evenson, Far-Infrared Rotational and Fine-Structure Transition Frequencies and Molecular Constants of 14NO and 15NO in the X2 ( v = 0) State, Journal of Molecular Spectroscopy 196 (1999) 5–13.
- Pickett et al. [1998] H. M. Pickett, R. L. Poynter, E. A. Cohen, M. L. Delitsky, J. C. Pearson, H. S. P. Müller, Submillimeter, millimeter and microwave spectral line catalog., Journal of Quantitative Spectroscopy and Radiative Transfer 60 (1998) 883–890.
- Drouin [2010] B. J. Drouin, NO linelist catalogue number 30008, JPL online, https://spec.jpl.nasa.gov/ftp/pub/catalog/catdir.html (2010).
- Wong et al. [2017] A. Wong, S. N. Yurchenko, P. Bernath, H. S. P. Müller, S. McConkey, J. Tennyson, ExoMol line list - XXI. Nitric Oxide (NO), Monthly Notices of the Royal Astronomical Society 470 (2017) 882–897.
- Tennyson et al. [2016] J. Tennyson, S. N. Yurchenko, A. F. Al-Refaie, E. J. Barton, K. L. Chubb, P. A. Coles, S. Diamantopoulou, M. N. Gorman, C. Hill, A. Z. Lam, L. Lodi, L. K. McKemmish, Y. Na, A. Owens, O. L. Polyansky, T. Rivlin, C. Sousa-Silva, D. S. Underwood, A. Yachmenev, E. Zak, The ExoMol database: Molecular line lists for exoplanet and other hot atmospheres, Journal of Molecular Spectroscopy 327 (2016) 73–94.
- Yurchenko et al. [2016] S. N. Yurchenko, L. Lodi, J. Tennyson, A. V. Stolyarov, DUO: A general program for calculating spectra of diatomic molecules, Computer Physics Communications 202 (2016) 262–275.
- Furtenbacher et al. [2007] T. Furtenbacher, A. G. Császár, J. Tennyson, MARVEL: measured active rotational vibrational energy levels, Journal of Molecular Spectroscopy 245 (2007) 115–125.
- Furtenbacher and Császár [2012] T. Furtenbacher, A. G. Császár, MARVEL: Measured active rotational-vibrational energy levels. II. Algorithmic improvements, Journal of Quantitative Spectroscopy and Radiative Transfer 113 (2012) 929–935.
- Medvedev et al. [2015] E. S. Medvedev, V. V. Meshkov, A. V. Stolyarov, I. E. Gordon, Peculiarities of high-overtone transition probabilities in carbon monoxide revealed by high-precision calculation, The Journal of Chemical Physics 143 (2015) 154301.
- Medvedev et al. [2016] E. S. Medvedev, V. V. Meshkov, A. V. Stolyarov, V. G. Ushakov, I. E. Gordon, Impact of the dipole-moment representation on the intensity of high overtones, Journal of Molecular Spectroscopy 330 (2016) 36–42.
- Lee et al. [2006] Y.-P. Lee, S.-L. Cheah, J. F. Ogilvie, Intensities of line features in vibration-rotational bands 2-0 to 6-0 of 14N16O X 2r and experimental evaluation of a radial function for electric dipolar moment, Infrared Physics and Technology 47 (2006) 227–239.
- Bood et al. [2006] J. Bood, A. McIlroy, D. L. Osborn, Measurement of the sixth overtone band of nitric oxide, and its dipole moment function, using cavity-enhanced frequency modulation spectroscopy, Journal of Chemical Physics 124 (2006) 084311–084311.
- Mihalcea et al. [1998] R. M. Mihalcea, D. S. Baer, R. K. Hanson, A diode-laser absorption sensor system for combustion emission measurements, Measurement Science and Technology 9 (1998) 327–338.
- Sonnenfroh and Allen [1997] D. M. Sonnenfroh, M. G. Allen, Absorption measurements of the second overtone band of NO in ambient and combustion gases with a 1.8-m room-temperature diode laser, Applied Optics 36 (1997) 7970–7977.
- Spencer et al. [1994] M. N. Spencer, C. Chackerian, L. P. Giver, L. R. Brown, The Nitric Oxide Fundamental Band: Frequency and Shape Parameters for Rovibrational Lines, Journal of Molecular Spectroscopy 165 (1994) 506–524.
- Hartmann and Boulet [2000] J. M. Hartmann, C. Boulet, Line shape parameters for HF in a bath of argon as a test of classical path models, Journal of Chemical Physics 113 (2000) 9000–9010.
- Li et al. [2015] G. Li, I. E. Gordon, L. S. Rothman, Y. Tan, S.-M. Hu, S. Kassi, A. Campargue, E. S. Medvedev, Rovibrational Line Lists for Nine Isotopologues of the CO Molecule in the X 1+ Ground Electronic State, The Astrophysical Journal Supplement Series 216 (2015) 15.
- Houdeau et al. [1983] J. P. Houdeau, C. Boulet, J. Bonamy, A. Khayar, G. Guelachvili, Air broadened NO linewidths in a temperature range of atmospheric interest, Journal of Chemical Physics 79 (1983) 1634–1640.
- Ballard et al. [1988] J. Ballard, W. B. Johnston, B. J. Kerridge, J. J. Remedios, Experimental spectral line parameters in the 1-0 band of nitric oxide, Journal of Molecular Spectroscopy 127 (1988) 70–82.
- Spencer et al. [1997] M. N. Spencer, C. Chackerian, L. P. Giver, L. R. Brown, Temperature Dependence of Nitrogen Broadening of the NO Fundamental Vibrational Band, Journal of Molecular Spectroscopy 181 (1997) 307–315.
- Almodovar et al. [2017] C. A. Almodovar, R. M. Spearrin, R. K. Hanson, Two-color laser absorption near 5 m for temperature and nitric oxide sensing in high-temperature gases, Journal of Quantitative Spectroscopy and Radiative Transfer 203 (2017) 572–581.
- Pine et al. [1985] A. S. Pine, A. G. Maki, N. Y. Chou, Pressure broadening, lineshapes, and intensity measurements in the 2 0 band of NO, Journal of Molecular Spectroscopy 114 (1985) 132–147.
- Mandin et al. [2000] J. Y. Mandin, V. Dana, L. Regalia, X. Thomas, A. Barbe, Nitrogen-broadening in the nitric oxide first overtone band, Journal of Quantitative Spectroscopy and Radiative Transfer 66 (2000) 93–100.
- Snels et al. [1999] M. Snels, C. Corsi, F. D’Amato, M. De Rosa, G. Modugno, Pressure broadening in the second overtone of NO, measured with a near infrared DFB diode laser, Optics Communications 159 (1999) 80–83.
- Sakamoto et al. [2009] Y. Sakamoto, Y. Daisuke, N. Tomoki, K. Masahiro, I. Morino, I. Gen, Buffer-gas Pressure Broadening for the Third Overtone Band of NO Measured with Continuous-wave Cavity Ring-down Spectroscopy, JChemistry Letters 38 (2009) 1000–1001.
- Chackerian et al. [1998] C. Chackerian, R. S. Freedman, L. P. Giver, L. R. Brown, The NO Vibrational Fundamental Band: O 2-Broadening Coefficients, Journal of Molecular Spectroscopy 192 (1998) 215–219.
- Allout [1999] M. Allout, Oxygen-Broadening Coefficients of First Overtone Nitric Oxide Lines, Journal of Quantitative Spectroscopy and Radiative Transfer 61 (1999) 759–765.
- Kronfeldt et al. [1996] H. D. Kronfeldt, G. Basar, B. Sumpf, Application of a cw tunable infrared spectrometer based on difference-frequency generation in AgGaS2 for self-broadening investigations of NO at 5 m, Journal of the Optical Society of America B Optical Physics 13 (1996) 1859–1863.
- Lukashevskaya et al. [2016] A. A. Lukashevskaya, N. N. Lavrentieva, A. C. Dudaryonok, V. I. Perevalov, NDSD-1000: High-resolution, high-temperature Nitrogen Dioxide Spectroscopic Databank, Journal of Quantitative Spectroscopy and Radiative Transfer 184 (2016) 205–217.
- Perrin et al. [1998] A. Perrin, J. M. Flaud, A. Goldman, C. Camy-Peyret, W. J. Lafferty, P. Arcas, C. P. Rinsland , NO2 and SO2 line parameters: 1996 HITRAN update and new results., Journal of Quantitative Spectroscopy and Radiative Transfer 60 (1998) 839–850.
- Perrin et al. [2017] A. Perrin, M. Ndao, L. Manceron, Comment on the paper ;NDSD-1000: High-resolution, high-temperature nitrogen dioxide spectroscopic Databank; by A.A. Lukashevskaya, N.N. Lavrentieva, A.C. Dudaryonok, V.I. Perevalov, J Quant Spectrosc Radiat Transfer 2016;184:205-17, Journal of Quantitative Spectroscopy and Radiative Transfer 200 (2017) 12–16.
- Lukashevskaya et al. [2017] A. A. Lukashevskaya, N. N. Lavrentieva, A. S. Dudaryonok, V. I. Perevalov, Corrected version of the NDSD-1000 databank, Journal of Quantitative Spectroscopy and Radiative Transfer 202 (2017) 37–37.
- Stephen et al. [2000] T. M. Stephen, A. Goldman, A. Perrin, J. M. Flaud, F. Keller, C. P. Rinsland, New High-Resolution Analysis of the 3 3 and 2 1 + 3 Bands of Nitrogen Dioxide (NO 2) by Fourier Transform Spectroscopy, Journal of Molecular Spectroscopy 201 (2000) 134–142.
- Perrin et al. [1988] A. Perrin, J.-M. Flaud, C. Camy-Peyret, B. Carli, M. Carlotti, The far infrared spectrum of 14N16O2, Molecular Physics 63 (1988) 791–810.
- Perrin et al. [1993] A. Perrin, J. M. Flaud, C. Camy-Peyret, A. Goldman, F. J. Murcray, R. D. Blatherwick, C. P. Rinsland, The 2 and 22 - 2 bands of 14N16O2: Electron Spin-Rotation and Hyperfine Contact Resonances in the (010) Vibrational State, Journal of Molecular Spectroscopy 160 (1993) 456–463.
- Mandin et al. [1997] J. Y. Mandin, V. Dana, A. Perrin, J. M. Flaud, C. Camy-Peyret, L. Régalia, A. Barbe, The {1+ 22, 1+ 3} Bands of14N16O2: Line Positions and Intensities; Line Intensities in the 1+ 2+ 3- 2Hot Band, Journal of Molecular Spectroscopy 181 (1997) 379–388.
- Vasilenko et al. [2018] I. A. Vasilenko, A. A. Lukashevskaya, S. V. Sadovnikov, Sergey A. Yakovlev, The influence of the accuracy of spectral line parameters of SO2 and NO2 in applications of atmospheric remote monitoring, in: O. A. Romanovskii, G. G. Matvienko (Eds.), 24th International Symposium on Atmospheric and Ocean Optics: Atmospheric Physics, SPIE, 2018, p. 382. URL: https://www.spiedigitallibrary.org/conference-proceedings-of-spie/10833/2506008/The-influence-of-the-accuracy-of-spectral-line-parameters-of/10.1117/12.2506008.full. doi:10.1117/12.2506008.
- Benner et al. [2004] D. C. Benner, T. A. Blake, L. R. Brown, V. Malathy Devi, M. A. H. Smith, R. A. Toth, Air-broadening parameters in the 3 band of 14N16O2 using a multispectrum fitting technique, Journal of Molecular Spectroscopy 228 (2004) 593–619.
- Gamache and Vispoel [2018] R. R. Gamache, B. Vispoel, On the temperature dependence of half-widths and line shifts for molecular transitions in the microwave and infrared regions, Journal of Quantitative Spectroscopy and Radiative Transfer 217 (2018) 440 – 452.
- Fortney et al. [2016] J. J. Fortney, T. D. Robinson, S. Domagal-Goldman, D. Skålid Amundsen, M. Brogi, M. Claire, D. Crisp, E. Hebrard, H. Imanaka, R. de Kok, M. S. Marley, D. Teal, T. Barman, P. Bernath, A. Burrows, D. Charbonneau, R. S. Freedman, D. Gelino, C. Helling, K. Heng, A. G. Jensen, S. Kane, E. M. R. Kempton, R. K. Kopparapu, N. K. Lewis, M. Lopez-Morales, J. Lyons, W. Lyra, V. Meadows, J. Moses, R. Pierrehumbert, O. Venot, S. X. Wang, J. T. Wright, The Need for Laboratory Work to Aid in The Understanding of Exoplanetary Atmospheres, arXiv e-prints (2016) arXiv:1602.06305.
Appendix A Uncertainty codes for NO line lists
A.1 CDMS
NO uncertainty codes (UCs) have been provided in the CDMS line lists. A maximum uncertainty code cm-1 (i.e., following the HITRAN convention, UC=8) is used for line positions. The applied intensity uncertainty is dependent on such that for the uncertainty for intensity is 5-10% (UC=5), and for the uncertainty for intensity is 10-20% (UC=4).
A.2 NOname
Wavenumber uncertainty codes for the NOname line list have been deduced from the vibration and rotational level assignment. For and an uncertainty of cm-1 (UC=2) is applied, for an uncertainty of cm-1 (UC=3), and for an uncertainty of cm-1 (UC=4). For and an uncertainty of cm-1 (UC=1) is applied. For all other cases, an UC=0 is given for the wavenumber. Intensity uncertainty codes are also based on the vibration and rotational levels. For , an uncertainty of 10-20% (UC=4) is given for ; 5-10% (UC=5) for ; and 2-5% (UC=6) for . In all other cases an intensity UC=2 is given.
A.3 HSPM2018
An uncertainty of cm-1 (UC=0) has been provided for positions, with an uncertainty code applied for estimated intensities (UC=2).
Appendix B Pressure shifts of NO
The pressures shifts applied to the NO line list have been limited to due to the increase in uncertainty of the measurements beyond this value. For pressures shifts with , the value at is used. Similarly, for , the value at is used. The measurements also do not include some of the smallest values; in these cases the lowest measured value is applied. It should also be noted that the pressure shifts for the have been fixed to 0 cm-1atm-1. While it is possible to extrapolate Eq. 2 for the bands, a number of transitions would actually be shifted into the negative wavenumber regime for ambient pressures, and therefore to avoid this issue a value of zero is given.