A fast anharmonic free energy method with an application to vacancies in ZrC
Abstract
We propose an approach to calculate the anharmonic part of the volumetric-strain and temperature dependent free energy of a crystal. The method strikes an effective balance between accuracy and computational efficiency, showing a speed-up on comparable free energy approaches at the level of density functional theory, with average errors less than 1 meV/atom. As a demonstration we make new predictions on the thermodynamics of substoichiometric ZrCx, including vacancy concentration and heat capacity.
I Introduction
Thanks to recent advances in computational thermodynamics, the thermal properties of metals such as aluminium and gold have been investigated up to the melting point, using thermodynamic integration (TI) with Langevin dynamicsGrabowski et al. (2009, 2015); Glensk et al. (2014) based on density functional theory (DFT). A two-step TI approach increases computational efficiency further, making predictions possible for more complex materials at the DFT level of theory. Examples so far include the ultra-high-temperature ceramics ZrC () and HfC (),Duff et al. (2015a, 2018) and recent attempts at tackling the emerging class of multicomponent systems.Ikeda et al. (2018); Grabowski et al. Such calculations are not yet routine, but the course of our research and the recent methodological developments of others(Wu and Wentzcovitch, 2009; Moustafa et al., 2017a; Purohit et al., 2018) in this field is in that direction. Here we present some new developments that are a step towards the goal of routinely computing accurate free energies for hard matter systems, including binaries, ternaries, and high-entropy alloys, across the range of temperatures, pressures and chemical potentials, up to and eventually beyond the melting point.
In this work we compute the concentration of vacancies in ZrCx and associated ambient pressure thermodynamics for small deviations from stoichiometry. The ZrCx free energy and derivatives are analyzed in terms of the contributions(Zhang et al., 2018a)
| (1) |
in which is the DFT energy of a static lattice at K, is the Helmholtz free energy contribution from the thermal excitations of electrons, is the quasiharmonic vibrational contribution, is the anharmonic vibrational contribution, is the electron-vibration contribution, and is the contribution of configurational entropy due to the number of distinct point-defect distributions. For each of the five temperature-dependent terms we have calculated the dependence on the independent variables volume and temperature up to the melting point. Considerable attention in this paper is given to the method we use to compute the challenging anharmonic term, . The method described achieves effective DFT accuracy in (1 meV per bulk atom) with only an order of magnitude greater computational cost than ordinary quasiharmonic free energy calculations.
This paper is set out as follows. Sec. II.1 gives the context of our approach, theoretical details are in Sec. II.2, a description of the modified embedded atom method (MEAM) potential fitting, which reduces overall the number of expensive DFT calculations, in Sec. II.3, thermodynamic integration in Sec. II.4, and DFT technical details in Sec. II.5. Benchmarking is described in terms of accuracy and precision in Sec. III.1 and computational efficiency in Sec. III.2. Application to ZrCx provides insight into the nature of anharmonicity in substoichiometric binary crystals in Sec. IV.1, prediction of vacancy concentration in Sec. IV.2, and analysis of ZrCx heat capacity in Sec. IV.3.
II Methods
II.1 Background
There are a number of approaches in the literature to calculate the anharmonic vibrational properties of crystals,Alfè et al. (2001, 2002a, 2002b); Ackland (2002); Duff et al. (2015a); Errea et al. (2011); Glensk et al. (2014); Grabowski et al. (2009, 2015); Hellman et al. (2013); Monserrat et al. (2013); Klein and Horton (1972); Zwanzig (1954); Frenkel and Ladd (1984); Moustafa et al. (2017b) including thermodynamic integrationKirkwood (1935) (TI), which is the method used in this work. In TI the anharmonic part of the full Hamiltonian, , is switched on with the parameter , in this instance linearly as . Classical averages of are obtained stochastically from molecular dynamics (MD), and numerically integrated along the coupling path to give the free energy due to :
| (2) |
Note, , where is the full potential energy surface and the volume-dependent harmonic potential energy surface in Born-Oppenheimer nuclear coordinates .
The partitioning of the vibrational free energy divides the problem conveniently into a simple quantum mechanical part, in which the vibrations are quantised as phonons, and an anharmonic part in which the vibrations are treated classically. Thus has the appropriate low-temperature quantum statistics. The anharmonicity is treated classically but also non-perturbatively, which is important at high temperatures as the melting point is approached. In order to evaluate the anharmonic term, the expectation values require between configurations for a typical -ensemble at a typical supercell size. To produce a free energy surface one must sample ensembles across dimensions of strain (here volume), temperature and coupling parameter, . Thus the ball-park number of total energy calculations, between configurations, is prohibitive at the highly-converged DFT level of accuracy required.
In one approach to reduce computational complexity, is obtained by cumulating a sequence of thermodynamic integrations. In an implementation of this approach referred to as TU-TILD,Duff et al. (2015a) which is expressed by Eqn. (3), much of is captured using an inexpensive MEAM potential. This results in faster convergence of the expensive TI from MEAM to DFT, expressed in the last term of Eqn. (3).
| (3) |
In practice to save computation time, the DFT MD calculations in a TU-TILD procedure were usually performed with a low-converged expansion of the wavefunctions, using a reduced number of plane-waves, and fewer k-points than required for maximum accuracy. The maximum accuracy was then obtained by up-sampling, as in the original UP-TILD methodGrabowski et al. (2009). The methodology we introduce below, inspired by these approaches, was devised in order to make significant further savings in computation time without sacrificing accuracy.
II.2 MEAM thermodynamic integration approach
The approach we propose in this work can be summarized by
| (4) |
Our approach calculates the anharmonic free energy of a MEAM crystal referenced to a harmonic DFT crystal, which is formally the first stage in Eqn. (3). In the present method the quasiharmonic Helmholtz free energy at each volume is still explicitly represented by the volume-dependent dynamical matrix calculated with DFT, which captures much of the thermal expansion, but the anharmonic terms are now entirely described by the MEAM potential. The success of the method depends on being able to generate a MEAM potential of sufficient accuracy to replace the anharmonic DFT contribution. It is by no means obvious a priori that this is possible, or if it is, that the process of generating the potential is not too expensive to warrant the effort.
From the potential terms in Eqn.(4) it is clear that can be evaluated by this method to a high level of precision using modest computational resources, but the MEAM TI approximation introduces systematic potential errors with respect to DFT TI. Accuracy must be carefully controlled by generating custom MEAM potentials from high-quality DFT MD. Generating the training and validation data is time consuming, so fitting the potentials becomes the primary computational cost in predicting in our TI approach. These costs incurred before doing the MEAM TI will be shown in Sec. III.1 to be comfortably small enough. Details of potential fitting and error control are presented in the following section.
II.3 Potential fitting

Interatomic potentials have been fitted using the reference-free modified embedded atom method (RF-MEAM).Duff et al. (2015b) The MEAM potentials fitted in this work lack transferability and are specialized to perform for the intended application. For instance, to model we fit a separate potential at each volume considered, which minimizes the possibility of strain-dependent errors. Obtaining the correct implicit volume dependence of a potential is important, as explicit anharmonic effects depend sensitively on the degree of lattice expansion, as demonstrated in Sec. IV.1.
Potentials for Zr32C32 and Zr32C31 have been fitted at the cell lattice parameters Å. In crystals of lower than cubic symmetry, thermal expansion may involve other modes of strain, but in our case only volumetric strain need be considered. At each volume the potential is fitted to configurations sampled from DFT MD runs between K and K. The fitting set for each volume comprises Zr32C31 configurations, which supply energies and forces to the objective function, for minimizing force residuals and energy-residual variances. Fitting to the forces on each atom allows the potential to be specified by fewer distinct configurations than fitting to energies, as . To generate the fitting data points efficiently, low-quality DFT can be up-sampled to high-quality DFT to produce high-quality target forces and total energies.
The interatomic potentials are generated using a genetic-algorithm conjugate-gradient fitting procedure implemented and publicly available in the MEAMFIT2 code.Duff et al. (2015b); Duff (2016); MEA The code fits an RF-MEAM potential that permits locally positive and negative density terms in order to increase variational freedom, subject to a net positive background. The fitted potential has 3 embedding and 3 pairwise terms, within a radial cutoff of Å, which includes interactions up to third nearest-neighbor. These potential parameters provide a satisfactory compromise between accuracy and complexity, in terms of minimizing residual variances on hold-out data using the fewest degrees of freedom (78 parameters for the 3-3 potential). The quality of fits for energy and forces is presented in Fig. 1 for Zr32C31.
In this RF-MEAM application a different potential is fitted at each volume but we require a potential to be transferable across composition, i.e. we want the same potential to describe both Zr32C31 and Zr32C32, for a given volume at any temperature. This transferability ensures a systematic error cancellation in for Zr32C31 and Zr32C32 that helps in calculating accurate fully anharmonic vacancy formation energies.
II.4 Thermodynamic integration

is estimated by computing , with , for a series of ensembles at equal increments of , . In Fig. 2 we show the dependence of on across a series of temperatures. We see that at each temperature, , a necessary condition that is easy to prove, as in a derivation of the Gibbs-Bogoliubov inequality. In Fig. 2 inset the convergence of is shown for the first 60,000 time steps of a simulation. Expectation values are generated using Langevin MD, with a one femtosecond time-step,Duff et al. (2015a) and a friction parameter of fs-1 for Zr32C31 and fs-1 for Zr32C32. At each pair, , the expectation value is fitted in by least squares to the truncated power series
| (5) |
for which the coefficients are alternating in sign and converging. If intrinsic defects form and migrate on the atomic vibration time-scale this series is expected to poorly converge. In this work we exclude any system configurations in which Frenkel defects have spontaneously formed, for example at the melting point, in order to ensure well-converged thermodynamic integrations of the anharmonic free energy of defect-free ZrCx.

Errors in predicting are considered from two primary sources, namely statistical convergence and a systematic potential error. The DFT benchmark also has a small convergence error which is accounted for, but other sources of error, such as from DFT exchange-correlation, electron-phonon scattering, and other quantum effects beyond the harmonic approximation, are beyond the scope of this paper. The three countable contributions are shown schematically in Fig. 3, and give the total expected error of
| (6) |
Precision error arises from evaluating an observable from a finite number of samples in the MEAM MD, and the systematic error is due to the energy difference between a MEAM potential and DFT. The convergence error in the benchmark value from TU-TILD is meV/at.Duff et al. (2015a)
The statistical convergence is computed using stratified systematic sampling.Haile (1997) In the simulation the precision error scales asJanke (2002)
| (7) |
where is the number of integration path points sampled (with in our case), is the norm of standard deviations, is the autocorrelation time (ca. fs, see Appendix), and is the simulation time (ca. ns). We emphasise that the TI method described differs from other approaches in that statistical convergence is not accuracy-limiting, for example, nanosecond simulations can comfortably be performed in a day on a low-performance computing platform.
The systematic potential error in the anharmonic free energy can be computed by thermodynamic integration
| (8) |
is the primary error source in the method we describe to compute . Accuracy benchmarks in Sec. III.1 show can be sufficiently controlled to satisfy 1 meV/at bulk convergence across the surface.
II.5 Technical details
Periodic plane-wave DFT calculations were performed using the VASP software,Kresse and Furthmüller (1996a, b) with the local density approximation (LDA) exchange-correlation function.Perdew and Zunger (1981) The projector-augmented wave (PAW) method was used,Kresse and Joubert (1999) with - and -Zr electrons included as valence states.
was computed on a mesh of 11 volumes, and at each volume the internal coordinates have been relaxed to give residual forces under eV/Å. Self-consistent field (SCF) total energies and energy eigenvalues have been resolved to eV. Methfessel-Paxton smearing has been used with a width of 0.1 eV.Methfessel and Paxton (1989) The kinetic energy cutoff has been set to 700 eV and k-point mesh for the supercell. The vacancy formation energy contribution is extrapolated to the dilute limit, using data points from Zr32C31, Zr108C107 and Zr256C255.
For the quasiharmonic Helmholtz free energy , the kinetic energy cutoff has been set to 700 eV and k-point mesh to for the supercell. Phonons were calculated using the small displacement supercell method with the PHONOPY code.Togo and Tanaka (2015) At each of the 11 supercells that span the range of lattice parameters Å, sets of 18 displacements were made for Zr32C31 and sets of four displacements for Zr32C32. The phonon q-points were sampled by a mesh of points for the supercells.
The electronic Helmholtz free energy has been calculated using the Mermin finite-temperature formulation of DFT,Mermin (1965) on a mesh of 10 temperatures and 8 volumes sampled between and . Electron states are self-consistent to at least eV/atom. We used bands, which was sufficient to span all states with partial occupation up to the melting point . A kinetic cutoff energy of 700 eV was used, with k-point sampling at for the supercells.
The electron-vibration Helmholtz free energy , has been calculated from low-converged MD configurations that are subsequently up-sampled, as in the proceedure recently performed for a number of transition metals.Zhang et al. (2017) The electronic free energy is calculated for each MD configuration, using the Mermin formulation at electronic temperature corresponding to the MD ensemble temperature. At each volume-temperature mesh point, the electronic free energies are averaged over the ensemble configurations, and referenced to the perfect crystal, in order to find the electron-vibration coupling contribution to the Helmholtz free energy.
The anharmonic Helmholtz free energy was determined using a mesh of six temperatures and five volumes. Temperatures span K to , and volumes to . Potentials were fitted to MD configurations from DFT that used a 700 eV cutoff and k-point sampling mesh of for the supercell.
III Benchmarks
III.1 Accuracy and precision

Our MEAM TI approach predicts to within a target accuracy of 1 meV/at compared to DFT endpoint TI. This is demonstrated in Fig. 4a. Perfect Zr32C32 is shown with error bars (TU-TILD reference) for 25 volumes and temperatures up to the melting point. energies are converged to sufficient precision that the error bars are in effect systematic potential error bars. The mean absolute error (MAE) is 0.5 meV/at, with a mean signed deviation of 0.05 meV/at. The MAE values at the lattice parameters Å are meV/at. Errors resolved at the temperatures K have the MAE values meV/at.
On the basis of adequately small errors for bulk ZrC, we propose using the MEAM thermodynamic integration approach for more complex systems. In this regard Zr32C31 is a useful test case for two reasons. The carbon-vacancy introduces complexity in terms of physical interactions. It removes inversion symmetry at sites around the vacancy, so there are terms in the energy of odd-order in atomic displacements, previously excluded by symmetry in perfect ZrC. Secondly, making free energy predictions per vacancy increases computational complexity considerably due to the nature of statistical error scaling for TI predictions on a per-vacancy basis.
For the vacancy system Zr32C31, is shown in Fig. 4b. Obtaining comparable DFT TI values for systems with vacancies like Zr32C31 is prohibitively expensive in general but we have computed a DFT benchmark for Zr32C31 at Å and K. The MEAM thermodynamic integration is found to overestimate the DFT TI reference value by meV/at, which is comparable to the MAE in the perfect bulk ZrC.
III.2 Computational cost
In Table III.2 timings are reported for the MEAM-based TI in this work and TU-TILD (DFT) calculations. Both methods compute the surface across 25 mesh points for a Zr32C32 test case. The MEAM approach does not have DFT TI and DFT TI up-sampling steps, which account for the majority of the TU-TILD cost. In the MEAM approach, the main CPU-time overhead is high-quality DFT calculations on selected MD configurations, which are used create data to fit the MEAM potentials. Furthermore the time required to optimizeDuff (2016) the MEAM potential with a large fitting set is substantially longer (ca. ), compared to a MEAM potential used in the intermediate TI steps in TU-TILD. Despite this the former scheme still gains a factor of at least in efficiency overall due to having no DFT TI or DFT TI up-sample. For anharmonic predictions where 1 meV/atom convergence is sufficient, the TI method described in this work is likely to be a cost effective choice for metals and alloys. It would be of interest to compare the efficiency of less specialised machine learned potentials(Cheng et al., 2019; Behler, 2017; Grabowski et al., ) to the MEAM type as applied here, in terms of parameter fitting time, required training DFT data and potential compute time.
| Contributions | (core-hrs) | ||||
|---|---|---|---|---|---|
| this work | TU-TILD | this work | TU-TILD | ||
| Fit set DFT MD | 10 | 0.6 | |||
| MEAM fitting | 0.4 | 0.03 | |||
| MEAM TI | 0.4 | 0.1 | |||
| DFT TI | - | - | 110 | ||
| DFT up-sampling | - | - | 6 | ||
| Total | 11 | 117 | |||
IV Application of TI method to ZrCx
IV.1 The character of anharmonicity in ZrCx
Prior to discussing the substoichiometric crystal, consider the anharmonic contribution to the Helmholtz free energy of perfect ZrC, shown in Fig. 4a. in Zr32C32 tends to be positive and increase with temperature. This is because the anharmonic phase space has a smaller volume within a given potential energy surface, giving a positive anharmonic free energy term. A positive anharmonic contribution is similarly observed in other extended systems,Glensk et al. (2014, 2015); Zhang et al. (2018b) and is expected to be dependent on the presence of inversion symmetry.
in Zr32C32 increases with volume expansion. This contrasts with the result of harmonic force constants, which typically become softer under tensile strain, increasing the entropy and decreasing the free energy. In terms of effective frequencies in perfect ZrC, quasiharmonicity reduces frequencies with volume expansion whereas anharmonicity in ZrC increases frequencies.
The anharmonic free energy of the Zr32C31 crystal is given in Fig. 4b. for Zr32C31 naturally appears similar to Zr32C32, since most atoms in Zr32C31 are fully coordinated, but the anharmonic free energy is less positive, for example, is lower by approximately meV/at at Å and K.
To directly identify vacant-site anharmonicity we compute
| (9) |
which isolates the vacancy anharmonic contribution by cancelling common contributions in Zr32C32 and Zr32C31. The anharmonicity of a single vacant site is stronger and qualitatively different in character to the anharmonicity per site in for Zr32C32. for example typically exceeds by more than an order of magnitude (approximately ), and is negative whereas is almost always positive.
As we are typically interested in ambient pressure thermodynamics, we can consider the nature of the excess anharmonic Gibbs free energy rather than Helmholtz . in Fig. 4c illustrates the strength and sign of vacancy anharmonicity at ambient pressure. The large negative values of at high temperature can be simply rationalized. At high temperature the change in thermal excursions, when atoms are near a vacancy, is larger than predicted by harmonic springs, so the entropy is greater and free energy less. In terms of the change in the anharmonic potential, the magnitude and sign of are attributed to terms that start from third-order in the potential Taylor expansion, rather than fourth-order as in the perfect crystal with inversion symmetry.
IV.2 Vacancy volume, formation energy, and concentration


| (K) | (C at. %) | |
|---|---|---|
| this work | CALPHADFernández Guillermet (1995) | |
| 300 | ||
| 500 | ||
| 1000 | 0.01 | 0.003 |
| 1500 | 0.33 | 0.06 |
| 2000 | 1.87 | 0.33 |
| 2200 | 3.03 | 0.51 |
The thermal expansion of the ZrC atomic volume () is shown in Fig. 5, alongside the vacancy formation volume, , where is the volume of an atom defective ZrCx cell. For ZrC, predictions at the qh+el+ah level of theory reproduce the thermal expansion reported in an earlier theoretical work,(Duff et al., 2015a) while including electron-vibration coupling provides a small-to-negligible additional enhancement, evident in Fig. 5.
The volume of a vacant carbon site at K is Å3/vac, which is +3.2 % or +0.40 Å3/site larger than the corresponding atomic volume for the perfect crystal. This means the lattice of a ZrCx crystal initially expands for , with the lattice parameter increasing by +0.001 Å from to in our 298-K calculations. This is at odds with recent measurements by Nakayama et al.(Nakayama et al., 2017) who report a monotonic, apparently linear trend, but is supported by other experimental work in which the ZrCx lattice parameter is a concave function of carbon substoichiometry.(Sara, 1965; Schönfeld et al., 2017; Katoh et al., 2013; Jackson et al., 2011) For example according to Sara,(Sara, 1965) the maximum volume occurs at composition ZrC0.90 with an value some +0.004 Å greater than in ZrC0.98. To first order, the gradient is ca. +0.0011 Ang/C at. %, compared to +0.0005 Ang/C at. % in our work. It is important to stress that this is quite a subtle effect, and that it is temperature dependent. For K our computed lattice constant decreases from to .
As a final comment on thermal expansion, we note the temperature dependence of is somewhat complicated (Fig. 5 inset). Quasiharmonic volume-dependent frequencies and electron-vibration coupling make the vacancy volume smaller generally, whereas anharmonic and electron thermal excitations increase it. In each instance, at high temperature such as , these effects are comparable in size to the 0-K outward relaxation of the Zr atoms around the vacancy; ZrC bonds normal to the vacancy surface are squeezed by -0.08 Å compared to bonds of length Å in the perfect crystal.
The energy to form a carbon vacancy in ZrC is considered in terms of a Gibbs free energy computed as follows:
| (10) |
In this expression is the chemical potential to remove an atom of carbon from ZrC and place it in a carbon reservoir. The reference state of carbon is taken to be that of graphite, which for 0 K to 298 K, is computed by quasiharmonic DFT for diamond, with a 0-K experimental correction to graphite. At higher temperatures, the experimental parameterization of the graphite free energy is used, in the form of the GustafsonGustafson (1986) assessment. This provides a diamond chemical potential that includes all contributions (e.g. anharmonicity) and is consistent with the DFT calculated free energies, while avoiding expensive calculations for graphite. Further details and an expression for are given in the Appendix.
The error bar in , due to TI statistical precision and MEAM systematic potential error, is 60 meV/vacancy. This value assumes no cancellation in the systematic potential error between Zr32C32 and Zr32C31, and is therefore an upper limit. As most sites in Zr32C31 are fully-coordinated and bulk-like, and the same MEAM potential is used to describe perfect Zr32C32 and Zr32C31, partial cancellation of the systematic potential error is expected. In the limit of anharmonicity being a site-localised property, the systematic potential error would only arise from the six under-coordinated nearest-neighbours to the vacancy in Zr32C31, and the corresponding non-matching seven sites in Zr32C32. In this case the total error is less than 10 meV/vacancy.
is shown in Fig. 6, including quasiharmonic, electronic, electron-vibration, and anharmonic contributions. Above ca. K () the anharmonic contribution can no longer be regarded as negligible, and above ca. K () accounting for anharmonicity is critical to qualitatively describe the ZrC vacancy formation energy. With respect to a quasiharmonic reference, Fig. 6 shows that electronic entropy lowers the formation energy, and that anharmonicity substantially lowers the Gibbs formation energy further, while the electron-vibration contribution is much smaller. In the final predictions, which include the quasiharmonic, electronic, electron-vibration, and anharmonic effects, is almost linear in temperature, and decreases by approximately 10 meV with every increase in temperature by 1000 K. This rate of decrease is similar to reports in other materials such as aluminum and nickel.Glensk et al. (2014); Gong et al. (2018)
The vacancy concentration in contact with graphite is computed with an ideal solution model
| (11) |
and is shown in Fig. 7. Anharmonicity favors vacancy formation by making smaller, increasing by a factor of two compared to predictions at the level. The effect of electron-vibration coupling on vacancy concentration is marginal in this material. Specific values of are shown in Table 2, up to a temperature of K, which is when the predicted concentration reaches our operative dilute limit of one vacancy per supercell ( for ZrCx).
In Table 2 the values from the CALPHAD assessment are consistently lower than our values. Fernández Guillermet (1995) Despite the power of the CALPHAD method for ZrCx,Fernández Guillermet (1995) uncertainties can arise from insufficient experimental data, and the limitations that exist due to the non-physical interaction terms the methodology assumes. At K the CALPHAD value is C at. %,Fernández Guillermet (1995) compared to C at. % in this work.
Our predictions have quantum mechanical many-body errors from the LDA exchange-correlation treatment we use to describe ZrC. While the GGA has been shown to be less suitable to describe ZrC at high temperature than LDA,Duff et al. (2015a) it is instructive to consider the vacancy formation energy from both exchange-correlation treatments, in order to gauge sensitivity. At K the GGA vacancy formation energy is less than the LDA value by some 0.2 eV/vacancy (without zero-point corrections and dilute limit supercell extrapolation), indicating a GGA predicted concentration is greater. Quantitative predictions of the non-local quantum many-body error at high temperature is beyond the scope of this work, but experience suggests that the LDA and GGA (PBE) functionals bracket the exact result.(Grabowski et al., 2015)
In this work we confine our predictions to temperatures at which concentrations do not exceed one vacancy per supercell. This should minimize lattice many-body errors, however we note that vacancy-vacancy interactions are expected to be mainly repulsive,Zhang et al. (2015) and that other entities on the carbon sub-lattice such as Frenkel defects will decrease the vacancy configuration space.Mellan et al. (2018) These effects are expected to moderate , to values lower than ideal, to an extent that increases with temperature.


IV.3 Free energy and heat capacity of ZrCx
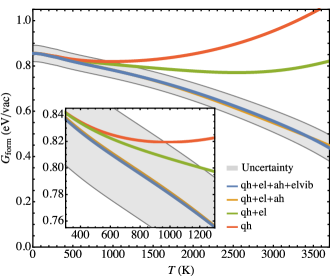
The basic excitation mechanisms that determine the thermal properties of ZrCx are discussed relative to a quasiharmonic reference system. Formulae for the referenced Gibbs free energies at ambient pressure, , , and , are listed in the Appendix. Each is shown as a function of temperature in Fig. 8.
At high temperature the magnitude of the electron-vibration contribution to the Gibbs free energy is less than the anharmonic contribution, which is in turn less than the electronic contribution. Partial cancellation occurs as and are negative whereas is positive in this material. The vacancy contribution is the smallest of the four contributions up to 1900 K, but beyond the dilute vacancy concentration temperature of K, increases considerably. Extrapolating to higher temperatures, the vacancy contribution appears to become the largest of all above K. Note however that above K the value of is presented as indicative only, and is represented in Fig. 8 with a dashed line, as it exceeds the thermodynamic limitations of our dilute solution model.
The different ZrCx heat capacity contributions, relative to the quasiharmonic system, are shown in Fig. 9. The anharmonic term is negative and the electronic one is positive, with each similar in absolute value near . It is somewhat interesting to consider the extent to which and cancellation is coincidental in ZrCx or a manifestation of a generic feature. In ordinary metals is a priori positive, and for ordinary high-symmetry crystals, is negative at high temperature.Glensk et al. (2015) Some cancellation of and is therefore regarded to be likely in conducting systems such as the refractory ceramic ZrC. However, as the extent of cancellation depends on the magnitude of each contribution, for which we are unaware of a direct physical relation, we conclude cancellation is mostly coincidental.
In ZrCx, , , and are all individually larger than the vacancy contribution. For example at 2200 K, kB/atom, compared to kB/atom, kB/atom and kB/atom. Extending the vacancy model beyond the dilute limit with the dashed line in Fig. 9 indicates is comparable to the positive contributions of , and near . Consequently we suggest the physical origin of the steep increase in heat capacity in ZrCxSavvatimskiy et al. (2017) is a combination of electron thermal excitations, electron-vibration coupling, and structural excitations on the carbon sub-lattice, predominantly the constitutional carbon vacancies that have been the focus of this paper, although there are also stoichiometry conserving intrinsic carbon Frenkel defects, which are beyond the scope of this work but discussed elsewhere.Mellan et al. (2018); Savvatimskiy et al. (2017) Finally, it is interesting to note that while anharmonicity is the only term that suppresses in Fig. 9, the enhancing effects of the vacancy contribution are mainly due to the indirect effect of anharmonicity, insomuch as anharmonicity by lowering enhances the population of vacancies (e.g. by a factor of at 2200 K as shown in Fig. 7).
V Conclusions
Thermodynamic integration approach
We have described a thermodynamic integration method to calculate the anharmonic free energy of a crystal to DFT accuracy. In our benchmark system of ZrC the approach achieves average target precision better than 1 meV/atom and 60 meV/vacancy, comparable to more expensive DFT-based thermodynamic integration schemes. The method transfers the burden of computation from converging random statistical errors to minimizing systematic potential errors. With sufficient care to minimize potential errors, precise calculations can be made to compute quantities such as the anharmonic vacancy formation energy, with modest computing resources.
Application to ZrCx
Anharmonicity increases the concentration of vacancies in ZrCx. At 2000 K vacancies increase from to C at. % due to explicit anharmonicity. The ZrCx heat capacity is enhanced by electron thermal excitations, electron-vibration coupling and vacancies on the carbon sub-lattice, and suppressed by anharmonicity. For example, kB/atom, kB/atom, kB/atom, and kB/atom. The sharp increase in the heat capacity at high temperature is attributed to electronic and electron-vibration effects along with the thermal excitation of structural defects.
VI Acknowledgements
T.A.M. and M.W.F. acknowledge computational support from the UK national high performance computing service, ARCHER, for which access was obtained via the UKCP consortium and funded by EPSRC grant EP/P022561/1, and for computational support from the UK Materials and Molecular Modelling Hub, which is partially funded by EPSRC grant EP/P020194. T.A.M. and M.W.F. acknowledge the financial support of EPSRC Programme Grant No. EP/K008749/1 Material Systems for Extreme Environments (XMat), and Grant No. EP/M018563/1 Carbides for Future Fission Environments (CAFFE). M.W.F. is grateful for support from the Alexander von Humboldt-Stiftung award. A.I.D. acknowledges support from the STFC Hartree Centre’s Innovation: Return on Research programme, funded by the UK Department for Business, Energy & Industrial Strategy. B.G. acknowledges funding from the European Research Council (ERC) under the European Union Horizon 2020 research and innovation programme (grant agreement No. 639211).
VII References
References
- Grabowski et al. (2009) B. Grabowski, L. Ismer, T. Hickel, and J. Neugebauer, Phys. Rev. B 79, 134106 (2009).
- Grabowski et al. (2015) B. Grabowski, S. Wippermann, A. Glensk, T. Hickel, and J. Neugebauer, Phys. Rev. B 91, 201103(R) (2015).
- Glensk et al. (2014) A. Glensk, B. Grabowski, T. Hickel, and J. Neugebauer, Phys. Rev. X 4, 011018 (2014).
- Duff et al. (2015a) A. I. Duff, T. Davey, D. Korbmacher, A. Glensk, B. Grabowski, J. Neugebauer, and M. W. Finnis, Phys. Rev. B 91, 214311 (2015a).
- Duff et al. (2018) A. I. Duff, T. A. Mellan, and M. W. Finnis, In preparation (2018).
- Ikeda et al. (2018) Y. Ikeda, B. Grabowski, and F. Körmann, Mat. Char. 147, 464 (2018).
- (7) B. Grabowski, F. Körmann, C. Freysoldt, A. I. Duff, A. Shapeev, and J. Neugebauer, submitted arXiv:1902.11230 .
- Wu and Wentzcovitch (2009) Z. Wu and R. M. Wentzcovitch, Phys. Rev. B 79, 104304 (2009).
- Moustafa et al. (2017a) S. G. Moustafa, A. J. Schultz, and D. A. Kofke, J. Chem. Theo. Comp. 13, 825 (2017a).
- Purohit et al. (2018) A. Purohit, A. J. Schultz, S. G. Moustafa, J. R. Errington, and D. A. Kofke, Mol. Phys. 116, 3027 (2018).
- Zhang et al. (2018a) X. Zhang, B. Grabowski, T. Hickel, and J. Neugebauer, Comp. Mat. Sci. 148, 249 (2018a).
- Alfè et al. (2001) D. Alfè, G. D. Price, and M. J. Gillan, Phys. Rev. B 64, 045123 (2001).
- Alfè et al. (2002a) D. Alfè, M. J. Gillan, and G. D. Price, J. Chem. Phys. 116, 6170 (2002a).
- Alfè et al. (2002b) D. Alfè, G. D. Price, and M. J. Gillan, Phys. Rev. B 65, 165118 (2002b).
- Ackland (2002) G. Ackland, J Phys: Cond. Mat. 14, 2975 (2002).
- Errea et al. (2011) I. Errea, B. Rousseau, and A. Bergara, Phys. Rev. Lett. 106, 165501 (2011).
- Hellman et al. (2013) O. Hellman, P. Steneteg, I. A. Abrikosov, and S. I. Simak, Phys. Rev. B 87, 104111 (2013).
- Monserrat et al. (2013) B. Monserrat, N. D. Drummond, and R. J. Needs, Phys. Rev. B 87, 144302 (2013).
- Klein and Horton (1972) M. L. Klein and G. K. Horton, J. Low Temp. Phys. 9, 151 (1972).
- Zwanzig (1954) R. W. Zwanzig, J. Chem. Phys. 22, 1420 (1954).
- Frenkel and Ladd (1984) D. Frenkel and A. J. C. Ladd, J. Chem. Phys. 81, 3188 (1984).
- Moustafa et al. (2017b) S. G. Moustafa, A. J. Schultz, E. Zurek, and D. A. Kofke, Phys. Rev. B 96, 014117 (2017b).
- Kirkwood (1935) J. G. Kirkwood, J. Chem. Phys. 3, 300 (1935).
- Duff et al. (2015b) A. I. Duff, M. W. Finnis, P. Maugis, B. J. Thijsse, and M. H. F. Sluiter, Comp. Phys. Comm. 196, 439 (2015b).
- Duff (2016) A. I. Duff, Comp. Phys. Comm. 203, 354 (2016).
- (26) “MEAMfit2 is an interatomic potential optimization package which can be obtained from STFC’s Daresbury laboratory via the website https://www.scd.stfc.ac.uk/Pages/MEAMfit-v2.aspx,” .
- Haile (1997) J. M. Haile, Molecular Dynamics Simulation: Elementary Methods (Wiley, 1997) p. 79f.
- Janke (2002) W. Janke, in Quantum Simulations of Complex Many-Body Systems: From Theory to Algorithms, Vol. 10 (John von Neumann Institute for Computing, Jülich, 2002) p. 423.
- Kresse and Furthmüller (1996a) G. Kresse and J. Furthmüller, Comp. Mat. Sci. 6, 15 (1996a).
- Kresse and Furthmüller (1996b) G. Kresse and J. Furthmüller, Phys. Rev. B 54, 11169 (1996b).
- Perdew and Zunger (1981) J. P. Perdew and A. Zunger, Phys. Rev. B 23, 5048 (1981).
- Kresse and Joubert (1999) G. Kresse and D. Joubert, Phys. Rev. B 59, 1758 (1999).
- Methfessel and Paxton (1989) M. Methfessel and A. T. Paxton, Phys. Rev. B 40, 3616 (1989).
- Togo and Tanaka (2015) A. Togo and I. Tanaka, Scrip. Mat. 108, 1 (2015).
- Mermin (1965) N. D. Mermin, Phys. Rev. 137, 1441 (1965).
- Zhang et al. (2017) X. Zhang, B. Grabowski, F. Körmann, C. Freysoldt, and J. Neugebauer, Phys. Rev. B 95, 165126 (2017).
- Cheng et al. (2019) B. Cheng, E. Engel, J. Behler, C. Dellago, and M. Ceriotti, PNAS 116, 1110 (2019).
- Behler (2017) J. Behler, Ang. Chem. 56, 12828 (2017).
- Glensk et al. (2015) A. Glensk, B. Grabowski, T. Hickel, and J. Neugebauer, Phys. Rev. Lett. 114, 195901 (2015).
- Zhang et al. (2018b) X. Zhang, B. Grabowski, F. Körmann, A. Ruban, Y. Gong, R. Reed, T. Hickel, and J. Neugebauer, Phys. Rev. B 98, 224106 (2018b).
- Fernández Guillermet (1995) A. Fernández Guillermet, J. Alloy Compd. 217, 69 (1995).
- Nakayama et al. (2017) H. Nakayama, K. Ozaki, T. Nabeta, and Y. Nakajima, Mat. Trans. 58, 852 (2017).
- Sara (1965) R. Sara, J. Amer. Cer. Soc. 48, 243 (1965).
- Schönfeld et al. (2017) K. Schönfeld, H. Martin, and A. Michaelis, J. Adv. Cer. 6, 165 (2017).
- Katoh et al. (2013) Y. Katoh, G. Vasudevamurthy, T. Nozawa, and L. Snead, J. Nuc. Mat. 441, 718 (2013).
- Jackson et al. (2011) H. F. Jackson, J. D. D. Jayaseelan, D. Manara, P. Casoni, and W. E. Lee, J. Am. Ceram. Soc. 94, 3561 (2011).
- Gustafson (1986) P. Gustafson, Carbon 24, 169 (1986).
- Gong et al. (2018) Y. Gong, B. Grabowski, A. Glensk, F. Körmann, J. Neugebauer, and R. C. Reed, Phys. Rev. B 97, 214106 (2018).
- Zhang et al. (2015) Y. Zhang, B. Liu, and J. Wang, Sci. Rep. 5, 18098 (2015).
- Mellan et al. (2018) T. A. Mellan, A. I. Duff, and M. W. Finnis, Phys. Rev. B 98, 174116 (2018).
- Savvatimskiy et al. (2017) A. I. Savvatimskiy, S. V. Onufriev, and S. A. Muboyadzhyan, J. Mater. Res. 32, 1287 (2017).
Appendix
Gibbs free energy contributions
To quantify different thermal excitations beyond the quasiharmonic level of theory, quasiharmonic-referenced Gibbs free energies are reported as
and
Similarly is the Gibbs free energy associated with a concentration of vacancies () in ZrCx, again referenced to the quasiharmonic system. This is defined by writing the total Gibbs free energy of ZrCx at the full level of theory as . In this expression , and is the equilibrium concentration of vacancies, which has been computed from the Arrhenius ideal solution model introduced in Eqn. (11). To compute , the vacancy part () is referenced to the quasiharmonic system:
which is equivalent to the difference in equilibrium vacancy concentrations at the full and quasiharmonic levels of theory. Note for completeness, the quasiharmonic reference system terms are defined as follows: , with , and is the ideal solution model equilibrium concentration, with exponent (Eqn. (10)) calculated at the quasiharmonic level.
Graphite chemical potential
The ZrC vacancy formation energy has been calculated with respect to a graphite chemical potential of the form
The coefficients for , which is the CALPHAD standard state temperature K, are set according to the Gustafson experimental free energy parameterization:Gustafson (1986)
At low temperatures ( K) where the graphite parameterization is unavailable, is continued using a DFT-calculated diamond potential, . This quasiharmonic diamond potential at low-temperature is transformed to a graphite chemical potential by a correction equal to the K enthalpy difference eV/atom.
Correlation time
The correlation time , which is used to estimate error scaling and determine statistical precision using stratified systematic sampling, is the integrated correlation timeJanke (2002)
is estimated byJanke (2002)
with time-step fs, and autocorrelation function, , given by
The calculated correlation time ranges from fs, depending weakly on the arguments of .
TI quadrature error
The quadrature error in as a function of the number of integral sampling points ( values) is shown in Fig. 10. At low temperatures when the system is nearly harmonic, the integrand is small and almost independent of , and therefore a large number of samples is unnecessary. At high temperature when is curvier (see non-linearity in Fig. 2), sufficient sampling of the integrand is critical to obtain sub-meV/at numerical precision. is determined in this work by sampling at intervals or 11 points (). The associated error shown in Fig. 10 is less than meV/at for K, and ca. meV/at at .
