Molecular Gas Properties in the Host Galaxy of GRB 080207
Abstract
We present the results of CO(1–0) and CO(4–3) observations of the host galaxy of a long-duration gamma-ray burst GRB 080207 at by using the Karl G. Jansky Very Large Array and the Atacama Large Millimeter/submillimeter Array. The host is detected in CO(1–0) and CO(4–3), becoming the first case for a GRB host with more than two CO transitions detected combined with CO(2–1) and CO(3–2) in the literature. Adopting a metallicity-dependent CO-to-H2 conversion factor, we derive a molecular gas mass of , which places the host in a sequence of normal star-forming galaxies in a –star-formation rate (SFR) plane. A modified blackbody fit to the far-infrared–millimeter photometry results in a dust temperature of 37 K and a dust mass of . The spatially-resolving CO(4–3) observations allow us to examine the kinematics of the host. The CO velocity field shows a clear rotation and is reproduced by a rotation-dominated disk model with a rotation velocity of 350 km s-1 and a half-light radius of 2.4 kpc. The CO spectral line energy distribution derived from the four CO transitions is similar to that of starburst galaxies, suggesting a high excitation condition. Comparison of molecular gas properties between the host and normal (main-sequence) galaxies at similar redshifts shows that they share common properties such as gas mass fraction, gas depletion timescale, gas-to-dust ratio, location in the –SFR (or surface density) relation, and kinematics, suggesting that long-duration GRBs can occur in normal star-forming environments at .
1 Introduction
Long-duration gamma-ray bursts (GRBs) have been shown to be associated with the explosions of massive stars (e.g., Hjorth et al., 2003; Stanek et al., 2003). Due to the short lifetime of massive stars, GRBs are thought to trace galaxies with ongoing star formation. Because GRBs are bright enough to be observable in the cosmological distances (e.g., Tanvir et al., 2009; Salvaterra et al., 2009), they are expected to be a new tool to probe the star-forming activity in the distant universe (e.g., Totani, 1997; Wijers et al., 1998; Kistler et al., 2009; Robertson, & Ellis, 2012; Trenti et al., 2012). However, whether GRBs can be used as an unbiased tracer of star formation in the universe is still a subject of debate (e.g., Michałowski et al., 2012; Perley et al., 2013; Hunt et al., 2014; Greiner et al., 2015; Perley et al., 2015, 2016a; Vergani et al., 2015; Japelj et al., 2016). In order to understand the environment where GRBs occur, it is important to understand the properties molecular gas, the fuel of star formation, in GRB host galaxies. While molecular hydrogen has been detected in absorption in the spectra of GRB afterglows (e.g., Prochaska et al., 2009; Krühler et al., 2013; D’Elia et al., 2014; Friis et al., 2015), the detected column density probes only one sight line in front of the GRB. Emission lines need to be observed in order to measure the molecular gas content in host galaxies. Searches for CO emission as a tracer of molecular gas have been conducted in several GRB host galaxies (Kohno et al., 2005; Endo et al., 2007; Hatsukade et al., 2007, 2011; Stanway et al., 2011), and five host galaxies have been detected so far (Hatsukade et al., 2014; Stanway et al., 2015; Michałowski et al., 2016; Arabsalmani et al., 2018; Michałowski et al., 2018). While earlier works suggest a deficiency of molecular gas in the host galaxies compared to their star formation rate (SFR) or stellar mass (Hatsukade et al., 2014; Stanway et al., 2015), recent studies show that the difference is not significant and GRB host galaxies have more diverse in molecular gas properties with an additional sample, appropriate CO-to-H2 conversion factors (), or a careful choice of comparison sample (Arabsalmani et al., 2018; Michałowski et al., 2018).
One important issue for estimating the molecular gas mass is the uncertainty of CO line ratios. The CO luminosity of a ground rotational transition –0 is required for deriving the molecular gas mass by applying the conversion factor, and we need to assume a CO line ratio in the case of host galaxies with only higher CO lines. However, no GRB host galaxy has been detected with multiple CO transitions including the CO(1–0) line, and the CO line ratio for GRB host galaxies has not yet been obtained. Since the CO spectral line energy distribution (SLED) provides the molecular gas excitation condition whether GRB host galaxies have a nearly thermalized condition as in starburst galaxies or a low excitation condition as in the Milky Way, it is essential to obtain a sample of GRB host galaxies with multiple CO transitions.
In this paper, we present the results of CO(1–0) and CO(4–3) observations of the host galaxies of GRB 080207 with the Karl G. Jansky Very Large Array (VLA) and the Atacama Large Millimeter/submillimeter Array (ALMA). The arrangement of this paper is as follows. Section 2 outlines the host galaxy of GRB 080207. Section 3 describes the observations, data reduction, and results. In Section 4, we derived the molecular gas mass, dust mass, gas kinematics, and CO SLED, and compare them with other galaxies populations. We discuss the availability of GRBs as a tracer of star-formation activity in terms of molecular gas properties. Conclusions are presented in Section 5. Throughout the paper, we adopt a cosmology with km s-1 Mpc-1, , and . SFRs in this paper are converted to a Chabrier (2003) IMF from a Salpeter (1955) IMF by multiplying a factor of 0.61.
2 The Host Galaxy of GRB 080207
The host galaxy of GRB 080207 has been well studied at various wavelengths. GRB 080207 is identified as a dark GRB due to the non-detection of its afterglow in the optical and NIR and the inferred X-ray-to-optical spectral slope (Hunt et al., 2011; Svensson et al., 2012; Rossi et al., 2012). The redshift of is determined from the emission line in from the host galaxy (Krühler et al., 2012). The host galaxy is a red, massive, and actively star-forming galaxy with stellar mass of and SFR of 50–300 yr-1 (e.g., Perley et al., 2013; Hunt et al., 2014; Arabsalmani et al., 2018). The host galaxy has one of the highest stellar mass and inferred visual extinction ( mag) among GRB hosts (e.g., Hunt et al., 2011, 2014; Perley et al., 2013, 2016b). The stellar mass and SFR place the host galaxy on the massive end of the main sequence (MS) of star-forming galaxies at . The detections at 24 m with Spitzer/MIPS (Hunt et al., 2011; Svensson et al., 2012), 100 and 160 m with Herschel/PACS (Hunt et al., 2014), and 5 GHz with VLA (Perley & Perley, 2013) suggest the existence of dust-obscured star formation. The radio-derived SFR of yr-1 is larger than other estimates (Perley & Perley, 2013). While the radio observations were conducted 3.4 and 4.3 years after the GRB, the lack of early-time radio observations prevents constraining a long-lived radio afterglow, and its contamination to the detected radio emission from the host galaxy cannot be ruled out (Perley & Perley, 2013). The metallicity of the host galaxy is (Krühler et al., 2015), which is derived with and diagnostics based on the calibrators of Nagao et al. (2006) and Maiolino et al. (2008). The host galaxy is on the mass-metallicity relation at for the stellar mass (e.g., Wuyts et al., 2014; Steidel et al., 2014).
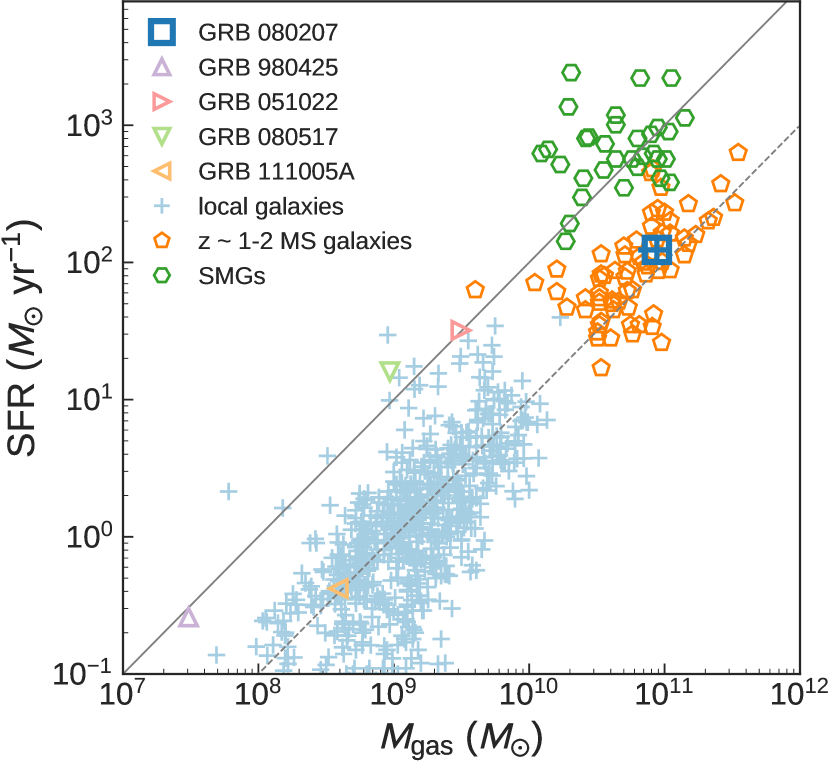
Recently, Arabsalmani et al. (2018) detected the CO(3–2) line with the Plateau de Bure/NOrthern Extended Millimeter Array. They derived the molecular gas mass of and found that the gas mass fraction and the gas depletion timescale are comparable to star-forming galaxies at similar redshifts. Michałowski et al. (2018) reported the detection of the CO(2–1) line with the IRAM 30 m telescope and a derived molecular gas mass of . The detection of the CO lines and the large gas reservoir make it the best target for studying the properties of molecular gas in detail.
3 Observations and Results
3.1 VLA CO(1–0)
The VLA Ka-band observations (Project ID: 18A-103) were performed on Nov. 11–16, 2018 using 26 antennas. The array configuration was D and DC (transition from D to C) with a baseline length ranging from 40 m to 3.4 km. The WIDAR correlator was used with 8-bit samplers. We used two basebands with a 1 GHz bandwidth centered at 36.34 and 37.34 GHz, which provides a total bandwidth of 2 GHz centered at 36.8 GHz (0.81 cm). The redshifted CO(1–0) line was observed at 37.355 GHz. Bandpass and amplitude calibrations were done with 3C286, and phase calibrations were done with a nearby quasar J14151320. The total observing time and the on-source time is 7.4 and 3.7 hours, respectively.
The data were reduced with Common Astronomy Software Applications (CASA; McMullin et al., 2007).
The maps were produced with tclean task.
The natural weighting was adopted, and the resultant synthesized beamsize is (PA ) for velocity-integrated CO(1–0) map and (position angle PA ) for the continuum map.
The continuum map was created with a total bandwidth of 1.9 GHz, excluding channels with emission line.
The rms noise level is 7.5 Jy beam-1 for the continuum map, and 83 Jy beam-1 for the spectra with a velocity resolution of 100 km s-1.
3.2 ALMA CO(4–3)
ALMA observations were conducted in Apr. 29, 2016 for a Cycle 3 program (Project code: 2015.1.00939.S) as part of an ALMA CO search toward a sample of long-duration GRB host galaxies (B. Hatsukade et al. in prep.). The redshifted CO(4–3) line was observed with Band 4. The correlator was used in the time domain mode with a bandwidth of 1875 MHz (488.28 kHz 3840 channels). Four basebands were used, providing a total bandwidth of 7.5 GHz centered at 2.1 mm. The array configuration was C36-2/3 with the baseline lengths of 15.1–640.0 m. The number of available antenna was 41, and the on-source integration time is 41 min. Bandpass, flux, and phase calibrations were done with J12560547, Titan, and J1347+1217, respectively.
The data were reduced with CASA, and maps were processed with a tclean task.
While Briggs weighting with robust parameter of 0.5 was adopted for CO maps, natural weighting was adopted for a continuum map to maximize the sensitivity.
The continuum map was created with a total bandwidth of 7.5 GHz, excluding channels with emission line.
Clean boxes were placed when a component with a peak signal-to-noise ratio (S/N) above 5 is identified, and CLEANed down to a level.
The synthesized beamsize is (PA ) for a velocity-integrated CO map, and (PA ) for the continuum map.
The rms noise level is 12.9 Jy beam-1 for the continuum map, and 0.42 mJy beam-1 for a spectra with a velocity resolution of 20 km s-1.
3.3 Results
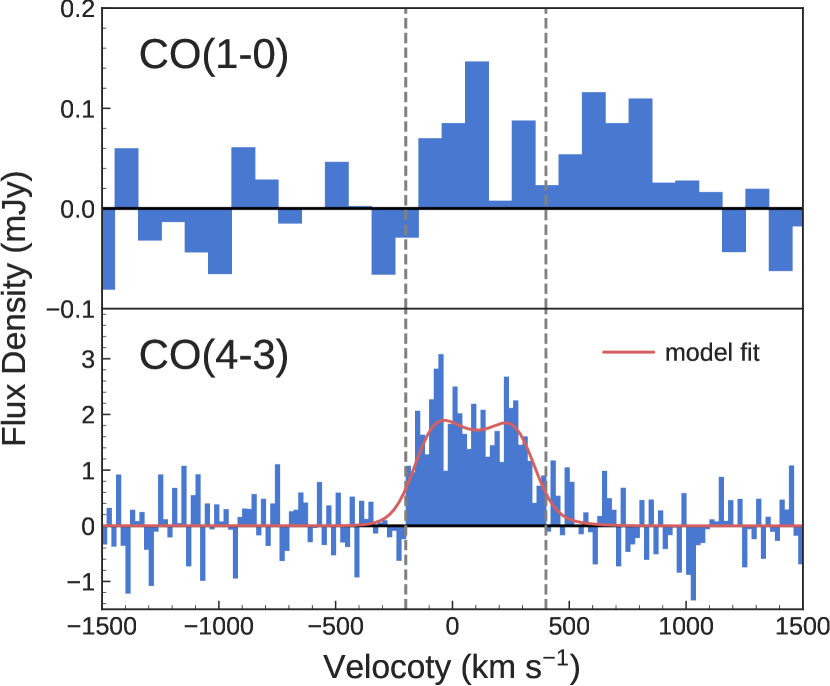
We detected CO(1–0) and CO(4–3) emission at the position of the host galaxy and at the expected frequency for (Figure 1 and 2). The CO(4–3) spectrum shows a full width at zero intensity of 600 km s-1 with a range from to 400 km s-1, and a full width at half maximum (FWHM) of 450 km s-1. This is consistent with the spectrum of CO(2–1) (Michałowski et al., 2018) but is wider than is reported for CO(3–2) (FWHM = km s-1; Arabsalmani et al., 2018).
The line profile of CO(1–0) appears to be somewhat different from CO(4–3), although the S/N is lower than that of CO(4–3). While the spectral feature at 300 km s-1 corresponds to the second peak of the CO(4–3) spectrum, the component at 700 km s-1 is not seen in CO(4–3). The 300 km s-1 and 700 km s-1 features are also marginally seen in the CO(3–2) spectrum of Arabsalmani et al. (2018), and the CO(2–1) spectrum of Michałowski et al. (2018) has its peak at 300 km s-1. Arabsalmani et al. (2018) reported the presence of a broad component with a FWHM of 1160 km s-1 centered at 320 km s-1 in the H emission, suggesting an outflow from the host galaxy or an interacting system. If we assume the 700 km s-1 component is a signature of outflow, the outflow mass is comparable to the main component of the host galaxy and is in the order of – . Such a massive molecular outflow is not seen in local ultra-luminous IR galaxies (ULIRGs) or Seyfert galaxies (e.g., Cicone et al., 2014; González-Alfonso et al., 2017). An interacting system is also a possible scenario. Signatures of interaction have been observed in GRB host galaxies through optical/near-IR imaging (e.g., Perley et al., 2013) or absorption lines in afterglows (e.g., Thöne et al., 2013; Wiseman et al., 2017). Neutral hydrogen observations of GRB host galaxies suggest a recent minor/major merger, which could induced star formation and the progenitor of a GRB formed in the star formation episode that took place in newly accreted gas (e.g., Michałowski et al., 2015; Arabsalmani et al., 2015). Since the 700 km s-1 component is not detected in other higher lines, the gas excitation condition would be low. Although the component could be a signature of an outflow or an interaction, the low significance (S/N in the velocity-integrated map) prevents further discussion. Note that no line or spurious can be found in the spectra of calibrators at the velocity range.
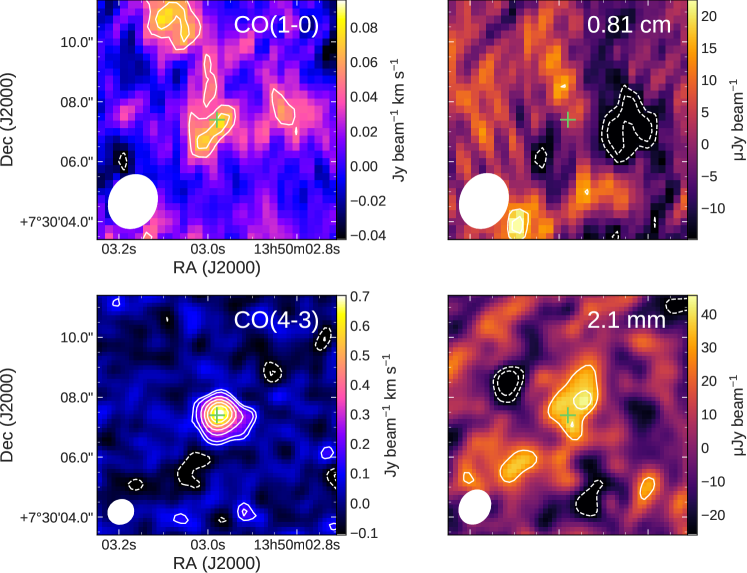
Since the CO spectra in the velocity ranging from to km s-1 share common features in all the CO transitions, we adopt the velocity range for measuring the line flux of CO(1–0) and CO(4–3) of the host galaxy. The peak S/N of the velocity-integrated intensity is 3.65 and 13.7 for CO(1–0) and CO(4–3), respectively. Since the significance for the CO(1–0) is not high, we conducted source extractions of positive peaks and negative peaks in the map to estimate the probability of spurious detection. The number of positive and negative peaks with S/N above 3.6 is 10 and 1, respectively, and the fraction of negative to positive peaks is 0.1. Given that the position of the CO(1–0) emission agrees with the host galaxy and the CO(4–3) emission within errors, we can consider the CO(1–0) originates from the host galaxy. The CO(1–0) emission is not spatially resolved and we adopt the peak value as a total flux. The CO(4–3) emission is spatially resolved with a deconvolved source size of . The CO line luminosities are (1–0) (K km s-1 pc2) and (4–3) (K km s-1 pc2).
Continuum emission at 0.81 cm is not detected with VLA, giving a 3 upper limit of Jy beam-1.
Continuum emission at 2.1 mm is marginally detected with a peak S/N of 3.4.
The emission is spatially resolved by the beam and the integrated flux measured with imfit is Jy.
The observation results are summarized in Table 1.
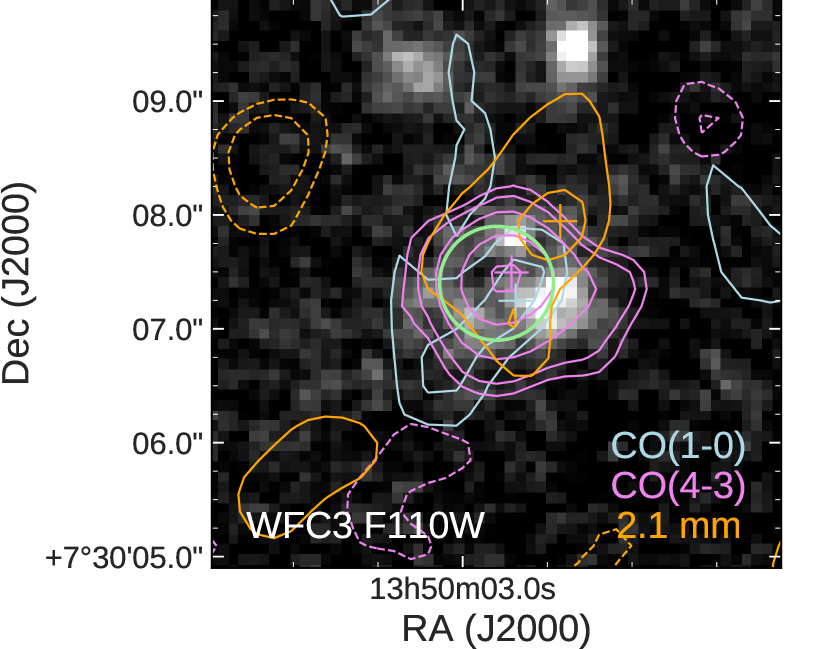
Figure 3 shows the contours of the CO(1–0) line, the CO(4–3) line, and the 2.1 mm dust continuum emission overlaid on the image of HST/Wide Field Camera-3 (WFC3) with the F110W filter. The astrometry of image is calibrated by the source catalog of Gaia Data Release 1 (Gaia Collaboration et al., 2016). The peaks of the CO(1–0) and CO(4–3) lines are located at the center of the optical components and consistent with the GRB afterglow position within errors. The peak of the dust continuum appears to be in-between the brighter north and west optical components, although the positional uncertainty is large (). The discrepancy in the position between optical and CO/dust suggests the obscured star formation in the host galaxy.
| Observations | CO | Continuum | ||||
| ∗ | Deconvolved Size† | Deconvolved Size† | ||||
| (Jy km s-1) | (K km s-1 pc2) | (′′) | (Jy) | (′′) | ||
| VLA | 1–0 | ‡ | 22 (3) | |||
| ALMA | 4–3 | † | † | |||
| ∗ Velocity-integrated CO intensity derived by integrating the velocity from to km s-1. † Derived from 2D Gaussian fit with CASA imfit. ‡ Peak intensity. | ||||||
4 Discussion
4.1 Molecular Gas Mass
We derive the molecular gas mass based on the CO(1–0) emission. The CO luminosity is calculated as follows (Solomon & Vanden Bout, 2005),
| (1) |
where is in K km s-1 pc2, is the velocity-integrated intensity in Jy km s-1, is the observed line frequency in GHz, and is the luminosity distance in Mpc. The molecular gas mass is derived from
| (2) |
where the CO-to-H2 conversion factor includes the contribution of helium mass. The conversion factor is thought to be dependent on gas phase metallicity, increasing with decreasing metallicity (e.g., Wilson, 1995; Arimoto et al., 1996; Kennicutt, & Evans, 2012; Bolatto et al., 2013). We adopt the relation between metallicity and of Genzel et al. (2012) and Genzel et al. (2015), where they derived an empirical relation by using local and high-redshift sample. To apply the relation, we convert the metallicity reported in Krühler et al. (2015) to the calibration of Pettini, & Pagel (2004) by using the metallicity conversion of Kewley, & Ellison (2008). The metallicity of the host galaxy corresponds to a metallicity-dependent conversion factor of (K km s-1 pc2)-1. If we adopt a Galactic conversion factor of (K km s-1 pc2)-1 (Bolatto et al., 2013), a derived molecular gas mass would be smaller by a factor of 1.2. The molecular gas mass based on the CO(1–0) luminosity is estimated to be , which is 1.5–2 times smaller than those derived from the CO(2–1) and CO(3–2) observations (Michałowski et al., 2018; Arabsalmani et al., 2018). The difference can be explained by the assumed CO line ratios in the literature: the brightness temperature line ratios CO(2–1)/CO(1–0) () of 0.5 in Michałowski et al. (2018) and CO(3–2)/CO(1–0) () of 0.6 in Arabsalmani et al. (2018), while the derived ratios in this study are close to unity (see Sec. 4.5). The host galaxy has molecular gas reservoir more than an order of magnitude compared to the other CO-detected GRB host galaxies of GRB 980425 at , GRB 051022 at , GRB GRB 080517 at , and GRB 111005A at (Hatsukade et al., 2014; Stanway et al., 2015; Michałowski et al., 2016; Arabsalmani et al., 2018; Michałowski et al., 2018).
The derived molecular gas mass is compared with stellar mass and SFR. We adopt the results of SED fitting ( and SFR yr-1) by T. Hashimoto et al. (in prep.), where they include newly-obtained ALMA photometry in addition to UV–IR data. The molecular gas mass fraction defined as is 0.34, which is comparable to those of –2 MS galaxies with the similar stellar mass (Tacconi et al., 2010, 2013; Sargent et al., 2014; Seko et al., 2016a). The star-formation efficiency (SFR) and the gas depletion timescale (SFR) are estimate to be 1.4 Gyr-1 and 0.71 Gyr, respectively. Figure 4 shows the comparison between molecular gas mass and SFR. Daddi et al. (2010) presented two different star-forming regimes for disk-like normal star-forming galaxies and starburst galaxies in the –SFR (or surface density) plane, which are applied for both local and high- galaxies. The GRB 080207 host galaxy is located in the similar region for –2 MS galaxies and on the sequence of disk-like normal star-forming galaxies.
| SFE | |||||||
| () | ( pc-2) | (Gyr-1) | (Gyr) | (Myr) | () | ||
| (1) | (2) | (3) | (4) | (5) | (6) | (7) | (8) |
| 0.34 | 1.4 | 0.71 | 42 | 560 | |||
| (1) Molecular gas mass derived with (K km s-1 pc2)-1. (2) Molecular gas surface density within the CO half-light radius (). (3) Molecular gas mass fraction (). (4) Star-formation efficiency (SFR). (5) Gas depletion timescale (SFR). (6) Dynamical timescale at the CO half-light radius (). (7) Dust mass derived form the modified blackbody fit. (8) Molecular gas mass to dust mass ratio. | |||||||
4.2 Dust Properties
By using the far-infrared (FIR)–millimeter photometry obtained in this study and literature, we derived the FIR luminosity () and dust mass () following De Breuck et al. (2003) as
| (3) | |||
| (4) |
where is the dust mass absorption coefficient, is the rest-frame frequency, is the dust temperature, is the Planck function, and is the observed flux density. We assume that the absorption coefficient varies as and adopt m2 kg-1 (Dunne et al., 2003). To derive the dust temperature and emissivity index, we fit a modified black body to the photometry at 160 m obtained with Herschel/PACS (Hunt et al., 2014), 480 m and 650 m with ALMA Band 8 and 9 (T. Hashimoto et al. in prep.), and our 2.1 mm with ALMA Band 4. The best-fit values are K and . The dust temperature is comparable to the typical value of MS galaxies at with a similar stellar mass (e.g., Magnelli et al., 2014; Genzel et al., 2015; Schreiber et al., 2018). Hunt et al. (2014) estimated a 1.6 times higher dust temperature of 61.3 K for the host galaxy by fitting the SED with grasil (Silva et al., 1998). A possible cause of the difference is that, in addition to the different approaches, they used only Herschel/PACS data at FIR–millimeter wavelengths while we added new ALMA data points in the Rayleigh-Jeans regime at rest-frame wavelengths of 155, 205, and 680 m. The derived dust temperature of 37 K is lower among the sample of FIR–submillimeter detected GRB host galaxies. Michałowski et al. (2008) studied four submillimeter-detected GRB hosts and derived the dust temperature of –51 K, and Hunt et al. (2014) derived dust temperatures of 17 GRB hosts with Herschel observations, which range from 21 to 132 K with an average temperature of 48 K. The low dust temperature derived in this study is against the hypothesis that GRB host galaxies have warmer dust than in local ULIRGs and SMGs (Priddey et al., 2006; Michałowski et al., 2008; Hunt et al., 2014).
The derived dust mass and FIR luminosity are and (with 30% error from 1 of the map), respectively. SFR is yr-1 derived from SFR (Kennicutt, 1998a) and scaled to Chabrier (2003) IMF. The SFR is consistent with the results of SED fitting by Hashimoto et al. (in prep.). The molecular gas-to-dust mass ratio is , which is comparable to those of MS galaxies with the similar stellar mass and metallicity (Seko et al., 2016a, b).
4.3 Kinematics
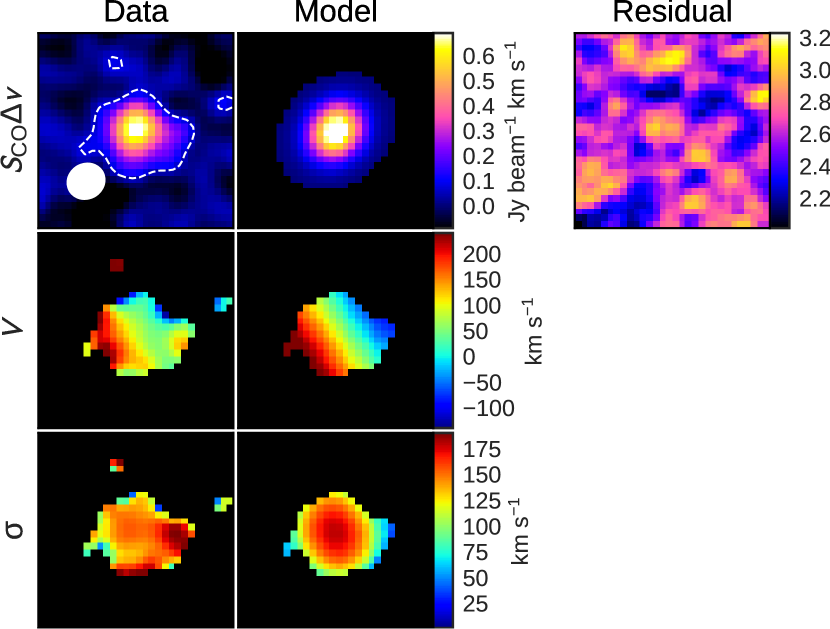
In order to study the kinematics and morphological parameters, we fit the spatially resolved CO(4–3) data with GalPaK3D (Bouché et al., 2015)111http://galpak.irap.omp.eu/, which is a code designed to extract the intrinsic galaxy parameters and kinematics directly from three-dimensional data cubes. The algorithm directly compares data-cubes with a disk parametric model with 10 free parameters: coordinates of galaxy center (), flux, half-light radius (), inclination angle (), position angle (PA), turnover radius of the rotation curve (), de-projected maximum rotation velocity (), and intrinsic velocity dispersion (). The algorithm uses a Markov Chain Monte Carlo (MCMC) approach and the knowledge of three-dimensional spread-functions. We adopt a disk model object with exponential flux profile, arctangent rotation profile, and thick disk dispersion.
The procedure of model fitting converged with a reduced- of 1.12. The output images of the best-fit model are shown in Figure 5 and the best-fit parameters are presented in Table 3. The uncertainty is the 95% confidence interval calculated from the last 60% of the MCMC chain for 15000 iterations. Note that the output parameters have systematic errors of 10% for different imaging parameters (Tadaki et al., 2019). The CO line profile extracted from the best-fit model is presented in Figure 1. The best-fit model is a rotation-dominated disk with kpc, km s-1, and km s-1. The half-light radius is comparable to the deconvolved source size (Section 3.3), and a factor of 1.4 smaller than the optical half-light radius ( or 3.4 kpc) measured in HST/F160W observations (Svensson et al., 2012). The ratio of sizes between molecular gas and stellar component is within the range of –2 star-forming galaxies (Tacconi et al., 2013) measured with the CO(3–2) line. It is possible that the CO(4–3) emission traces denser, compact regions compared to lower lines. The ratio of rotational motion to velocity dispersion of is comparable to those of –1.5 star-forming galaxies measured with CO lines (Tacconi et al., 2013) or star-forming galaxies measured with near-infrared integral field spectroscopy (e.g., Förster Schreiber et al., 2009, 2018; Genzel et al., 2011).
The dynamical mass enclosed at a radius and calculated as is and , respectively. The dynamical mass is comparable to the sum of the molecular gas mass and stellar mass, suggesting that the contribution of dark matter to the enclosed mass is not significant. This is consistent with the results on –2 MS galaxies (Förster Schreiber et al., 2009; Bolatto et al., 2015).
| Parameters | Results |
|---|---|
| (kpc) | |
| (deg) | |
| PA (deg) | |
| (kpc) | |
| (km s-1) | |
| (km s-1) | |
| Notes. - The uncertainty is the 95% confidence interval. | |
4.4 Kennicutt-Schmidt Relation
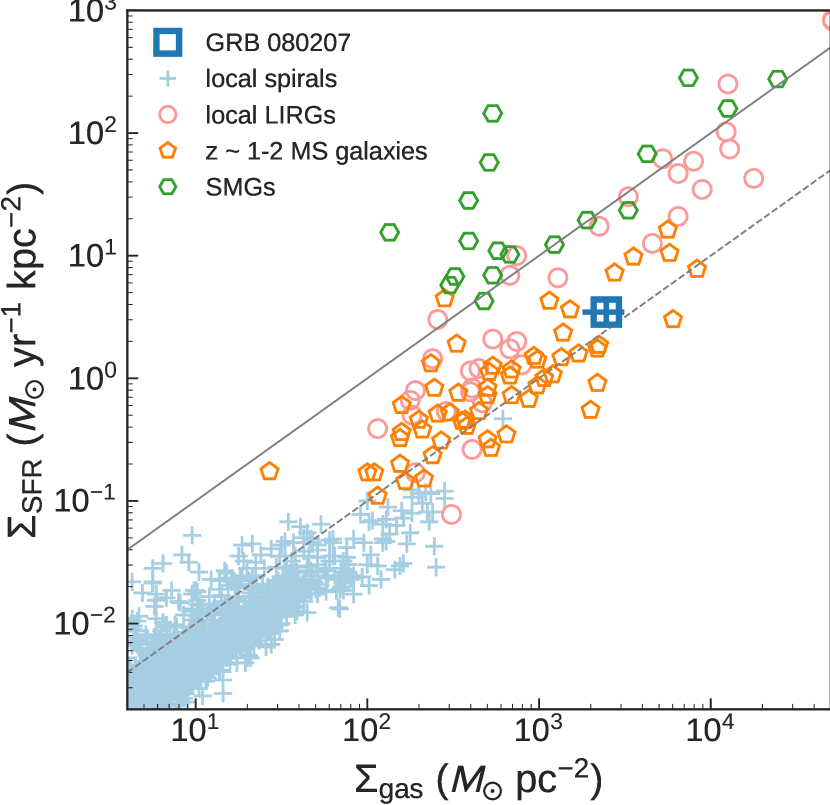
There is a correlation between gas surface density () and SFR surface density () known as the Kennicutt-Schmidt relation (Kennicutt, 1998a; Schmidt, 1959). Spatially-resolving observations of molecular gas are still limited and it is not well examined whether GRB host galaxies follow the the Kennicutt-Schmidt relation or not. Arabsalmani et al. (2018) studied CO-detected GRB host galaxies in the – plane by using the half-light radius of stellar emission for deriving the gas surface density. Our spatially-resolved molecular gas data allow us to directly estimate the molecular gas surface density. By using the CO half-light radius , the surface density of molecular gas and SFR is pc-2 and yr-1 kpc-2, respectively. Figure 6 shows the location of the GRB host in the – plane in comparison with other type of local and high- galaxies in the literature, where molecular gas and SFR surface densities are available. As in the case of – relation, the host galaxy is on the sequence of normal star-forming galaxies, indicating that the star-formation efficiency or gas deletion timescale is comparable to those of normal star-forming galaxies. This is consistent with the finding of Arabsalmani et al. (2018), although they derived the molecular gas mass of the host galaxy from CO(3–2) observations and adopted to estimate .
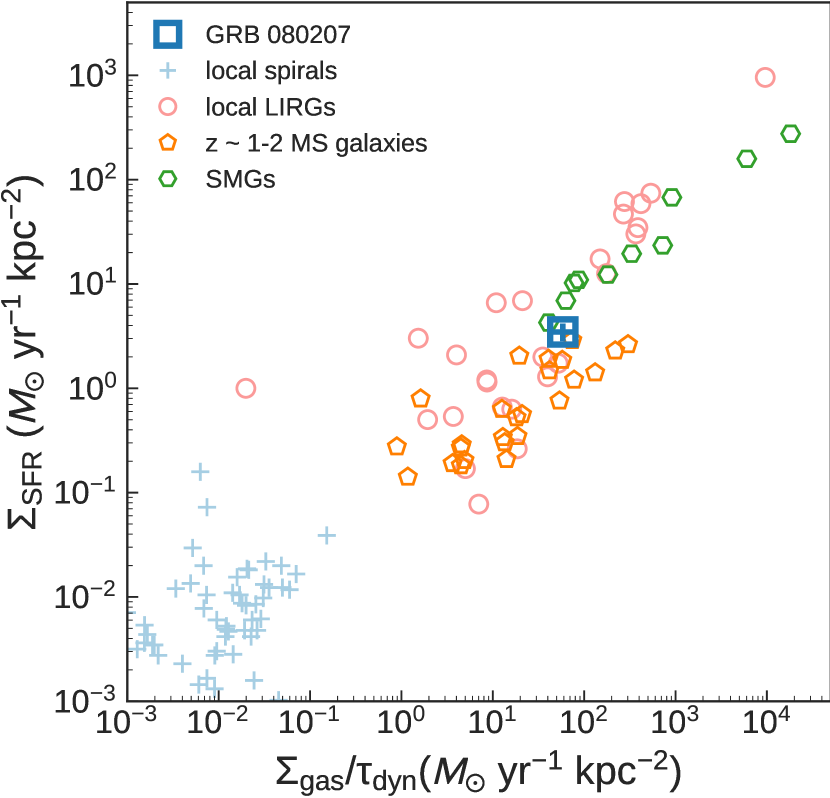
Kennicutt (1998a, b) showed that SFR surface density scales with the ratio of gas surface density to dynamical timescale in local spiral and starburst galaxies, and the relation is found to be valid for high- MS galaxies and SMGs (Daddi et al., 2010; Genzel et al., 2010). The dynamical timescale of the GRB 080207 host galaxy at the CO half-light radius is 42 Myr calculated as . Figure 7 shows that the host galaxy is on the general star-formation law for local and high- galaxies.
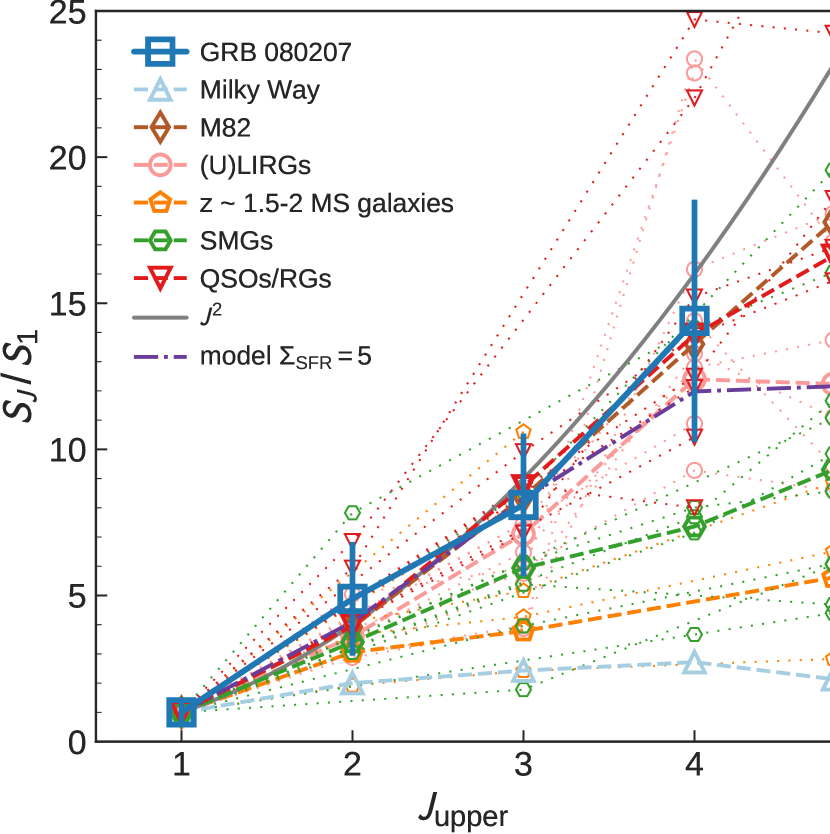
4.5 CO Line Ratios
The ratios of CO line luminosities in GRB hosts galaxies have been unexplored due to the limited number of CO observations and the lack of detections of multiple CO transitions. Since the GRB 080207 host was detected with CO(2–1) and CO(3–2) in Michałowski et al. (2018) and Arabsalmani et al. (2015), the detections of CO(1–0) and CO(4–3) in this study allow us to study the CO excitation condition with the upper level of from 1 to 4. The derived brightness temperature line ratios are summarized in Table 4. The line ratios of the GRB 080207 host show that molecular gas excitation is high and close to unity up to . In Figure 8, we compare the CO SLEDs of the GRB 080207 host galaxy and other type of galaxies. The line ratio of the GRB 080207 host galaxy deviates from Milky Way and is similar to those of local starburst M 82, local (U)LIRGs, and QSOs/radio galaxies, suggesting the presence of dense and warm gas (e.g., Weiss et al., 2007; Carilli & Walter, 2013). While the average SLEDs of the MS galaxies at and SMGs have a subthermal excitation, they show a diverse range of excitation conditions (Dannerbauer et al., 2009; Aravena et al., 2014; Daddi et al., 2015; Bolatto et al., 2015; Bothwell et al., 2013). Bolatto et al. (2015) reported that two MS galaxies, which have a similar stellar mass and SFR to the GRB 080207 host galaxy, have high CO excitation conditions with –1.1, which is comparable to our results. There are many possible drivers for for high excitation conditions. Daddi et al. (2015) found that the ratio of CO(5–4) to lower- CO emission is well correlated with the average intensity of the radiation field and with among local spirals, local ULIRGs, and MS galaxies. This is consistent with the model of Narayanan, & Krumholz (2014). They combined hydrodynamic simulations of disk galaxies and galaxy mergers with molecular line radiative transfer calculations, motivated to examine the origin of a broad range of observed CO SLEDs in local and high-redshift galaxies. They found that CO SLEDs are well correlated with the galaxy-wide SFR surface density, which is attributed to the increase of gas density and temperature. As shown in Figure 8, we find that their model for galaxies with yr-1 kpc-2 agrees with our results.
It might be also possible that the high CO excitation condition is attributed to a strong radiation by an AGN. While no strong evidence for an AGN has been reported, the optical emission-line diagnostic with the Baldwin-Phillips-Terlevich (BPT) diagram (Baldwin et al., 1981) studied in Krühler et al. (2015) shows that the host galaxy is located in a starburst-AGN composite region. The significantly high radio-derived SFR (850 yr-1) derived in Perley & Perley (2013) compared to other methods could be explained by the contribution of an AGN to the observed radio flux. Since peaks in CO SLED for AGNs are –10 (e.g., Meijerink et al., 2006), where high ISM excitation occurs in X-ray dissociation regions, observations of higher CO lines are important to diagnose the presence of an AGN.
| Line | Ratio |
| Notes. - The error is 1. | |
4.6 Implication for GRBs as a tracer of SFR history
There is ongoing debate as to whether GRBs occur in normal star-forming galaxies or occur under particular circumstances, and whether they can be used as an unbiased tool to trace star formation in the universe. It is suggested that GRBs prefer low-metallicity environments with a threshold of 0.3–0.7 (e.g., Woosley & Heger, 2006; Graham, & Fruchter, 2013; Vergani et al., 2015; Perley et al., 2016b; Vergani et al., 2017). The metallicity effect on the GRB rate is modest at , where the mean metallicity decreases, and GRBs can be unbiased tracers of star formation (e.g., Fynbo et al., 2006). In addition to the metallicity effect, the reason for the smaller number of GRBs in massive galaxies (e.g., Perley et al., 2013) can be attributed by dust obscuration. GRBs are usually followed by afterglow, which has been a major probe to identify the host galaxy and to study the interstellar medium. A significant fraction (25–40%; e.g., Fynbo et al., 2009; Greiner et al., 2011) of GRB afterglows is optically dark compared with what is expected from X-ray afterglows, which are know as dark GRBs (Jakobsson et al., 2004; van der Horst et al., 2009), preventing follow-up observations of host galaxies. A possible explanation of the origin of the dark GRBs is dust obscuration along the line of sight to GRBs (e.g., Perley et al., 2009). It has been found that dust-obscured GRB host galaxies are more massive than the those of optically bright GRBs (e.g., Krühler et al., 2011; Perley et al., 2013). Whitaker et al. (2017) found a dependence of the fraction of obscured star formation () on stellar mass out to : 50% of star formation is obscured for galaxies with , and 90% for galaxies with . Therefore, it is natural for dark GRBs to be hosted by relatively massive galaxies. GRB 080207 is identified as a dark GRB, and the host galaxy is a massive and high-metallicity galaxy. We found in this study that the host galaxy shares common properties in terms of molecular gas, such as gas mass fraction, gas-to-dust ratio, location in the –SFR or – relation, and gas kinematics, with normal MS galaxies, which dominate the cosmic star formation activity, suggesting that can GRBs occur in normal star-forming environments at . Currently the sample of GRB host galaxies with CO detection is limited and only one host galaxy is detected at . It is essential to increase the sample size in order to examine the general properties of molecular gas in GRB host galaxies and the availability of GRBs as an unbiased tracer of cosmic SFR density. ALMA and NOEMA are now routinely detecting molecular gas in MS star-forming galaxies at . As discussed in this paper, in order to study CO line ratios and molecular gas excitation conditions in GRB host galaxies, observations of ground state CO transition are also required by using longer-wavelength sensitive facilities such as VLA.
5 Conclusions
We present the results of CO(1–0) and CO(4–3) observations of the GRB 080207 host galaxy at by using VLA and ALMA. The CO(1–0) and CO(4–3) lines are detected, making the host galaxy the first case in GRB host galaxies with more than two CO transitions together with the CO(2–1) and CO(3–2) lines in the literature. The CO(4–3) data is spatially resolved, allowing us to estimate the kinematics and morphological parameters of the host galaxy. We derived physical quantities based on the observations:
By using the CO(1–0) line luminosity and adopting a metallicity-dependent conversion factor of (K km s-1 pc2)-1, we derive a molecular gas mass of . We found that host galaxy is located in the similar region for –2 MS galaxies and on the sequence of normal star-forming galaxies in the –SFR plane. The molecular gas mass fraction is , which is comparable to –2 MS galaxies with the similar stellar mass.
We fit a modified black body to the FRI–millimeter photometry, and derived a dust temperature of K, emissivity index of , and a dust mass of . The molecular gas-to-dust mass ratio of is consistent with MS galaxies with the similar stellar mass and metallicity.
The model fitting to the spatially resolved CO(4–3) cube data shows that the host galaxy is a rotation-dominated disk with a CO half-light radius of kpc and a rotation velocity of km s-1. The ratio of rotational motion to velocity dispersion of is comparable to those of –2 MS galaxies. The dynamical mass is comparable to the sum of the molecular gas mass and stellar mass, suggesting that the contribution of dark matter is not significant.
The surface densities of molecular gas and SFR show that the host galaxy follows the relation of normal star-forming galaxies in the – plane. The CO spectral line energy distribution derived from the four CO transitions is similar to that of starburst galaxies, suggesting a high excitation condition of molecular gas. If we introduce the dynamical timescale, the host galaxy is found to be on the general star-formation law for local and high- galaxies in the – plane.
The CO line ratios show that molecular gas excitation is high and close to unity up to , suggesting the presence of dense and warm gas. The CO SLED is consistent with the model of high .
We found that the host galaxy and normal MS galaxies at similar redshifts share common properties, suggesting that long-duration GRBs can occur in normal star-forming environments at .
References
- Arimoto et al. (1996) Arimoto, N., Sofue, Y., & Tsujimoto, T. 1996, PASJ, 48, 275
- Arabsalmani et al. (2018) Arabsalmani, M., Le Floc’h, E., Dannerbauer, H., et al. 2018, MNRAS, 476, 2332
- Arabsalmani et al. (2015) Arabsalmani, M., Roychowdhury, S., Zwaan, M. A., Kanekar, N., & Michałowski, M. J. 2015, MNRAS, 454, L51
- Aravena et al. (2014) Aravena, M., Hodge, J. A., Wagg, J., et al. 2014, MNRAS, 442, 558
- Baldwin et al. (1981) Baldwin, J. A., Phillips, M. M., & Terlevich, R. 1981, Publications of the Astronomical Society of the Pacific, 93, 5
- Bigiel et al. (2010) Bigiel, F., Leroy, A., Walter, F., et al. 2010, AJ, 140, 1194
- Bolatto et al. (2015) Bolatto, A. D., Warren, S. R., Leroy, A. K., et al. 2015, ApJ, 809, 175
- Bolatto et al. (2013) Bolatto, A. D., Wolfire, M., & Leroy, A. K. 2013, ARA&A, 51, 207
- Bothwell et al. (2010) Bothwell, M. S., Chapman, S. C., Tacconi, L., et al. 2010, MNRAS, 405, 219
- Bothwell et al. (2013) Bothwell, M. S., Smail, I., Chapman, S. C., et al. 2013, MNRAS, 429, 3047
- Bothwell et al. (2014) Bothwell, M. S., Wagg, J., Cicone, C., et al. 2014, MNRAS, 445, 2599
- Bouché et al. (2015) Bouché, N., Carfantan, H., Schroetter, I., et al. 2015, AJ, 150, 92
- Carilli & Walter (2013) Carilli, C. L., & Walter, F. 2013, ARA&A, 51, 105
- Chabrier (2003) Chabrier, G. 2003, PASP, 115, 763
- Cicone et al. (2014) Cicone, C., Maiolino, R., Sturm, E., et al. 2014, A&A, 562, A21
- Daddi et al. (2010) Daddi, E., Elbaz, D., Walter, F., et al. 2010, ApJ, 714, L118
- Daddi et al. (2015) Daddi, E., Dannerbauer, H., Liu, D., et al. 2015, A&A, 577, A46
- Dannerbauer et al. (2009) Dannerbauer, H., Daddi, E., Riechers, D. A., et al. 2009, ApJ, 698, L178
- De Breuck et al. (2003) De Breuck, C., Neri, R., Morganti, R., et al. 2003, A&A, 401, 911
- D’Elia et al. (2014) D’Elia, V., Fynbo, J. P. U., Goldoni, P., et al. 2014, A&A, 564, A38
- Dunne et al. (2003) Dunne, L., Eales, S. A., & Edmunds, M. G. 2003, MNRAS, 341, 589
- Endo et al. (2007) Endo, A., et al. 2007, ApJ, 659, 1431
- Fixsen et al. (1999) Fixsen, D. J., Bennett, C. L., & Mather, J. C. 1999, ApJ, 526, 207
- Förster Schreiber et al. (2009) Förster Schreiber, N. M., Genzel, R., Bouché, N., et al. 2009, ApJ, 706, 1364
- Förster Schreiber et al. (2018) Förster Schreiber, N. M., Renzini, A., Mancini, C., et al. 2018, The Astrophysical Journal Supplement Series, 238, 21
- Friis et al. (2015) Friis, M., De Cia, A., Krühler, T., et al. 2015, MNRAS, 451, 167
- Fynbo et al. (2009) Fynbo, J. P. U., et al. 2009, ApJS, 185, 526
- Fynbo et al. (2006) Fynbo, J. P. U., Starling, R. L. C., Ledoux, C., et al. 2006, A&A, 451, L47
- Gaia Collaboration et al. (2016) Gaia Collaboration, Brown, A. G. A., Vallenari, A., et al. 2016, A&A, 595, A2
- Genzel et al. (2012) Genzel, R., Tacconi, L. J., Combes, F., et al. 2012, ApJ, 746, 69
- Genzel et al. (2010) Genzel, R., Tacconi, L. J., Gracia-Carpio, J., et al. 2010, MNRAS, 407, 2091
- Genzel et al. (2015) Genzel, R., Tacconi, L. J., Lutz, D., et al. 2015, ApJ, 800, 20
- Genzel et al. (2011) Genzel, R., Newman, S., Jones, T., et al. 2011, ApJ, 733, 101
- González-Alfonso et al. (2017) González-Alfonso, E., Fischer, J., Spoon, H. W. W., et al. 2017, ApJ, 836, 11
- Graham, & Fruchter (2013) Graham, J. F., & Fruchter, A. S. 2013, ApJ, 774, 119
- Greiner et al. (2011) Greiner, J., et al. 2011, A&A, 526, A30
- Greiner et al. (2015) Greiner, J., Fox, D. B., Schady, P., et al. 2015, ApJ, 809, 76
- Hatsukade et al. (2007) Hatsukade, B., et al. 2007, PASJ, 59, 67
- Hatsukade et al. (2012) Hatsukade, B., Hashimoto, T., Ohta, K., et al. 2012, ApJ, 748, 108
- Hatsukade et al. (2011) Hatsukade, B., Kohno, K., Endo, A., Nakanishi, K., & Ohta, K. 2011, ApJ, 738, 33
- Hatsukade et al. (2014) Hatsukade, B., Ohta, K., Endo, A., et al. 2014, Nature, 510, 247
- Hildebrand (1983) Hildebrand, R. H. 1983, QJRAS, 24, 267
- Hjorth et al. (2003) Hjorth, J., et al. 2003, Nature, 423, 847
- Hunt et al. (2011) Hunt, L., Palazzi, E., Rossi, A., et al. 2011, ApJ, 736, L36
- Hunt et al. (2014) Hunt, L. K., Palazzi, E., Michałowski, M. J., et al. 2014, A&A, 565, A112
- Jakobsson et al. (2004) Jakobsson, P., Hjorth, J., Fynbo, J. P. U., Watson, D., Pedersen, K., Björnsson, G., & Gorosabel, J. 2004, ApJ, 617, L21
- Japelj et al. (2016) Japelj, J., Vergani, S. D., Salvaterra, R., et al. 2016, A&A, 590, A129
- Kelly et al. (2014) Kelly, P. L., Filippenko, A. V., Modjaz, M., et al. 2014, ApJ, 789, 23
- Kennicutt (1998a) Kennicutt, R. C. 1998a, Annual Review of Astronomy and Astrophysics, 36, 189
- Kennicutt (1998b) Kennicutt, R. C. 1998b, ApJ, 498, 541
- Kennicutt, & Evans (2012) Kennicutt, R. C., & Evans, N. J. 2012, Annual Review of Astronomy and Astrophysics, 50, 531
- Kewley, & Ellison (2008) Kewley, L. J., & Ellison, S. L. 2008, ApJ, 681, 1183
- Kistler et al. (2009) Kistler, M. D., Yüksel, H., Beacom, J. F., Hopkins, A. M., & Wyithe, J. S. B. 2009, ApJ, 705, L104
- Kohno et al. (2005) Kohno, K., et al. 2005, PASJ, 57, 147
- Kroupa (2001) Kroupa, P. 2001, MNRAS, 322, 231
- Krühler et al. (2011) Krühler, T., Greiner, J., Schady, P., et al. 2011, A&A, 534, A108
- Krühler et al. (2013) Krühler, T., Ledoux, C., Fynbo, J. P. U., et al. 2013, A&A, 557, A18
- Krühler et al. (2015) Krühler, T., Malesani, D., Fynbo, J. P. U., et al. 2015, A&A, 581, A125
- Krühler et al. (2012) Krühler, T., Malesani, D., Milvang-Jensen, B., et al. 2012, ApJ, 758, 46
- Le Floc’h et al. (2006) Le Floc’h, E., Charmandaris, V., Forrest, W. J., Mirabel, I. F., Armus, L., & Devost, D. 2006, ApJ, 642, 636
- Magdis et al. (2012) Magdis, G. E., Daddi, E., Béthermin, M., et al. 2012, ApJ, 760, 6
- Magnelli et al. (2014) Magnelli, B., Lutz, D., Saintonge, A., et al. 2014, A&A, 561, A86
- Maiolino et al. (2008) Maiolino, R., Nagao, T., Grazian, A., et al. 2008, A&A, 488, 463
- McMullin et al. (2007) McMullin, J. P., Waters, B., Schiebel, D., Young, W., & Golap, K. 2007, Astronomical Data Analysis Software and Systems XVI, 376, 127
- Meijerink et al. (2006) Meijerink, R., Spaans, M., & Israel, F. P. 2006, ApJ, 650, L103
- Michałowski et al. (2016) Michałowski, M. J., Castro Cerón, J. M., Wardlow, J. L., et al. 2016, A&A, 595, A72
- Michałowski et al. (2015) Michałowski, M. J., Gentile, G., Hjorth, J., et al. 2015, A&A, 582, A78
- Michałowski et al. (2008) Michałowski, M. J., Hjorth, J., Castro Cerón, J. M., & Watson, D. 2008, ApJ, 672, 817
- Michałowski et al. (2010) Michałowski, M. J., Hjorth, J., & Watson, D. 2010, A&A, 514, A67
- Michałowski et al. (2012) Michałowski, M. J., Kamble, A., Hjorth, J., et al. 2012, ApJ, 755, 85
- Michałowski et al. (2018) Michałowski, M. J., Karska, A., Rizzo, J. R., et al. 2018, A&A, 617, A143
- Nagao et al. (2006) Nagao, T., Maiolino, R., & Marconi, A. 2006, A&A, 459, 85
- Narayanan, & Krumholz (2014) Narayanan, D., & Krumholz, M. R. 2014, MNRAS, 442, 1411
- Papadopoulos et al. (2012) Papadopoulos, P. P., van der Werf, P. P., Xilouris, E. M., et al. 2012, MNRAS, 426, 2601
- Perley & Perley (2013) Perley, D. A., & Perley, R. A. 2013, ApJ, 778, 172
- Perley et al. (2009) Perley, D. A., et al. 2009, AJ, 138, 1690
- Perley et al. (2013) Perley, D. A., Levan, A. J., Tanvir, N. R., et al. 2013, ApJ, 778, 128
- Perley et al. (2015) Perley, D. A., Perley, R. A., Hjorth, J., et al. 2015, ApJ, 801, 102
- Perley et al. (2016a) Perley, D. A., Krühler, T., Schulze, S., et al. 2016a, ApJ, 817, 7
- Perley et al. (2016b) Perley, D. A., Tanvir, N. R., Hjorth, J., et al. 2016b, ApJ, 817, 8
- Pettini, & Pagel (2004) Pettini, M., & Pagel, B. E. J. 2004, MNRAS, 348, L59
- Priddey et al. (2006) Priddey, R. S., Tanvir, N. R., Levan, A. J., Fruchter, A. S., Kouveliotou, C., Smith, I. A., & Wijers, R. A. M. J. 2006, MNRAS, 369, 1189
- Prochaska et al. (2009) Prochaska, J. X., Sheffer, Y., Perley, D. A., et al. 2009, ApJ, 691, L27
- Robertson, & Ellis (2012) Robertson, B. E., & Ellis, R. S. 2012, ApJ, 744, 95
- Rossi et al. (2012) Rossi, A., Klose, S., Ferrero, P., et al. 2012, A&A, 545, A77
- Saintonge et al. (2011) Saintonge, A., Kauffmann, G., Kramer, C., et al. 2011, MNRAS, 415, 32
- Saintonge et al. (2017) Saintonge, A., Catinella, B., Tacconi, L. J., et al. 2017, The Astrophysical Journal Supplement Series, 233, 22
- Salpeter (1955) Salpeter, E. E. 1955, ApJ, 121, 161
- Salvaterra et al. (2009) Salvaterra, R., et al. 2009, Nature, 461, 1258
- Sargent et al. (2014) Sargent, M. T., Daddi, E., Béthermin, M., et al. 2014, ApJ, 793, 19
- Schmidt (1959) Schmidt, M. 1959, ApJ, 129, 243
- Schreiber et al. (2018) Schreiber, C., Elbaz, D., Pannella, M., et al. 2018, A&A, 609, A30
- Seko et al. (2016a) Seko, A., Ohta, K., Yabe, K., et al. 2016a, ApJ, 819, 82
- Seko et al. (2016b) Seko, A., Ohta, K., Yabe, K., et al. 2016b, Publications of the Astronomical Society of Japan, 68, 62
- Silva et al. (1998) Silva, L., Granato, G. L., Bressan, A., et al. 1998, ApJ, 509, 103
- Solomon & Vanden Bout (2005) Solomon, P. M., & Vanden Bout, P. A. 2005, ARA&A, 43, 677
- Stanek et al. (2003) Stanek, K. Z., et al. 2003, ApJ, 591, L17
- Stanway et al. (2011) Stanway, E. R., Bremer, M. N., Tanvir, N. R., Levan, A. J., & Davies, L. J. M. 2011, MNRAS, 410, 1496
- Stanway et al. (2015) Stanway, E. R., Levan, A. J., Tanvir, N. R., Wiersema, K., & van der Laan, T. P. R. 2015, ApJ, 798, L7
- Steidel et al. (2014) Steidel, C. C., Rudie, G. C., Strom, A. L., et al. 2014, ApJ, 795, 165
- Svensson et al. (2012) Svensson, K. M., Levan, A. J., Tanvir, N. R., et al. 2012, MNRAS, 421, 25
- Tacconi et al. (2018) Tacconi, L. J., Genzel, R., Saintonge, A., et al. 2018, ApJ, 853, 179
- Tacconi et al. (2010) Tacconi, L. J., Genzel, R., Neri, R., et al. 2010, Nature, 463, 781
- Tacconi et al. (2013) Tacconi, L. J., Neri, R., Genzel, R., et al. 2013, ApJ, 768, 74
- Tadaki et al. (2019) Tadaki, K.-. ichi ., Iono, D., Hatsukade, B., et al. 2019, arXiv e-prints , arXiv:1903.11234
- Tanvir et al. (2009) Tanvir, N. R., et al. 2009, Nature, 461, 1254
- Thöne et al. (2013) Thöne, C. C., Fynbo, J. P. U., Goldoni, P., et al. 2013, MNRAS, 428, 3590
- Totani (1997) Totani, T. 1997, ApJ, 486, L71
- Trenti et al. (2012) Trenti, M., Perna, R., Levesque, E. M., et al. 2012, ApJ, 749, L38
- van der Horst et al. (2009) van der Horst, A. J., Kouveliotou, C., Gehrels, N., Rol, E., Wijers, R. A. M. J., Cannizzo, J. K., Racusin, J., & Burrows, D. N. 2009, ApJ, 699, 1087
- Vergani et al. (2015) Vergani, S. D., Salvaterra, R., Japelj, J., et al. 2015, A&A, 581, A102
- Vergani et al. (2017) Vergani, S. D., Palmerio, J., Salvaterra, R., et al. 2017, A&A, 599, A120
- Weiss et al. (2007) Weiss, A., Downes, D., Walter, F., et al. 2007, From Z-machines to ALMA: (sub)millimeter Spectroscopy of Galaxies, 25
- Whitaker et al. (2017) Whitaker, K. E., Pope, A., Cybulski, R., et al. 2017, ApJ, 850, 208
- Wijers et al. (1998) Wijers, R. A. M. J., Bloom, J. S., Bagla, J. S., & Natarajan, P. 1998, MNRAS, 294, L13
- Wilson (1995) Wilson, C. D. 1995, ApJ, 448, L97
- Wiseman et al. (2017) Wiseman, P., Perley, D. A., Schady, P., et al. 2017, A&A, 607, A107
- Woosley & Heger (2006) Woosley, S. E., & Heger, A. 2006, ApJ, 637, 914
- Wuyts et al. (2014) Wuyts, E., Kurk, J., Förster Schreiber, N. M., et al. 2014, ApJ, 789, L40