Now at: ]University of Oxford, OX1 3RH, UK.
The LUX-ZEPLIN (LZ) Collaboration
Measurement of the Gamma Ray Background in the Davis Cavern at the Sanford Underground Research Facility
Abstract
Deep underground environments are ideal for low background searches due to the attenuation of cosmic rays by passage through the earth. However, they are affected by backgrounds from -rays emitted by 40K and the 238U and 232Th decay chains in the surrounding rock. The LUX-ZEPLIN (LZ) experiment will search for dark matter particle interactions with a liquid xenon TPC located within the Davis campus at the Sanford Underground Research Facility, Lead, South Dakota, at the 4,850-foot level. In order to characterise the cavern background, in-situ -ray measurements were taken with a sodium iodide detector in various locations and with lead shielding. The integral count rates (0–3300 keV) varied from 596 Hz to 1355 Hz for unshielded measurements, corresponding to a total flux from the cavern walls of cm-2s-1. The resulting activity in the walls of the cavern can be characterised as Bq/kg of 40K, Bq/kg of 238U, and Bq/kg of 232Th.
1 Introduction
Direct searches for Weakly Interacting Massive Particles (WIMPs) as candidates for dark matter involve looking for an interaction of a WIMP with an atomic nucleus, a process not yet observed. Recent experiments, utilising xenon as the target in dual-phase noble liquid time projection chambers (TPCs), have led the way in setting ever more stringent limits on WIMP properties Akerib et al. (2017); Cui et al. (2017); Aprile et al. (2018). In order to probe smaller and smaller WIMP-nucleon interaction cross sections, such rare-event searches demand extremely low background event rates in the region of interest. The LUX-ZEPLIN (LZ) experiment, a dark matter experiment presently under construction Mount et al. (2017) at the Sanford Underground Research Facility (SURF), is projected to reach unprecedented sensitivity, excluding spin-independent scattering cross sections above cm2 for a 40 GeV/c2 WIMP Akerib et al. (2018).
LZ will feature a dual-phase xenon TPC containing 7 tonnes of active xenon inside a radiopure titanium cryostat Akerib et al. (2016a). Signals from electron and nuclear recoils induced by -rays, electrons, neutrinos, neutrons, and potentially WIMPs are collected by a total of 494 photomultiplier tubes (PMTs). A two-component veto system rejects any particles scattering in both the TPC and veto detectors and characterises the general radioactive backgrounds for LZ. The veto system consists of an instrumented liquid xenon skin between the TPC and inner cryostat, primarily to detect scattered -rays, and a near-hermetic 17.3 T Gd-loaded liquid scintillator detector system known as the Outer Detector (OD) surrounding the outer cryostat. The main purpose of the OD is to veto neutrons; Gd has an extremely high thermal neutron capture cross section, making neutrons easily detectable via the post-capture -ray cascade. A high neutron detection efficiency in the OD is essential as an approximately 1 MeV neutron characteristic of those born via natural radioactivity can produce a nuclear recoil in the same energy window as a WIMP. Maintaining a low background rate inside the OD from sources external to the detector, such as the -rays from natural radioactivity in the cavern, is essential for its role as a veto. This is due to considerations of the false veto rate and the amount of excluded data, both of which will increase with the rate in the OD.
SURF is located at the former Homestake Gold Mine in Lead, South Dakota. The Davis cavern, the future home of the LZ experiment, is located 4,850 feet (4,300 m.w.e. Lesko (2015)) underground, and was home to LZ’s predecessor LUX, a 250 kg xenon detector which set world leading constraints on WIMP-nucleon scattering cross-sections Akerib et al. (2017, 2016b). At this depth, the cosmic ray flux is reduced by a factor of compared with that at sea level Cherry et al. (1983); Gray et al. (2011); Abgrall et al. (2017); however, when underground a background from intrinsic radioactivity in the cavern rock must be considered. LZ will be housed within a water tank of height 591 cm and radius 381 cm which provides additional shielding from this radioactivity. This water tank previously housed the LUX detector and was instrumented with PMTs to act as a water Cherenkov muon veto Akerib et al. (2013). Further shielding is provided by 6 octagonal plates of 5 cm thickness inlaid in the floor beneath the water tank. This shield has the shape of an inverted pyramid beneath the centre of the water tank, directly below where the xenon target is placed for both LUX and LZ. The tank and the pyramid sit atop a layer of gravel that extends as deep as the pyramid and to the radius of the water tank.
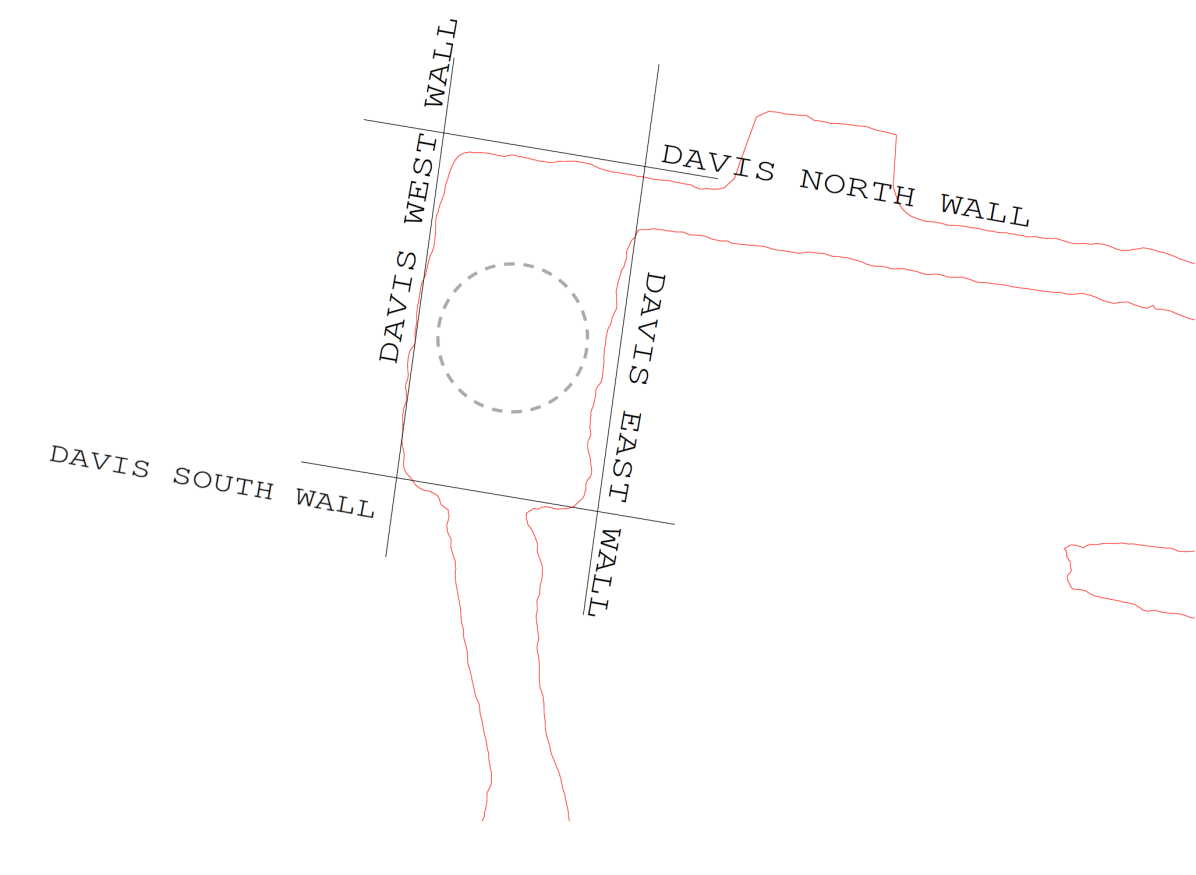


Geological and radiometric surveys of the Homestake mine indicate that most rock at the 4,850 level is of the Homestake formation, a metamorphic rock of relatively low uranium and thorium content Heise (2014). Additionally, rhyolite intrusions in the rock have been identified; rhyolite is an igneous, volcanic, silica-rich rock, with higher natural radioactivity. The relative amount of rhyolite intrusions within the Davis cavern has been estimated; the intrusion is known to pass below the cavern and diagonally across both the north wall and west wall (see Figs. 1–1). A layer of sprayed concrete (shotcrete) of average thickness 12.7 cm lines the walls and ceiling of the cavern, but the thickness is known to vary by a factor of two. The floor consists of 15 cm of low-radioactivity concrete; the exception to this is within two rooms at the north end of the lower level of the cavern, originally used for low background HPGe measurements, known as the counting rooms, where the floor is 30 cm thick. The radiological contents (uranium, thorium, potassium) of rock formations and construction materials - measured with high purity germanium (HPGe) screening at the time of construction - are shown in Table 1; some variation of radioactivity between all material samples is observed and so both the average values and range are given. Table 1 also contains two recent measurements of samples collected at the time of the measurement described in this paper, shown with uncertainties in the bottom two rows.
The 238U and 232Th chains contain a series of and -decays which often lead to -ray emission from excited states of the daughters. For the entire uranium and thorium decay chains, on average 2.2 and 2.7 -rays are expected respectively Kinsey et al. (1996), if secular equilibrium is assumed. Additionally, 40K emits a 1461 keV -ray with a branching ratio of about 10%. Because of the possible high levels of these isotopes in both rock formations and construction materials, characterisation of the -ray background in underground facilities is a standard measurement and has been performed at Gran Sasso National Laboratory Malczewski et al. (2012a), the Modane Underground Laboratory Malczewski et al. (2012b), the Boulby Underground Laboratory Malczewski et al. (2013) and the China Jinping Underground Laboratory Zeng et al. (2014).
| Sample | 40K | 238U | 232Th | |
|---|---|---|---|---|
| (Bq/kg) | (Bq/kg) | (Bq/kg) | ||
| Homestake | avg. | |||
| range | 31–601 | 0.7–9.5 | 1.0–6.5 | |
| Rhyolite | avg | |||
| range | 523–2127 | 99–135 | 7.7–61 | |
| Concrete | avg. | |||
| range | 393–368 | 22–27 | 13–14 | |
| Shotcrete | avg. | |||
| range | 127–393 | 22-28 | 8.1–14 | |
| Shotcrete | - | |||
| Gravel | - |
Previous measurements at SURF of the -flux at depths of 800 ft, 2,000 ft, and 4,550 ft demonstrated that the flux at different locations even at the same depth can vary by up to 30%, depending on the variation in the geological formations Mei et al. (2010). This suggests a direct measurement in the relevant experimental area housing a low-background experiment is required. For the Davis cavern at a depth of 4,850 feet, a measurement with a HPGe detector was taken within a room on the lower level adjacent to the water tank, which prior to this work was the only measurement in the vicinity of the LZ experiment. The -ray flux from this HPGe measurement was stated to be constrained by an upper limit of 2.19 cm-2 s-1 (1000–2700 keV), but substantial uncertainties in both the analysis and calibration for this study renders the results too inaccurate for the purposes of background determination for LZ. This motivated a dedicated measurement to obtain a more precise -ray flux, presented in this paper, to be used in LZ background estimations for WIMP search, outer detector background rates, and other relevant rare event searches such as -decay.
2 Experimental Setup
To measure the -ray flux in the Davis cavern, a 5-inch 5 inch thallium-doped sodium iodide (NaI) scintillating crystal coupled to a photomultiplier tube (PMT) was used, as shown in Fig. 2. The detector, manufactured by Harshaw, was connected to a NOMAD 92X-P portable -spectroscopy unit. The MAESTRO software was used to produce spectra ORTEC .
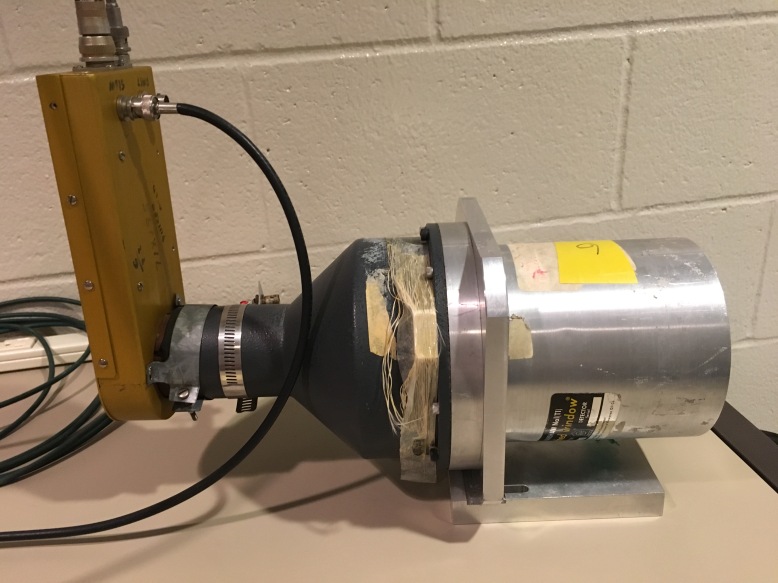
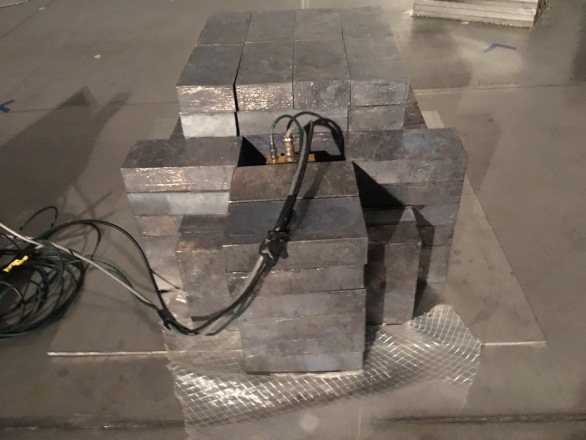
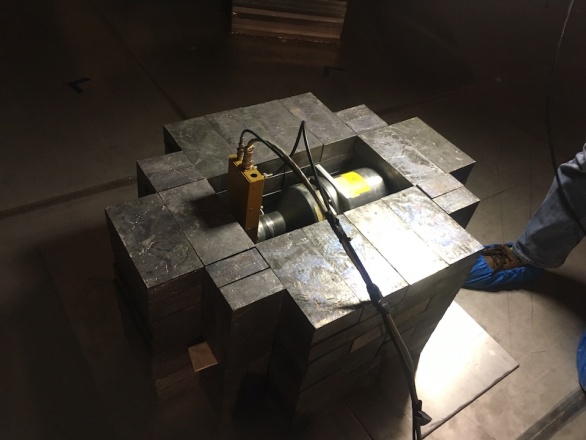
A total of 130 lead bricks measuring inches were used to create -ray shielding for the NaI detector; the lead used was virgin (used direct from ore) and obtained from the Doe Run Mining Company. Three different shielding configurations were used to expose the detector to the -ray flux from different directions within the cavern; the detector was shielded from all sides except below, above, and sideways towards the flat face of the crystal, see Fig. 3. This shielding was constructed to provide at least 8 inches of lead on the sides that were not exposed. Many of the measurements both with and without shielding were taken inside the water tank, which had been emptied of water after removal of the LUX detector.
2.1 Detector Calibration and Efficiency
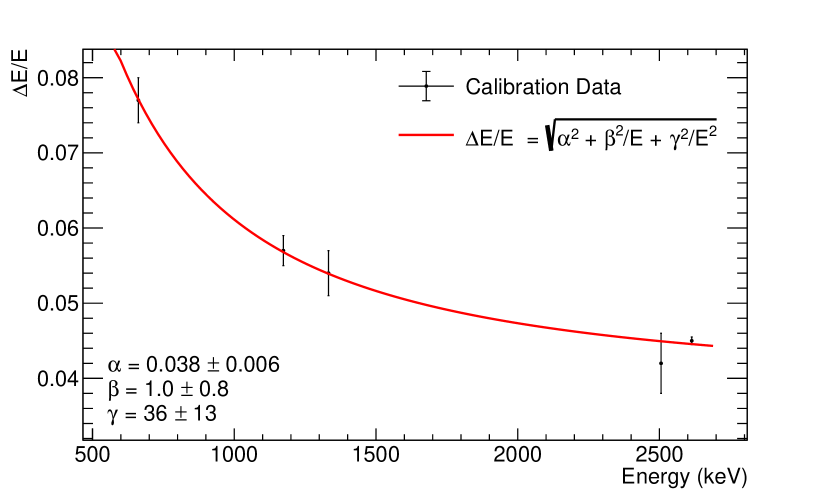
A 60Co source calibration was performed before each measurement. The gain of the NOMAD unit was adjusted so that the sum peak at 2505 keV was visible, ensuring that the dynamic range was adequate to fully contain the 2614 keV peak from 208Tl for the background measurements. 60Co, 137Cs and 228Th calibration sources were used in order to assess detector efficiency and resolution. Each calibration spectrum was fitted with Gaussians and exponential backgrounds in order to determine the location and resolution of the 1173 keV, 1332 keV, and 2505 keV peaks for 60Co, the 662 keV peak for 137Cs and the 2614 keV peak from 208Tl (a product of the 228Th decay chain). All calibrations were performed in the centre of the water tank on the floor; the unshielded measurement in that position was used to subtract the cavern background from the calibration spectra. Using the 60Co data a calibration curve relating the PMT channels to an energy was obtained, and good linearity was observed.
The absolute efficiency of the detector () is a product of the geometric acceptance, which depends on the fraction of solid angle the detector is exposed to, the efficiency describing the conversion of incident -rays in the NaI crystal, and the light collection efficiency of the detector. It can be described as:
| (1) |
where is the number of counts in a photopeak of energy , is the activity of the source, is the live time and is the probability of a single decay producing a of energy E. An over-estimation of was observed in simulation; this is most likely an effect of energy-only simulations, as no light collection effects are included. Simulations of calibration sources at varying distances from the detector were performed and source activities were used to calculate the rates in each simulated photopeak. Comparison to data exhibited an average 10% overestimation of efficiency in simulation with a dependence on distance to the source; a correction factor of was therefore applied to further simulations. The detector was also compared to a standard 3 inch 3 inch NaI(Tl) crystal as is typical in HPGe spectroscopy; this uses the rate in the 1332.5 keV peak in 60Co calibration data taken with the source at a distance of 25 cm from the endcap. Note that a percentage greater than 100% is expected as the detector is 5 inch 5 inch and therefore larger in volume by a factor of 4.6. This factor was determined to be 440% in data, and this was matched by the corrected simulation. Furthermore, the resolution of each peak was calculated from the full width at half maximum () and the energy () of that peak, using:
| (2) |
From these calculations the resolution scale was determined from a fit to the following resolution model An et al. (2017):
| (3) |
where describes the light transmission from the scintillating crystal to the photocathode, is the statistical fluctuations in photon production, attenuation, conversion and amplification, and is the contributions of noise. This resolution model is shown in Fig. 4, and was used to apply a correction to true energy deposits in Monte Carlo simulations of the cavern -flux for direct comparison with the NaI data (see section 3).
2.2 Data Collection
A total of nine background measurements, three unshielded and six shielded, were taken in the Davis cavern as shown in Fig. 5. Locations for unshielded measurements consisted of on the floor in the centre of the water tank (a), a position on the upper deck in the Davis cavern (known as the Upper Davis) approximately 3.4 m from the water tank centre (b), and within the east counting room (c). Of the shielded measurements, three were intended to investigate the attenuation due to the steel pyramid beneath the water tank and so were unshielded only from below; the first at the edge of the tank exposing the detector to the gravel beneath (d), positioned at half the radius of the water tank shielded by 15 cm of the pyramid (e), and at the center shielded by the full 30 cm of the pyramid (f). The final three measurements were with the detector in the centre of the tank; first unshielded from above with the intention of measuring the flux from the ceiling (g), and then the shielding removed from the west facing (h) and east facing sides (i) of the detector at its circular face in order to look for an asymmetry due to the presence of rhyolite.
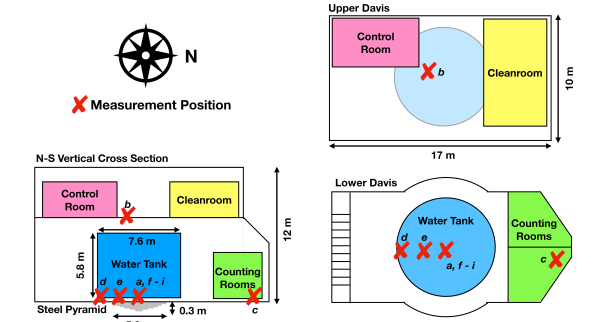
The energy spectra up to 3000 keV for all 9 positions are shown in Fig. 6. Table 2 contains the total integrated rates and rates integrated from 200–3300 keV. The differing live times were dictated by time available underground at SURF, with shielded measurements given priority for overnight data-taking to account for the lower rate. The overall measured rates were highest in the east counting room, followed by the upper level of the Davis cavern and the centre of the water tank. Differences in rate can be attributed to shielding, the proximity to the steel pyramid and differences in the structure and material of the floor.
For the west and east facing measurements, no significant asymmetry was observed in comparison to the differences in activity of the rhyolite versus the Homestake rock and shotcrete. The rhyolite intrusion is thought to be present on the west wall (see Fig. 1), but the rate from this direction was measured to be about 10% less than the east facing measurement in total rate. This suggests a lack of a significant flux of -rays from rhyolite surviving through the shotcrete layer, and the observed difference may be due to unevenness in shotcrete thickness since the shotcrete is approximately 10 times more radioactive than the Homestake formation in 238U and 232Th.
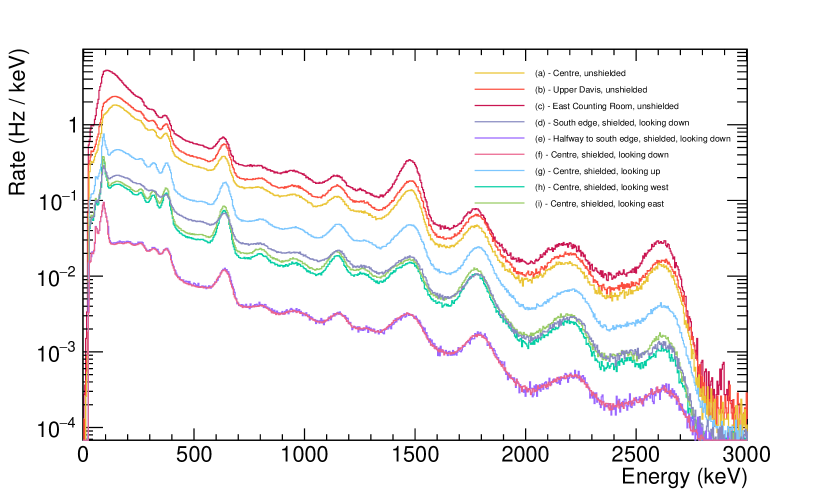
For the measurements facing downwards at the steel shielding pyramid, the total rate measured above 30 cm of steel in the centre was within 3% of the rate in the position at half of the tank radius, where the detector was just shielded by 15 cm of steel, as can be seen by the two lowest rate histograms overlapping in Fig. 6. The measurement at the edge of the tank, with no steel beneath, had a higher rate. As the gravel under the water tank is known to be relatively low in radioactivity, we assume that the rate measured in (e) and (f) - the lowest - correspond to the intrinsic background of the experimental setup, including the NaI detector, as NaI(Tl) crystals are known to have intrinsic 40K, 238U and 232Th contamination Adhikari et al. (2016) and PMTs are also known sources of radioactivity. Contributions from the lead shielding are expected to be subdominant to the detector.
Radon in the cavern air resulting from natural emanation must also be considered; decays from below 222Rn make up a majority of the -rays in the 238U chain. There is no specific mitigation of underground radon levels at SURF, where the total average radon concentration in the Davis Campus is approximately 310 Bq/m3, with a seasonal dependence resulting in a winter low of 150 Bq/m3 Heise (2014). However, during some days of data acquisition, unusually high radon levels were recorded, due to changes in airflow in the mine drift outside of the Davis Campus. The average recorded radon concentration (measured with an AlphaGuard detector) for each dataset is also shown in Table 2, but it should be noted that radon data was taken in an area outside the main entrance to the cavern known as the common corridor, so some uncertainties remain over the air circulation differences between this location and where the -ray data was taken, but the concentrations were significant enough that -rays from radon must be included in this analysis.
| Position of measurement | Label | Start Date | live time | Avg. Radon | Rate (Hz) | Rate (Hz) |
|---|---|---|---|---|---|---|
| (hours) | (Bq/m3) | Total | keV | |||
| Centre of water tank, unshielded | a | 24/10/17 | 4.0 | |||
| Upper Davis, unshielded | b | 26/10/17 | 3.6 | |||
| East Counting Room, unshielded | c | 26/10/17 | 2.1 | |||
| Edge of tank, looking down | d | 16/10/17 | 18.2 | |||
| Halfway to edge of tank, looking down | e | 17/10/17 | 17.9 | |||
| Centre of tank, looking down | f | 19/10/17 | 117.0 | |||
| Centre of tank, looking up | g | 18/10/17 | 20.2 | |||
| Centre of tank, looking west | h | 24/10/17 | 17.3 | |||
| Centre of tank, looking east | i | 25/10/17 | 22.3 |
3 Simulation and Analysis
Simulations of the cavern background are performed using the BACCARAT framework, a Geant4 v.10.03 Agostinelli et al. (2003) package primarily used for LZ background simulations. The model used for electromagnetic processes is G4EMLivermorePhysics; this covers interactions using Livermore models for and electron cross-sections Cullen et al. (1997) Perkins et al. (1991), with a focus on low energy processes, such as Rayleigh and Compton scattering, bremsstrahlung and the photoelectric effect. An event biasing technique is applied to accelerate the simulation; this was developed for LZ background simulations of the cavern due to the low probability of a -ray surviving through the water shield, outer detector and the skin layer of liquid xenon. 238U, 232Th and 40K decays are initiated within a 30 cm thick layer of material surrounding the cavern at the approximate location of the cavern walls. The event biasing technique involves saving -rays on a predefined surface, then propagating them onward with the same momentum in a second simulation with a multiplicative factor in order to increase -ray statistics. This can be done multiple times on surfaces of decreasing size around a target detector volume.
A custom geometry featuring the cavern, pyramid, water tank and detector was created, with options to use each of the lead shielding configurations to expose the NaI detector from either above or below. The cavern and the surrounding rock are modelled as a cuboid with internal space of m; this is larger by design than the dimensions shown in Fig. 5 to conserve the simulated surface area with reality, as the cavern walls are uneven. Radioactive sources were placed within a 30 cm thick ‘shell’ on the inside of this cavern rock. A simulation study done for experiments at the Modane Underground Laboratory have shown that due to attenuation, a 30 cm concrete/shotcrete shell configuration is sufficient to produce more than of the total -ray flux without needing to include emission from the underlying rock Tomasello et al. (2010). This approximation is expected to hold also for the Davis cavern; in places, both the wall and the concrete are 30 cm thick, and the ratio of shotcrete to rock activities is in most cases higher than at the Modane Underground Laboratory, making the rock contribution less prominent. The cavern rock is simulated using the chemical composition of a Homestake sample and is a mixture of oxides, primarily SiO2, Al2O3, FeO and water Mei et al. (2010). Discrepancies between simulation and data for different measurement positions may indicate a deviation from this simplified model, such as a contribution from -rays from the more radioactive rhyolite beneath the shotcrete.
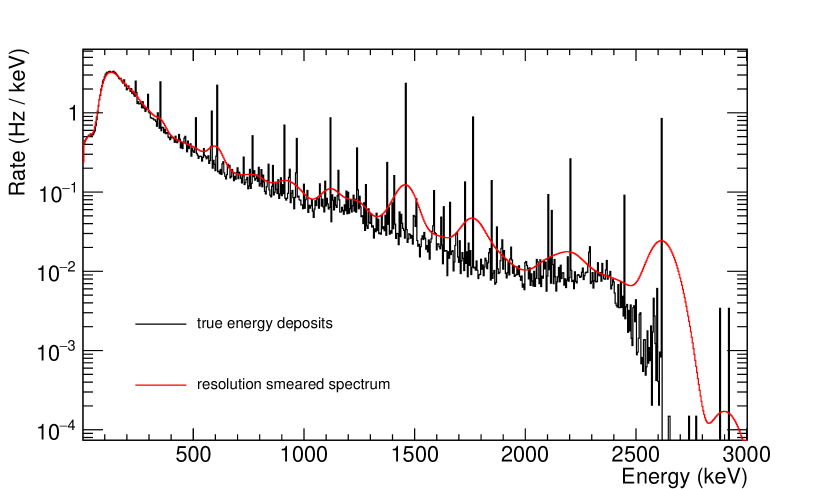
For the 238U and 232Th chains, an event generator developed for LZ background simulations was used. For each event, this generator initiates a chain of decays beginning at 238U or 232Th and ending at the stable 206Pb or 208Pb. Therefore, , and -decays for the entire chain are generated with the correct energies and branching ratios. Secular equilibrium is assumed, as any break in equilibrium is not expected to have an effect on the determined concentration of radioactive contaminants, since the high-energy and high-intensity -lines measured in this analysis are all from from the late sub-chains. Energy deposits by conversion of -rays inside in the NaI crystal were recorded and then smeared by a Gaussian function using parameters from the fit of Eq. 3 to calibration data shown in Fig. 4. This was done separately for 40K, 238U and 232Th. Fig. 7 shows an example of a simulated energy spectrum summed over 40K, 238U and 232Th in true energy deposits before and after smearing.
Additionally, due the high levels of radon present at the time of the measurements, the 222Rn decay chain was simulated within the cavern air and inside the water tank and the rates normalised using the measured concentrations.
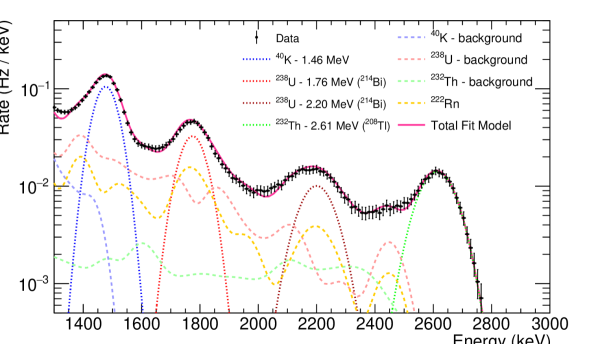
For use in future LZ simulations, the simulated activities of isotopes within the shell in Bq/kg are required to reproduce the measured rate in the NaI data. Since the Compton background in the simulation is unlikely to be accurate due to the lack of many features of the real cavern and objects within it in the simulation, the analysis focuses on -lines with energies of 1400 keV and above where the Compton background is less dominant. The simplest technique is to fit Gaussians for the four most prominent lines at 1461 keV (40K, BR: 10.66%) ), 1764 keV (214Bi, BR: 15.30%) , 2204 keV (214Bi, BR: 4.92%) and 2614 keV (208Tl, BR: 99.75%). Choosing to focus on the photopeaks selects predominantly -rays that have been produced near the surface of the cavern walls, as they have travelled to the detector without any Compton scatters.
The background shape was difficult to model, as it contains Compton scatters from -rays of all energies and other peaks from the uranium and thorium chains. A background probability distribution function (PDF) was created from the simulated spectra with the most prominent lines removed, and signal PDFs were produced from Gaussian functions with widths constrained within error bars obtained from the resolution function shown in Fig. 4. Several constraints were placed on the fit; the peak to continuum ratio was constrained to float within 20% of the simulated value for each contribution, the branching ratio for the two 214Bi lines was fixed, and the total rate from radon was allowed to float with a 20% uncertainty due the location of the radon measurement. An example of the fit to the unshielded data taken in the centre of the water tank is shown in Fig. 8. The energy region below 1300 keV is not shown; some non-linearity of the channel to energy calibration and the lack of resolution measurements below 662 keV for smearing of the simulation leads to poorer agreement.
For each of the 1461, 1764 and 2614 keV peaks (denoted by the subscript for isotope) in each measurement (denoted by the subscript ), a corresponding activity was determined using the comparison to the simulated rate in each peak:
| (4) |
where is the rate in each signal peak in data determined by the Gaussian fit, is an internal rate calculated from the average of measurements (e) and (f) - these were shielded by both lead and the steel pyramid so are subtracted to account for the intrinsic background of the set up, is the aforementioned efficiency correction determined from calibration, and the rate in the simulated peak, is calculated using:
| (5) |
where is the raw number of counts in a given peak for isotope and measurement position , is the total number of initial events simulated, is the event biasing multiplicative factor for measurement , and is the mass of the simulated shell. This is equivalent to simulating 1 Bq/kg for each isotope and determining the necessary scale factors to match data.
4 Results and Discussion
Table 3 contains the fit results for each peak in both rate, and activity . There are large variations in the activities determined for each position; this is a result of several unknown factors. Firstly, the radon concentration within the cavern, whilst allowed to float within 20% of the measurement in a separate area of the Davis campus, produced a very similar spectrum to the uranium from the cavern walls, since most -rays are emitted from the late chain decays after 222Rn. Due to a lack of detailed information about airflow around the Davis campus at this time and the unusual fluctuations in radon concentration, however, this uncertainty is expected to account for the large variation in 238U activities.
| Position of measurement | Label | 40K - 1461 keV | 238U - 1764 keV | 232 Th - 2614 keV | |||
|---|---|---|---|---|---|---|---|
| Rate | Rate | Rate | |||||
| (Hz) | (Bq/kg) | (Hz) | (Bq/kg) | (Hz) | (Bq/kg) | ||
| Centre of water tank, unshielded | a | ||||||
| Upper Davis, unshielded | b | ||||||
| East Counting Room, unshielded | c | ||||||
| Edge of tank, looking down | d | ||||||
| Halfway to edge of tank, looking down | e | - | - | - | |||
| Centre looking down | f | - | - | - | |||
| Centre of tank, looking up | g | ||||||
| Averaged activities | - | - | - | - | |||
Furthermore, the simulation uses a simplified cavern geometry lacking many features of the cavern, such as steel grating, the walls of the counting rooms and the control room, which may affect the peak to continuum ratios. Finally, a variation in activities for different measurements may indicate some non-uniformity in the concentrations of each isotope spatially within the cavern walls, although not high enough to suggest the presence of rhyolite. A range of activities were measured for each isotope in Table 1, and depending on the source of the shotcrete material, the values of these may have a spatial dependence.
The treatment of each measurement as an independent observation of the same flux within the cavern results in average activities of Bq/kg of 40K, Bq/kg of 238U and Bq/kg of 232Th. The total measured -ray flux above 0 keV is cm-2 s-1 and for energies exceeding 1000 keV is cm-2 s-1, as show in Table 4. This is consistent with the upper limit of 2.19 cm-2s-1 above 1000 keV in Ref. Thomas (2014). An additional flux of cm-2 s-1 can be expected from the yearly average radon activity of 310 Bq/m3 in normal ventilation conditions. Normalising simulated rates in each peak with these average activities gives good agreement across all measurements and is considered sufficient to estimate background rates for the LZ experiment. If necessary, this flux can be scaled with the radon levels measured at SURF, if more large excursions are observed.
A quick cross-check between simulation and data was performed using the prominent 609 keV 214Bi line (BR: 45.5%). Due to the non-linearity in energy calibration, this appeared at 635 keV in the data, but the rate within the peak could be compared to a simulation normalised using the averaged activities and constrained radon rate. For example, in position a, the rate within the 609 keV peak was measured to be Hz, whilst simulation produced Hz. Furthermore, this is consistent with the relative branching fraction ratio of 609 keV to 1764 keV of 2.97, as the total (combined 238U in the walls and 220Rn in air) rate within the 1764 keV peak was Hz.
| Energy | Flux |
|---|---|
| (keV) | ( cm-2 s-1) |
| 0–1000 | |
| 1000–2000 | |
| Total |
Shotcrete undergoing HPGe screening contained 40K, 238U, 232Th levels of 272 Bq/kg, 23 Bq/kg and 12 Bq/kg respectively for averages of samples during construction, and the more recent sample contained Bq/kg, Bq/kg, Bq/kg (see Table 1), showing agreement within uncertainties with the results of this analysis. This suggests the dominant contribution to the -ray flux in the Davis cavern is the shotcrete layer, with no measurable excess or directionality due to rhyolite.
5 Comparison with the LS Screener and Implications for LZ
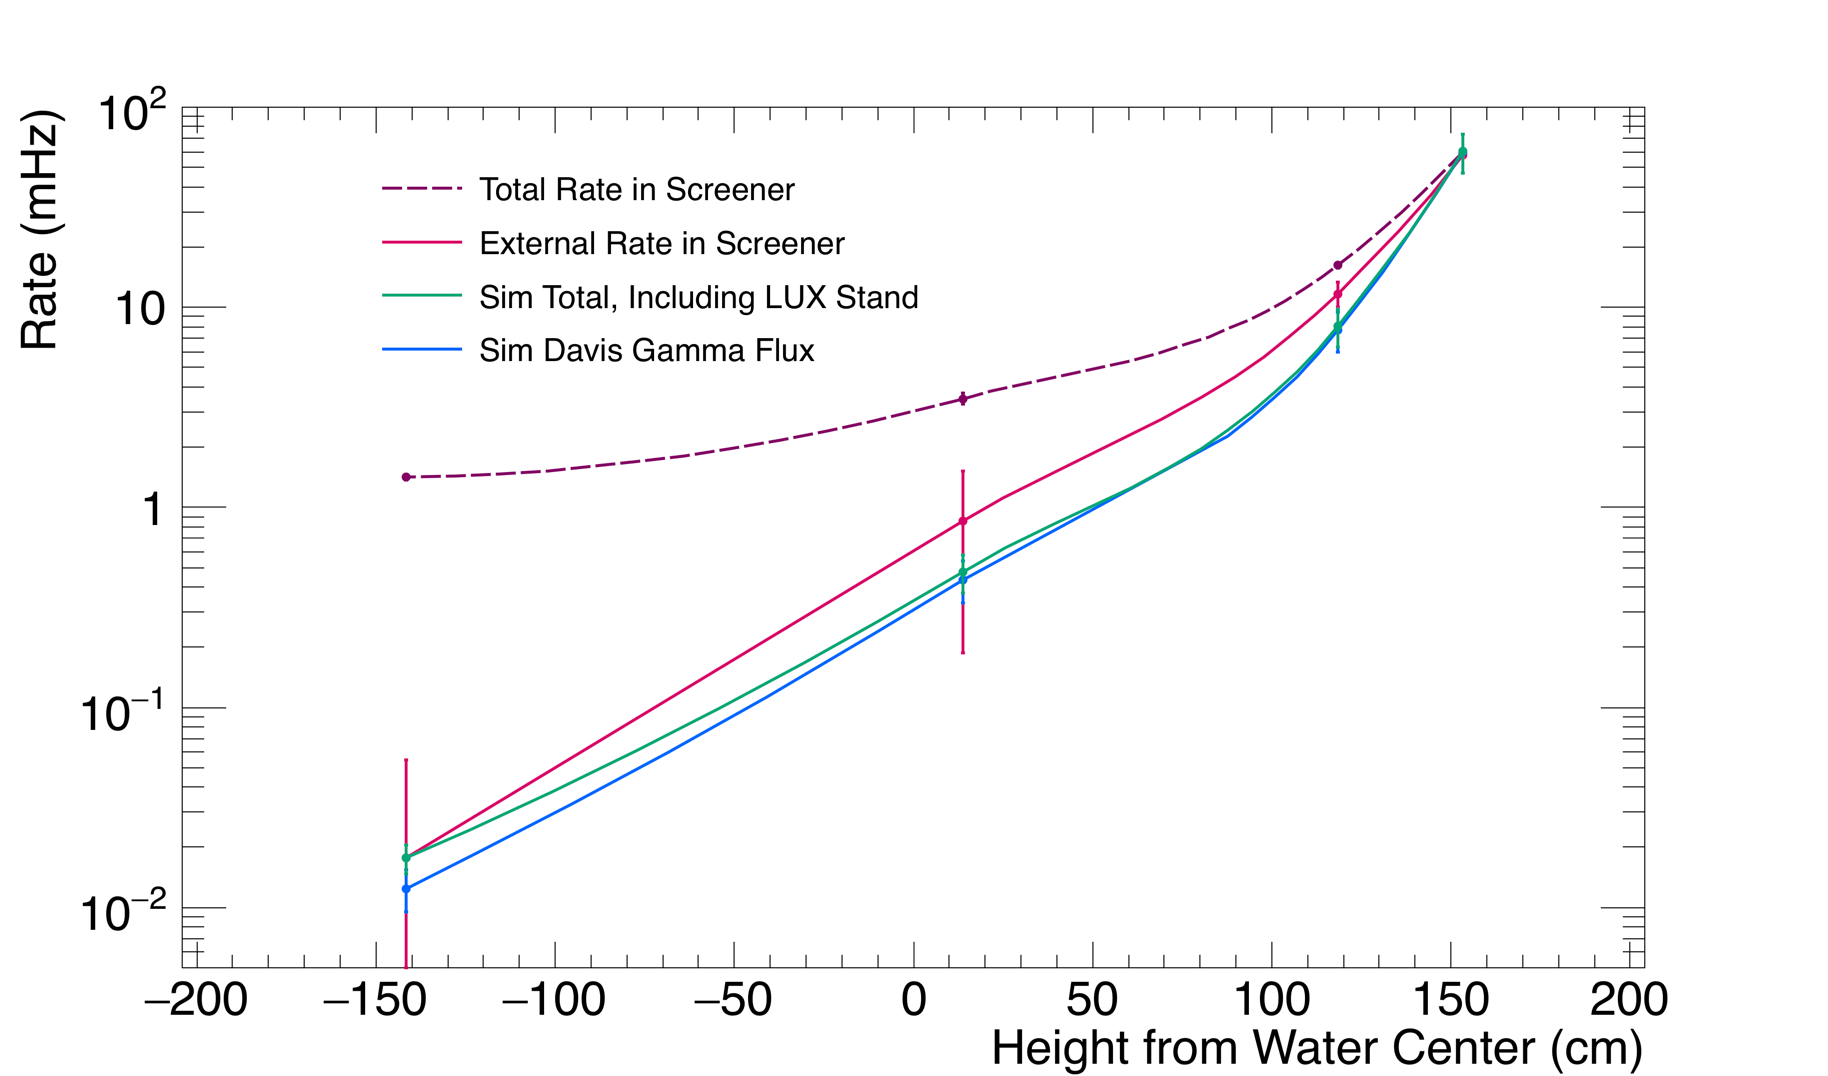
A cross-check of these results was performed through simulation of the LS Screener detector, described in Ref. Haselschwardt et al. (2019), which took data at four positions in within the water tank. The -ray contribution to the rate in the LS Screener from both the cavern and a steel stand originally used to support the LUX detector was simulated within the BACCARAT simulation framework using the event biasing technique. Due to the attenuation of cavern -rays by the water in the tank, initial simulated effective decays (including multiplicative factors) totalled per isotope, and two event biasing surfaces were used to obtain sufficient statistics within the detector. These simulation results were combined with the internal rate of the LS Screener measured in the position best shielded from external -rays ( cm below the centre of the tank), see Fig. 9. In the position most sensitive to the cavern flux at the top of the water tank, the rate above 1300 keV predicted by simulation using the activities determined in this paper was mHz, consistent with with the observed rate of mHz.
The LZ Outer Detector is designed to operate with a veto threshold of 200 keV; above this, the integrated rate expected from the cavern using the results of this analysis is Hz. Combining this with the prediction for internal rate from LS contaminants in Ref. Haselschwardt et al. (2019), totalling Hz, and less than 12 Hz from simulation of radioactivity from LZ components (see Ref. Akerib et al. (2018); an upper limit is given due to the use of upper limits in screening results for materials dominant to this rate), leads to a total rate in the LZ OD of Hz, significantly below the 100 Hz needed to maintain less than 5% impact on LZ live time. Furthermore, these results and the simulation model developed for this and other related studies has been used to inform the background model for a 136Xe -decay search in LZ, particularly influenced by the high energy -rays from the U and Th chains due to the Q-value of 2458 keV.
6 Conclusion
The -ray flux inside the Davis cavern at SURF has been measured using a sodium iodide detector, finding the corresponding radioactive contamination levels to be Bq/kg of 40K, Bq/kg of 238U, and Bq/kg of 232Th - consistent with shotcrete material used to coat the cavern walls. Radon in cavern air was found to produce a significant contribution to the measured rate, and there is no conclusive evidence for a significant or asymmetric flux from the high radioactivity rhyolite intrusion within the cavern. These results can be used to estimate the background contribution from the Davis cavern for the LZ dark matter experiment.
Acknowledgements
We would like to thank Keenan Thomas, now at Lawrence Livermore National Laboratory (LLNL), for his work on the HPGe measurements in the Davis Cavern. Additionally, we wish to thank the staff at SURF who helped with this measurement; in particular, those who were involved in tracking down a inch floppy disk so that this data could actually leave the Davis Cavern! We are also grateful to the manufacturers of floppy disk-to-USB adaptors, making it possible (albeit through a further adaptor) to remove this data from the disk and analyse it.
This work was partially supported by the U.S. Department of Energy (DOE) Office of Science under contract number DE-AC02-05CH11231 and under grant number DE-SC0019066; by the U.S. National Science Foundation (NSF); by the U.K. Science & Technology Facilities Council under award numbers, ST/M003655/1, ST/M003981/1, ST/M003744/1, ST/M003639/1, ST/M003604/1, and ST/M003469/1; and by the Portuguese Foundation for Science and Technology (FCT) under award numbers CERN/FP/123610/2011 and PTDC/FISNUC/1525/2014; and by the Institute for Basic Science, Korea (budget numbers IBS-R016-D1, and IBS-R016-S1). University College London and Lawrence Berkeley National Laboratory thank the U.K. Royal Society for travel funds under the International Exchange Scheme (IE141517). We acknowledge additional support from the Boulby Underground Laboratory in the U.K.; the University of Wisconsin for grant UW PRJ82AJ; and the GridPP Collaboration, in particular at Imperial College London. This work was partially enabled by the University College London Cosmoparticle Initiative. Futhermore, this research used resources of the National Energy Research Scientific Computing Center, a DOE Office of Science User Facility supported by the Office of Science of the U.S. Department of Energy under Contract No. DE-AC02-05CH11231. We acknowledge many types of support provided to us by the South Dakota Science and Technology Authority (SDSTA), which developed the Sanford Underground Research Facility (SURF) with an important philanthropic donation from T. Denny Sanford as well as support from the State of South Dakota. SURF is operated by the SDSTA under contract to the Fermi National Accelerator Laboratory for the DOE, Office of Science. The University of Edinburgh is a charitable body, registered in Scotland, with the registration number SC005336.
References
- Akerib et al. (2017) D. S. Akerib et al. (LUX), Phys. Rev. Lett. 118, 021303 (2017), arXiv:1608.07648 [astro-ph.CO].
- Cui et al. (2017) X. Cui et al. (PandaX), Phys. Rev. Lett. 119, 181302 (2017).
- Aprile et al. (2018) E. Aprile et al. (XENON1T), “Dark Matter Search Results from a One TonneYear Exposure of XENON1T,” (2018), arXiv:1805.12562 [astro-ph].
- Mount et al. (2017) B. J. Mount et al. (LZ), (2017), Technical Design Report; LBNL-1007256, FERMILAB-TM-2653-AE-E-PPD, arXiv:1703.09144 [physics.ins-det].
- Akerib et al. (2018) D. Akerib et al. (LZ), (2018), arXiv:1802.06039 [astro-ph].
- Akerib et al. (2016a) D. Akerib et al. (LZ), Astropart. Phys. 96, 1 (2016a).
- Lesko (2015) K. T. Lesko, Proceedings, 13th International Conference on Topics in Astroparticle and Underground Physics (TAUP 2013): Asilomar, California, September 8-13, 2013, Phys. Procedia 61, 542 (2015).
- Akerib et al. (2016b) D. S. Akerib et al. (LUX), Phys. Rev. Lett. 116, 161302 (2016b), arXiv:1602.03489 [hep-ex].
- Cherry et al. (1983) M. L. Cherry, M. Deakyne, K. Lande, C. K. Lee, R. I. Steinberg, B. T. Cleveland, and E. J. Fenyves, Phys. Rev. D27, 1444 (1983).
- Gray et al. (2011) F. E. Gray, C. Ruybal, J. Totushek, D.-M. Mei, K. Thomas, and C. Zhang, Nucl. Instrum. Meth. A638, 63 (2011), arXiv:1007.1921 [nucl-ex].
- Abgrall et al. (2017) N. Abgrall et al. (Majorana), Astropart. Phys 93 (2017), 1602.07742.
- Akerib et al. (2013) D. S. Akerib et al. (LUX), Nucl. Instrum. Meth. A704, 111 (2013), arXiv:1211.3788 [physics.ins-det].
- Hart (2010) K. Hart, private communication (2010).
- Heise (2014) J. Heise, in Proceedings of the Workshop on Germanium-Based Detectors and Technology (2014) The Sanford Underground Research Facility at Homestake.
- Kinsey et al. (1996) R. R. Kinsey et al., 9th International Symposium of Capture Gamma-Ray Spectroscopy and Related Topics, Budapest, Hungary (1996) Data extracted from the NUDAT database, version 2.7, 2018.
- Malczewski et al. (2012a) D. Malczewski, J. Kisiel, and J. Dorda, J. Radioanal Nucl Chem 295, 751 (2012a).
- Malczewski et al. (2012b) D. Malczewski, J. Kisiel, and J. Dorda, J. Radioanal Nucl Chem 292, 751 (2012b).
- Malczewski et al. (2013) D. Malczewski, J. Kisiel, and J. Dorda, J. Radioanal Nucl Chem 298, 1483 (2013).
- Zeng et al. (2014) Z. Zeng et al., J. Radioanal Nucl Chem 301, 443 (2014).
- Smith (2007) A. Smith, Homestake (DUSEL) samples — results of radiometric analyses at LBNL, Tech. Rep. (Lawrence Berkeley National Laboratory (LBNL), 1 Cyclotron Road, Berkeley, CA 94720-8099, USA, 2007).
- Mei et al. (2010) D.-M. Mei, C. Zhang, K. Thomas, and F. Gray, Astropart. Phys. 34, 33 (2010), arXiv:0912.0211 [nucl-ex].
- (22) ORTEC, “MAESTRO Multichannel Analyzer Emulation,” https://www.ortec-online.com/products/application-software/maestro-mca.
- An et al. (2017) F. P. An et al. (Daya Bay), Phys. Rev. D. 95, 072006 (2017).
- Adhikari et al. (2016) Adhikari et al., Eur. Phys. J. C76, 185 (2016).
- Agostinelli et al. (2003) S. Agostinelli et al. (GEANT4), Nucl. Instrum. Meth. A506, 250 (2003).
- Cullen et al. (1997) D. E. Cullen, J. H. Hubbell, and L. Kissel, EPDL97: the evaluated photo data library ‘97 version, Tech. Rep. (1997).
- Perkins et al. (1991) S. T. Perkins, C. U. S. Cullen, D. E. (Lawrence Livermore National Lab., S. M. N. I. o. S. Seltzer, and M. U. S. C. f. R. R. Technology (NML), Gaithersburg, Tables and graphs of electron-interaction cross sections from 10 eV to 100 GeV derived from the LLNL Evaluated Electron Data Library (EEDL), Z = 1–100, Tech. Rep. (1991).
- Tomasello et al. (2010) V. Tomasello, M. Robinson, and V. A. Kudryavtsev, Astropart. Phys. 34, 70 (2010).
- Thomas (2014) K. J. Thomas (LZ), An Estimate of the Gamma Flux in the East Counting Room of the Davis Cavern, Tech. Rep. (Lawrence Berkeley National Laboratory (LBNL), 1 Cyclotron Road, Berkeley, CA 94720-8099, USA, 2014).
- Haselschwardt et al. (2019) S. Haselschwardt, S. Shaw, H. Nelson, M. Witherell, M. Yeh, K. Lesko, A. Cole, S. Kyre, and D. White, Nucl. Instrum. Meth. A937, 148 (2019).